
Starch as the Flame Retardant for Electrolytes in Lithium-Ion Cells


Abstract
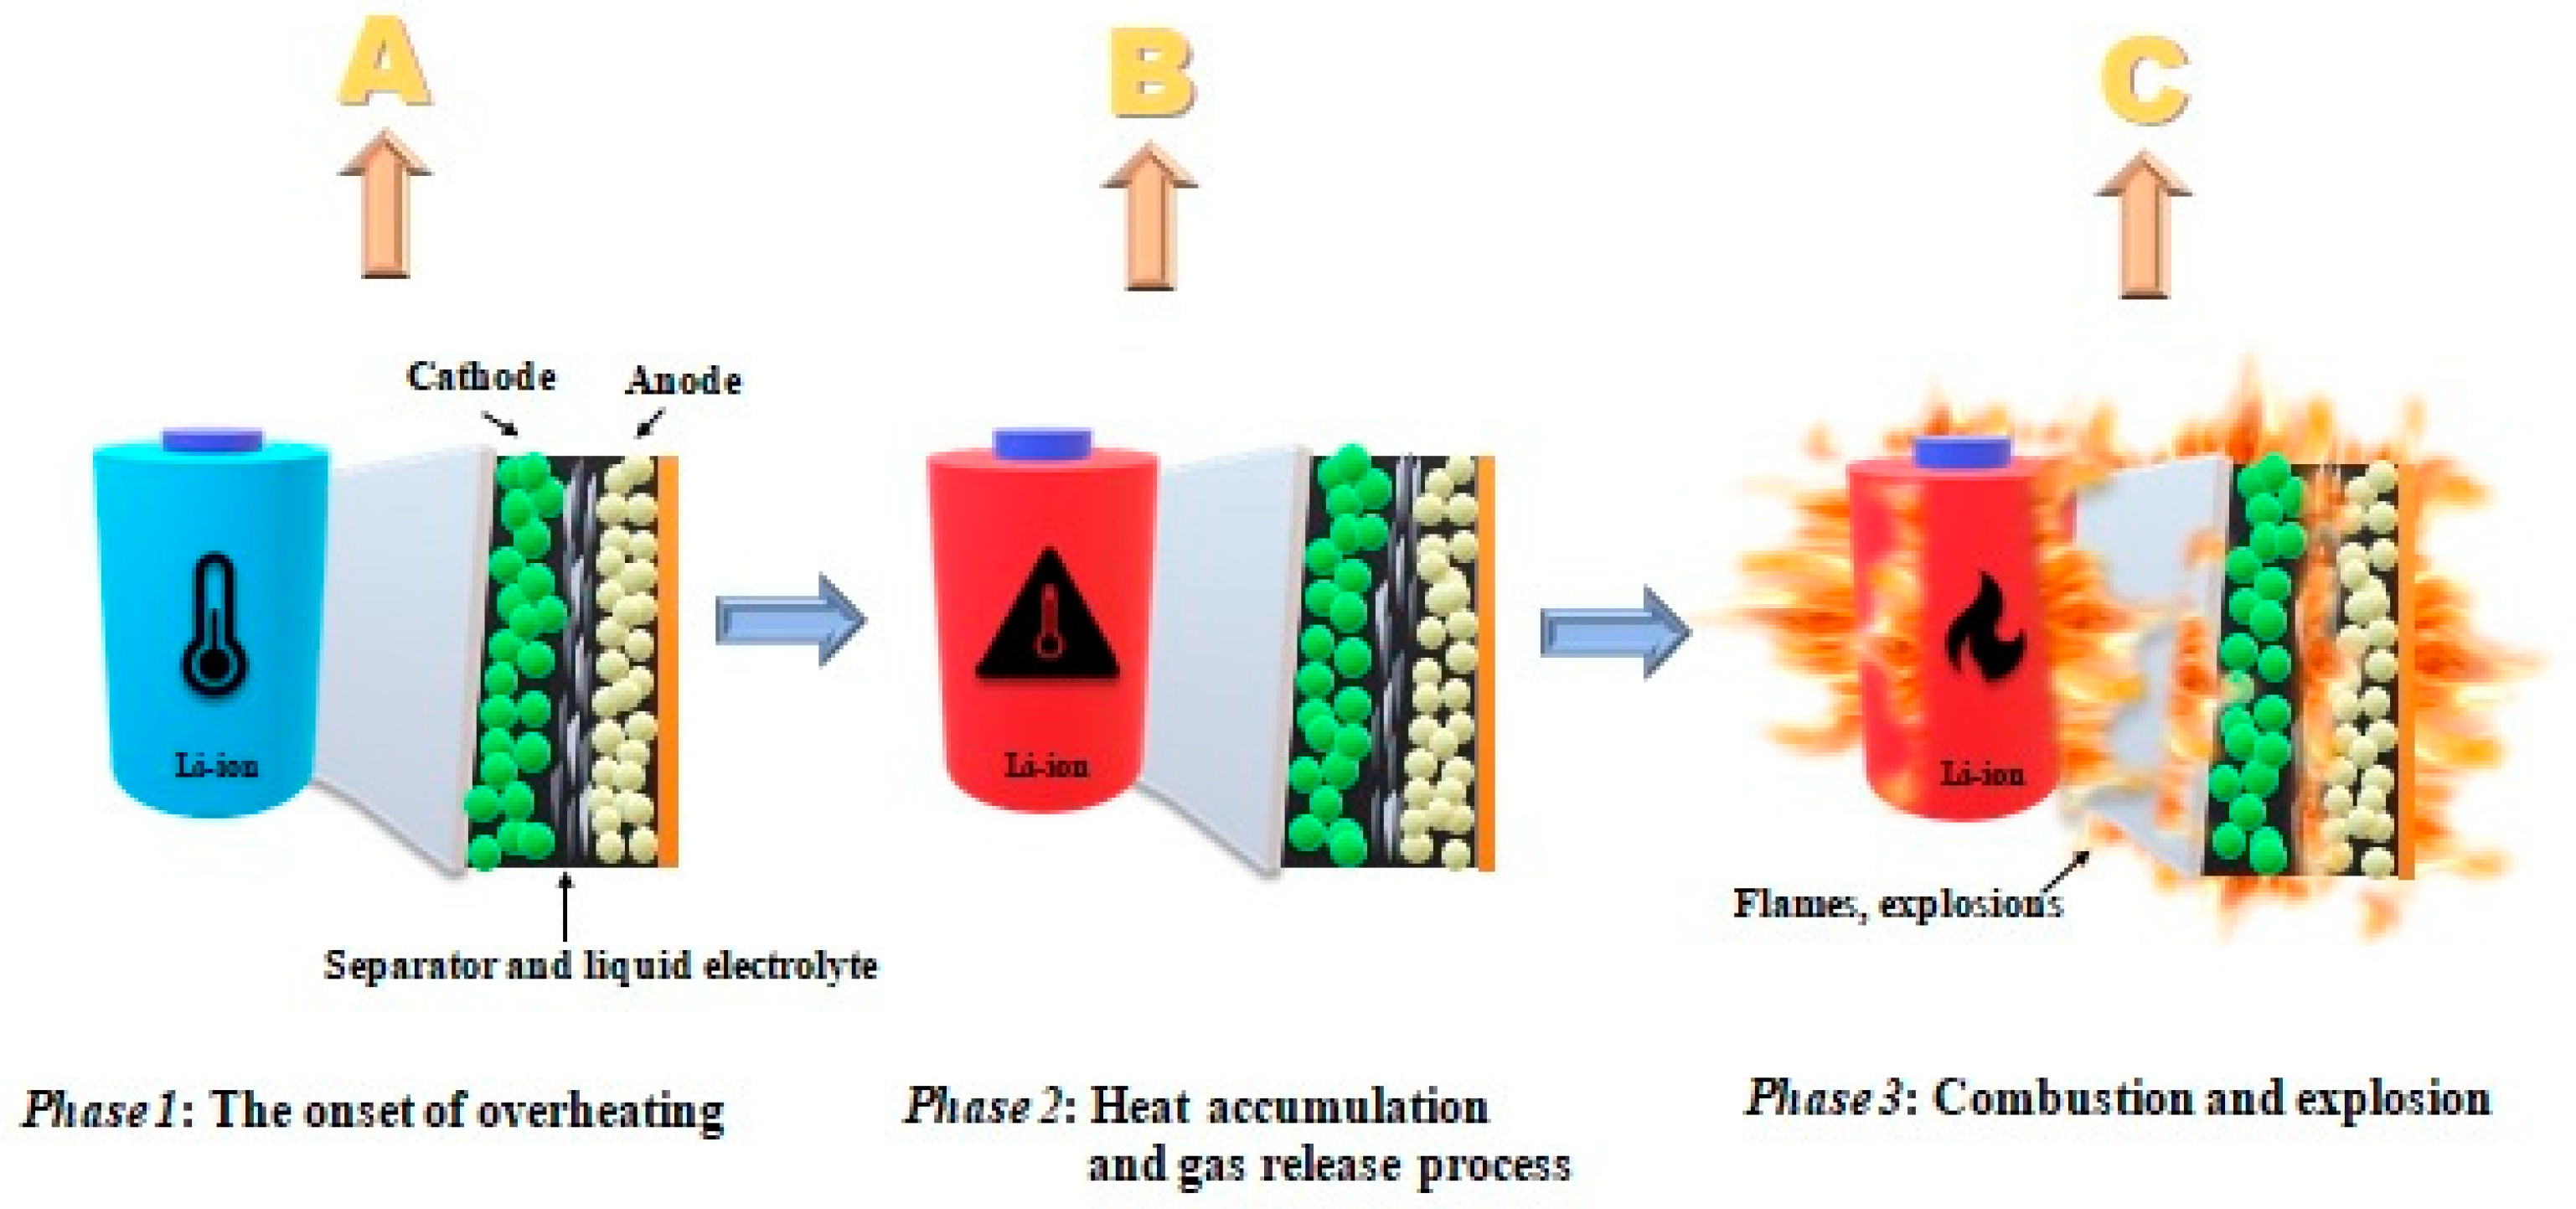
1. Introduction
- (a)
- Decomposition of solid electrolyte (SEI)—components may decompose in exothermic conditions >90 °C—for thermally unstable components;
- (b)
- In the subsequent reaction, during the decomposition of the SEI layer, the release of highly flammable hydrocarbon gases takes place;
- (c)
- Above >~130 °C, the separator (which melts and leads to a short circuit) is destroyed;
- (d)
- At the very end, the cathode decomposes.
2. Materials and Methods
2.1. Matreials
2.2. Viscosity
2.2.1. Self-Extinguishing Time (SET) Method
2.2.2. Flash Point (FP) Method
2.2.3. Conductivity Measurements in Two-Electrode System
2.2.4. Electrochemical Examination
3. Results and Discussion
3.1. Viscosity Test
3.1.1. Mathematical Model of the Kinetic and Thermodynamic Determination of Fluid Flow
3.1.2. Kinetic and Thermodynamic Parameters According to Viscosity Test
3.2. Flammability Tests
3.2.1. SET Test
3.2.2. Flash Point (FP)
3.3. Conductivity Measurement
3.4. Electrochemical Characteristics
3.5. EIS of the Half-Cell
4. Conclusions
Author Contributions
Funding
Institutional Review Board Statement
Informed Consent Statement
Data Availability Statement
Acknowledgments
Conflicts of Interest
References
- Li, W.; Wang, H.; Zhang, Y.; Ouyang, M. Flammability characteristics of the battery vent gas: A case of NCA and LFP lithium-ion batteries during external heating abuse. J. Energy Storage 2019, 24, 100775. [Google Scholar] [CrossRef]
- Sturk, D.; Rosell, L.; Blomqvist, P.; Tidblad, A.A. Analysis of Li-Ion Battery Gases Vented in an Inert Atmosphere Thermal Test Chamber. Batteries 2019, 5, 61. [Google Scholar] [CrossRef]
- Baird, A.R.; Archibald, E.J.; Marr, K.C.; Ezekoye, O. Explosion hazards from lithium-ion battery vent gas. J. Power Sources 2020, 446, 227257. [Google Scholar] [CrossRef]
- Fan, X.; Wang, C. High-voltage liquid electrolytes for Li batteries: Progress and perspectives. Chem Soc. Rev. 2021, 50, 10486–10566. [Google Scholar] [CrossRef]
- Liu, K.; Liu, Y.; Lin, D.; Pei, A.; Cui, Y. Materials for lithium-ion battery safety. Sci. Adv. 2018, 4, eaas9820. [Google Scholar] [CrossRef] [PubMed]
- da Costa Luchiari, I.; Paz Cedeno, F.R.; de Macedo Farias, T.A.; Picheli, F.P.; de Paula, A.V.; Monti, R.; Masarin, F. Glucoamylase Immobilization in Corncob Powder: Assessment of Enzymatic Hydrolysis of Starch in the Production of Glucose. Waste Biomass Valorization 2021, 12, 5491–5504. [Google Scholar] [CrossRef]
- Jeżowski, P.; Kowalczewski, P. Łukasz Starch as a Green Binder for the Formulation of Conducting Glue in Supercapacitors. Polymers 2019, 11, 1648. [Google Scholar] [CrossRef] [PubMed]
- Robyt, J. Starch: Structure, Properties, Chemistry, and Enzymology. In Glycoscience; Fraser-Reid, B.O., Tatsuta, K., Thiem, J., Eds.; Springer: Berlin/Heidelberg, Germany, 2008. [Google Scholar]
- Domene-López, D.; García-Quesada, J.C.; Martin-Gullon, I.; Montalbán, M.G. Influence of Starch Composition and Molecular Weight on Physicochemical Properties of Biodegradable Films. Polymers 2019, 11, 1084. [Google Scholar] [CrossRef] [PubMed]
- Wang, Q.; Jiang, L.; Yu, Y.; Sun, J. Progress of enhancing the safety of lithium ion battery from the electrolyte aspect. Nano Energy 2019, 55, 93–114. [Google Scholar] [CrossRef]
- Hess, S.; Wohlfahrt-Mehrens, M.; Wachtler, M. Flammability of Li-Ion Battery Electrolytes: Flash Point and Self-Extinguishing Time Measurements. J. Electrochem. Soc. 2015, 162, A3084–A3097. [Google Scholar] [CrossRef]
- Juszczak, L.; Witczak, M.; Zięba, T.; Fortuna, T. Rheological behaviour of heated potato starch dispersions. Int. Agrophys. 2012, 26, 381–386. [Google Scholar] [CrossRef]
- Ai, Y.; Jane, J.-L. Gelatinization and rheological properties of starch. Starch Stärke 2015, 67, 213–224. [Google Scholar] [CrossRef]
- Haj-Kacem, R.; Ouerfelli, N.; Herráez, J.; Guettari, M.; Hamda, H.; Dallel, M. Contribution to modeling the viscosity Arrhenius-type equation for some solvents by statistical correlations analysis. Fluid Phase Equilibria 2014, 383, 11–20. [Google Scholar] [CrossRef]
- Duan, L.; Wang, L.; Inge, A.K.; Fischer, A.; Zou, X.; Sun, L. Insights into Ru-Based Molecular Water Oxidation Catalysts: Electronic and Noncovalent-Interaction Effects on Their Catalytic Activities. Inorg. Chem. 2013, 52, 7844–7852. [Google Scholar] [CrossRef] [PubMed]
- Dutton, P.L.; Munro, A.; Scrutton, N.S.; Sutcliffe, M. Introduction. Quantum catalysis in enzymes: Beyond the transition state theory paradigm. Philos. Trans. R. Soc. B Biol. Sci. 2006, 361, 1293–1294. [Google Scholar] [CrossRef]
- Snider, M.; Gaunitz, S.; Ridgway, C.; Short, S.; Wolfenden, R. Temperature effects on the catalytic efficiency, rate enhancement, and transition state affinity of cytidine deaminase, and the thermodynamic consequences for catalysis of removing a substrate “anchor”. Chem. Med. Biochem. 2000, 5, 10–14. [Google Scholar] [CrossRef]
- Klvaňa, M.; Bren, U.; Florián, J. Uniform Free-Energy Profiles of the P–O Bond Formation and Cleavage Reactions Catalyzed by DNA Polymerases β and λ. J. Phys. Chem. B 2016, 120, 13017–13030. [Google Scholar] [CrossRef] [PubMed]
- Gebke, S.; Thümmler, K.; Sonnier, R.; Tech, S.; Wagenführ, A.; Fischer, S. Flame Retardancy of Wood Fiber Materials Using Phosphorus-Modified Wheat Starch. Molecules 2020, 25, 335. [Google Scholar] [CrossRef]
- Tsuyumoto, I.; Miura, Y.; Nirei, M.; Ikurumi, S.; Kumagai, T. Highly flame retardant coating consisting of starch and amorphous sodium polyborate. J. Mater. Sci. 2011, 46, 5371–5377. [Google Scholar] [CrossRef]
- Zhang, J.; Yue, L.; Kong, Q.; Liu, Z.; Zhou, X.; Zhang, C.; Xu, Q.; Zhang, B.; Ding, G.; Qin, B.; et al. Sustainable, heat-resistant and flame-retardant cellulose-based composite separator for high-performance lithium ion battery. Sci. Rep. 2014, 4, 3935. [Google Scholar] [CrossRef]
- Swiderska-Mocek, A.; Jakobczyk, P.; Rudnicka, E.; Lewandowski, A. Flammability parameters of lithium-ion battery electrolytes. J. Mol. Liq. 2020, 318, 113986. [Google Scholar] [CrossRef]
- Dagger, T.; Rad, B.R.; Schappacher, F.M.; Winter, M. Comparative Performance Evaluation of Flame Retardant Additives for Lithium Ion Batteries—I. Safety, Chemical and Electrochemical Stabilities. Energy Technol. 2018, 6, 1–13. [Google Scholar] [CrossRef]
- Pham, H.Q.; Nam, K.-M.; Hwang, E.-H.; Kwon, Y.-G.; Jung, H.M.; Song, S.-W. Performance Enhancement of 4.8 V Li1.2Mn0.525Ni0.175Co0.1O2 Battery Cathode Using Fluorinated Linear Carbonate as a High-Voltage Additive. J. Electrochem. Soc. 2014, 161, A2002–A2011. [Google Scholar] [CrossRef]
- Chawla, N.; Bharti, N.; Singh, S. Recent Advances in Non-Flammable Electrolytes for Safer Lithium-Ion Batteries. Batteries 2019, 5, 19. [Google Scholar] [CrossRef]
- Haregewoin, A.M.; Wotango, A.S.; Hwang, B.-J. Electrolyte additives for lithium ion battery electrodes: Progress and perspectives. Energy Environ. Sci. 2016, 9, 1955–1988. [Google Scholar] [CrossRef]
- Fathabadi, H. A novel design including cooling media for Lithium-ion batteries packused in hybrid and electric vehicles. J. Power Sources 2014, 245, 495. [Google Scholar] [CrossRef]
- Jarrett, A.; Kim, I.Y. Influence of operating conditions on the optimum design of electric vehicle battery cooling plates. J. Power Sources 2014, 245, 644. [Google Scholar] [CrossRef]
- Högström, K.C.; Lundgren, H.; Wilken, S.; Zavalis, T.G.; Behm, M.; Edstroem, K.; Jacobsson, P.; Johansson, P.; Lindbergh, G. Impact of the flame retardant additive triphenyl phosphate (TPP) on the performance of graphite/LiFePO4 cells in high power applications. J. Power Sources 2014, 256, 430–439. [Google Scholar] [CrossRef]
- Zygadło-Monikowska, E.; Florjanczyk, Z.; Kubisa, P.; Biedron, T.; Sadurski, W.; Puczyłows, A.; Langwald, N.; Ostrowska, J. Lithium electrolytes based on modified imidazolim ionic liquids. Int. J. Hydrogen Energy 2014, 39, 2943. [Google Scholar] [CrossRef]
- Zheng, J.; Li, X.; Yu, Y.; Feng, X.; Zhao, Y. Novel high phosphorus content phosphaphenanthrene-based efficient flame retardant additives for lithium-ion battery. J. Therm. Anal. Calorim. 2014, 117, 319–324. [Google Scholar] [CrossRef]
- Xun, J.; Liu, R.; Jiao, K. Numerical and analytical modeling of lithium ion battery thermal behaviors with different cooling designs. J. Power Sources 2013, 233, 47–61. [Google Scholar] [CrossRef]
- Li, X.; He, F.; Ma, L. Thermal management of cylindrical batteries investigated using wind tunnel testing and compu-tational fluid dynamics simulation. J. Power Sources 2013, 238, 395. [Google Scholar] [CrossRef]
- Xiao, M.; Choe, S.Y. Theoretical and experimental analysis of heat generations of a pouch type LiMn2O4/carbon high power Li-polymer battery. J. Power Sources 2013, 241, 46. [Google Scholar] [CrossRef]
- Karimi, G.; Dehghan, A.R. Thermal Management Analysis of a Lithium-Ion Battery Pack using Flow Network Approach. Int. J. Mech. Eng. Mechatronics 2012, 1, 88. [Google Scholar] [CrossRef][Green Version]
- Arbizzani, C.; Gabrielli, G.; Mastragostino, M. Thermal stability and flammability of electrolytes for lithium-ion batteries. J. Power Sources 2011, 196, 4801–4805. [Google Scholar] [CrossRef]
- Otsuki, M.; Ogino, T. Flame-Retardant Additives for Lithium-Ion Batteries. Lithium-Ion Batter. 2009, 1–15. [Google Scholar] [CrossRef]
- Pigłowska, M.; Kurc, B.; Rymaniak, Ł.; Lijewski, P.; Fuć, P. Kinetics and Thermodynamics of Thermal Degradation of Different Starches and Estimation the OH Group and H2O Content on the Surface by TG/DTG-DTA. Polymers 2020, 12, 357. [Google Scholar] [CrossRef] [PubMed]
- Long, L.; Wang, S.; Xiao, M.; Meng, Y. Polymer electrolytes for lithium polymer batteries. J. Mater. Chem. A 2016, 4, 10038–10069. [Google Scholar] [CrossRef]
- Zhou, D.; Shanmukaraj, D.; Tkacheva, A.; Armand, M.; Wang, G. Polymer Electrolytes for Lithium-Based Batteries: Advances and Prospects. Chem 2019, 5, 2326–2352. [Google Scholar] [CrossRef]
- Fan, P.; Liu, H.; Marosz, V.; Samuels, N.T.; Suib, S.L.; Sun, L.; Liao, L. High Performance Composite Polymer Electrolytes for Lithium-Ion Batteries. Adv. Funct. Mater. 2021, 31, 2101380. [Google Scholar] [CrossRef]
- Martins, M.; Sequeira, C. Factors affecting the conductivity of divalent polymeric electrolytes. J. Power Sources 1990, 32, 107–124. [Google Scholar] [CrossRef]
- Xiang, J.; Zhang, Y.; Zhang, B.; Yuan, L.; Liu, X.; Cheng, Z.; Yang, Y.; Zhang, X.; Li, Z.; Shen, Y.; et al. A flame-retardant polymer electrolyte for high performance lithium metal batteries with an expanded operation temperature. Energy Environ. Sci. 2021, 14, 3510–3521. [Google Scholar] [CrossRef]
- Olmedo-Martínez, J.L.; Meabe, L.; Riva, R.; Guzmán-González, G.; Porcarelli, L.; Forsyth, M.; Mugica, A.; Calafel, I.; Müller, A.; Lecomte, P.; et al. Flame retardant polyphosphoester copolymers as solid polymer electrolyte for lithium batteries. Polym. Chem. 2021, 12, 3441–3450. [Google Scholar] [CrossRef]
- Chagnes, A. Lithium Battery Technologies: Electrolytes; Chagnes, A., Swiatowska, J., Eds.; Lithium Process Chemistry; Elsevier: Chicago, IL, USA, 2015. [Google Scholar]
- Montanino, M.; Passerini, S.; Appetecchi, G.B. Electrolytes for Rechargeable Lithium Batteries; Franco, A.A., Ed.; Rechargeable Lithium Batteries; Elsevier: Chicago, IL, USA, 2015. [Google Scholar]
- Zhao, L.; Okada, S.; Yamaki, J.I. Effect of VC additive on MFA-based electrolyte in Li-ion batteries. J. Power Sources 2013, 244, 369–375. [Google Scholar] [CrossRef]
- Nakajima, T.; Hirobayashi, Y.; Takayanagi, Y.; Ohzawa, Y. Reactions of metallic Li or LiC6 with organic solvents for lithium ion battery. J. Power Sources 2013, 243, 581–586. [Google Scholar] [CrossRef]
- Fornefeld-Schwarz, U.M.; Svejda, P. Refractive Indices and Relative Permittivities of Liquid Mixtures of γ-Butyrolactone, γ-Valerolactone, δ-Valerolactone, or ε-Caprolactone + Benzene, + Toluene, or + Ethylbenzene at 293.15 K and 313.15 K and Atmospheric Pressure. J. Chem. Eng. Data 1999, 44, 597–602. [Google Scholar] [CrossRef]
- Chagnes, A.; Carre, B.; Willmann, P.; Lemordant, D. Modeling viscosity and conductivity of lithium salts in γ-butyrolactone. J. Power Sources 2002, 109, 203–209. [Google Scholar] [CrossRef]
- Eshetu, G.G.; Bertrand, J.P.; Lecocq, A.; Grugeon, S.; Laruelle, S.; Armand, M.; Marlair, G. Fire behavior of carbonates-based electrolytes used in Li-ion rechargeable batteries with a focus on the role of the LiPF6 and LiFSI salts. J. Power Sources 2014, 269, 804–809. [Google Scholar] [CrossRef]
- Chang, Y.C.; Jong, J.H.; Fey, G.T. Kinetic Characterization of the Electrochemical Intercalation of Lithium Ions into Graphite Electrodes. J. Electrochem. Soc. 2000, 147, 2033–2038. [Google Scholar] [CrossRef]
- MacFarlane, D.R.; Meakin, P.; Sun, J.; Amini, N.; Forsyth, M. Pyrrolidinium Imides: A New Family of Molten Salts and Con-ductive Plastic Crystal Phases. J. Phys. Chem. B 1999, 103, 4164–4170. [Google Scholar] [CrossRef]
- Kurc, B.; Pigłowska, M. An influence of temperature on the lithium ions behavior for starch-based carbon compared to graphene anode for LIBs by the electrochemical impedance spectroscopy (EIS). J. Power Sources 2021, 485, 229323. [Google Scholar] [CrossRef]
- Lin, P.-C.; Wu, J.-Y.; Liu, W.-R. Green and facile synthesis of few-layer graphene via liquid exfoliation process for Lithium-ion batteries. Sci. Rep. 2018, 8, 1–8. [Google Scholar] [CrossRef]
- Xiao, P.; Lv, T.; Chen, X.; Chang, C. LiNi0.8Co0.15Al0.05O2: Enhanced Electrochemical Performance From Reduced Cationic Disordering in Li Slab. Sci. Rep. 2017, 7, 1–8. [Google Scholar] [CrossRef]
- Lewandowski, A.; Biegun, M.; Galiński, M.; Swiderska-Mocek, A. Kinetic analysis of Li|Li+ interphase in an ionic liquid electrolyte. J. Appl. Electrochem. 2012, 43, 367–374. [Google Scholar] [CrossRef]
- Yu, Z.; Yiang, H.; Gu, D.; Li, J.; Wang, L.; Shen, L. A New Way to Prepare MoO3/C as Anode of Lithium ion Battery for Enhancing the Electrochemical Performance at Room Temperature. J. Electrochem. Sci. Technol. 2016, 7, 170–178. [Google Scholar] [CrossRef]
- Boroujeni, S.M.; Birke, K.P. Study of a Li-Ion Cell Kinetics in Five Regions to Predict Li Plating Using a Pseudo Two-Dimensional Model. Sustainability 2019, 11, 6392. [Google Scholar] [CrossRef]
- Kurc, B.; Pigłowska, M.; Rymaniak, Ł. The Electrochemical Stability of Starch Carbon as an Important Property in the Construction of a Lithium-Ion Cell. Entropy 2021, 23, 861. [Google Scholar] [CrossRef]
- Pigłowska, M.; Kurc, B.; Rymaniak, Ł. Application of Carbonized Starches as Carbon Electrode Active Material Compared to Graphene Nanoplatelets-Based Anode in a Lithium-Ion Cell. Waste Biomass Valorization 2021, 12, 6403–6422. [Google Scholar] [CrossRef]
- Shim, E.-G.; Nam, T.-H.; Kim, J.-G.; Kim, H.-S.; Moon, S.-I. Electrochemical performance of lithium-ion batteries with triphenylphosphate as a flame-retardant additive. J. Power Sources 2007, 172, 919–924. [Google Scholar] [CrossRef]
- Xia, X.; Ping, P.; Dahn, J.R. Studies of the Effect of Triphenyl Phosphate on the Negative Electrode of Li-Ion Cells. J. Electrochem. Soc. 2012, 159, A1460–A1466. [Google Scholar] [CrossRef]
- Wang, X.; Yasukawa, E.; Kasuya, S. Nonflammable Trimethyl Phosphate Solvent-Containing Electrolytes for Lithium-Ion Batteries: I. Fundamental Properties. J. Electrochem. Soc. 2001, 148, A1058. [Google Scholar] [CrossRef]
- Ding, J.; Tian, T.; Meng, Q.; Guo, Z.; Li, W.; Zhang, P.; Ciacchi, F.T.; Huang, J.; Yang, W. Smart Multifunctional Fluids for Lithium Ion Batteries: Enhanced Rate Performance and Intrinsic Mechanical Protection. Sci. Rep. 2013, 3, 2485. [Google Scholar] [CrossRef] [PubMed]
- Ike, E. The study of viscosity-temperature dependence and activation energy for palm oil and soybean oil. Glob. J. Pure Appl. Sci. 2019, 25, 209–217. [Google Scholar] [CrossRef]


| Structure | Formula | Function |
|---|---|---|
 | LiPF6 | Electrolyte |
 | DMC | Solvent Flash point: 16 °C Boiling point: 91 °C |
 | EC | Solvent Flash point: 151 °C Boiling point: 240 °C |
 | CS | Flame retardant 24.8% amylose, 0.020% phosphorus, 11% moisture [9] |
| Sample | 1 M LiPF6 in EC:DMC | 5% wt. CS | 10% wt. CS | 20% wt. CS | |
|---|---|---|---|---|---|
| Parameter | |||||
| Eη (kJ mol−1) | 14.296 | 16.270 | 22.474 | 24.631 | |
| T* (K) | 1719.51 | 1956.94 | 2703.15 | 2962.59 | |
| TA (K) | 151.23 | 206.43 | 250.03 | 244.76 | |
| η∞ (Pa s) | 1.15 × 10⁻⁵ | 7.65 × 10⁻⁵ | 2.02 × 10⁻⁵ | 5.54 × 10⁻⁶ | |
| K = η (Pa s) | 1.667 × 10⁻³ | 1.413 × 10⁻² | 2.735 × 10⁻² | 1.501 × 10⁻² | |
| ΔG (kJ mol−1) | 104.710 | 105.982 | 103.921 | 112.651 | |
| ΔH = Qp (kJ mol−1) | 11.389 | 13.148 | 19.352 | 21.509 | |
| ΔS (J mol−1 K−1) | −266.291 | −247.208 | −225.190 | −242.691 | |
| K (-) | 2.32 × 10⁻¹⁶ | 1.81 × 10⁻¹⁵ | 3.50 × 10⁻¹⁵ | 2.13 × 10⁻¹⁶ | |
| Sample | 1 M LiPF6 in EC:DMC | 5% wt. CS | 10% wt. CS | 20% wt. CS | |
|---|---|---|---|---|---|
| Parameter | |||||
| E# (kJ mol−1) | 9.054 | 9.428 | 11.600 | 12.604 | |
| σ0 = A (S m−1) | 37.077 | 32.773 | 41.364 | 48.764 | |
| ΔG (kJ mol−1) | 79.797 | 84.048 | 85.554 | 86.089 | |
| ΔH = Qp (kJ mol−1) | 6.327 | 6.570 | 8.742 | 9.746 | |
| ΔS (J mol−1 K−1) | −223.964 | −225.372 | −223.437 | −222.068 | |
| K (-) | 1.96 × 10⁻¹³ | 1.69 × 10⁻¹³ | 1.02 × 10⁻¹³ | 8.4 × 10⁻¹⁴ | |
| T (°C) | 5% | 10% | 20% |
|---|---|---|---|
| DLi+ × 10−10 (cm2 s−1) | DLi+ × 10−11 (cm2 s−1) | DLi+ × 10−11 (cm2 s−1) | |
| 25 | 3.06 | 4.11 | 8.04 |
| 35 | 4.37 | 5.22 | 9.43 |
| 45 | 6.54 | 7.42 | 13.67 |
| 55 | 10.5 | 8.33 | 20.11 |
| 65 | 18.6 | 9.67 | 32.98 |
| 75 | 39.6 | 20.11 | 43.45 |
| 85 | 56.4 | 34.55 | 52.34 |
| 90 | 72.3 | 60.23 | 65.89 |
| Kinetic and thermodynamic parameters | |||
| (kJ mol−1) | 44.74 | 49.22 | 68.34 |
| A (S m−1) | 2,167,316 | 2,248,537 | 2,342,174 |
| k (S m−1) | 2.4 × 10⁻¹ | 2.9 × 10⁻¹ | 1.8 × 10⁻¹ |
| ΔH (kJ mol−1) | 42.01 | 58.02 | 60.56 |
| ΔG (kJ mol−1) | 85.55 | 94.34 | 105.65 |
| ΔS (J mol−1 K−1) | −132.70 | −140.32 | −150.98 |
| K (-) | 3.33 × 10⁻¹⁴ | 8.52 × 10⁻¹⁴ | 4.21 × 10⁻¹⁵ |
Publisher’s Note: MDPI stays neutral with regard to jurisdictional claims in published maps and institutional affiliations. |
© 2022 by the authors. Licensee MDPI, Basel, Switzerland. This article is an open access article distributed under the terms and conditions of the Creative Commons Attribution (CC BY) license (https://creativecommons.org/licenses/by/4.0/).
Share and Cite
Pigłowska, M.; Kurc, B.; Rymaniak, Ł. Starch as the Flame Retardant for Electrolytes in Lithium-Ion Cells. Materials 2022, 15, 523. https://doi.org/10.3390/ma15020523
Pigłowska M, Kurc B, Rymaniak Ł. Starch as the Flame Retardant for Electrolytes in Lithium-Ion Cells. Materials. 2022; 15(2):523. https://doi.org/10.3390/ma15020523
Chicago/Turabian StylePigłowska, Marita, Beata Kurc, and Łukasz Rymaniak. 2022. "Starch as the Flame Retardant for Electrolytes in Lithium-Ion Cells" Materials 15, no. 2: 523. https://doi.org/10.3390/ma15020523
APA StylePigłowska, M., Kurc, B., & Rymaniak, Ł. (2022). Starch as the Flame Retardant for Electrolytes in Lithium-Ion Cells. Materials, 15(2), 523. https://doi.org/10.3390/ma15020523