
Tensile Deformation and Fracture Behavior of API-5L X70 Line Pipe Steel

 ,
, 
Abstract
:1. Introduction
2. Materials and Methods
2.1. Material
2.2. Specimen Preparation and Microstructure Orientation Analysis
2.3. EBSD Study of the Average Grain Size
2.4. Tensile Testing
2.5. Taylor Factor Determination
3. Results
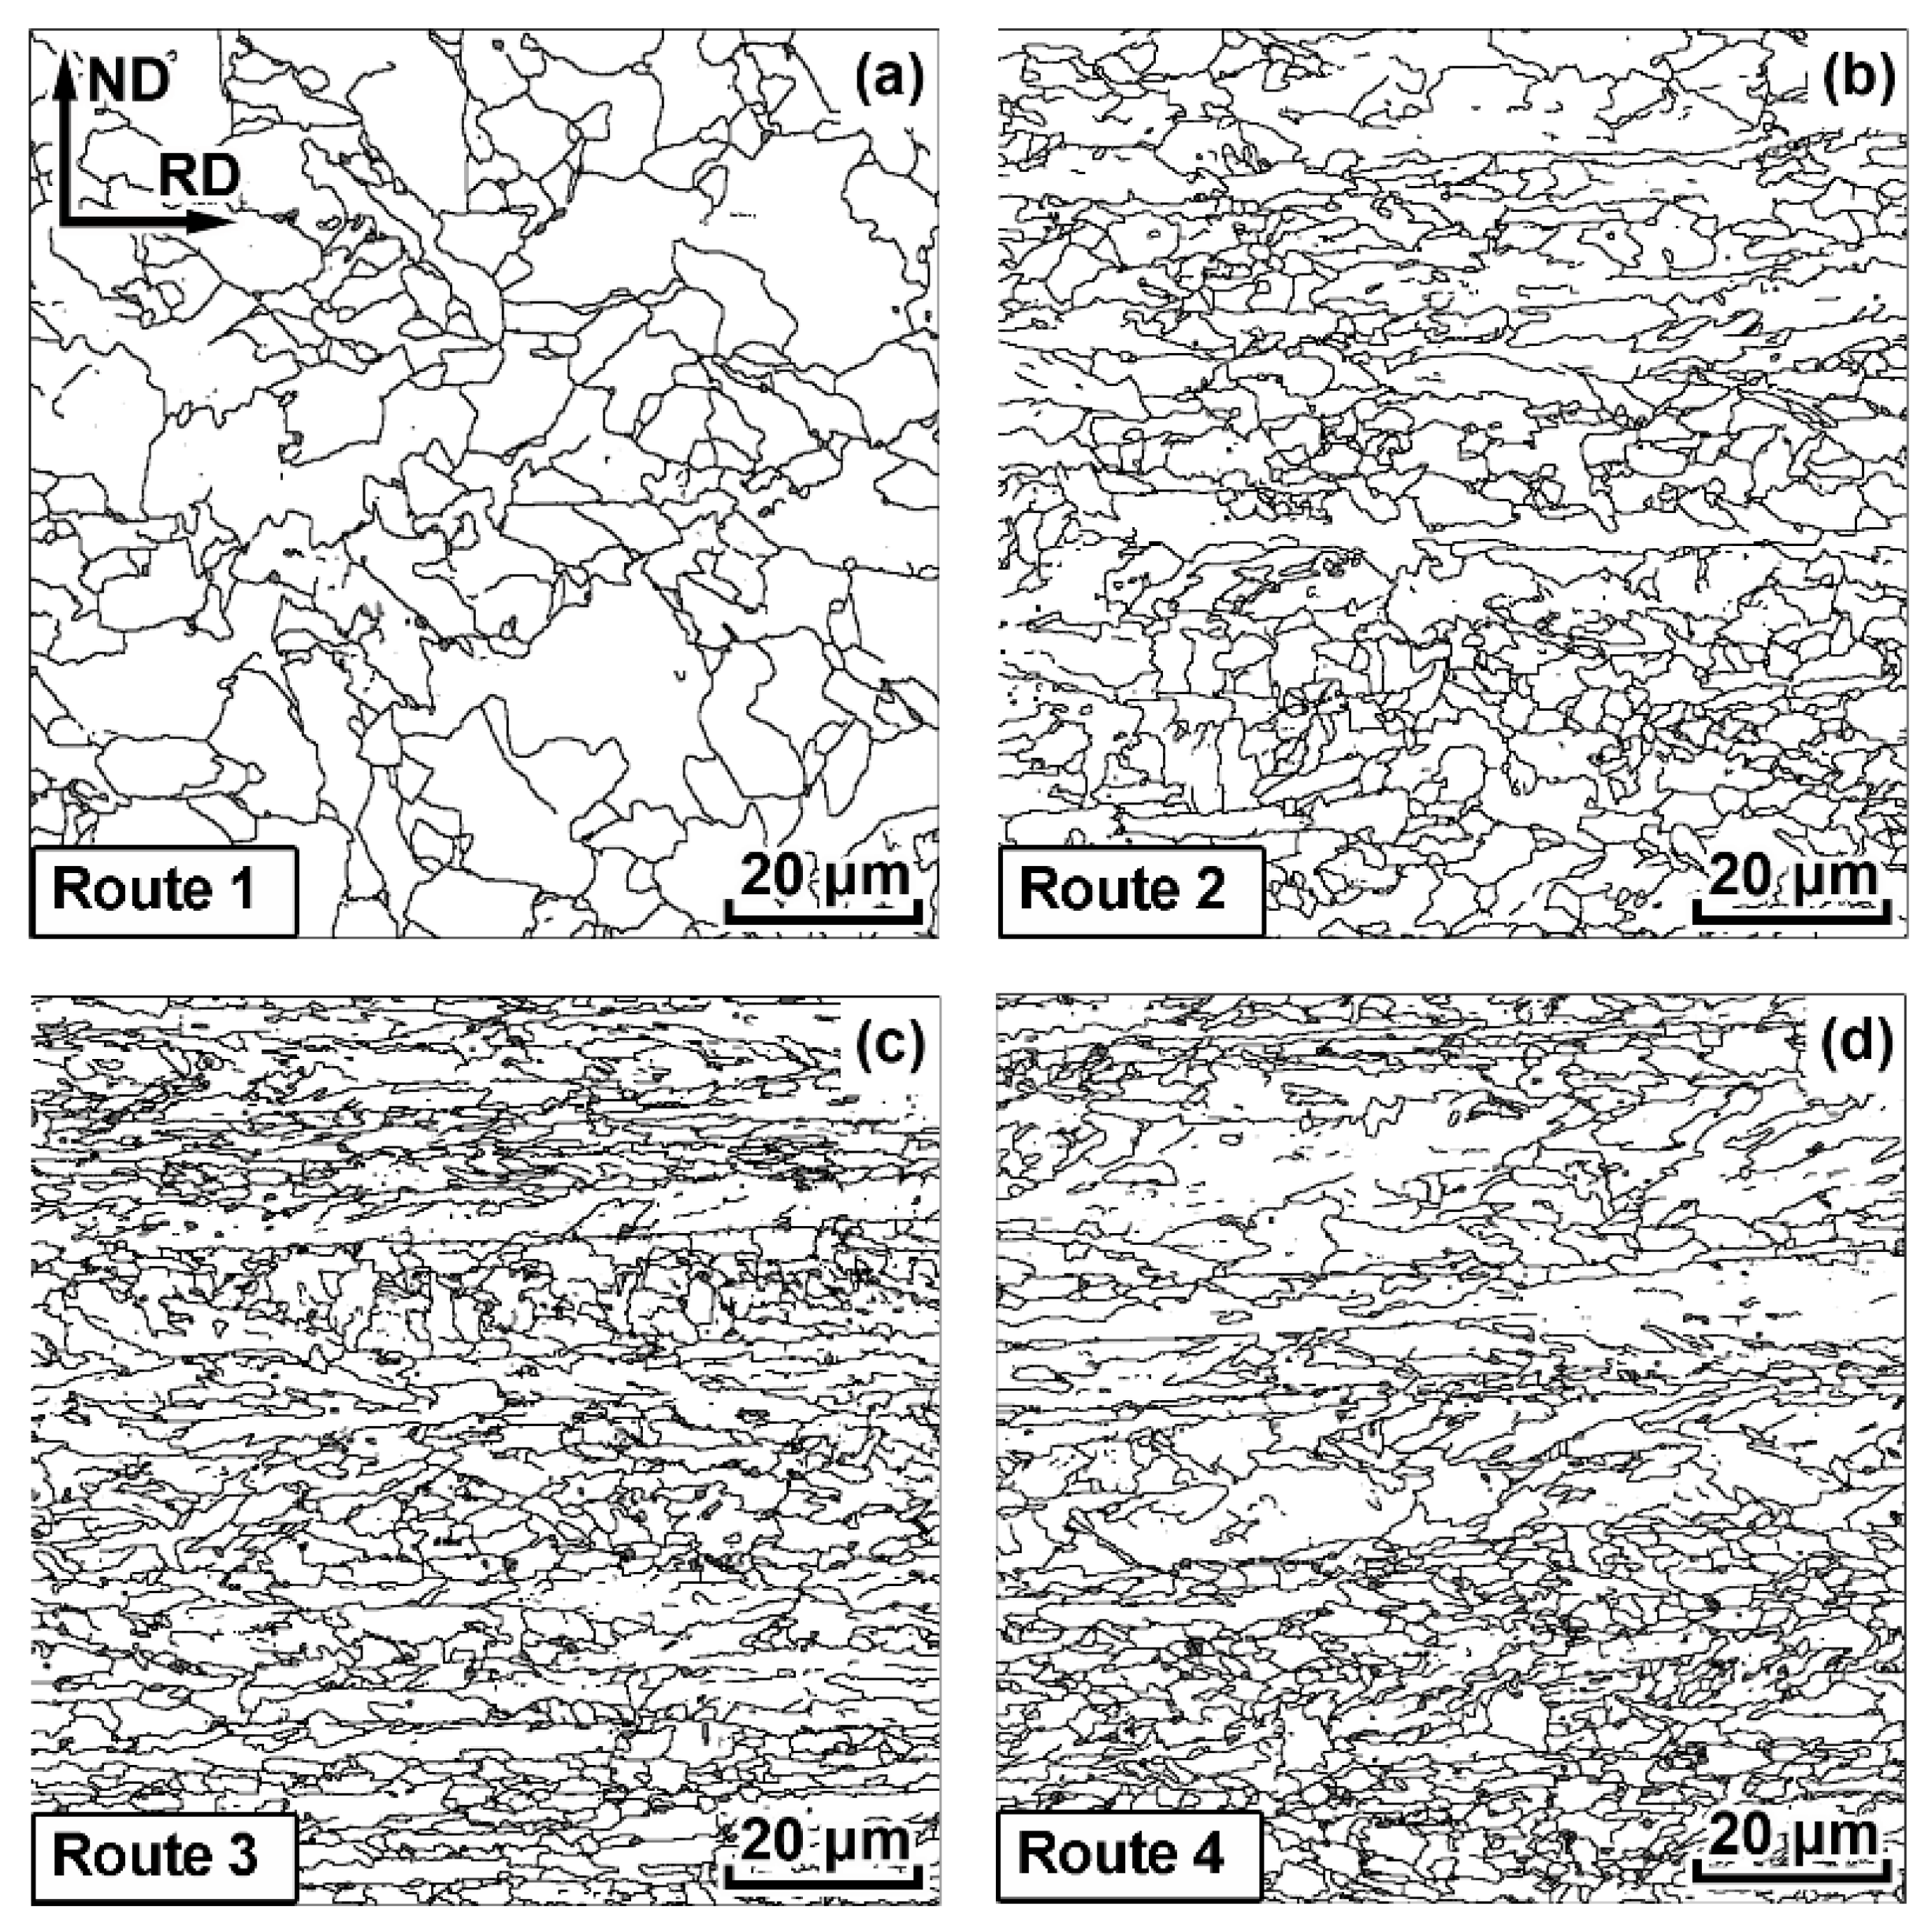
3.1. Microstructure
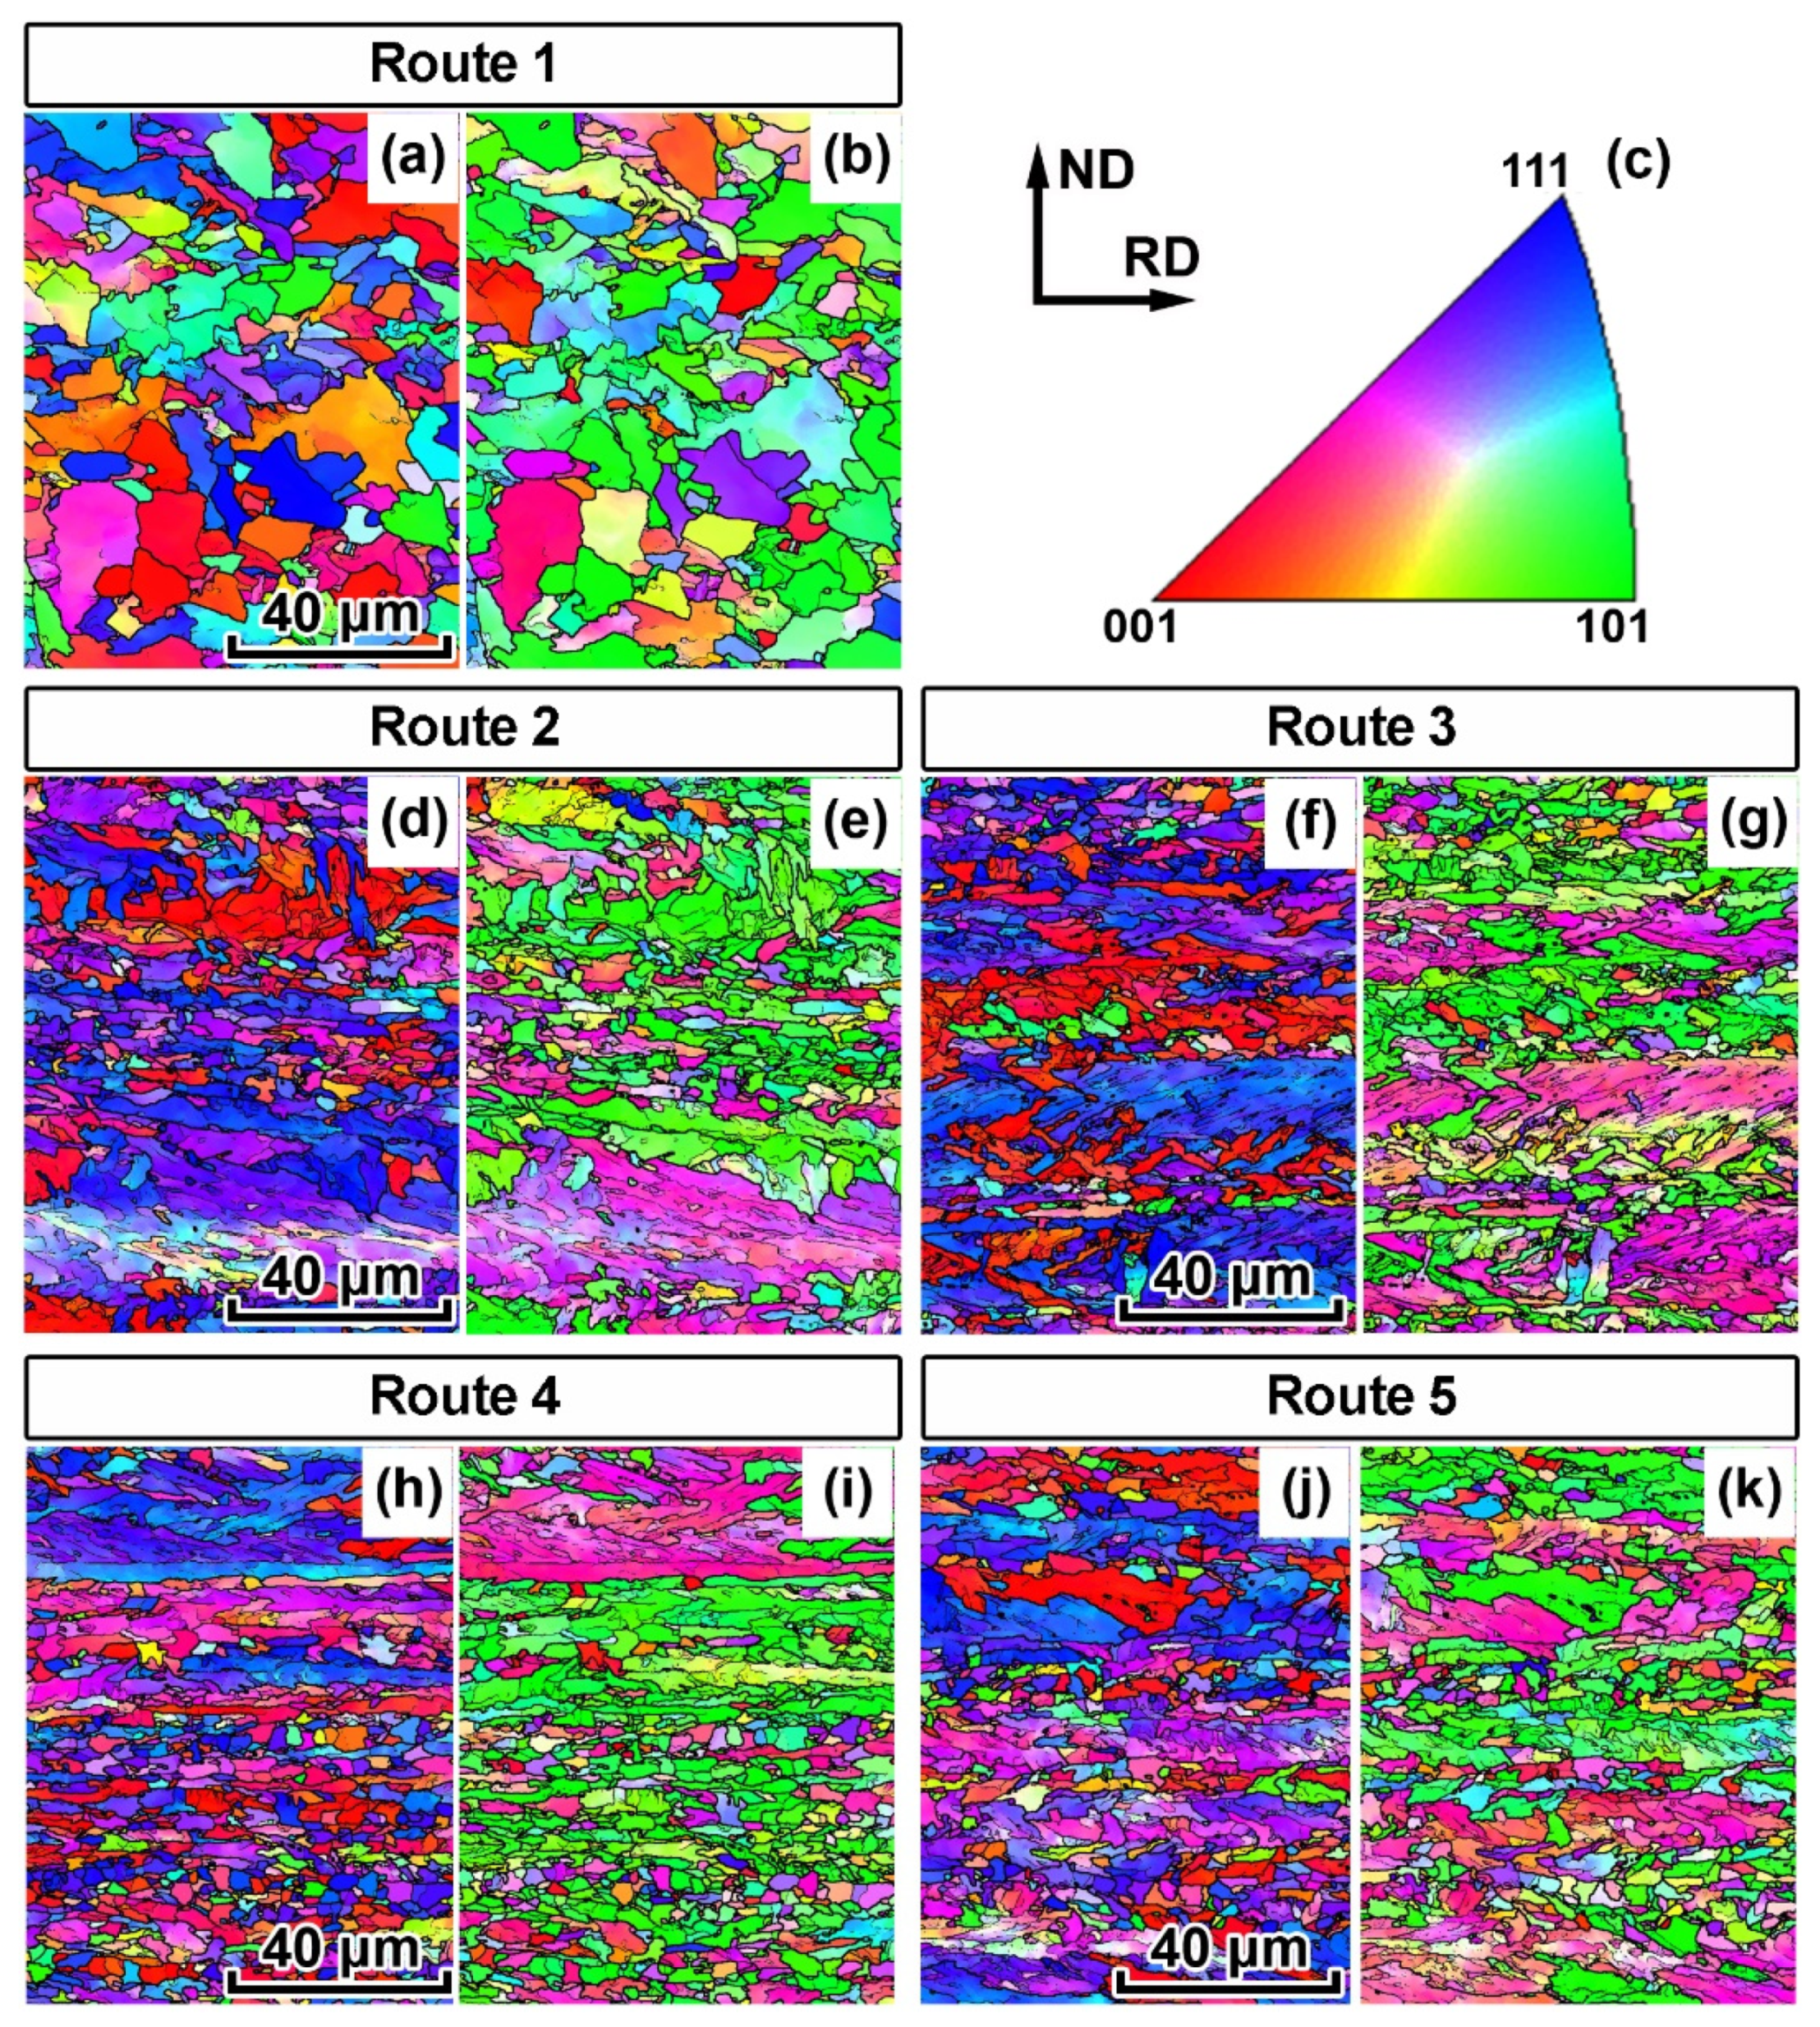
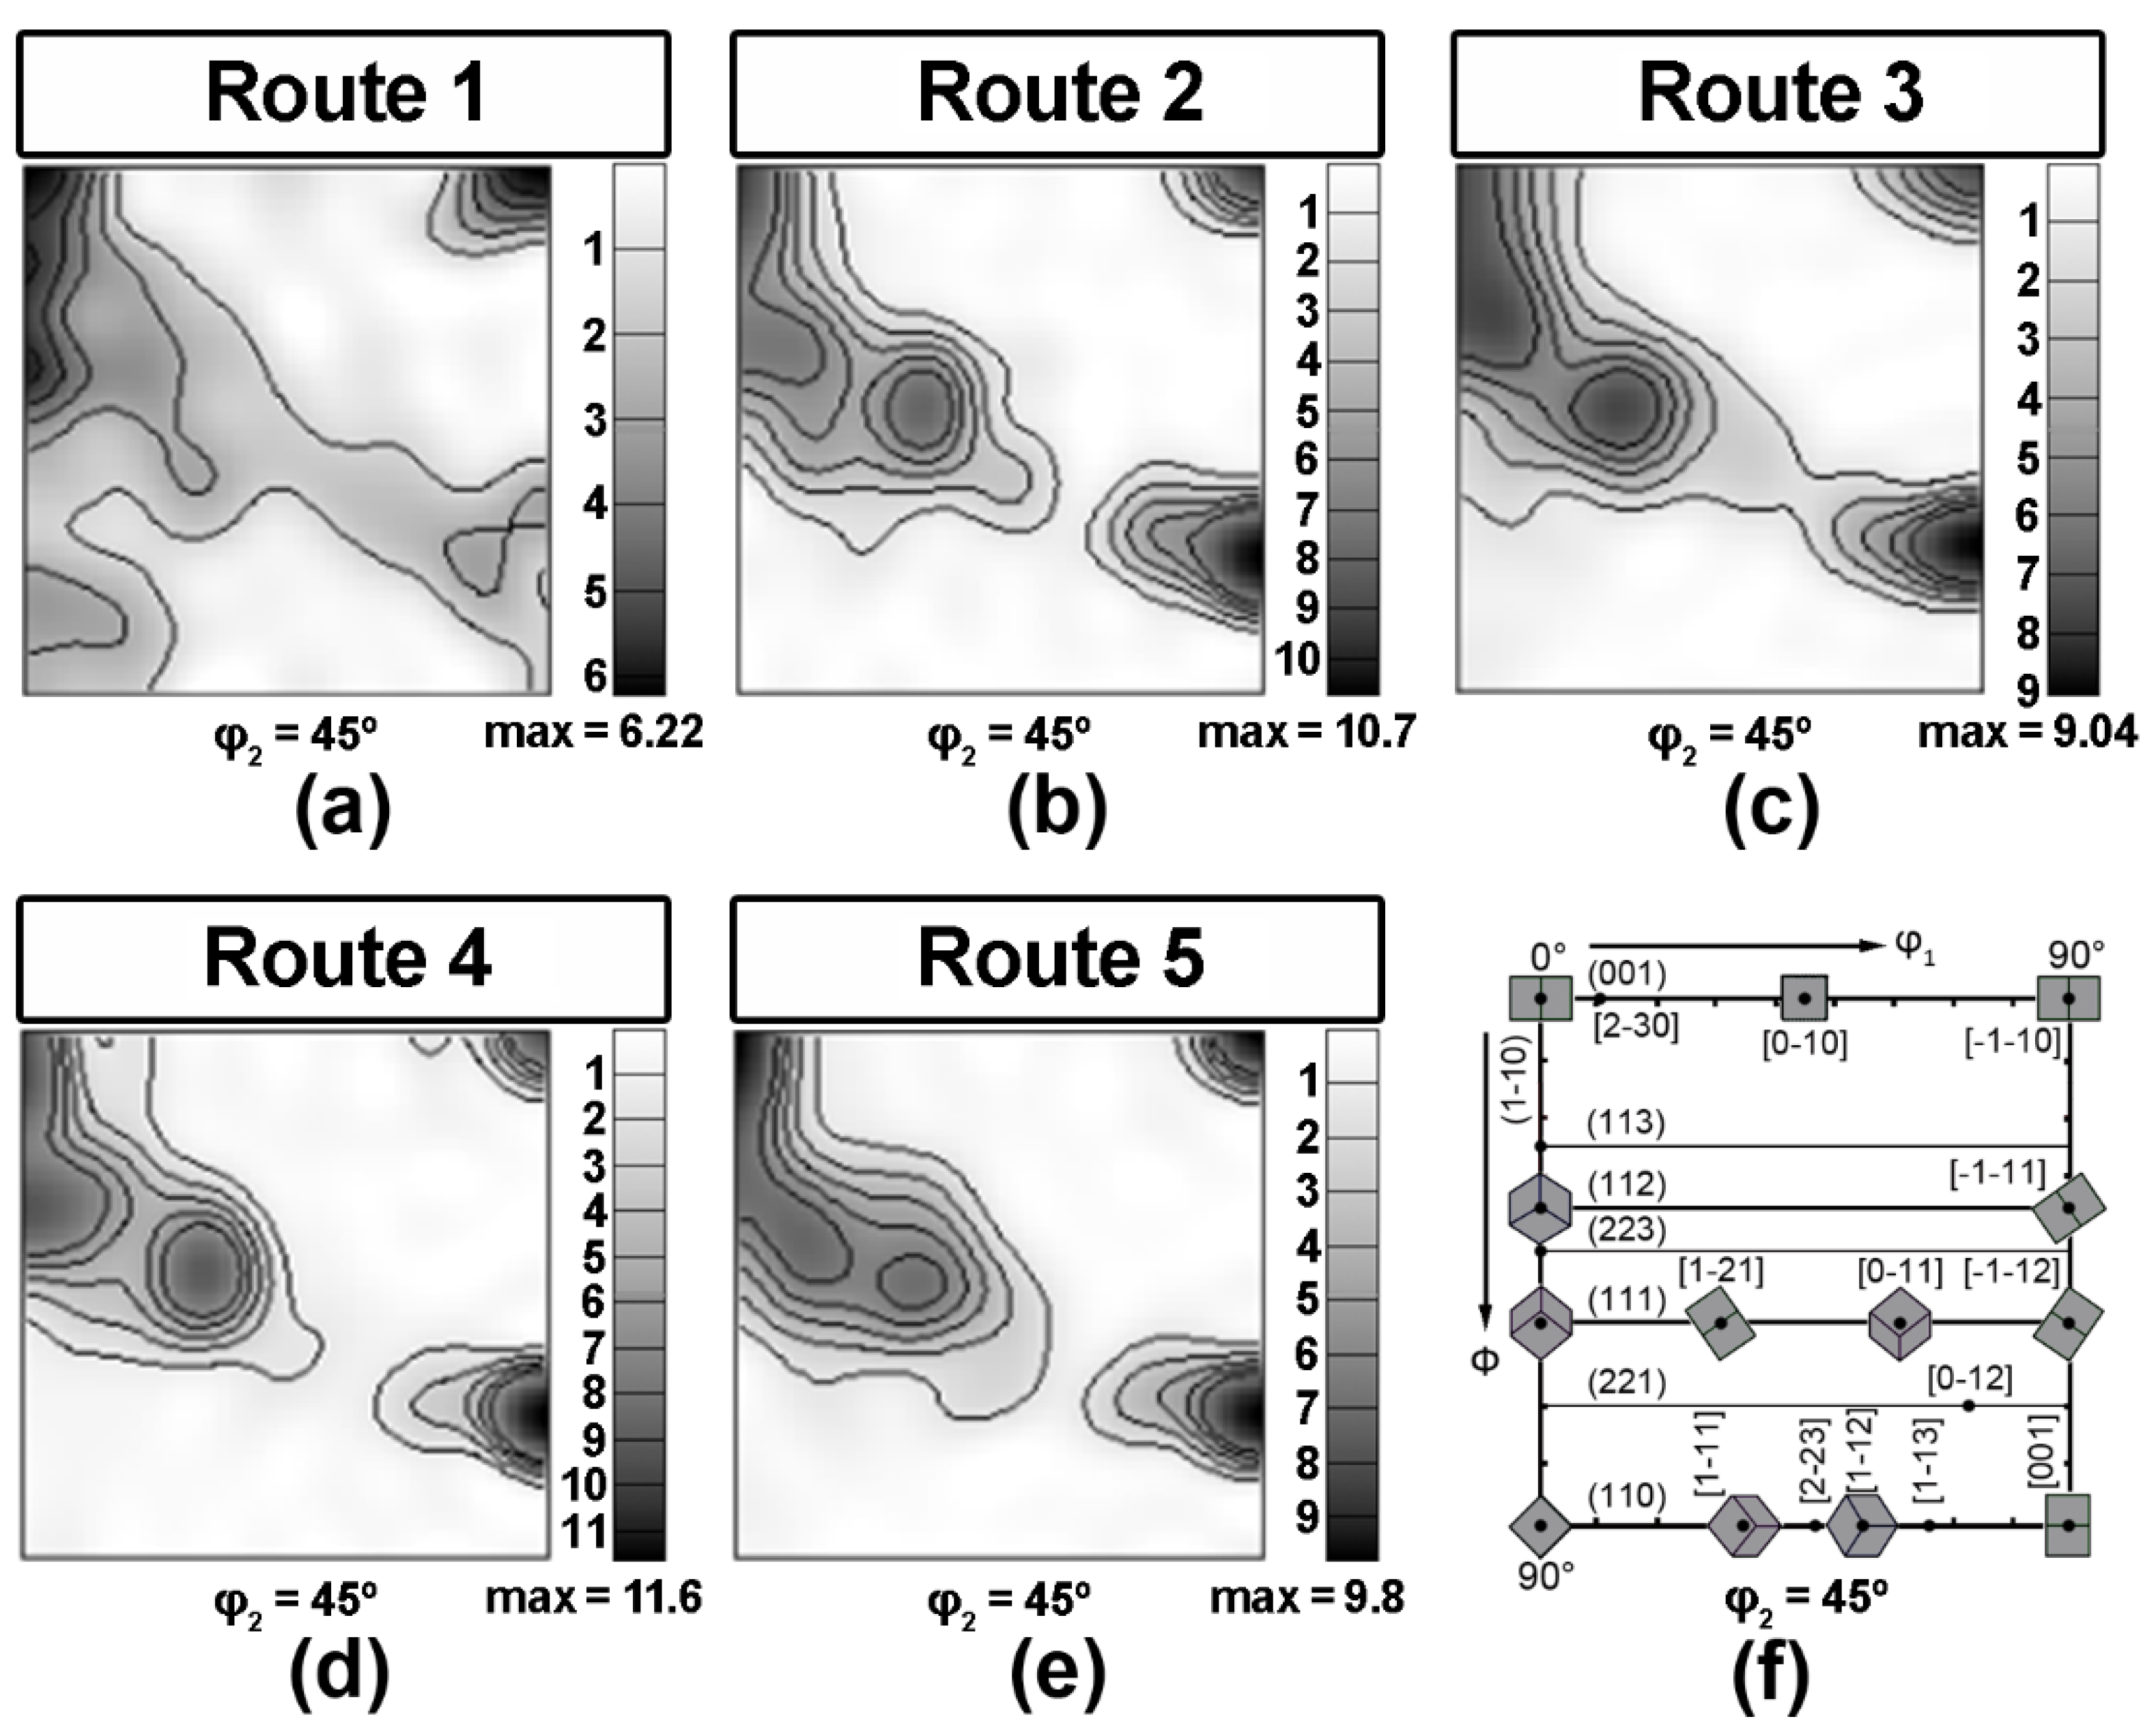
3.2. Crystallographic Texture
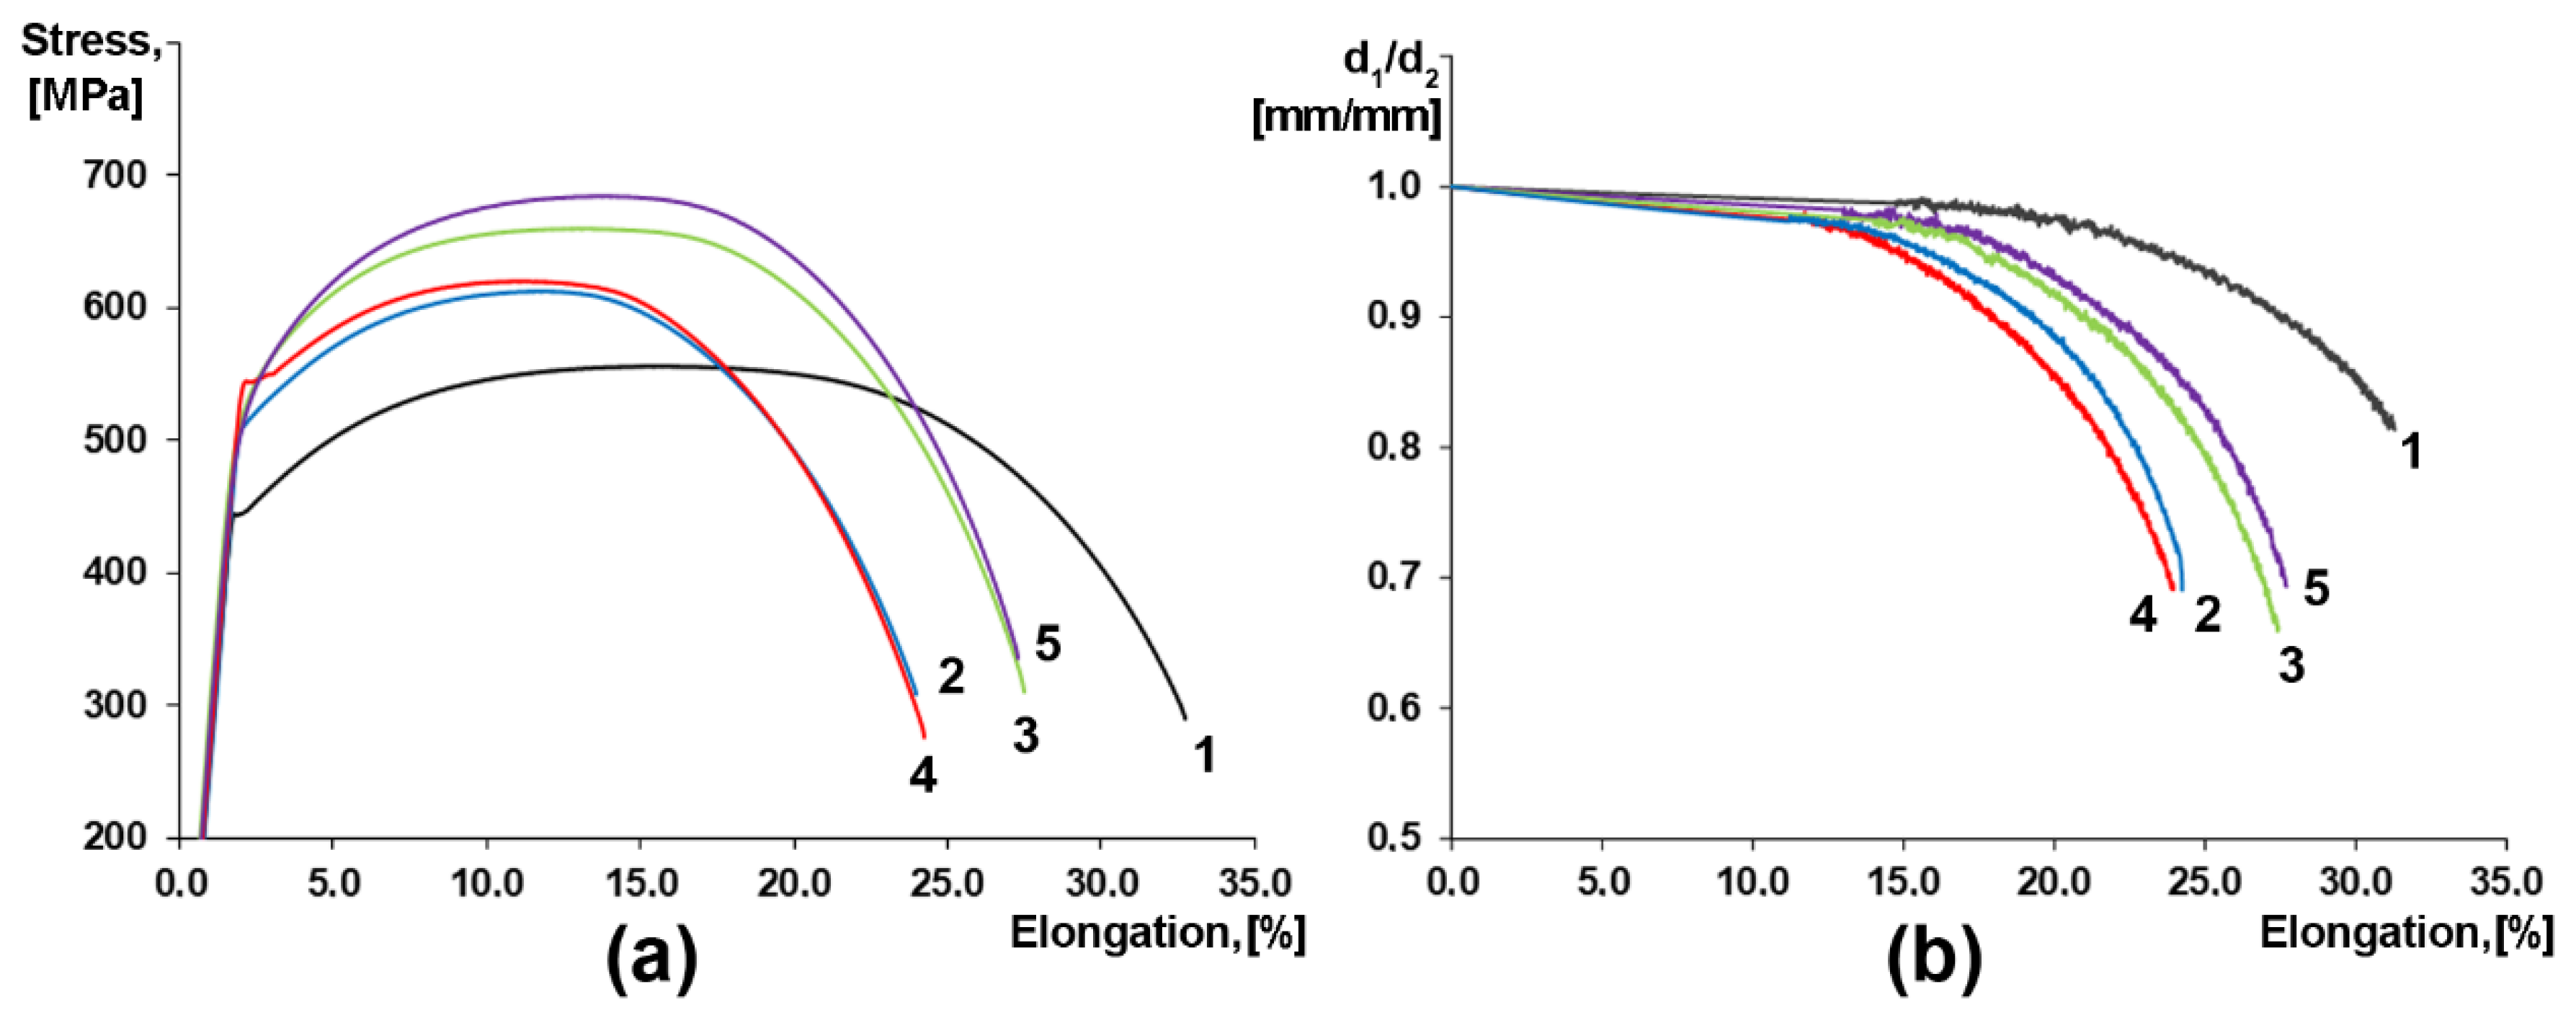
3.3. Tensile Testing
4. Discussion
5. Conclusions
- 1.
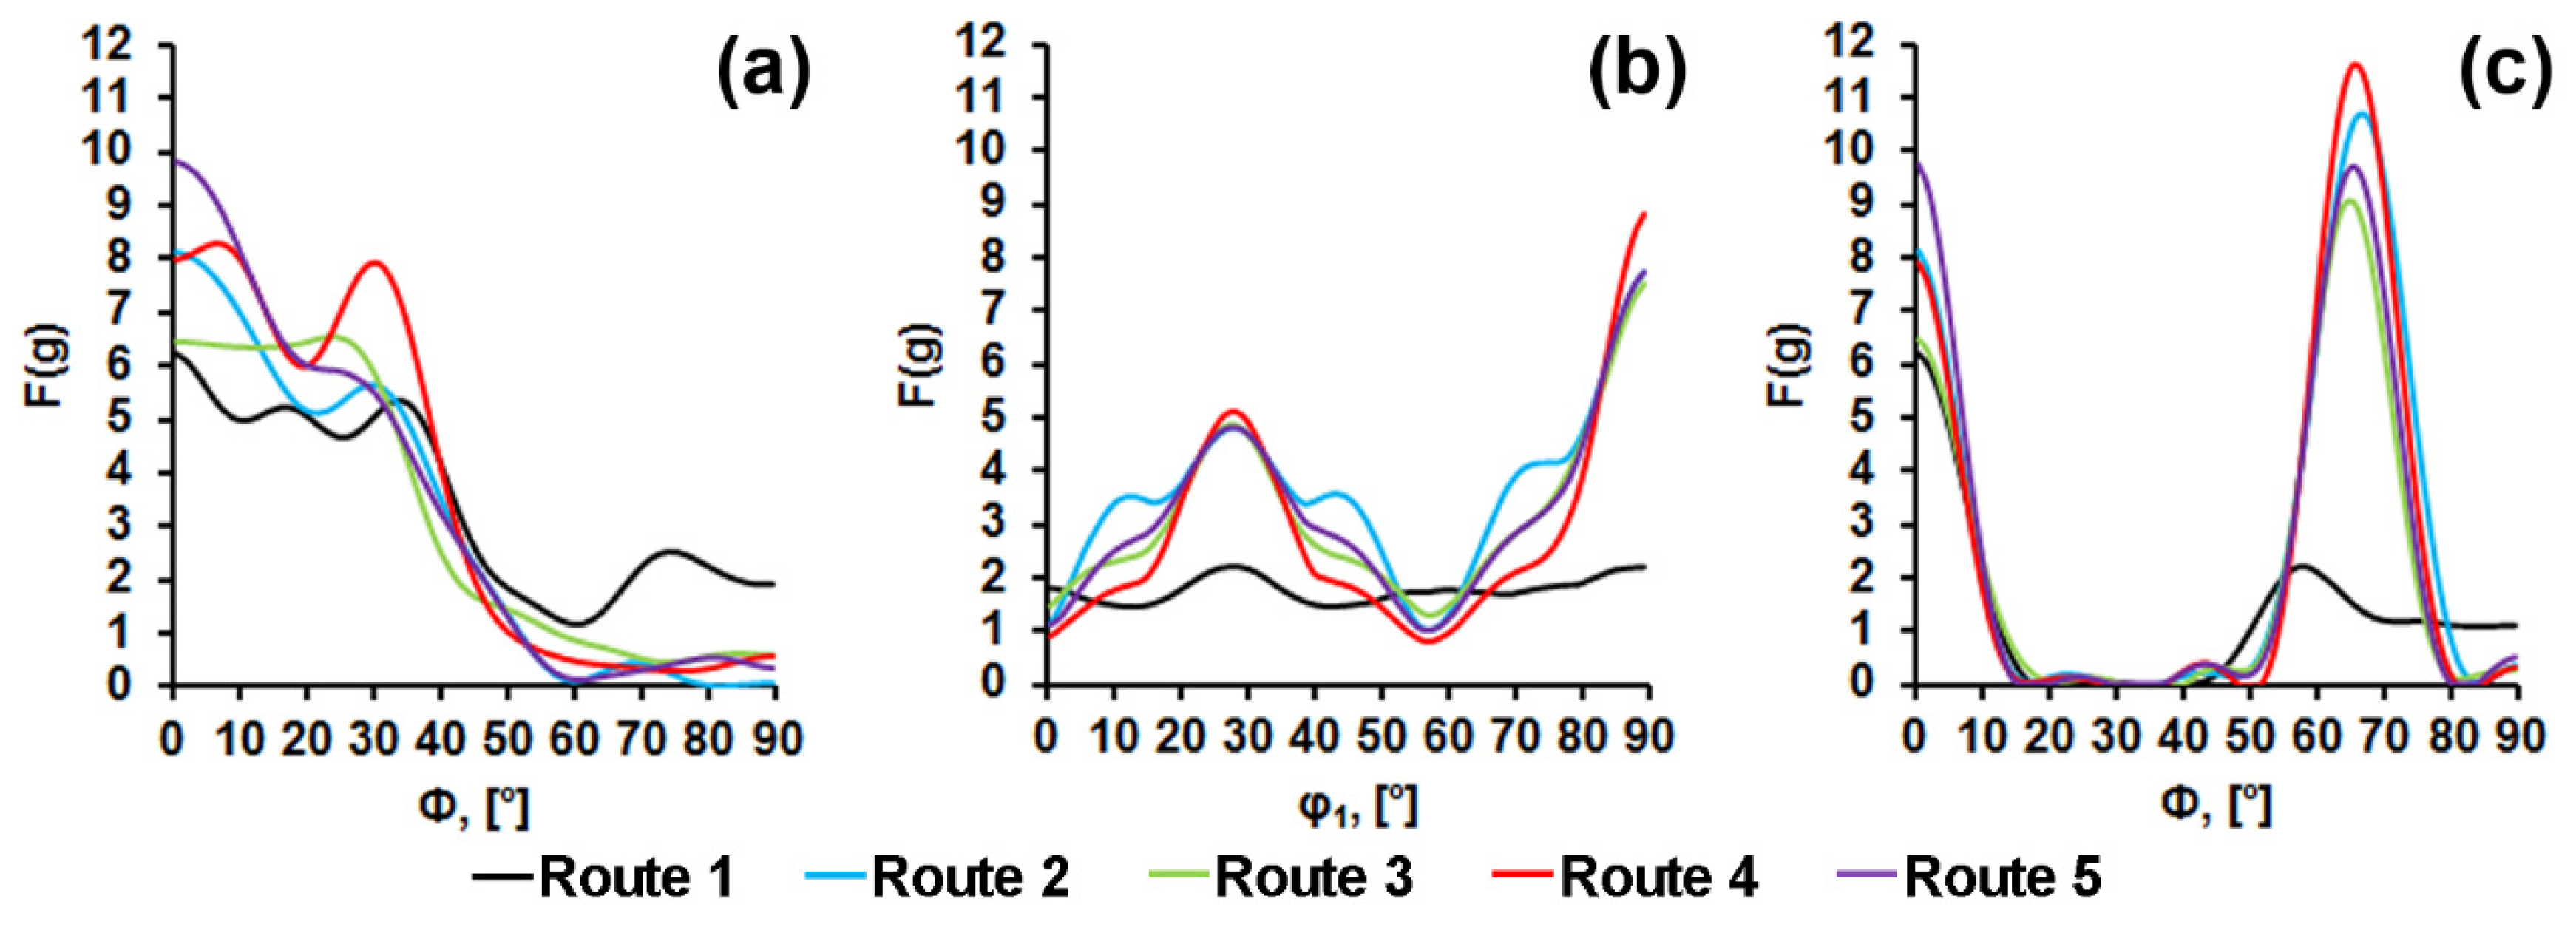
- The texture of the specimen central layers after all investigated TMCP routes was comprised of a number of scattered, and thus overlapping orientations: (001)[1−10], (114)[1−10], (112)[1−10], (223)[2−52], and (221)[−1−14]. Lowering the controlled rolling temperature and increasing the cooling rate were accompanied by a significant sharpening of the (223)[2−52], (221)[−1−14] orientations;
- 2.
- Orientation-averaged Taylor factor correlates with the plate yield stress measured in the transverse direction. The lowest YS was observed due to the greater grain size and increased fraction of soft {hhl}<110>-type orientations for the TMPC route with the highest finishing controlled rolling temperature above AC3;
- 3.
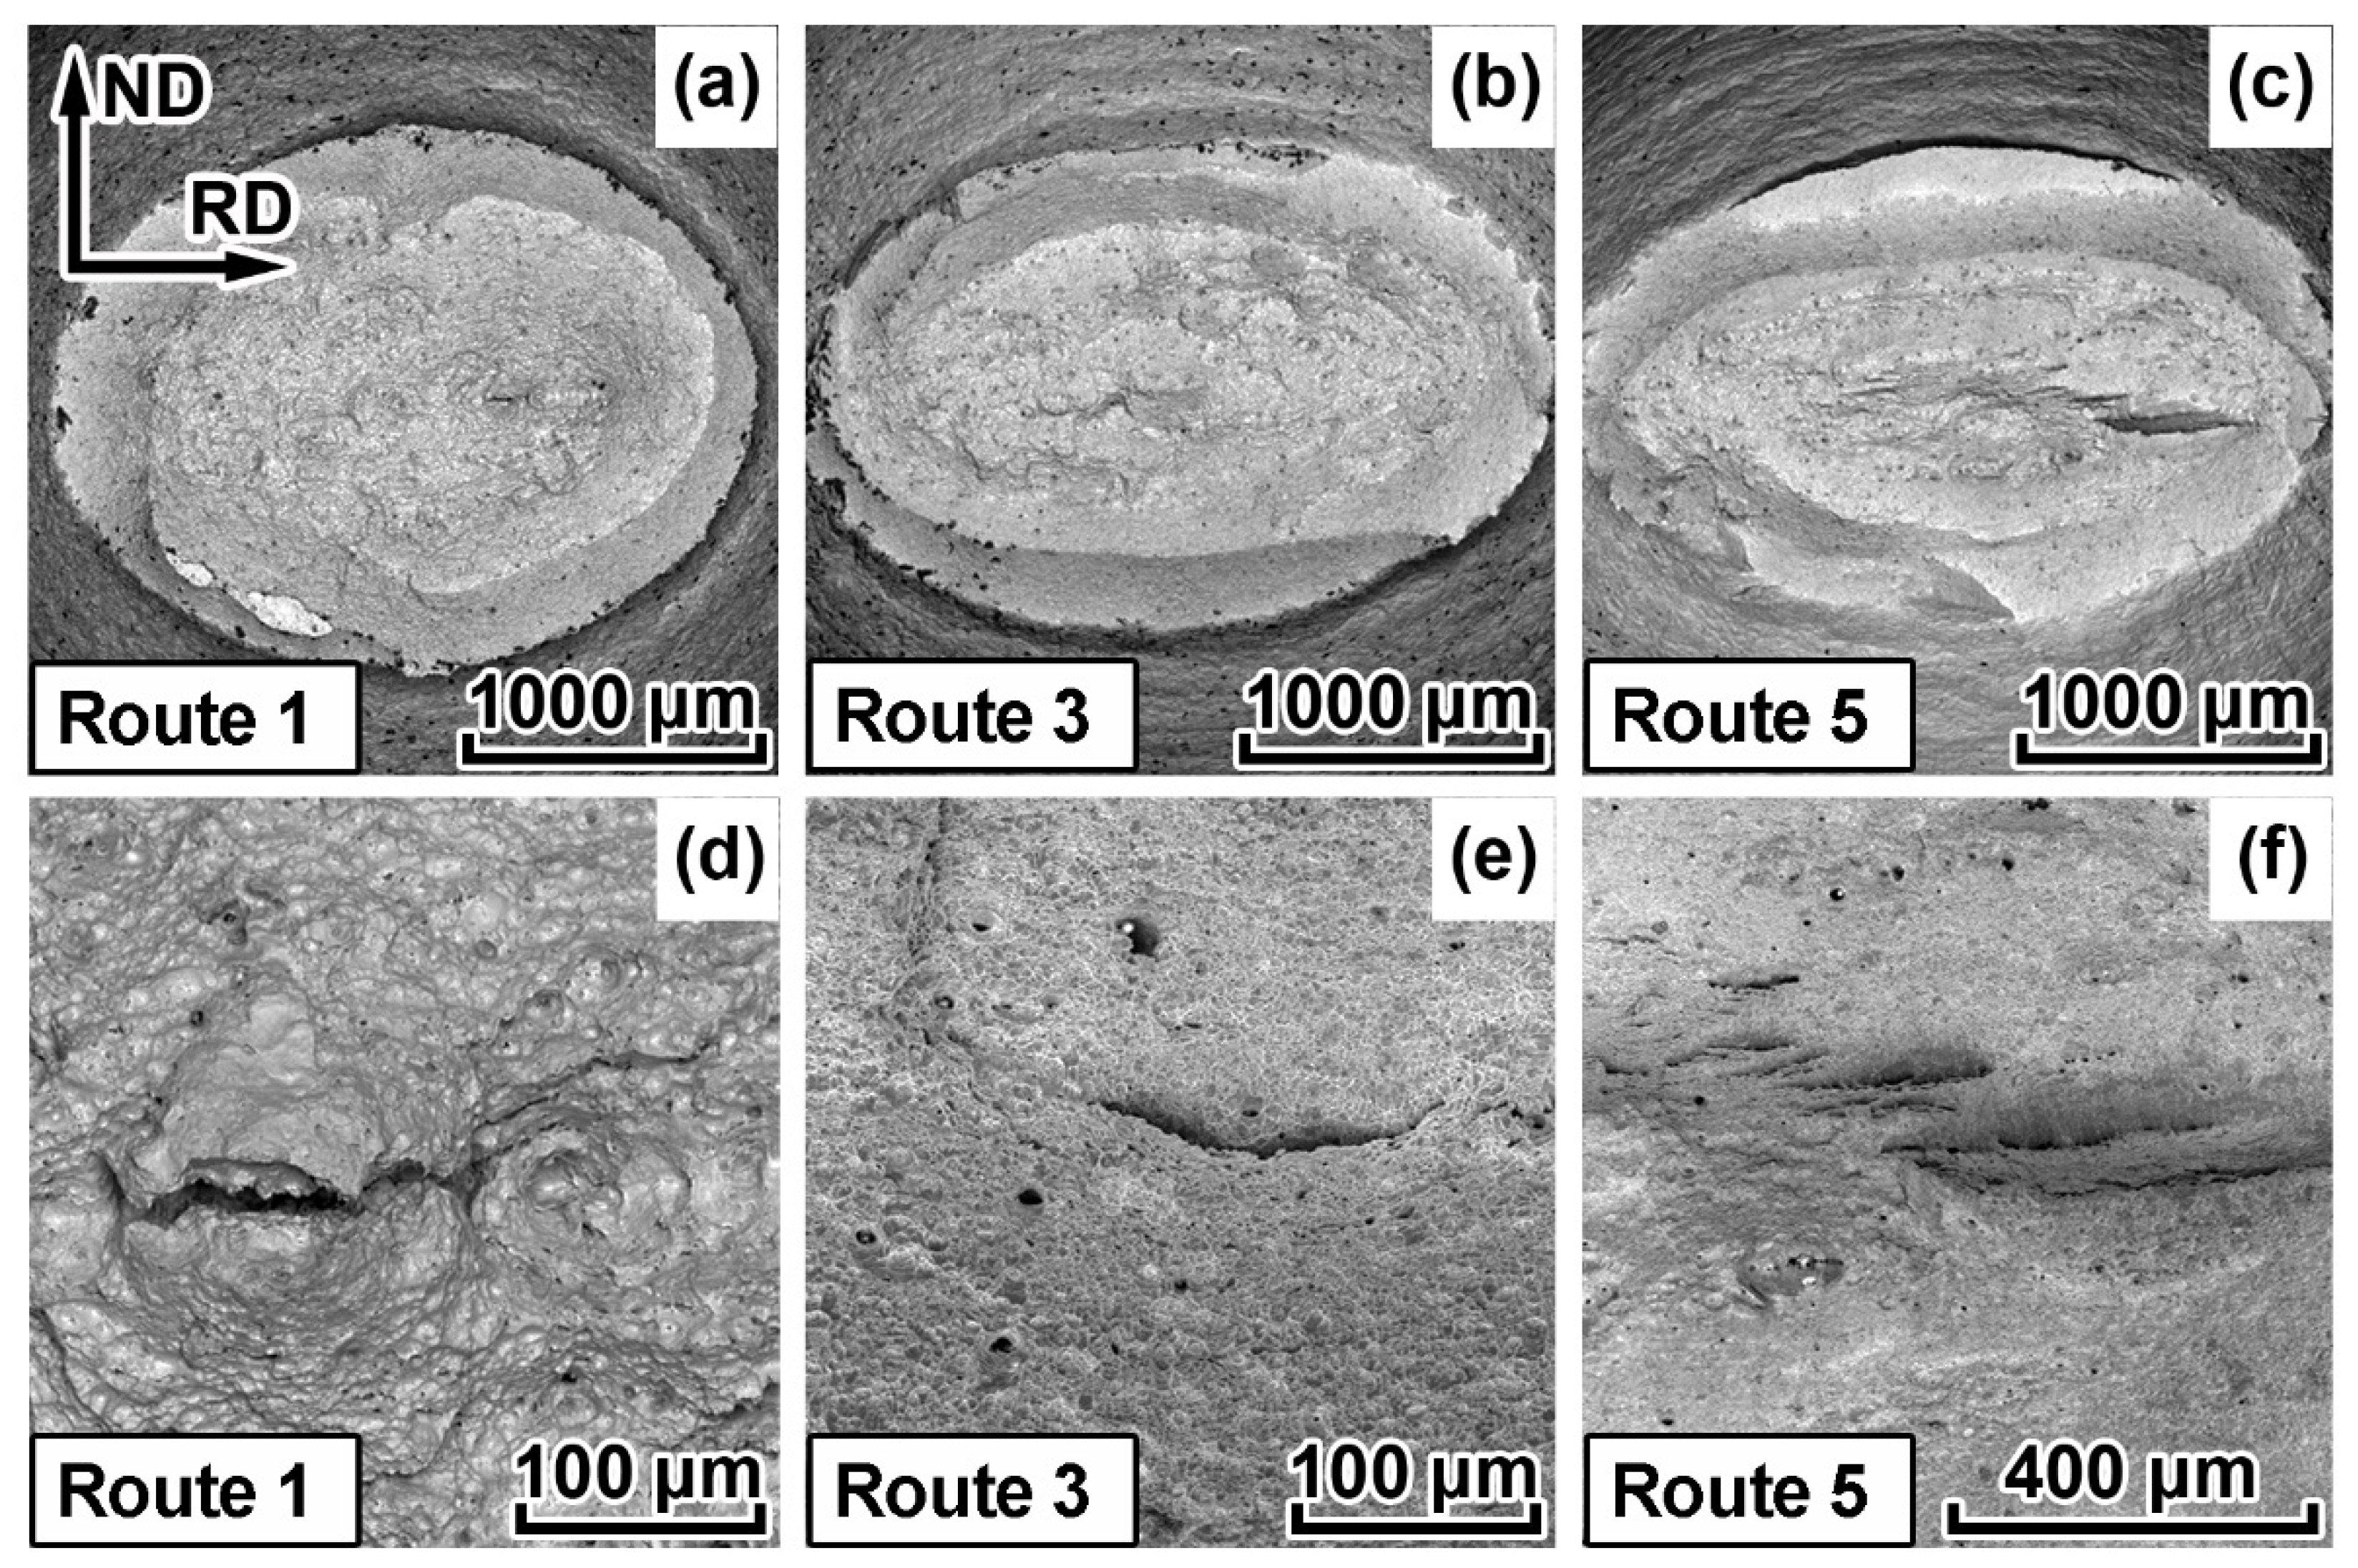
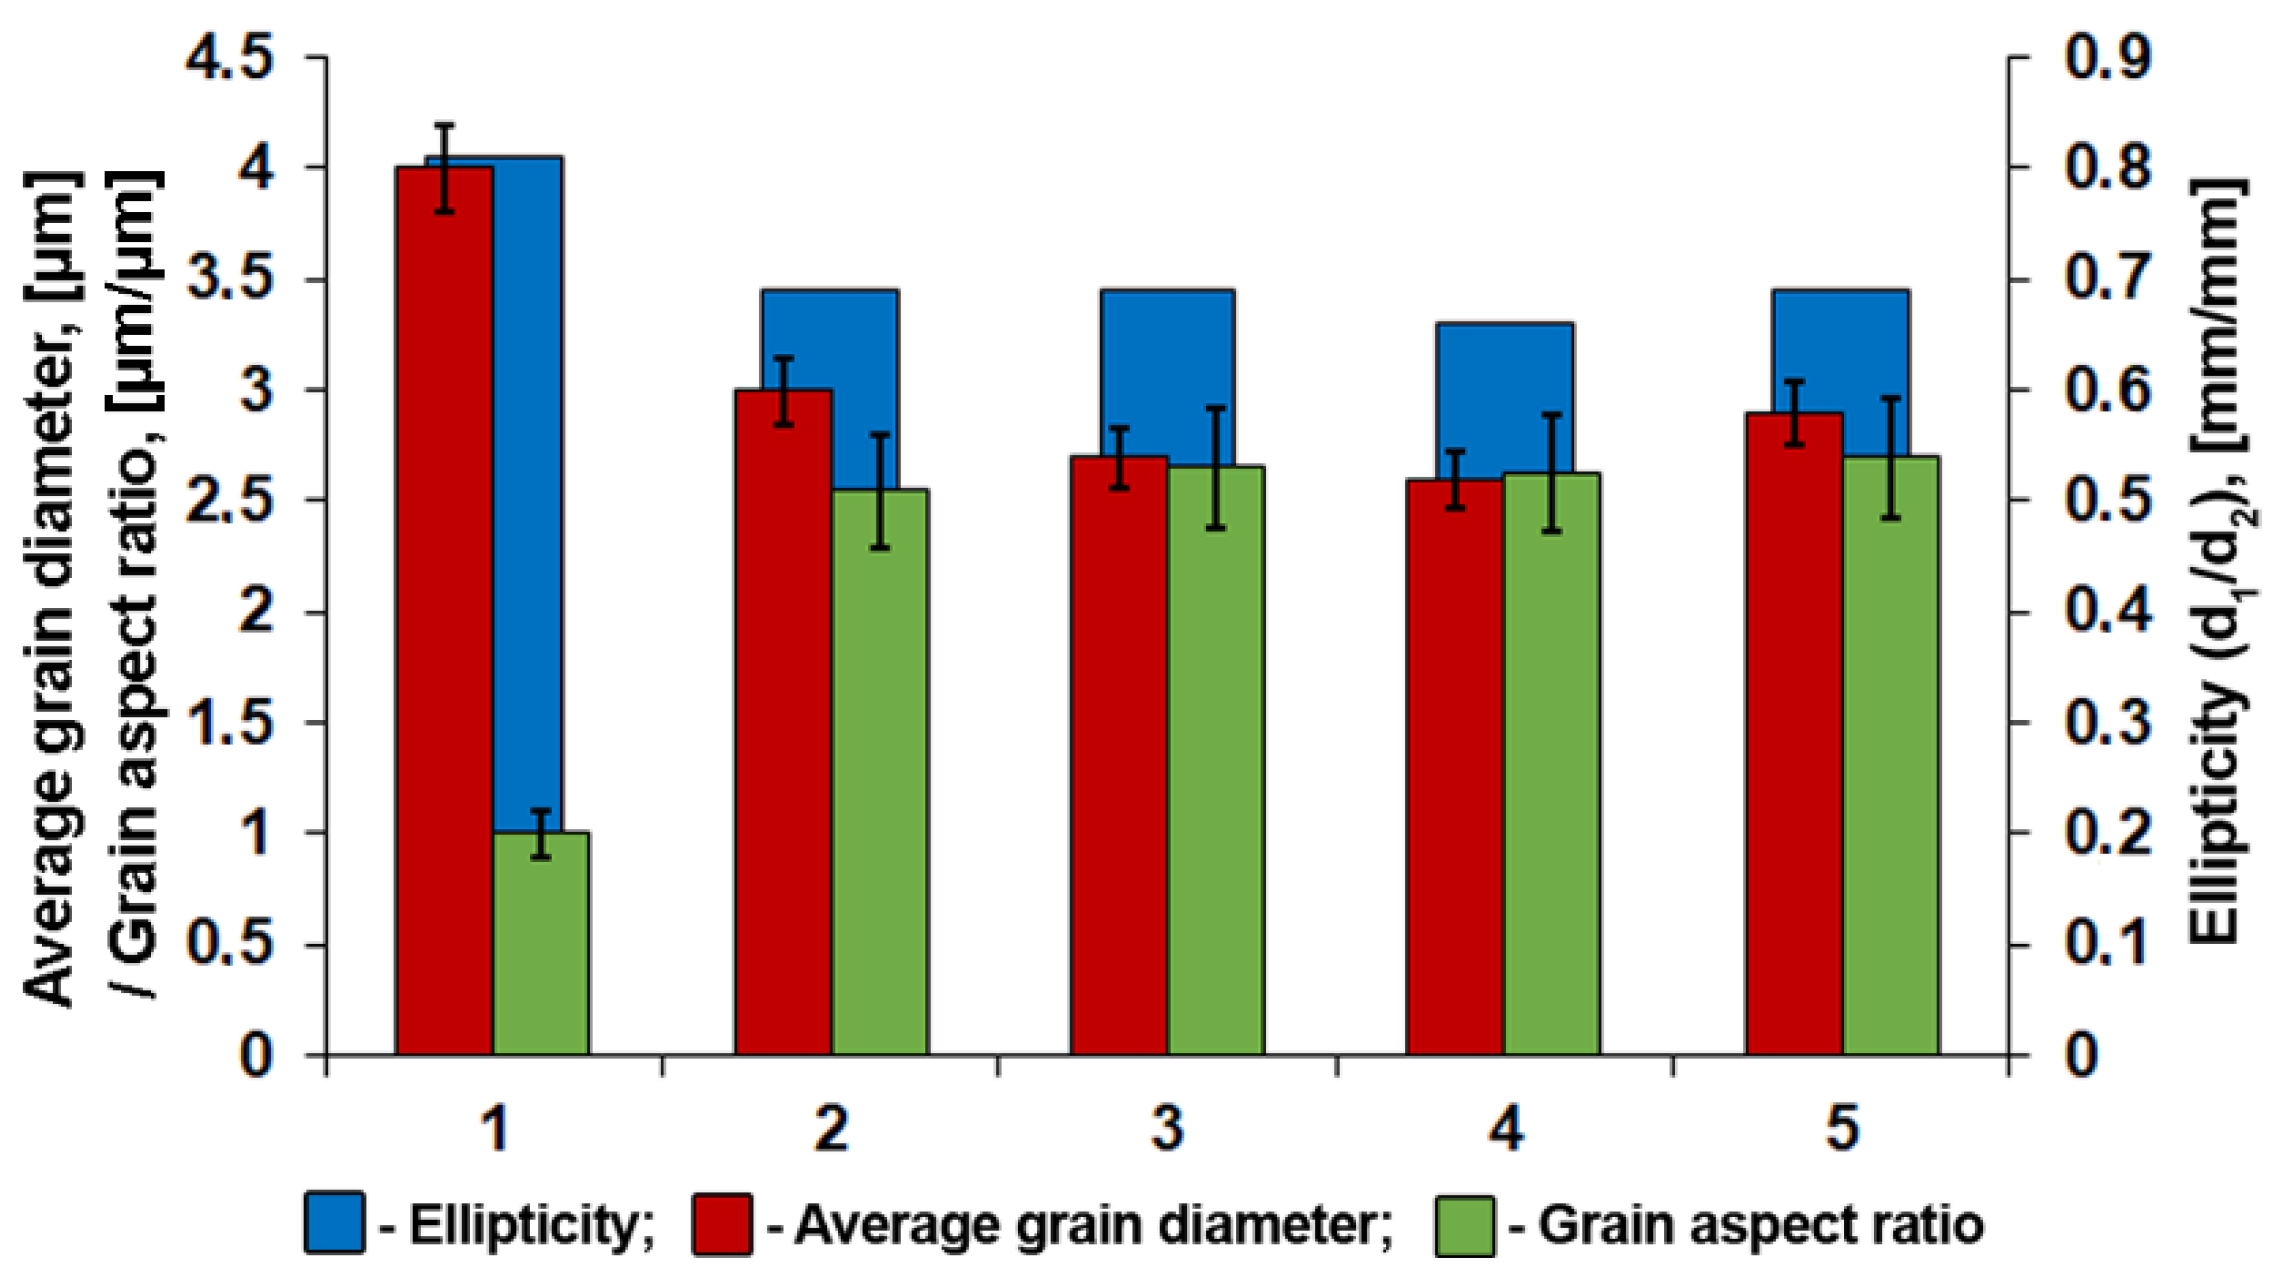
- Elongation to fracture of tensile specimens is determined by a combination of soft {hhl}<110> and hard (223)[2−52], (221)[−1−14] orientations relative to tension axis—TD. Ellipticity of the fracture area of tensile specimens decreases with a higher finishing rolling temperature and less pronounced texture;
- 4.
- The fracture of all studied specimens was accompanied by the development of splitting on the specimen fracture surface, similar to those that formed during the standard Charpy testing. More intense splitting was observed on the fracture surface of tensile specimens with a lower finishing controlled rolling temperature due to an increase in the fraction of ferrite deformed below AC3, which is characterized by {001}<110>-orientation.
Author Contributions
Funding
Institutional Review Board Statement
Informed Consent Statement
Data Availability Statement
Conflicts of Interest
References
- Singh, M.P.; Shukla, D.K.; Kumar, R.; Arora, K.S. The structural integrity of high-strength welded pipeline steels: A review. Int. J. Struct. Integr. 2020, 12, 470–496. [Google Scholar] [CrossRef]
- Nahal, M.; Khelif, R. A finite element model for estimating time-dependent reliability of a corroded pipeline elbow. Int. J. Struct. Integr. 2021, 12, 306–321. [Google Scholar] [CrossRef]
- Das, A.K. The present and the future of line pipe steels for petroleum industry. Mater. Manuf. Processes 2010, 25, 14–19. [Google Scholar] [CrossRef]
- Wang, W.; Yan, W.; Hu, P.; Wang, S.-T.; Shan, Y.-Y.; Yang, K. Research progress on high deformability pipeline steels. J. Iron Steel Res. 2011, 23, 1–6. [Google Scholar]
- Chatterjee, S.; Koley, S.; Das Bakshi, S.; Shome, M. Role of crystallographic texture, delamination and constraint on anisotropy in fracture toughness of API X70 line pipe steels. Mater. Sci. Eng. A 2017, 708, 254–266. [Google Scholar] [CrossRef]
- Morozov, Y.D.; Matrosov, M.Y.; Nastich, S.Y.; Arabei, A.B. New generation of high-strength tube steels with a ferrite-bainite structure. Metallurgist 2008, 52, 450–456. [Google Scholar] [CrossRef]
- Nastich, S.Y.; Kornilov, V.L.; Morozov, Y.D.; Denisov, S.V.; Molostov, M.A. New steels for pipelines of strength classes K54-K60 (X70): Production experience at OAO MMK. Steel Transl. 2009, 39, 431–436. [Google Scholar] [CrossRef]
- Shukla, R.; Ghosh, S.K.; Chakrabarti, D.; Chatterjee, S. Microstructure, texture, property relationship in thermo-mechanically processed ultra-low carbon microalloyed steel for pipeline application. Mater. Sci. Eng. A 2013, 587, 201–208. [Google Scholar] [CrossRef]
- Khulka, K.; Peters, P.; Khajsterkamp, F. Trends in developing steels for producing the tubes of a large diameter. Stal’ 1997, 10, 62–67. [Google Scholar]
- Zhao, M.-C.; Yang, K.; Shan, Y. The effects of thermo-mechanical control process on microstructures and mechanical properties of a commercial pipeline steel. Mater. Sci. Eng. A 2002, 335, 14–20. [Google Scholar] [CrossRef]
- Endo, S.; Nakata, N. Development of Thermo-Mechanical Control Process (TMCP) and high performance steel in JFE Steel. JFE Tech. Rep. 2015, 20, 1–7. [Google Scholar]
- Roccisano, A.; Nafisi, S.; Stalheim, D.; Ghomashchi, R. Effect of TMCP rolling schedules on the microstructure and performance of X70 steel. Mater. Charact. 2021, 178, 111207. [Google Scholar] [CrossRef]
- Baig, M.; El-Danaf, E.; Soliman, M.; Almajid, A.; Alshalfan, W.; Alhajeri, K. Mechanical properties, microstructure and toughness assessment of a X70 pipeline steel. Mater. Mater. Test. 2015, 57, 897–903. [Google Scholar] [CrossRef]
- Fan, Y.-H.; Fan, X.-M.; Wei, W.; Shan, Y.-Y.; Yang, K. Study on continuous cooling transformation of high strength pipeline steel. Cailiao Rechuli Xuebao/Trans. Mater. Heat Treat. 2008, 29, 62–65. [Google Scholar]
- Sung, H.K.; Shin, S.Y.; Hwang, B.; Lee, C.G.; Kim, N.J.; Lee, S. Effects of carbon equivalent and cooling rate on tensile and Charpy impact properties of high-strength bainitic steels. Mater. Sci. Eng. A 2011, 530, 530–538. [Google Scholar] [CrossRef]
- Morozov, Y.D.; Nastich, S.Y.; Matrosov, M.Y.; Chevskaya, O.N. Obtaining high-quality properties of rolled material for large-diameter pipes based on formation of ferrite-bainite microstructure. Metallurgist 2008, 52, 21–28. [Google Scholar] [CrossRef]
- Matrosov, M.Y.; Kichkina, A.A.; Efimov, A.A.; Éfron, L.I.; Bagmet, O.A. Simulating structure-forming processes in tube steels during controlled rolling with accelerated cooling. Metallurgist 2007, 51, 367–376. [Google Scholar] [CrossRef]
- Pyshmintsev, I.Y.; Smirnov, M.A. Structure and Mechanical Properties and Pipeline Steels [Struktura i Svojstva Stalej Dlya Magistral’nyh Truboprovodov]; UMC: Ekaterinburg, Russia, 2019; pp. 5–40. [Google Scholar]
- Zhu, X.-K. State-of-the-art review of fracture control technology for modern and vintage gas transmission pipelines. Eng. Fract. Mech. 2015, 148, 260–280. [Google Scholar] [CrossRef]
- Zhuang, Z.; O’Donoghue, P.E. The recent development of analysis methodology for rapid crack propagation and arrest in gas pipelines. Int. J. Fract. 2000, 101, 269–290. [Google Scholar] [CrossRef]
- Pyshmintsev, I.Y.; Struin, A.O.; Gervasyev, A.M.; Lobanov, M.L.; Rusakov, G.M.; Danilov, S.V.; Arabey, A.B. Effect of bainite crystallographic texture on failure of pipe steel plates made by controlled thermomechanical treatment. Metallurgist 2016, 60, 405–412. [Google Scholar] [CrossRef]
- Lobanov, M.L.; Danilov, S.V.; Urtsev, V.N. Effect of structure and texture on failure of pipe steel plates produced by TMCP. IOP Conf. Ser. Mater. Sci. Eng. 2020, 709, 044010. [Google Scholar] [CrossRef]
- Gervasyev, A.; Pyshmintsev, I.; Petrov, R.; Huo, C.; Barbaro, F. Splitting susceptibility in modern X80 pipeline steels. Mater. Sci. Eng. A 2020, 772, 138746. [Google Scholar] [CrossRef]
- Farber, V.M.; Khotinov, V.A.; Belikov, S.V.; Selivanova, O.V.; Lezhnin, N.V.; Morozova, A.N.; Karabonalov, M.S.; Zhilyakov, A.Y. Separations in steels subjected to controlled rolling, followed by accelerated cooling. Phys. Met. Metallogr. 2016, 117, 407–421. [Google Scholar] [CrossRef]
- Masoumi, M.; Mohtadi-Bonab, M.A.; de Abreu, H.F.G. Effect of Microstructure and Texture on Anisotropy and Mechanical Properties of SAE 970X Steel Under Hot Rolling. J. Mater. Eng. Perform. 2016, 25, 2847–2854. [Google Scholar] [CrossRef]
- Hara, T.; Asahi, H.; Shinohara, Y.; Terada, Y. Effects of microstructure and texture on DWTT properties for high strength line pipe steels. In Proceedings of the Biennial International Pipeline Conference, IPC, Calgary, AB, Canada, 25–29 September 2007; Volume 3, pp. 245–250. [Google Scholar]
- Farber, V.M.; Khotinov, V.A.; Morozova, A.N.; Martin, T. Separations and Their Contribution into the Impact Toughness of Steels of Strength Class K65 (X80). Met. Sci. Heat Treat. 2015, 57, 487–491. [Google Scholar] [CrossRef]
- Arabei, A.B.; Pyshmintsev, I.Y.; Shtremel’, M.A.; Glebov, A.G.; Struin, A.O.; Gervas’ev, A.M. Resistance of X80 steel to ductile-crack propagation in major gas lines. Steel Transl. 2009, 39, 719–724. [Google Scholar] [CrossRef]
- Mirzaev, D.A.; Yakovleva, I.L.; Tereshchenko, N.A.; Gervas’eva, I.V.; Shaburov, D.V.; Panov, A.V. Structural aspect of delamination crack formation during the HTMT of steels with a ferritic structure. Phys. Met. Metallogr. 2008, 106, 186–194. [Google Scholar] [CrossRef]
- Akhtar, M.N.; Khan, M.; Khan, S.A.; Afzal, A.; Subbiah, R.; Ahmad, S.N.; Husain, M.; Butt, M.M.; Othman, A.R.; Bakar, E.A. Determination of Non-Recrystallization Temperature for Niobium Microalloyed Steel. Materials 2021, 14, 2639. [Google Scholar] [CrossRef]
- Humphreys, F.J. Grain and subgrain characterisation by electron backscatter diffraction. J. Mater. Sci. 2001, 36, 3833–3854. [Google Scholar] [CrossRef]
- Erpalov, M.V.; Khotinov, V.A. Optical method to study post-necking material behavior. AIP Conf. Proc. 2020, 2288, 030007. [Google Scholar]
- Humphreys, J.; Rohrer, G.S.; Rollett, A. Recrystallization and Related Annealing Phenomena, 3rd ed.; Elsevier: Oxford, UK, 2017; pp. 21–26. [Google Scholar]
- Lobanov, M.L.; Krasnov, M.L.; Urtsev, V.N.; Danilov, S.V.; Pastukhov, V.I. Effect of Cooling Rate on the Structure of Low-Carbon Low-Alloy Steel After Thermomechanical Controlled Processing. Met. Sci. Heat Treat. 2019, 61, 32–38. [Google Scholar] [CrossRef]
- Caballero, F.G.; Capdevila, C.; Chao, J.; Cornide, J.; Carcia-Mateo, C. The Microstructure of Continuously Cooled Tough bainitic Steels; National Center for Metallurgical Research (CENIM-CSIC): Madrid, Spain, 2010; pp. 1–8. [Google Scholar]
- Lobanov, M.L.; Borodina, M.D.; Danilov, S.V.; Pyshmintsev, I.Y.; Struin, A.O. Texture Inheritance on Phase Transition in Low-Carbon, Low-Alloy Pipe Steel after Thermomechanical Controlled Processing. Steel Transl. 2017, 47, 710–716. [Google Scholar] [CrossRef]
- Hutchinson, B.; Ryde, L.; Lindh, E.; Tagashira, K. Texture in hot rolled austenite and resulting transformation products. Mater. Sci. Eng. A 1998, 257, 9–17. [Google Scholar] [CrossRef]
- Yang, X.-L.; Xu, Y.-B.; Tan, X.-D.; Wu, D. Influences of crystallography and delamination on anisotropy of Charpy impact toughness in API X100 pipeline steel. Mater. Sci. Eng. A 2014, 607, 53–62. [Google Scholar] [CrossRef]
- Danilov, S.V.; Urtsev, N.V.; Maslennikov, K.B.; Urtsev, V.N.; Lobanov, M.L. Influence of structural and textural states of low-carbon steels on the cracking resistance of tube products. AIP Conf. Proc. 2020, 2315, 030006. [Google Scholar]
- Nguyen-Minh, T.; Sidor, J.J.; Petrov, R.H.; Kestens, L.A.I. Occurrence of shear bands in rotated Goss ({110}<110>) orientations of metals with bcc crystal structure. Scr. Mater. 2012, 67, 935–938. [Google Scholar] [CrossRef]
- Clarke, A.P.; Humphreys, F.J.; Bate, P.S. Lattice rotations at large second-phase particles in polycrystalline aluminium. Mater. Sci. Forum 2003, 426–432, 399–404. [Google Scholar] [CrossRef]
- Morita, M.; Umezawa, O. Analysis of crystal rotation by Taylor theory. Conf. Proc. Soc. Exp. Mech. Ser. 2011, 5, 91–96. [Google Scholar]


| Route | TCR/°C | VCR/°C/s | Average Grain/μm | YS/MPa | UTS/MPa | Non-Uniform Elongation/% | Total Elongation/% |
|---|---|---|---|---|---|---|---|
| 1 | 920 | 25–45 | 4.0 ± 0.8 | 445 ± 15 | 560 ± 18 | 17.5 ± 1.0 | 30.0 ± 1.0 |
| 2 | 840 | 20–30 | 3.0 ± 0.4 | 515 ± 11 | 610 ± 12 | 14.0 ± 1.0 | 23.0 ± 1.0 |
| 3 | 840 | 25–35 | 2.7 ± 0.4 | 515 ± 9 | 660 ± 11 | 16.5 ± 0.7 | 27.0 ± 0.7 |
| 4 | 760 | 15–20 | 2.6 ± 0.4 | 545 ± 9 | 620 ± 10 | 15.0 ± 0.5 | 24.0 ± 0.5 |
| 5 | 770 | 20–30 | 2.9 ± 0.4 | 515 ± 7 | 685 ± 13 | 15.0 ± 0.6 | 26.0 ± 0.6 |
| Route | X (RD) | Y (ND) | Z (TD) |
|---|---|---|---|
| 1 | 3.00 | 3.24 | 3.04 |
| 2 | 3.04 | 3.19 | 3.26 |
| 3 | 3.02 | 3.16 | 3.27 |
| 4 | 3.02 | 3.16 | 3.32 |
| 5 | 3.01 | 3.13 | 3.28 |
Publisher’s Note: MDPI stays neutral with regard to jurisdictional claims in published maps and institutional affiliations. |
© 2022 by the authors. Licensee MDPI, Basel, Switzerland. This article is an open access article distributed under the terms and conditions of the Creative Commons Attribution (CC BY) license (https://creativecommons.org/licenses/by/4.0/).
Share and Cite
Lobanov, M.L.; Khotinov, V.A.; Urtsev, V.N.; Danilov, S.V.; Urtsev, N.V.; Platov, S.I.; Stepanov, S.I. Tensile Deformation and Fracture Behavior of API-5L X70 Line Pipe Steel. Materials 2022, 15, 501. https://doi.org/10.3390/ma15020501
Lobanov ML, Khotinov VA, Urtsev VN, Danilov SV, Urtsev NV, Platov SI, Stepanov SI. Tensile Deformation and Fracture Behavior of API-5L X70 Line Pipe Steel. Materials. 2022; 15(2):501. https://doi.org/10.3390/ma15020501
Chicago/Turabian StyleLobanov, Mikhail L., Vladislav A. Khotinov, Vladimir N. Urtsev, Sergey V. Danilov, Nikolay V. Urtsev, Sergey I. Platov, and Stepan I. Stepanov. 2022. "Tensile Deformation and Fracture Behavior of API-5L X70 Line Pipe Steel" Materials 15, no. 2: 501. https://doi.org/10.3390/ma15020501
APA StyleLobanov, M. L., Khotinov, V. A., Urtsev, V. N., Danilov, S. V., Urtsev, N. V., Platov, S. I., & Stepanov, S. I. (2022). Tensile Deformation and Fracture Behavior of API-5L X70 Line Pipe Steel. Materials, 15(2), 501. https://doi.org/10.3390/ma15020501