Abstract
Non-destructive evaluation using ultrasonic pulse velocity (Vp) testing has extensive applications in the concrete industry. With advances in construction technology, the use of ground granulated blast furnace slag (GGBFS) as a partial replacement to cement in a concrete mix is growing in popularity primarily because it reduces the initial capital cost of raw materials and the associated energy costs. This paper investigates the effect of the water-to-cement (wc) ratio and the cement content replaced by GGBFS on the development with time of the ultimate compressive strength () and the compression wave velocity (Vp) of mortar. The results showed that in the case of mortar with higher percentages of GGBFS replacement (where nucleation surfaces are more abundant), increasing wc can increase but cause a decrease in Vp. The posterior hydration process is highly dependent upon the water particles in the mixture after the first stage of hydration. After 7 days of curing, experimental results show that the of slag blended cement mix design wc ratio of 0.6 surpassed the value of an Ordinary Portland cement. A regression model correlating the and Vp of slag blended mortar is developed, which can be used to predict at concrete ages ranging from 1 day to 28 days for mixes with GGBFS percentage replacement values ranging from 15% to 45%.
1. Introduction
Although concrete is a primary material in construction, increasing world demands have led to an increase in cement production and associated undesirable increases in carbon dioxide emissions. The incorporation of a range of recyclable materials or by-products has consequently become a primary focus in the industry as these materials can be used as partial replacements to cement in concrete production and hence provide positive environmental, economic and technological benefits.
One of the common by-products that can be used as cement substitution is ground granulated blast furnace slag (GGBFS). GGBFS is a by-product of the smelting process used to convert iron ore to pig iron. It is highly cementitious with the potential to improve the strength and durability of the concrete [1,2,3,4]. However, the heterogeneity and properties of concrete are strongly governed by the mixture composition and the hydration process. This reaction between water and the materials used in the design mix significantly influences compressive strength development [1,4].
GGBFS is finer than Ordinary Portland cement (OPC) and leads to a less porous structure with fewer capillary pores. Consequently, there is increased durability due to a denser microstructure with a finer distribution of pores however this is strongly governed by the degree of hydration. The interaction between GGBFS and cement grains at a microscopic level was examined by Escalante-Garca and Sharp [5], they indicated that the pozzolanic reaction rate is directly proportional to the particle size of replacement materials, and the effect of additional water available during the later stages of hydration.
Numerous studies investigated different aspects of slag blended mortars or concrete in terms of fresh and mechanical properties [6]. These studies have aimed to determine the optimal replacement percentage of OPC by GGBFS, while achieving the same or greater compressive strength. Many of these studies support the findings obtained in the investigation of Tasdemir et al. [7] who found that slag blended concretes tend to have slower compressive strength gain development than OPC concretes but may have similar or higher strength than OPC concretes at later ages.
Compression wave velocity (Vp) is frequently measured in ultrasonic pulse velocity (UPV) testing of concrete to evaluate and monitor the mechanical properties of concrete. Many empirical equations relating Vp with of a range of different concrete types have been established; a selection of reported relationships is summarised in Table 1. Najim et al. [8] suggested a linear relationship between Vp and while others involve higher order polynomials [9], logarithmic [10] or multivariable regression equations [11,12,13,14,15]. However, an exponential format is the most popular form, as presented in [3,11,16,17,18,19].

Table 1.
Established empirical equations for and Vp.
Demirboga et al. [3] reported that the Vp of concrete containing 60% and 70% of GGBFS was lower than OPC concrete. They also found that concrete with 50% GGBFS replacement has a relatively low early-age compressive strength but a strength comparable to OPC concrete at later ages. The investigation carried out by Turkmen et al. [19] showed that slag blended concrete with lower GGBFS replacement proportions of between 10% and 30% achieved approximately the same or greater compressive strength than OPC concrete after 28 days. These findings are also supported by Le et al. [18] with 30% of GGBFS replacement. All these studies confirmed that the concrete mixture composition has a variety of influences on and Vp.
It is evident from Table 1 that most of the established empirical correlations between and Vp are single parameter equations. In this study, different regression methods were utilised to predict the of 9 mortar mixes with slag blended cement and with GGBFS replacement proportions of 15%, 30% and 45%. In addition to that, Vp measurements are obtained to profile the impact on for mortars with varying degrees of GGBFS replacement. The test results were used to develop a strength prediction model which describes as a function of the pulse velocity (Vp), concrete age (d) and water-to-cement ratio (wc).
2. Materials and Methods
2.1. Materials
Ordinary Portland cement (OPC) was used for all the mixes examined in the present study, while 45/50 grade silica sand was employed as the natural fine aggregate. The GGBFS supplied by Australian Steel Mill Services Pty Ltd. (Bassendean, Australia) was used as a replacement for OPC. The chemical composition and physical properties of these constituents are summarised in Table 2, Table 3 and Table 4.
Table 2.
Chemical composition of cement, silica sand and ground granulated blast furnace slag (major components listed).
Table 3.
Physical properties of cement, silica sand and ground granulated blast furnace slag.
Table 4.
Natural fine sand aggregate distribution.
2.2. Mix Designs
In this case, 12 mortar mixtures, with proportion details listed in Table 5, were prepared for the investigation of the slag blended mortar. It is seen that the ratio of sand in the natural fine aggregate was fixed at twice the combined weight of OPC and GGBFS in all samples. Three different wc ratios were considered (0.4, 0.5 and 0.6). Additionally, three cement replacement percentages with GGBFS at levels of 15%, 30%, and 45% by the total cement weight were investigated. OPC mixes—CM-1, CM-2, and CM-3 were used to illustrate the influence of without any GGBFS. Superplasticizer (MasterEase3000 by BASF, Ludwigshafen, Germany) was also used to maintain adequate workability. The mortar mixtures were typically mixed for 5 to 7 mins before placement in cubic 100 mm wide moulds. These specimens were stored and cured at a temperature of 25 °C and humidity above 80%.
Table 5.
Mix proportions by weight.
2.3. Testing
Compressive strength tests were performed (using a Baldwin universal testing machine) on cube samples in accordance with ASTM C109-21 [21] after curing periods of 1, 4, 7, 14 and 28 days. Tests were performed on three specimens for each mix at a constant displacement rate of 0.5 mm/min.
An ultrasonic instrument developed and manufactured by Proceq, PUNDIT Lab+, (Schwerzenbach, Switzerland) was used to obtain measurements of Vp. The testing complied with several established standards such as ASTM C597-02 [22], BS 1881-203:1986 [23], CECS 21-2000 [24], BS EN 12504-4:2004 [25], ISI 13311-1:1992 [26], and ISO 1920-7:2004 [27]. The direct transmission method employed for this study involved a transducer pair (emitter and receiver) placed on opposite faces of the cubic specimens. During an ultrasonic measurement, a square-wave signal with 500 V excitation voltage and a pulse width of 9.3 μm and a nominal frequency of 54 kHz was generated by the PUNDIT Lab+ at a sampling rate of 2 MHz. Measurements of Vp were obtained for all specimens prior to compressive strength tests.
3. Test Results
3.1. Mechanical Compressive Strength
3.1.1. Influence of GGBFS as a Partial Replacement of Cement on Compressive Strength
Figure 1 shows the influence of different levels of partial replacement of cement with slag (15%, 30%, and 45%) by weight on values at curing ages of 1, 4, 7, 14, and 28 days for three different wc ratios (0.4, 0.5 and 0.6).
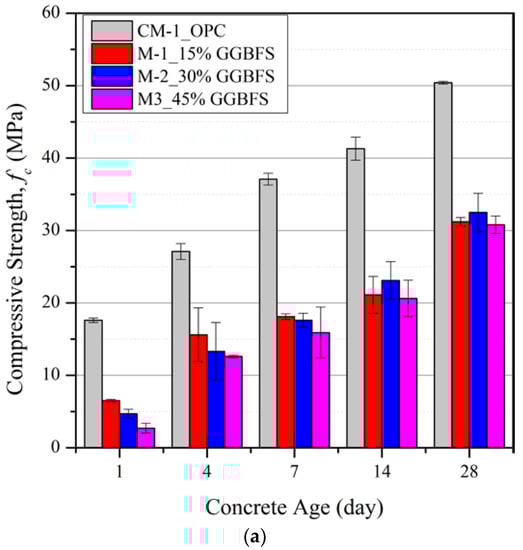
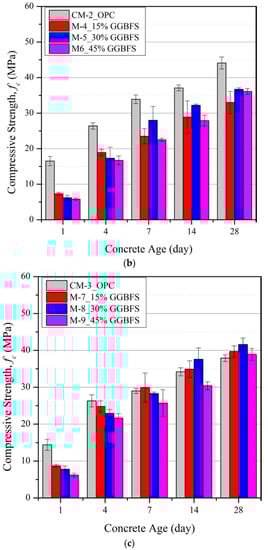
Figure 1.
Concrete strength development of mortar mixtures with: (a) wc = 0.4, (b) wc = 0.5 and (c) wc = 0.6.
The early age compressive strengths of all the slag blended mortar mixtures are significantly lower than the OPC mixes (CM-1 to CM-3). Despite this short-term negative effect, it is evident that the relative difference in strength between OPC mixes and those with GGBFS replacement reduces as the curing age increases and, for wc = 0.6, values for mixes with GGBFS replacement of between 15% and 45% exceed those of the OPC mix at later ages. The increase in compressive strengths arises due to the excess Calcium Silicate Hydrate (C-S-H) generated in the secondary hydration process between the SiO2 in the slag powder and alkaline calcium hydroxide (Ca(OH)2) generated in the primary hydration reaction [28]. The GGBFS reduces the enrichment of Ca(OH)2 crystals at the fine aggregate-cement interface and hence increases the bulk density by filling the voids and air gaps within the mixture and also reducing the overall size of the remaining Ca(OH)2 crystals [29]. This process only led to greater strengths compared with the OPC mix at wc = 0.6, suggesting that there is a limited supply of water in the mixture available for hydration reactions or the hydration by-product, Ca(OH)2, required for pozzolanic reactions when wc < 0.6 [30,31].
The of all slag blended mortars decreased with an increase in the GGBFS percentage in all three sets of wc ratio mixtures for curing periods up to 1 week. Between curing periods of 2 and 4 weeks, the slag blended mortars with 30% OPC replacement have the highest compared with replacement levels of 15% and 45%, indicating there is an optimal percentage replacement of about 30 %. Despite having more SiO2 contents in the slag blended mortars with 45 % OPC replacement, a reduction in OPC content leads to reduced production of Ca(OH)2 and vice versa.
3.1.2. Influence of wc Ratio on Compressive Strength of Slag Blended Mortars
The influence of wc on of slag blended mortars at 28 days is presented in Figure 2. For all the slag blended mortar mixtures investigated, a consistent trend for at 28 days to increase with wc ratio is evident. This can be explained, in part, by the greater availability of pore space for reactant dissolution and hydration product precipitation at the higher water content [1,32].
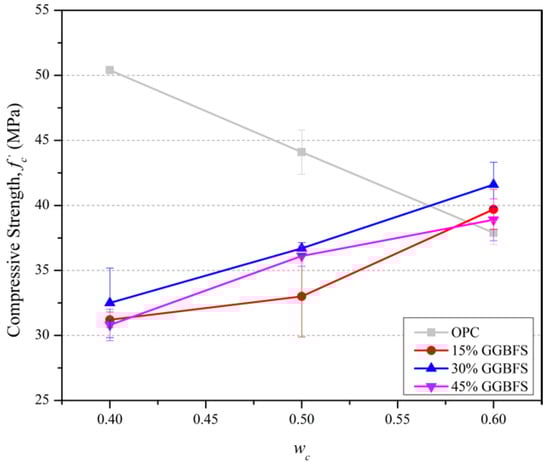
Figure 2.
Influence of water content on at 28 days.
The water in the concrete paste exists as non-evaporable water (chemically combined water), such as compound water and evaporable water in gel and capillary water. As the cement paste starts to set, the water evaporates leaving behind air voids that reduce the strength, density, and durability of cement mixtures. This process leads to the trend seen in Figure 2 of reducing with wc in the OPC control mixes. Incorporating fine GGBFS into OPC mixes assists in filling voids left by evaporation [1,2,3,4,33,34]. However, a large amount of GGBFS in the mixture to fill voids does not necessarily lead to greater compressive strength because of an insufficient supply of Ca(OH)2 generated by primary hydration of a reduced quantity of OPC. Consequently, there are excessive amounts of non-hydrated GGBFS fine powder particles. This present study found that the increase in wc generally leads to greater values for slag blended mortar mixtures (for the replacement percentages of 15% to 45%).
3.2. Ultrasonic Pulse Velocity (Vp)
3.2.1. Influence of GGBFS as a Partial Replacement of OPC on Vp
Figure 3 illustrates the influence on Vp of different levels of partial replacement of cement with GGBFS (15%, 30%, and 45%) at curing ages of 1, 4, 7, 14 and 28 days for three different wc ratios (0.4, 0.5 and 0.6). It is seen that, as for the trends with , the mean early age Vp of slag blended mortar mixtures at a constant wc is significantly less than the OPC mix. This trend reflects the slower initial hydration process as the hydration of GGBFS only begins once the alkaline level in the mixture reaches a threshold value [30,31]. From a curing period of about one week onwards, the slag blended mortar mixtures with 30% GGBFS replacement show a greater rate of Vp development with time compared to the mixes with 15% and 45% GGBFS replacements. This trend is consistent with the optimal GGBFS replacement proportion of 30% for .
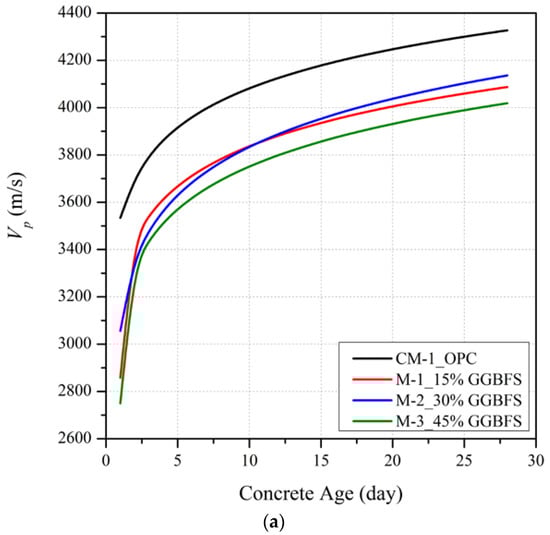
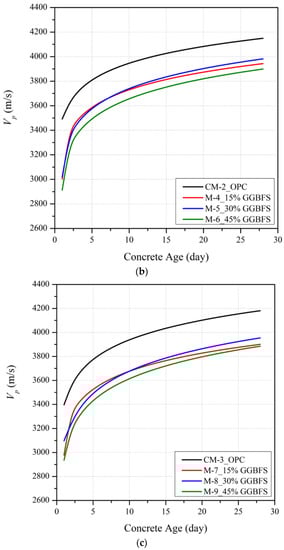
Figure 3.
Ultrasonic pulse velocity development for slag blended mortar mixes with wc of (a) 0.4, (b) 0.5 and (c) 0.6.
Although the of the mix with 30% GGBFS replacement at 28 days exceeded that of the OPC mix at wc = 0.6, it is seen on Figure 3 that Vp at this age is lower than the OPC mix at all wc ratios. The differences in Vp are significant with shortfalls in Vp at 28 days for slag blended mortars relative to the Vp for OPC of 6.6%, 4.4% and 8.1% for mixes with respective wc values of 0.4, 0.5 and 0.6.
3.2.2. Influence of wc on Vp of Slag Blended Mortars
The effect of wc on the mean value of Vp for all mixes at 28 days is shown in Figure 4, whilst the evolution of Vp in mixes categorized by GGBFS replacement percentages are shown in Figure 5. Vp decreases with increasing wc and the rate of decrease of the slag blended and OPC mortars is comparable. This trend contrasts with the variation of with wc shown in Figure 2 and arises because of the lower ratio of water to OPC in the slag blended mortars leading to a reduced efficiency of hydration. As the hydration kinetics of mineral cement grains and materials such as GGBFS is strongly dependent on the pore structure formation [35], excess water content increases in air void contents, the formation of micro cracks and pitting on the surface [36]. Consequently, the transmissivity of ultrasonic wave propagations through the mixture of cement, sand and GGBFS decreases with increasing wc due to wave dispersion and scattering caused by these capillary voids [37].
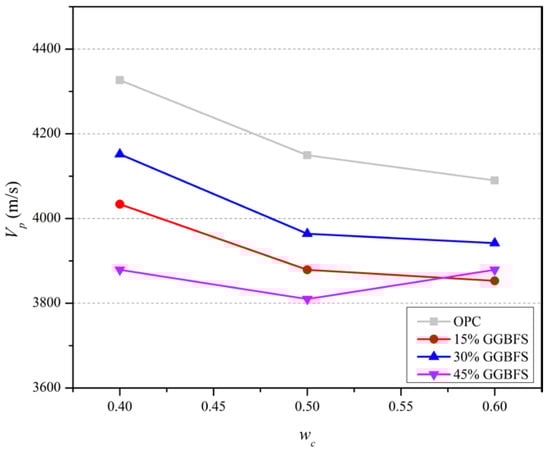
Figure 4.
Mean value of Vp at 28 days obtained by varying the amount of water content in slag blended mortar mixtures and OPC.
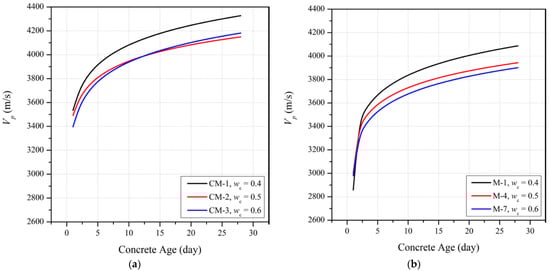
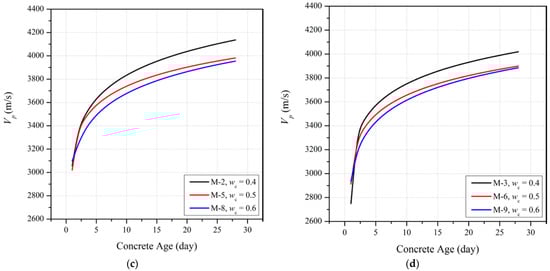
Figure 5.
Ultrasonic pulse velocity development for (a) OPC mix, slag blended mortars with (b) 15% cement replacement, (c) 30% cement replacement, and (d) 45% cement replacement with GGBFS.
3.3. Correlation between and Vp of Slag Blended Mortars
The relationship between and Vp for slag blended mortars is investigated using the experimental results from the current study combined with results from other tests on slag blended mortars reported in the literature [38,39,40,41]. Details from these other studies are summarised in Table 6.
Table 6.
Previous studies on slag blended mortars.
The compressive strength of concrete ( is generally estimated from the ultrasonic pulse velocity (Vp) using an expression with an exponential format.
where a and b are dependent on the mix composition.
The empirical coefficients (a and b) derived for each mixture with varying wc and s (GGBFS partial replacement percentage) values are summarised in Table 7, where and Vp have units of MPa and m/s, respectively. It is evident from the high coefficient of determination (R2) in the table that Equation (1) provides a good estimate of the relationship between and Vp but that the values of ‘a’ and ‘b’ vary with the mixture proportions.
Table 7.
Regression coefficients corresponding to each slag blended mixture.
The best fit single exponential trend line to all experimental data from the present study is plotted together with the data on Figure 6 and is given by:
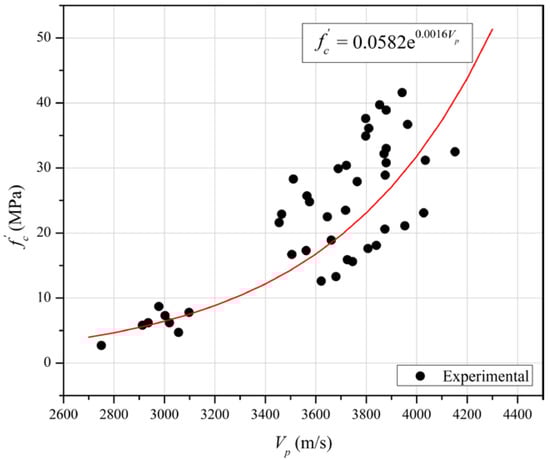
Figure 6.
The single exponential function correlation between ultrasonic pulse velocity (Vp) and compressive strength () from day 1 up to day 28.
Equation (2) has a poor R2 value compared to R2 values for the correlations for individual mixtures given in Table 6, highlighting the effect of the mix composition. A comparable low level of reliability is apparent on Figure 7, which plots the ratio of values calculated using Equation (2) to the measured values for the database of cases listed in Table 6 as well as those obtained in the current study. It is seen that the ratios of calculated to measured strengths typically vary between 1.5 and 0.66 and do not reveal a systematic dependence on the mortar mix. Calculated compressive strengths are generally higher than measured strengths for 20 MPa, reflecting the effects of time and slag replacement content evident in Figure 1.
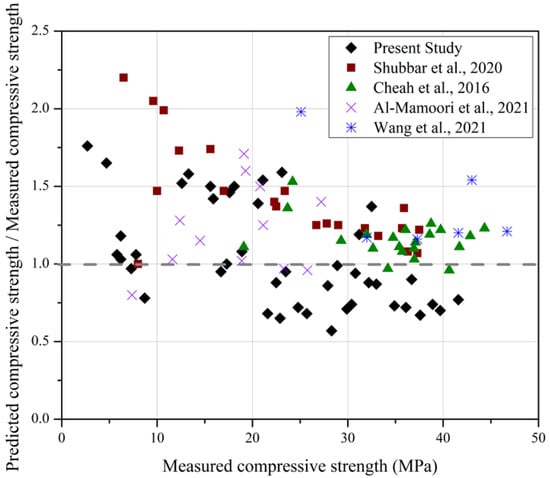
Figure 7.
Calculated compressive strength values-to-measured compressive strength values ratio using Equation (2) [38,39,40,41].
An analysis of variance (ANOVA) with a single degree of freedom (SF) and confidence interval of 95% was conducted on the data obtained from the present study to investigate the dependence of and Vp, concrete age (t), water-to-cement ratio (wc) and slag replacement percentage (s). The results from this analysis are provided in Table 8 and indicate that Vp, t, and wc are statically significant (with p-values less than 0.05) but that s is not significant (within the range investigated of 15% to 45%).
Table 8.
Analysis of variance among variables on .
Regression analysis of samples with and without slag replacement gave the following best fit expressions:
where is expressed in MPa, t is in days, and Vp is in m/s. Limits of applicability for Equation (3b) are as follows: 15% ≤ s ≤45%, 1 day ≤ t ≤ 28 days, 0.15 ≤ wc ≤0.6.
The high value of R2 for Equation (3a) indicates that a good estimate of (mortar) can be obtained for a given mix, knowing the value of Vp alone. Equation (3b) allows determination of the strength of the mortar with slag replacement by applying a correction for the curing period and water-to-cement ratio to the compressive strength of mortar with no slag present, (mortar). The coefficient of determination of R2 for Equation (3b) is significantly higher than that of Equation (2) due to the incorporation of the tendency for in mixes with slag replacement to reach that of (mortar) after long curing periods and the trend of reducing strength with increasing wc.
The suitability of Equation (3) results from the previous studies summarised in Table 6 is examined in Figure 8 which presents the ratios of calculated to measured values determined using Equation (3). In contrast to Figure 6, calculated values are typically within 15% of measured values and no systematic dependence on the strength value (and the curing period by inference) is observed. The good agreement with Equation (3) also indicates that the specific vs Vp relationship for the mortars described in Table 6 is similar to that of the mortar mix employed in the present study.
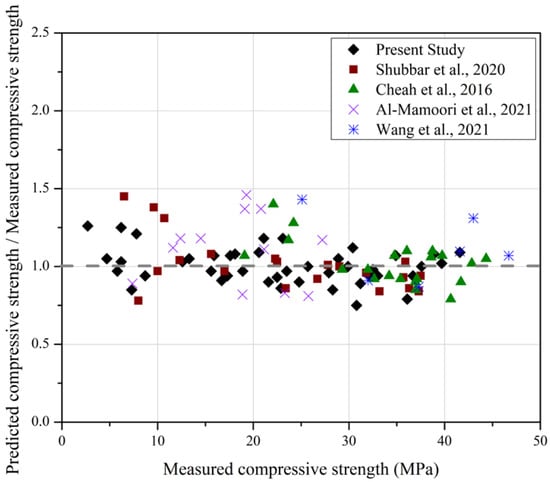
Figure 8.
Calculated compressive strength values-to-measured compressive strength values ratio using the proposed multivariable strength prediction model—Equation (3b) [38,39,40,41].
4. Conclusions
This study demonstrated the effect of partial replacement of cement with GGBFS in mortar and showed that:
- A slower hydration rate is observed during early ages (1-day to 14-day) but long-term strengths approach those of mortars without GGBFS. Previous research has shown that this is due to the specific characteristics of hydration kinetics of these material types.
- The compressive strength of mortars with GGBFS at a given curing period and water-to-cement ratio is relatively independent of the slag replacement percentage (s) for s values between 15% and 45%.
- The compressive strength of a given mortar mix without slag is well described by an exponential function of the ultrasonic velocity (Vp).
- The exponential relationship between compressive strength and ultrasonic velocity requires the application of a correction factor in mortars with slag replacement, where the correction factor is a function of time and water-to-cement ratio.
Author Contributions
Conceptualization, C.K.L., B.L., F.A.; methodology, C.K.L., B.L., F.A.; software C.K.L.; validation, C.K.L., B.L., F.A., A.M., S.M.; formal analysis, C.K.L.; investigation, C.K.L., B.L., F.A.; resources, F.A.; data curation, C.K.L., B.L.; writing—original draft preparation, C.K.L.; writing—review and editing, C.K.L., B.L., F.A., A.M., S.M.; visualization, C.K.L., B.L., F.A., A.M., S.M.; supervision, B.L., F.A.; project administration, B.L., F.A.; funding acquisition, B.L., F.A. All authors have read and agreed to the published version of the manuscript.
Funding
This research received no external funding.
Institutional Review Board Statement
Not applicable.
Informed Consent Statement
Not applicable.
Data Availability Statement
All the data is available within the manuscript.
Conflicts of Interest
The authors declare no conflict of interest.
References
- Chidiac, S.E.; Panesar, D.K. Evolution of mechanical properties of concrete containing ground granulated blast furnace slag and effects on the scaling resistance test at 28days. Cem. Concr. Compos. 2008, 30, 63–71. [Google Scholar] [CrossRef]
- Cyr, M.; Lawrence, P.; Ringot, E. Efficiency of mineral admixtures in mortars: Quantification of the physical and chemical effects of fine admixtures in relation with compressive strength. Cem. Concr. Res. 2006, 36, 264–277. [Google Scholar] [CrossRef]
- Demirboğa, R.; Türkmen, İ.; Karakoç, M.B. Relationship between ultrasonic velocity and compressive strength for high-volume mineral-admixtured concrete. Cem. Concr. Res. 2004, 34, 2329–2336. [Google Scholar] [CrossRef]
- Lawrence, P.; Cyr, M.; Ringot, E. Mineral admixtures in mortars effect of type, amount and fineness of fine constituents on compressive strength. Cem. Concr. Res. 2005, 35, 1092–1105. [Google Scholar] [CrossRef]
- Escalante-García, J.I.; Sharp, J.H. The microstructure and mechanical properties of blended cements hydrated at various temperatures. Cem. Concr. Res. 2001, 31, 695–702. [Google Scholar] [CrossRef]
- Rashad, A.M. An overview on rheology, mechanical properties and durability of high-volume slag used as a cement replacement in paste, mortar and concrete. Constr. Build. Mater. 2018, 187, 89–117. [Google Scholar] [CrossRef]
- Tasdemir, M.A.; Tasdemir, C.; Ozbek, E.; Altay, B. Fineness effect of GGBS on the properties and microstructure of concrete. In Proceedings of the 1st International Symposium on Mineral Admixtures in Cement, Istanbul, Turkey, 22–23 September 1997. [Google Scholar]
- Najim, K.B. Strength evaluation of concrete structures using ISonReb linear regression models: Laboratory and site (case studies) validation. Constr. Build. Mater. 2017, 149, 639–647. [Google Scholar] [CrossRef]
- Sitarz, M.; Hager, I.; Choińska, M. Evolution of Mechanical Properties with Time of Fly-Ash-Based Geopolymer Mortars under the Effect of Granulated Ground Blast Furnace Slag Addition. Energies 2020, 13, 1135. [Google Scholar] [CrossRef]
- Sturrup, V.; Vecchio, F.; Caratin, H. Pulse velocity as a measure of concrete compressive strength. Spec. Publ. 1984, 82, 201–228. [Google Scholar]
- Biswas, R.; Rai, B.; Samui, P. Compressive strength prediction model of high-strength concrete with silica fume by destructive and non-destructive technique. Innov. Infrastruct. Solut. 2021, 6, 65. [Google Scholar] [CrossRef]
- Kheder, G.; Al Gabban, A.; Abid, S. Mathematical model for the prediction of cement compressive strength at the ages of 7 and 28 days within 24 hours. Mater. Struct. 2003, 36, 693–701. [Google Scholar] [CrossRef]
- Rashid, K.; Waqas, R. Compressive strength evaluation by non-destructive techniques: An automated approach in construction industry. J. Build. Eng. 2017, 12, 147–154. [Google Scholar] [CrossRef]
- Saha, A.K.; Majhi, S.; Sarker, P.K.; Mukherjee, A.; Siddika, A.; Aslani, F.; Zhuge, Y. Non-destructive prediction of strength of concrete made by lightweight recycled aggregates and nickel slag. J. Build. Eng. 2021, 33, 101614. [Google Scholar] [CrossRef]
- Atici, U. Prediction of the strength of mineral admixture concrete using multivariable regression analysis and an artificial neural network. Expert Syst. Appl. 2011, 38, 9609–9618. [Google Scholar] [CrossRef]
- Gül, R.; Demirboğa, R.; Güvercin, T. Compressive strength and ultrasound pulse velocity of mineral admixtured mortars. Indian J. Eng. Mater. Sci. 2006, 13, 18–24. [Google Scholar]
- Trtnik, G.; Kavcic, F.; Turk, G. Prediction of concrete strength using ultrasonic pulse velocity and artificial neural networks. Ultrasonics 2009, 49, 53–60. [Google Scholar] [CrossRef]
- Le, D.-H.; Sheen, Y.-N.; Lam, M.N.-T. Fresh and hardened properties of self-compacting concrete with sugarcane bagasse ash–slag blended cement. Constr. Build. Mater. 2018, 185, 138–147. [Google Scholar] [CrossRef]
- Türkmen, I.; Öz, A.; Aydin, A. Characteristics of workability, strength, and ultrasonic pulse velocity of SCC containing zeolite and slag. Sci. Res. Essays 2010, 5, 2055–2064. [Google Scholar]
- Bogas, J.A.; Gomes, M.G.; Gomes, A. Compressive strength evaluation of structural lightweight concrete by non-destructive ultrasonic pulse velocity method. Ultrasonics 2013, 53, 962–972. [Google Scholar] [CrossRef]
- ASTM C109-21; Standard Test Method for Compressive Strength of Hydraulic Cement Mortars (Using 2-in or [50 mm] Cube Specimen). ASTM International: West Conshohocken, PA, USA, 2021.
- ASTM C597-02; Standard Test Method for Pulse Velocity Through Concrete. ASTM International: West Conshohocken, PA, USA, 2002.
- BS 1881-203:1986; Testing Concrete—Recommendations for Measurements of Velocity of Ultrasonic Pulses in Concrete. British Standard International: London, UK, 1986.
- CECS 21-2000; Technical Specification for Inspection of Concrete Defects by Ultrasonic Method. China Association for Engineering Construction Standardization Commitee of the Concrete Structure: Xi’an, China, 2000.
- BS EN 12504-4:2004; Testing Concrete—Determination of Ultrasonic Pulse Velocity. British Standard International: London, UK, 2004.
- ISI 13311-1:1992; Non-Destructive Testing of Concrete—Methods of Test, in Part 1—Ultrasonic Pulse Velocity. Bureau of Indian Standards: New Delhi, India, 1992.
- ISO 1920-7:2004; Testing of Concrete, in Part 7: Non-Destructive Tests on Hardened Concrete. The International Organization for Standardization: Geneva, Switzerland, 2004.
- Palod, R.; Deo, S.V.; Ramtekkar, G.D. Effect on mechanical performance, early age shrinkage and electrical resistivity of ternary blended concrete containing blast furnace slag and steel slag. Mater. Today Proc. 2020, 32, 917–922. [Google Scholar] [CrossRef]
- Xie, W.; Wang, P.; Li, S. Influence of fine slag powder content on the mechanical properties of concrete. J. North China Insitute Water Conserv. Hydroelectr. Power 2012, 33, 62–65. [Google Scholar]
- Lu, Y.; Ma, H.; Li, Z. Ultrasonic monitoring of the early-age hydration of mineral admixtures incorporated concrete using cement-based piezoelectric composite sensors. J. Intell. Mater. Syst. Struct. 2014, 26, 280–291. [Google Scholar] [CrossRef]
- Robeyst, N.; Gruyaert, E.; Grosse, C.U.; de Belie, N. Monitoring the setting of concrete containing blast-furnace slag by measuring the ultrasonic p-wave velocity. Cem. Concr. Res. 2008, 38, 1169–1176. [Google Scholar] [CrossRef]
- Bentz, D.P. Influence of water-cement ratio on hydration kinetics: Simple models based on spatial considerations. Cem. Concr. Res. 2006, 36, 238–244. [Google Scholar] [CrossRef]
- He, H.; Stroeven, P.; Stroeven, M.; Sluys, L.J. Influence of particle packing on elastic properties of concrete. Mag. Concr. Res. 2012, 64, 163–175. [Google Scholar] [CrossRef]
- Hobbs, S.V. A Study of Non-Evaporable Water Content in Cement-Based Mixtures with and without Pozzolanic Materials; Cornell University: Ithaca, NY, USA, 2001. [Google Scholar]
- Zeng, Q.; Li, K.; Fen-Chong, T.; Dangla, P. Pore structure characterization of cement pastes blended with high-volume fly-ash. Cem. Concr. Res. 2012, 42, 194–204. [Google Scholar] [CrossRef]
- Abo-Qudais, S.A. Effect of concrete mixing parameters on propagation of ultrasonic waves. Constr. Build. Mater. 2005, 19, 257–263. [Google Scholar] [CrossRef]
- Aggelis, D.; Polyzos, D.; Philippidis, T. Wave dispersion and attenuation in fresh mortar: Theoretical predictions vs. experimental results. J. Mech. Phys. Solids 2005, 53, 857–883. [Google Scholar] [CrossRef]
- Al-Mamoori, S.F.; Shubbar, A.A.; Al-Khafaji, Z.S.; Nasr, M.S.; Alkhayyat, A.; Al-Rifaie, A.; Hashim, K. Production of ternary blend binder as an alternative to portland cement. In IOP Conference Series: Materials Science and Engineering; IOP Publishing: Bristol, UK, 2021. [Google Scholar]
- Cheah, C.B.; Chung, K.Y.; Ramli, M.; Lim, G.K. The engineering properties and microstructure development of cement mortar containing high volume of inter-grinded GGBS and PFA cured at ambient temperature. Constr. Build. Mater. 2016, 122, 683–693. [Google Scholar] [CrossRef]
- Shubbar, A.A.; Jafer, H.; Abdulredha, M.; Al-Khafaji, Z.S.; Nasr, M.S.; Al Masoodi, Z.; Sadique, M. Properties of cement mortar incorporated high volume fraction of GGBFS and CKD from 1 day to 550 days. J. Build. Eng. 2020, 30, 101327. [Google Scholar] [CrossRef]
- Wang, H.Y.; Wang, W.C.; Wang, J.C.; Chen, Y.W. Evaluation of the engineering properties and durability of mortar produced using ground granulated blast-furnace slag and stainless steel reduced slag. Constr. Build. Mater. 2021, 280, 122498. [Google Scholar] [CrossRef]
Publisher’s Note: MDPI stays neutral with regard to jurisdictional claims in published maps and institutional affiliations. |
© 2022 by the authors. Licensee MDPI, Basel, Switzerland. This article is an open access article distributed under the terms and conditions of the Creative Commons Attribution (CC BY) license (https://creativecommons.org/licenses/by/4.0/).