Article

Influence of Sulfates on Formation of Ettringite during Early C3A Hydration

1
School of Materials Science and Engineering, Southeast University, Nanjing 211189, China
2
State Key Laboratory of High Performance Civil Engineering Materials, Jiangsu Sobute New Materials Co., Ltd., Nanjing 210008, China
*
Author to whom correspondence should be addressed.
Materials 2022, 15(19), 6934; https://doi.org/10.3390/ma15196934
Submission received: 31 August 2022 / Revised: 18 September 2022 / Accepted: 28 September 2022 / Published: 6 October 2022
(This article belongs to the Special Issue Advances of Chemical Admixtures for Modern Concrete)

Abstract

:
The hydration of C3A-gypsum systems was studied in the presence of various types of sulfates such as gypsum, hemihydrate and Na2SO4 in the first hour. The BET method combined with a DSC analysis enabled us to quantitatively characterize the amount of precipitated ettringite and its specific surface area along the hydration. It was found that sulfates not only affected the formation rate of ettringite, but also had a significant impact on the morphology of ettringite. For all the C3A-gypsum systems, a large part of the ettringite precipitated within the first 20 min and the specific surface area of the hydrated sample strongly increased within the first 5 min, whereas the specific surface area of ettringite gradually decreased along the C3A hydration reaction. Incorporating a small amount of Na2SO4 in the C3A-gypsum system could greatly promote the formation rate of ettringite in the first 20 min, and significantly decrease the specific surface area of ettringite. As hemihydrate was added to the C3A-gypsum system, two processes of ettringite precipitation and gypsum precipitation occurred. The nucleation and growth process of ettringite and gypsum resulted in the complex changes in the specific surface area of the hydrated sample, which first increased at the very beginning, then decreased and, finally, increased.

1. Introduction

Tricalcium aluminate (C3A) is one of the main components of Portland cement. Although the content of this phase is just only 2–10% of the mass of cement, C3A has a very significant impact on the workability of cement paste. C3A strongly reacts with water and could lead to the “flash-setting” of cement. To avoid this problem, gypsum (CaSO4⋅2H2O) is usually added as an additive during cement production to regulate the hydration of C3A, which allows for more working time with the fresh cement paste as well as with the concrete [1,2,3,4,5].
At present, a large number of studies have focused on the reaction process of C3A-gypsum. Ettringite is considered to be the major hydrate product precipitated during the first hour in the presence of gypsum [6,7,8,9,10]. Meredith et al. [11] and Kong et al. [12] proposed that the formation of ettringite in the early stage resulted in a large increase in the specific surface area of solid particles in paste. Pourchet et al. [13] and Zhang et al. [14] found that the morphology of precipitated ettringite changed over time. These results indicate that the formation of ettringite could change particle packing, change the inter-particle distance, and then, change the particle network structure [15], which in turn results in a change in the rheological properties of paste. Therefore, it is crucial to understand the changes in rheological properties of paste over time to discuss the reaction process of C3A-gypsum systems.
However, not only gypsum, but also hemihydrate and soluble sulfates (e.g., Na2SO4 and K2SO4) can be found in cement due to some factors such as mineral raw materials and the production processes of cement. It can be concluded, based on much research, that the hydration rate of C3A was closely related to the type of sulfate sources used, which determines the solubility and rate of dissolution of sulfates used [16,17,18,19,20,21]. Bensted et al. [16] found that the high-temperature grinding of cement resulted in the partial dehydration of gypsum to form hemihydrate, and then induced an increase in the precipitation rate of ettringite in the first 2 h because hemihydrate had a higher solubility and dissolution rate than gypsum. Pourchet et al. [22] suggested that the introduction of hemihydrate as a replacement led to an increase in the formation rate of ettringite during at least the first five hours. In addition, soluble sulfates significantly affect the formation of ettringite. Feng et al. [23] found that ettringite precipitated in the C3A-Na2SO4 system was less than that in the C3A-gypsum system in the first hour, and the morphology of ettringite slightly changed. As mentioned above, C3A hydration is known to significantly affect rheological properties of cement paste, and thus, of concrete. It is important to study the changes caused by different sulfates during the early C3A hydration, which is of great significance for better understanding the time-dependent rheological properties of pastes prepared from cement with different characteristics.
The main aim of this work is to understand the effect of sulfates on the hydration kinetics of C3A (formation of ettringite) and the morphology of hydration products. Focusing on the C3A-gypsum systems, the effects of sulfate types (gypsum, hemihydrate, Na2SO4) and proportions on the C3A hydration in the first hour were systematically studied. Considering that the superplasticizer affected the formation rate and morphology of ettringite [13], all studies were carried out in the presence of a superplasticizer, which was closer to the actual application environment of cement. In the study, the BET method using nitrogen combined with a DSC analysis was adopted to simultaneously characterize the amount of precipitated ettringite and its specific surface area at a certain time during the hydration process of C3A-gypsum.

2. Materials and Methods

2.1. Minerals

In this study, high-purity C3A was prepared by sintering compacted powders of calcium hydroxide as the calcium raw material and alumina as the aluminum raw material. The sintering temperature was 1350 °C and the holding time was 4 h. The pellets of C3A needed to be sintered twice with an intermediate grinding to ensure homogeneity and a complete reaction. Finally, the powders were ground and sieved, and particles <45 μm were retained. Based on the designed research plan, gypsum (G), hemihydrate (H) or Na2SO4 (S) was added to the powders to obtain the final composition. A commercial comb-shaped polycarboxylate superplasticizer (PC) compounded with a defoaming agent provided by Jiangsu Sobute New Materials Co., Ltd. was used.
In this study, five groups of simulated solutions with different SO42− concentrations were prepared by Na2SO4 and NaNO3, as shown in Table 1. The ionic strength of these simulated solutions was similar, which avoided the influence of ionic strength on the hydration of the C3A-gypsum system. Certain amounts of Na2SO4 and NaNO3 were dissolved in deionized water. These solutions were continuously stirred for 6 h at 20 °C and then filtered through 0.3μm Millipore filters.

2.2. Methods

2.2.1. Preparation of the Suspensions

All the experiments were carried out with a liquid/solid ratio equal to 1 and PC dosage of 0.1%. The experiments in this study could be divided into two groups, and the mixture proportions and codes are shown in Table 2 and Table 3. The experiments about the effect of the ratio of C3A/G in the C3A-gypsum system and the SO42− concentration in the simulated solutions on the hydration of the C3A-gypsum system at 20 min were systematically carried out (as shown in Table 2). The mixture proportions listed in Table 3 involved the effect of the SO42− concentration in simulated solutions (0, 0.015, 0.06 mol/L) and replacing gypsum with quality hemihydrate gypsum (10%, 20%) or Na2SO4 in a solid (1.7%, 3.4%) on C3A-gypsum hydration in the first hour. When considering the effect of hemihydrate and Na2SO4, deionized water was used as the mixing water.
The paste was prepared using a constant temperature magnetic stirrer according to the following procedure, which could not only stir the pastes, but also control the temperature of the experimental environment at 20 °C. A certain amount of PC together with deionized water or simulated solution was first put into the mixer and mixed for 1 min at a speed of 150 rpm; then, the powder previously prepared according to the mixture proportions listed in Table 2 and Table 3 was added and mixed at a speed of 300 rpm for 2 min. Finally, the paste was mixed at a speed of 150 rpm. Part of the paste was taken out at this time to stop hydration, and the remaining part was continuously mixed until the end of the experiment (20 min or 60 min).

2.2.2. Stopping C3A Hydration

C3A hydration was stopped for microscopic performance analyses such as DSC analysis, BET nitrogen analysis and analysis of the morphology of hydration products at different times (5 min, 20 min and 60 min). C3A hydration was efficiently stopped by a solvent exchange, which could remove capillary water. At each time, about 6 g of the hydrating cement paste was taken out and poured into a cup with 150 g of cold isopropanol at 5 °C (AR ≥ 99.7%). After 1 min of mixing, the suspension was filtered with a polyamide membrane filter (pore size of 0.45 μm) to obtain the solid part, which was then dried under a nitrogen flow in a desiccator at 20 °C under atmospheric pressure until a constant weight [24,25,26]. The dried powder was, then, gently homogenized in an agate mortar before microscopic performance measurements.

2.2.3. DSC Analysis

In the hydrated C3A-gypsum systems, there are obvious differences in peaks between ettringite and gypsum. The amount of ettringite in the hydrated sample could, thus, be quantified via differential scanning calorimetry (DSC 214, NETZSCH, Selb, Germany). During the test, the hydrated samples were heated from 25 °C to 200 °C at a rate of 10 °C/min. Even in the samples considering the effect of hemihydrate, no peak of hemihydrate was found in the 5 min hydrated samples due to the extremely fast solution rate of hemihydrate. The only peaks that could be detected are ettringite and gypsum. The amount of ettringite could be determined by the peak area. The temperature interval [25–125 °C] was selected for the ettringite [13]. The amount of ettringite in a hydrated sample was obtained by the ratio of the ettringite peak area per gram of the sample to the peak area for 1 g of pure synthetic ettringite (ΔHE = 960 J/g) measured under the same conditions.

2.2.4. BET Method Using N2

The BET method using nitrogen (N2) was adopted to measure the specific surface area (SSA) of the previously “stopped” samples. A nitrogen adsorption test was carried out via a TristarII3020 apparatus (Micromeritics, Norcross, GA, USA) from Micromeritics. Before the nitrogen adsorption test, the previously “stopped” sample was degassed in an external degassing station (VacPrep 061 from Micromeritics). Flatt [26] reported that degassing conditions (temperature, pressure and time) were essential for the SSA measurement by nitrogen adsorption, and could lead to the decomposition of ettringite. In this study, all the samples were degassed under a N2 flow for 16 h at 40 °C, which was considered to have little effect on ettringite.

2.2.5. Scanning Electron Microscopy (SEM)

An FEI Quanta 250 SEM microscope (FEI, Hillsboro, OH, USA) was used to study the morphology of ettringite. For microscopy, a very small amount of the previously “stopped” sample was evenly dispersed with a constant amount of cold isopropanol (5 °C) in a beaker. A drop of the cement–isopropanol suspension was dropped on a silicon wafer and dried under the nitrogen flow in a desiccator at 20 °C and under atmospheric pressure. Once dried, the sample was prepared for SEM observation.

3. Results and Discussion

3.1. Effect of Sulfates on the C3A Hydration Kinetics

In the presence of sufficient gypsum, ettringite is considered to be the only product during the early stage of C3A hydration (the first hour) [22], and the reaction could be described as follows:
C a 3 A l 2 O 6 + 3 C a S O 4 + 32 H 2 O C a 6 A l 2 S O 4 3 O H 12 26 H 2 O
Firstly, different ratios of C3A/G and a series of simulated solutions with different concentrations of SO42− were considered for a better understanding of the C3A hydration reaction. As a large part of the ettringite was formed in the first 20 min [13], only the C3A hydration reaction at 20 min was tested. Based on the DSC data, the amount of ettringite precipitated could be calculated, and the results are shown in Figure 1. The amount of ettringite precipitated at 20 min increased first and then decreased when the proportion of gypsum in the C3A-gypsum system increased. When the C3A/G was 70/30, the amount of ettringite was the highest. It was considered that a high proportion of gypsum led to a large reduction in the C3A content in the C3A-gypsum system and then reduced the formation of ettringite. For the hydration of C3A in simulated solutions with different SO42− concentrations, the amount of ettringite at 20 min first increased and then decreased with the increasing SO42− concentration. When the SO42− concentration was 0.06 mol/L, the most ettringite was found.
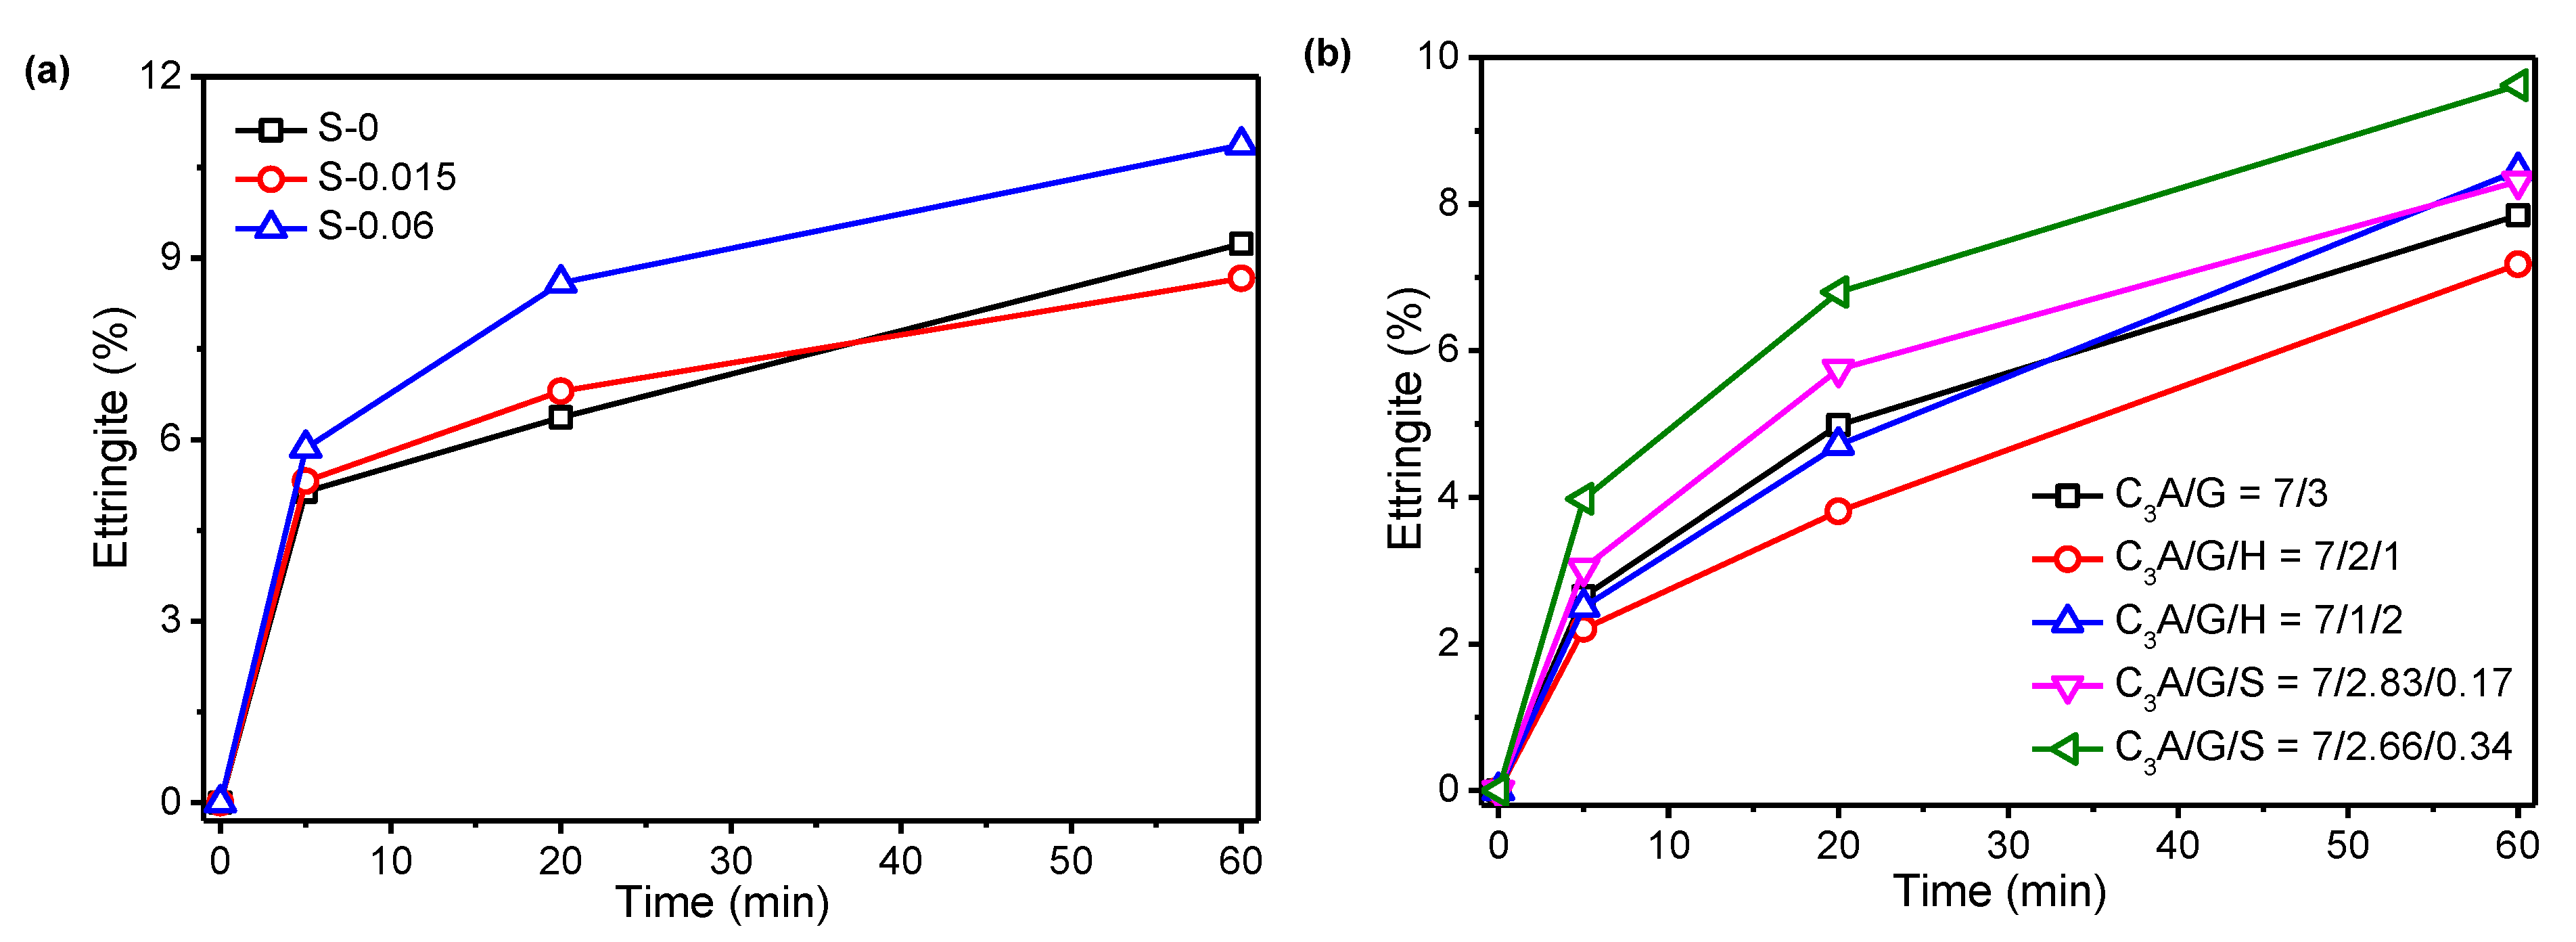
Figure 2 shows the amount of precipitated ettringite during the first hour. Regardless of the effect of sulfate concentrations in the simulated solution, or hemihydrate and Na2SO4 in a solid, a large amount of ettringite was rapidly formed within the first 20 min of C3A hydration, whereas the formation rate of ettringite significantly slowed down after 20 min, which was in good agreement with other published results. In fact, the kinetics of the formation of ettringite are still under investigation [5,17,27,28]. However, the amount of ettringite in the hydrated sample calculated from the DSC data was consistent with the finding that this was a two-step reaction: quickly, C3A hydration led to a large amount of precipitated ettringite in the first minutes, and after that, the C3A hydration was delayed due to the newly generated surface of hydrates.
Figure 2a shows that the SO42− concentration of 0.015 mol/L in a simulated solution with an equivalent ionic strength only slightly modified the reaction rate of the C3A hydration, but when the concentration increased to 0.06 mol/L, the amount of precipitated ettringite was significant increased. The presence of SO42− in the solution seemed to promote the formation of ettringite in the first 20 min, and reduce the rate after 20 min. Figure 2b shows the effect of the partial replacement of gypsum by hemihydrate and Na2SO4 in the C3A-gypsum system on the precipitated ettringite. Substituting hemihydrate for 10% gypsum resulted in a significant decrease in the amount of precipitated ettringite, whereas substituting hemihydrate for 20% gypsum resulted in a slight change in the amount of ettringite in the first 20 min and a significant increase after 20 min. In addition, it is extremely remarkable that the rate of ettringite precipitation in first 20 min was greatly promoted by incorporating a small amount of Na2SO4 in the C3A-gypsum system.

3.2. Effect of Sulfates on SSA along C3A Hydration Reaction

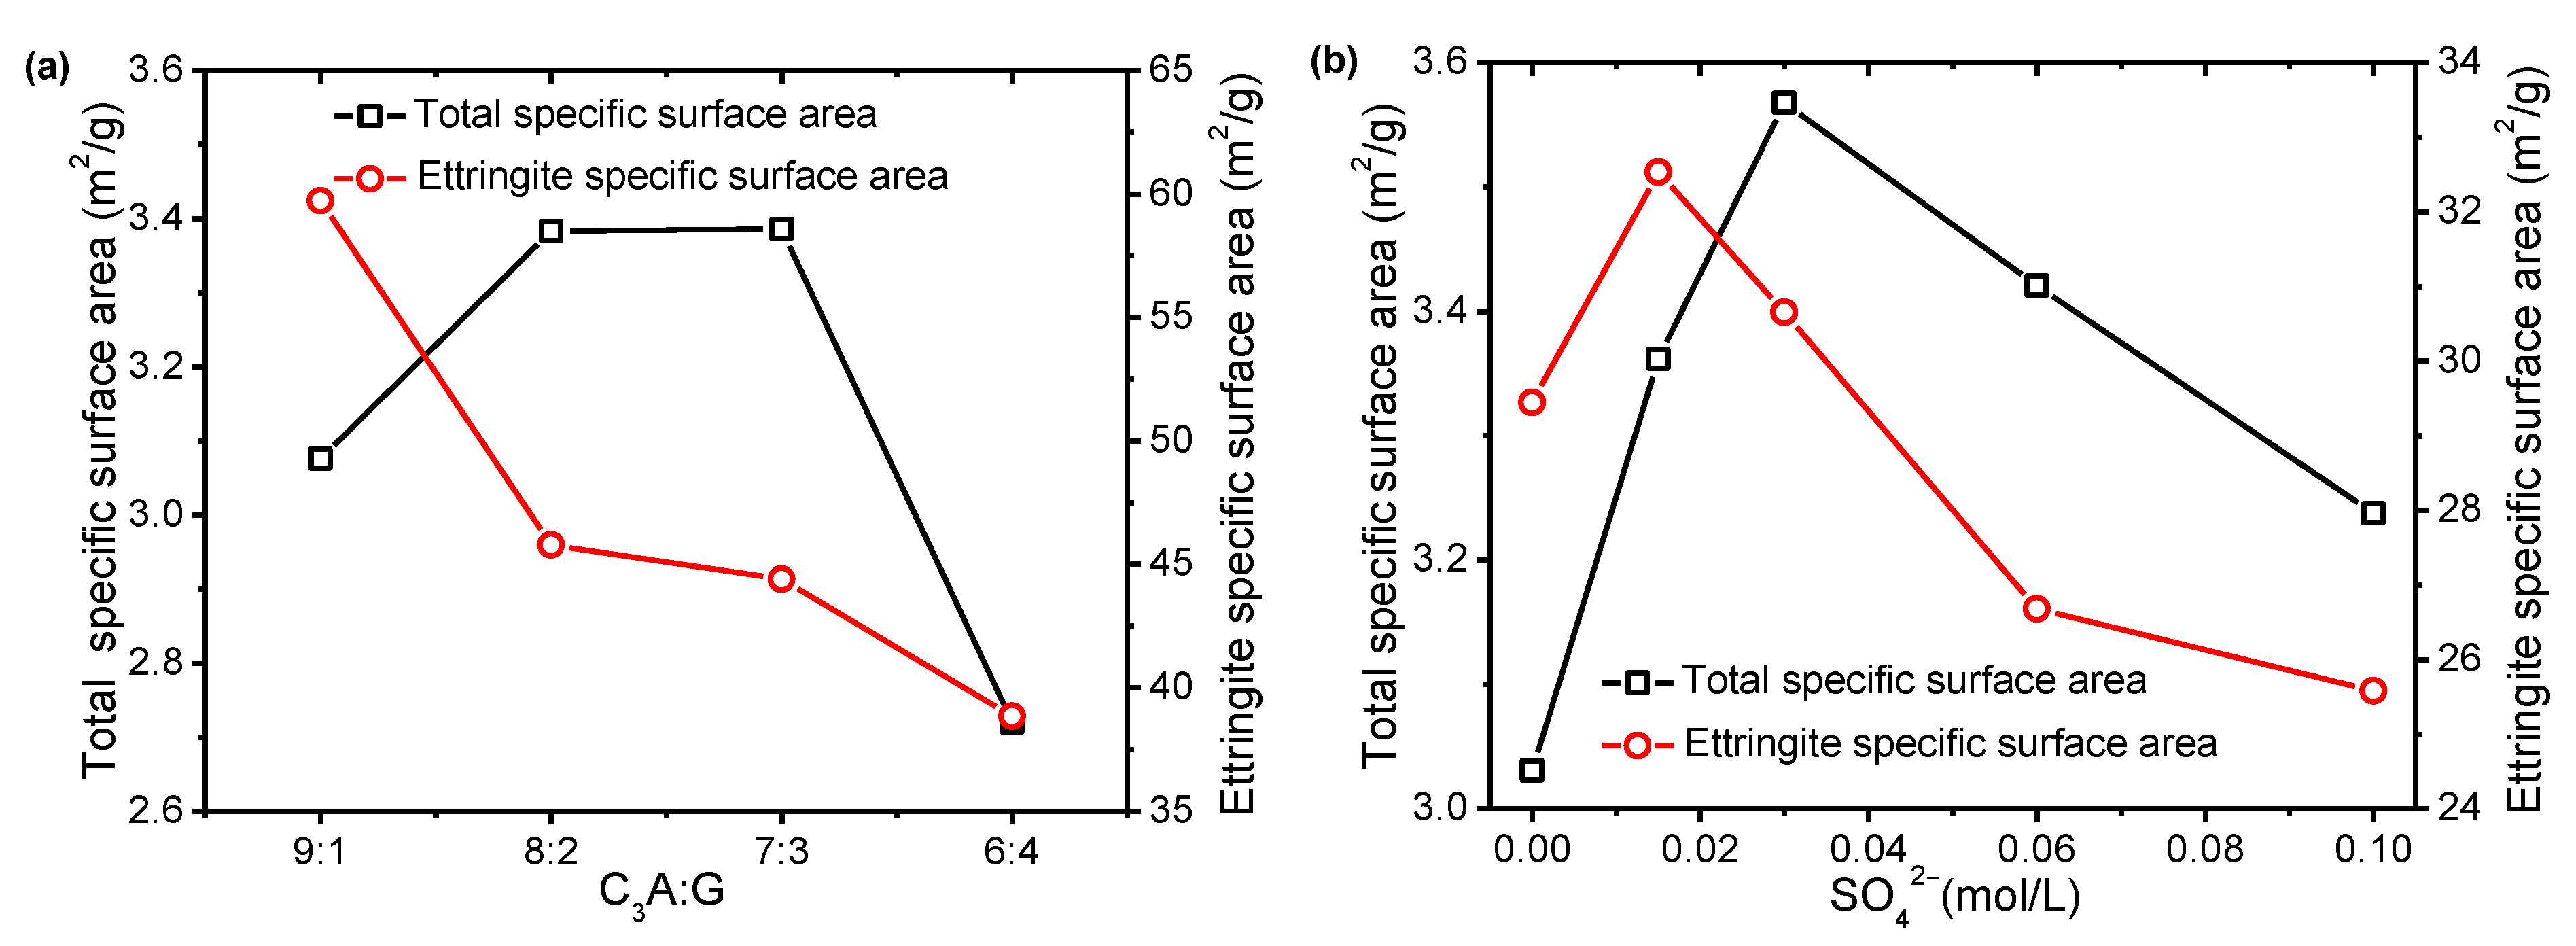
Figure 3 shows the effect of C3A/G and the SO42− concentration in simulated solutions on the SSA at 20 min. Although the SSA of the initial powders gradually decreased with increasing gypsum, the SSA of the hydrated samples at 20 min increased first and then decreased. For the C3A hydration in simulated solutions with different SO42− concentrations, the SSA first increased and then decreased with the increasing SO42− concentration. The SSA reached the maximum in the simulated solution with a SO42− concentration of 0.03 mol/L, whereas the amount of ettringite reached the maximum at a SO42− concentration of 0.06 mol/L. The above-mentioned change trends of the SSA were not consistent with the formation process of ettringite. Considering that the change of SSA under the experimental conditions was mainly caused by the precipitation of ettringite, it was considered that the changes in the morphology of ettringite and the formation amount together resulted in the changes in SSA.
Figure 4 shows the evolution of the SSA of hydrated samples along the C3A hydration. As expected, the SSA of hydrated samples increased significantly within the first 5 min. However, obvious differences were found after 5 min for different systems. For hydration in simulated solutions with different SO42− concentrations, the SSA of hydrated samples increased along the C3A hydration. As the SO42− concentration in simulated solution increased from 0 to 0.015 mol/L and 0.06 mol/L, the SSA of hydrated samples significantly increased. By replacing gypsum with quality hemihydrate of 10% and 20%, it could be clearly found that the SSA decreased at 20 min and then increased. Additionally, the higher hemihydrate that was added, the more significant this trend of change was. When a trace amount of sodium sulfate was added (1.7% and 3.4% of the total solid), the SSA gradually increased with the extension of hydration time. However, the above-mentioned change trends of the SSA were not consistent with the formation process of ettringite. This again indicated that the morphology of ettringite was variable. In addition, when hemihydrate was added, the change in SSA may also be related to the precipitated gypsum, since hemihydrate that reacted quickly with water could form gypsum [29]. This will be discussed in detail in the following section.

3.3. Effect of Sulfates on SSA and Morphology of Ettringite

According to the SSA of hydrated samples at t = 0, 5, 20 and 60 min and the amount of precipitated ettringite, the SSA of ettringite at t = 0, 5, 20 and 60 min could be calculated based on the following formula:
S e ( t ) = S ( t ) ( 1 f ( t ) ) × S ( t 0 ) f ( t )
where f(t) is the weight fraction of ettringite in the hydrated sample deduced from the DSC measurement, S(t0) is the SSA of the hydrated sample measured by BET at t = 0 and S (t) is the SSA of the hydrated sample at t measured by BET. It should be noted that there was an assumption for this calculation that the SSA of the anhydrous part in the hydrated sample was constant and equal to S(t0).
The effect of C3A/G and the SO42− concentration in simulated solutions on the SSA of the ettringite at 20 min is show in Figure 3. It can be seen clearly that as the proportion of gypsum increased from 10% to 20%, 30% and 40%, the SSA of ettringite gradually decreased from 59.7 m2/g to 45.8 m2/g, 44.4 m2/g and 38.9 m2/g, respectively. With the increase in the SO42− concentration in simulated solutions, the SSA of ettringite first increased and then decreased. When the SO42− concentration is 0.015 mol/L, the specific surface area of ettringite formed in the simulated solution reached a maximum of 32.5 m2/g. Comparing the SSA of ettringite in the two systems, it was confirmed that the SSA of ettringite formed in the simulated solution was significantly lower than that formed in the deionized water.
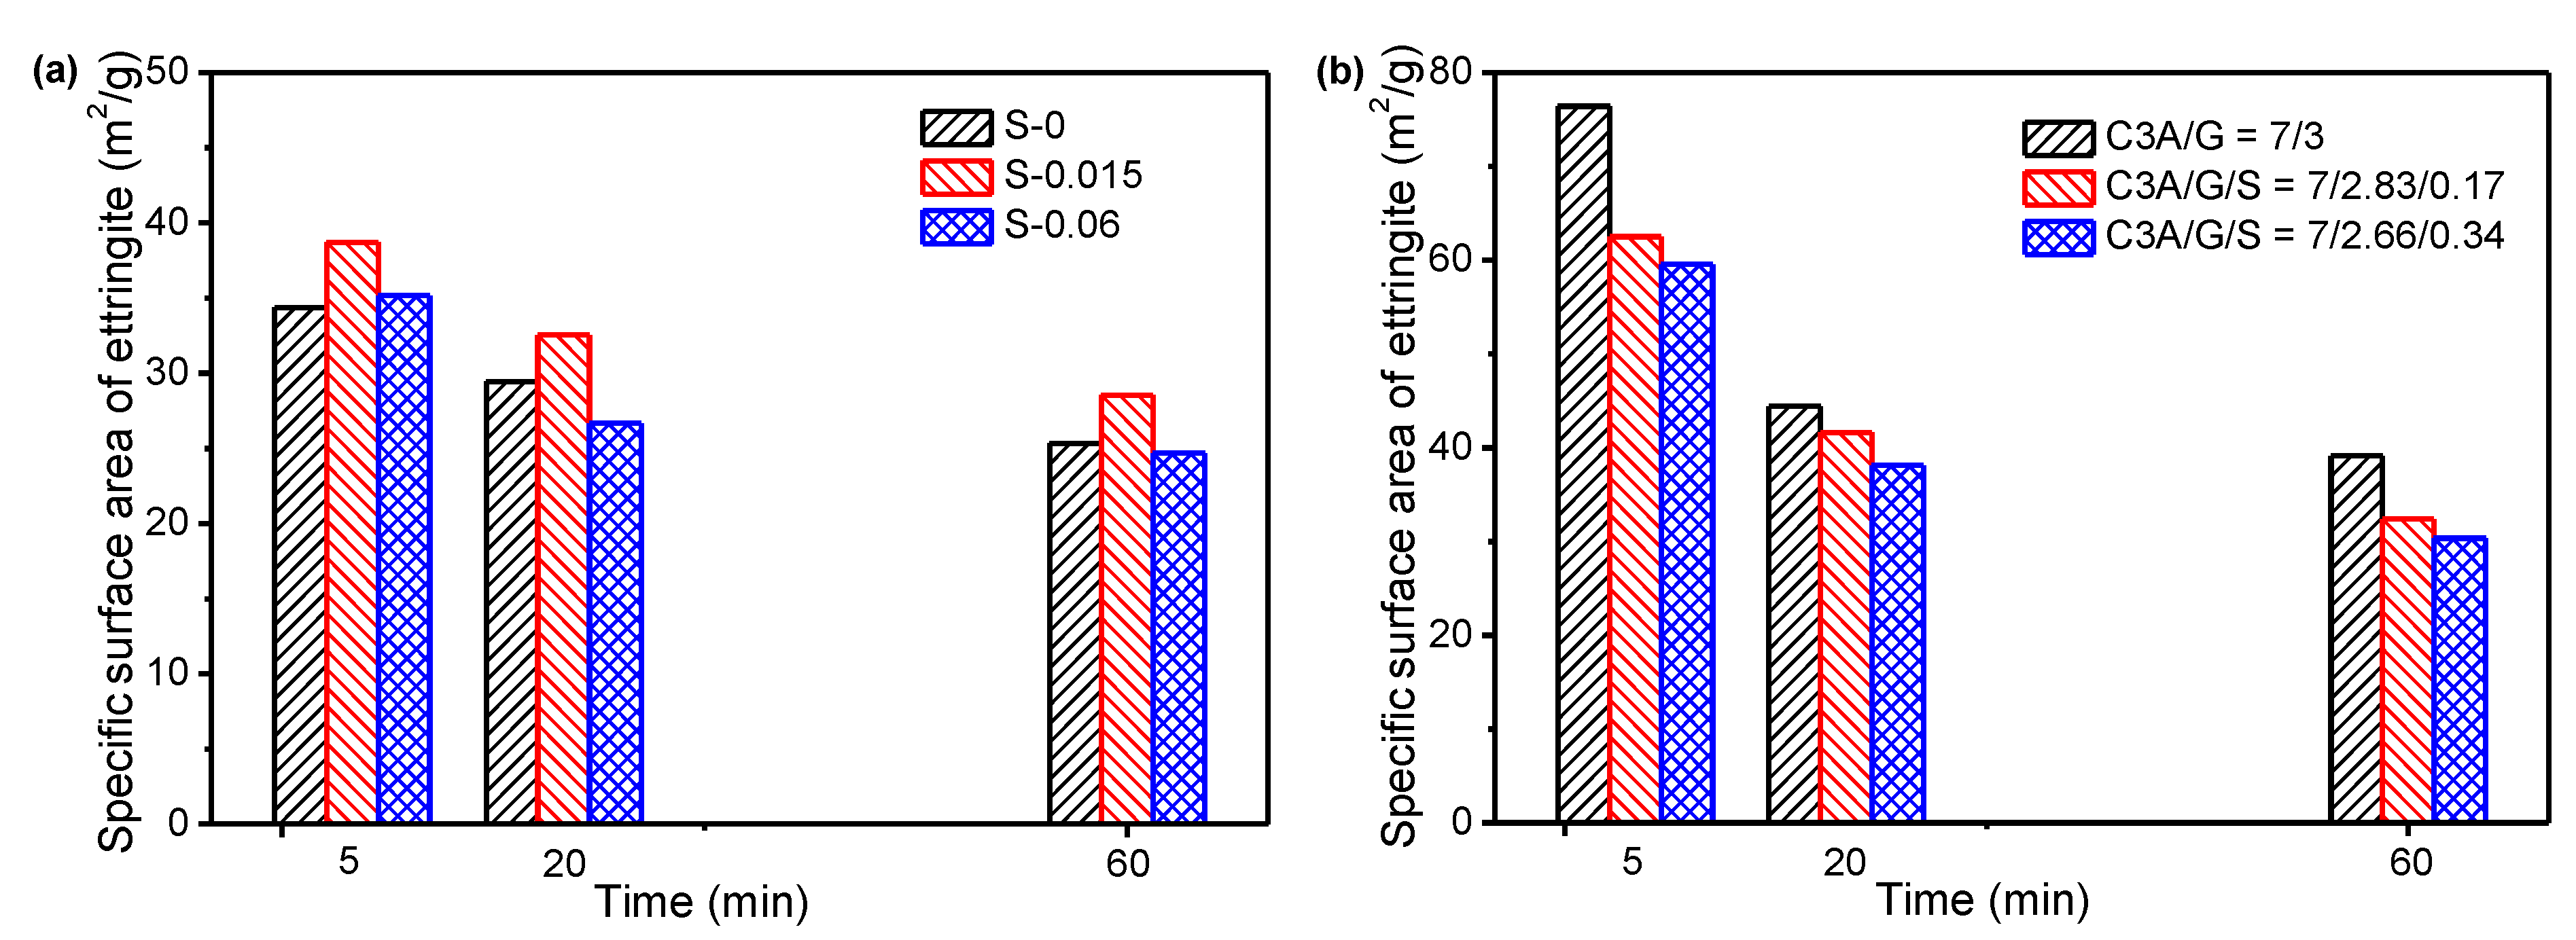
Figure 5 shows the evolution of the SSA of precipitated ettringite along the C3A hydration. It can be clearly seen that the SSA of ettringite gradually decreased along the C3A hydration reaction, which agreed well with results reported by Pourchet [13]. Taking C3A/G = 70/30 as an example, the SSA of ettringite at the very beginning of the C3A hydration (5 min) was about 76.4 m2/g, and decreased to 44.4 m2/g and 39.1 m2/g at 20 min and 60 min.
The concentration of SO42− in the simulated solution and the addition of Na2SO4 in the solid had a significant effect on the SSA of ettringite. For ettringite formed in simulated solutions with different SO42− concentrations, as the SO42− concentration in simulated solutions was 0, 0.015 mol/L and 0.06 mol/L, the SSA of ettringite at the very beginning of the C3A hydration (5 min) was 34.4 m2/g, 38.7 m2/g and 35.2 m2/g, respectively. For the C3A hydration at 20 min, the SSA of ettringite was 29.4 m2/g, 32.5 m2/g and 26.7 m2/g, respectively. For the C3A hydration at 60 min, the SSA of ettringite decreased to 25.3 m2/g, 28.5 m2/g and 24.7 m2/g, respectively. In other words, the SSA of ettringite in the simulated solution with a SO42− concentration of 0.015 mol/L was slightly higher than that in the simulated solution without SO42−, but as the SO42− concentration increased to 0.06 mol/L, the SSA of ettringite was similar to that in the simulated solution without SO42−. The SSA of ettringite could be significantly reduced by adding a small amount of Na2SO4 in a solid to replace gypsum. As the Na2SO4 content was 0, 1.7% and 3.4%, the SSA of ettringite at the very beginning of the C3A hydration (5 min) was 76.4 m2/g, 41.6 m2/g and 38.1 m2/g, respectively. For the C3A hydration at 20 min, the SSA ettringite was 44.4 m2/g, 41.6 m2/g and 38.1 m2/g, respectively. At 60 min of C3A hydration, the specific surface area of ettringite decreased to 39.1 m2/g, 32.4 m2/g and 30.34 m2/g, respectively. It was extremely obvious that the higher the Na2SO4 content was, the smaller the SSA of ettringite was. In addition, comparing the C3A hydration in different solution environments (deionized water and simulated solution), it could be seen that the SSA of ettringite in the simulated solution was significantly lower than that in deionized water. Taking C3A/G = 7/3 and S-0 as examples, the SSA of ettringite formed in deionized water at 5 min, 20 min and 60 min was 122%, 41% and 51% higher, respectively, than that of ettringite formed in the simulated solution. Considering that the precipitation reaction of gypsum might occur as hemihydrate was added, which resulted in a change in the SSA of the hydrated samples, it was difficult to accurately calculate the SSA of ettringite in this system.
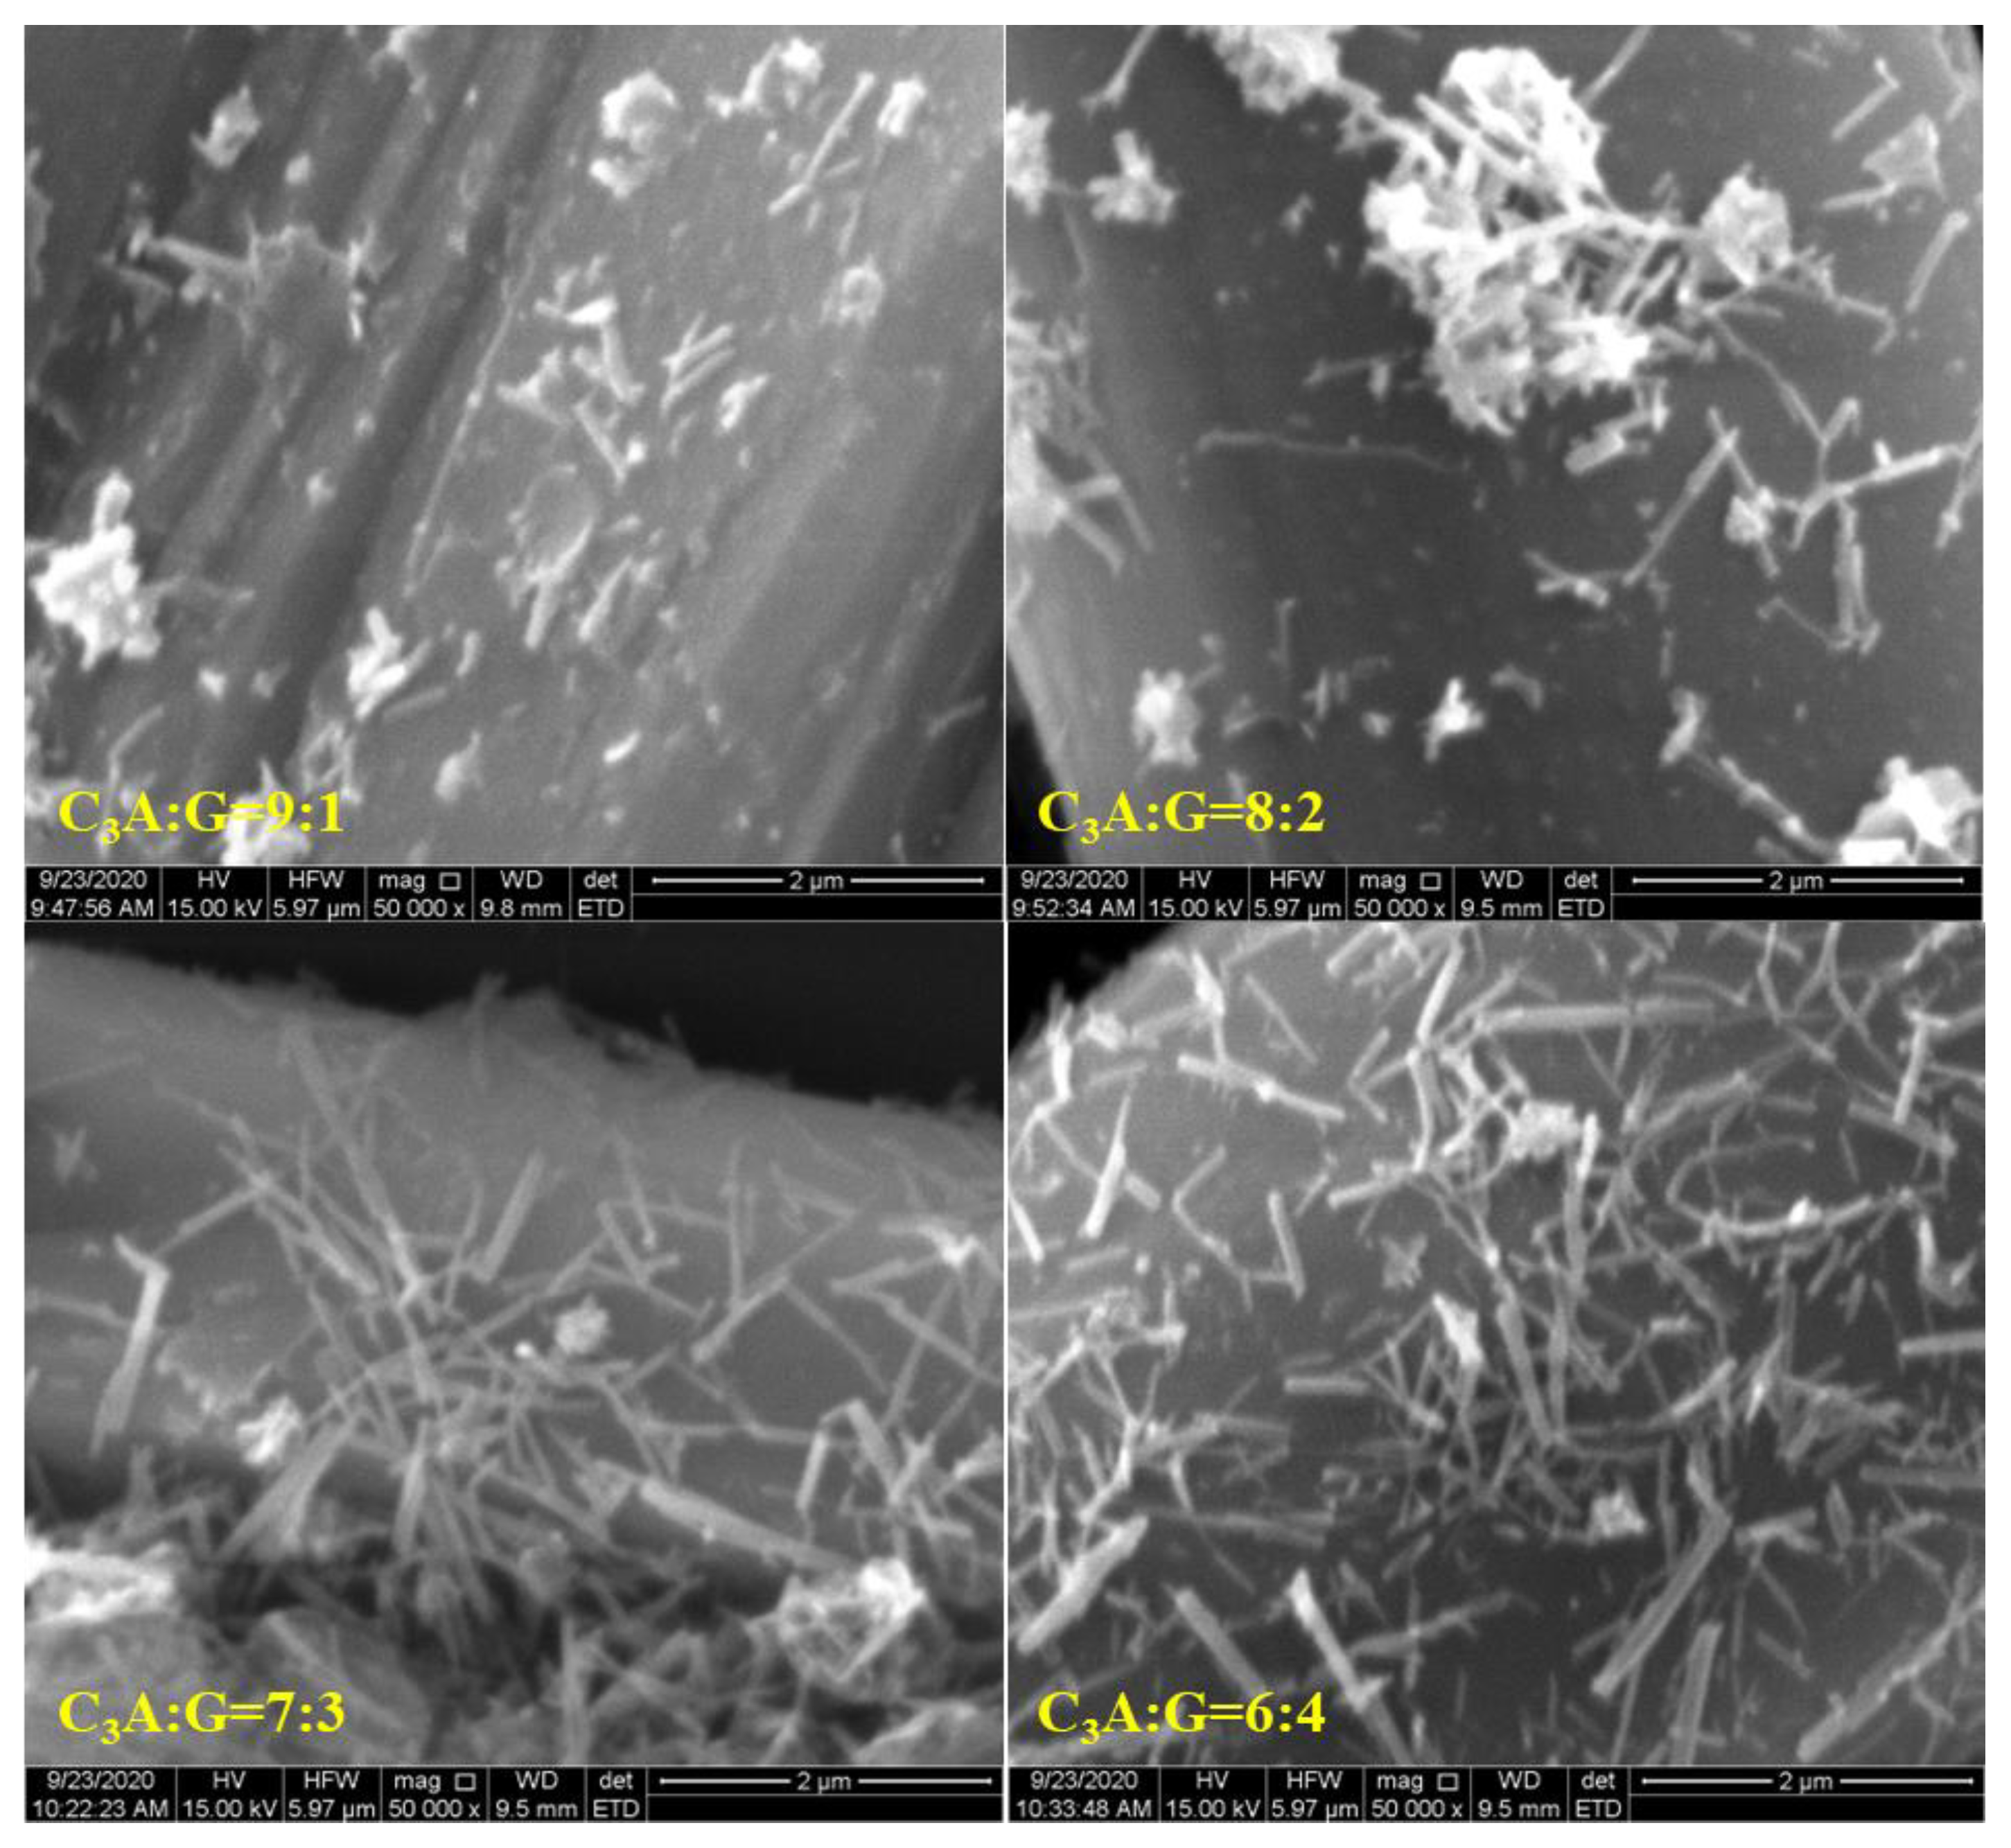
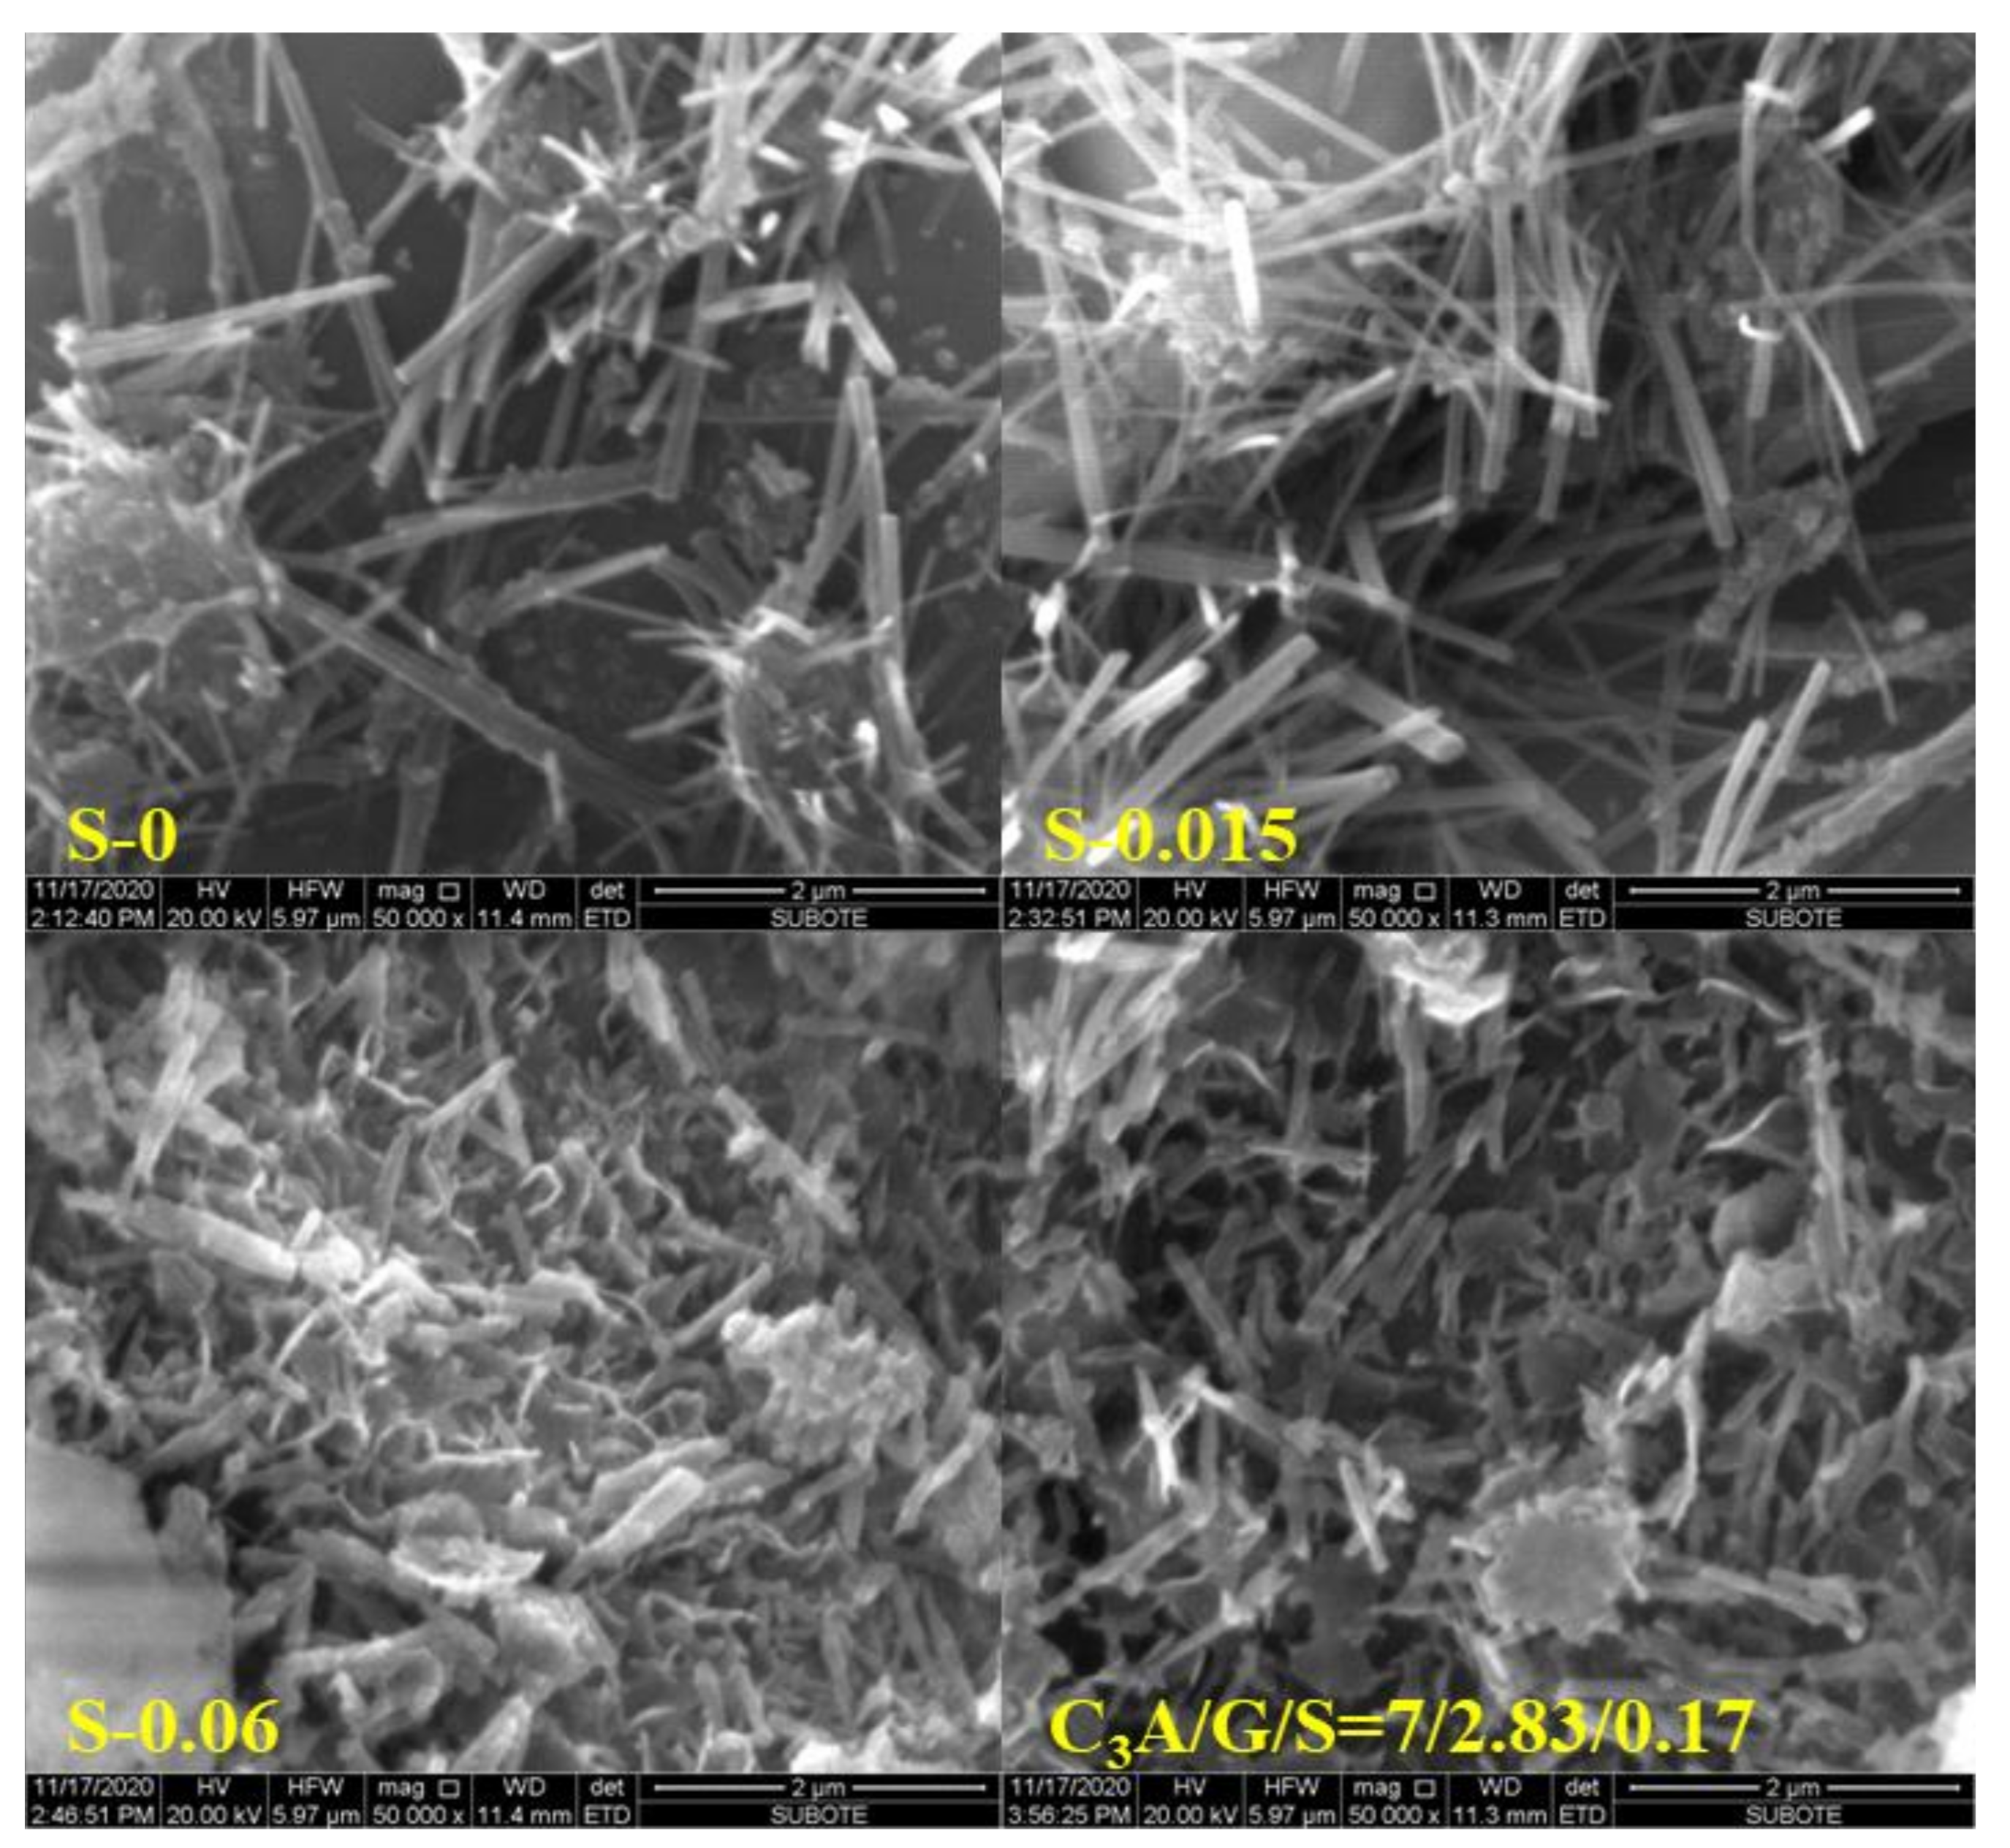
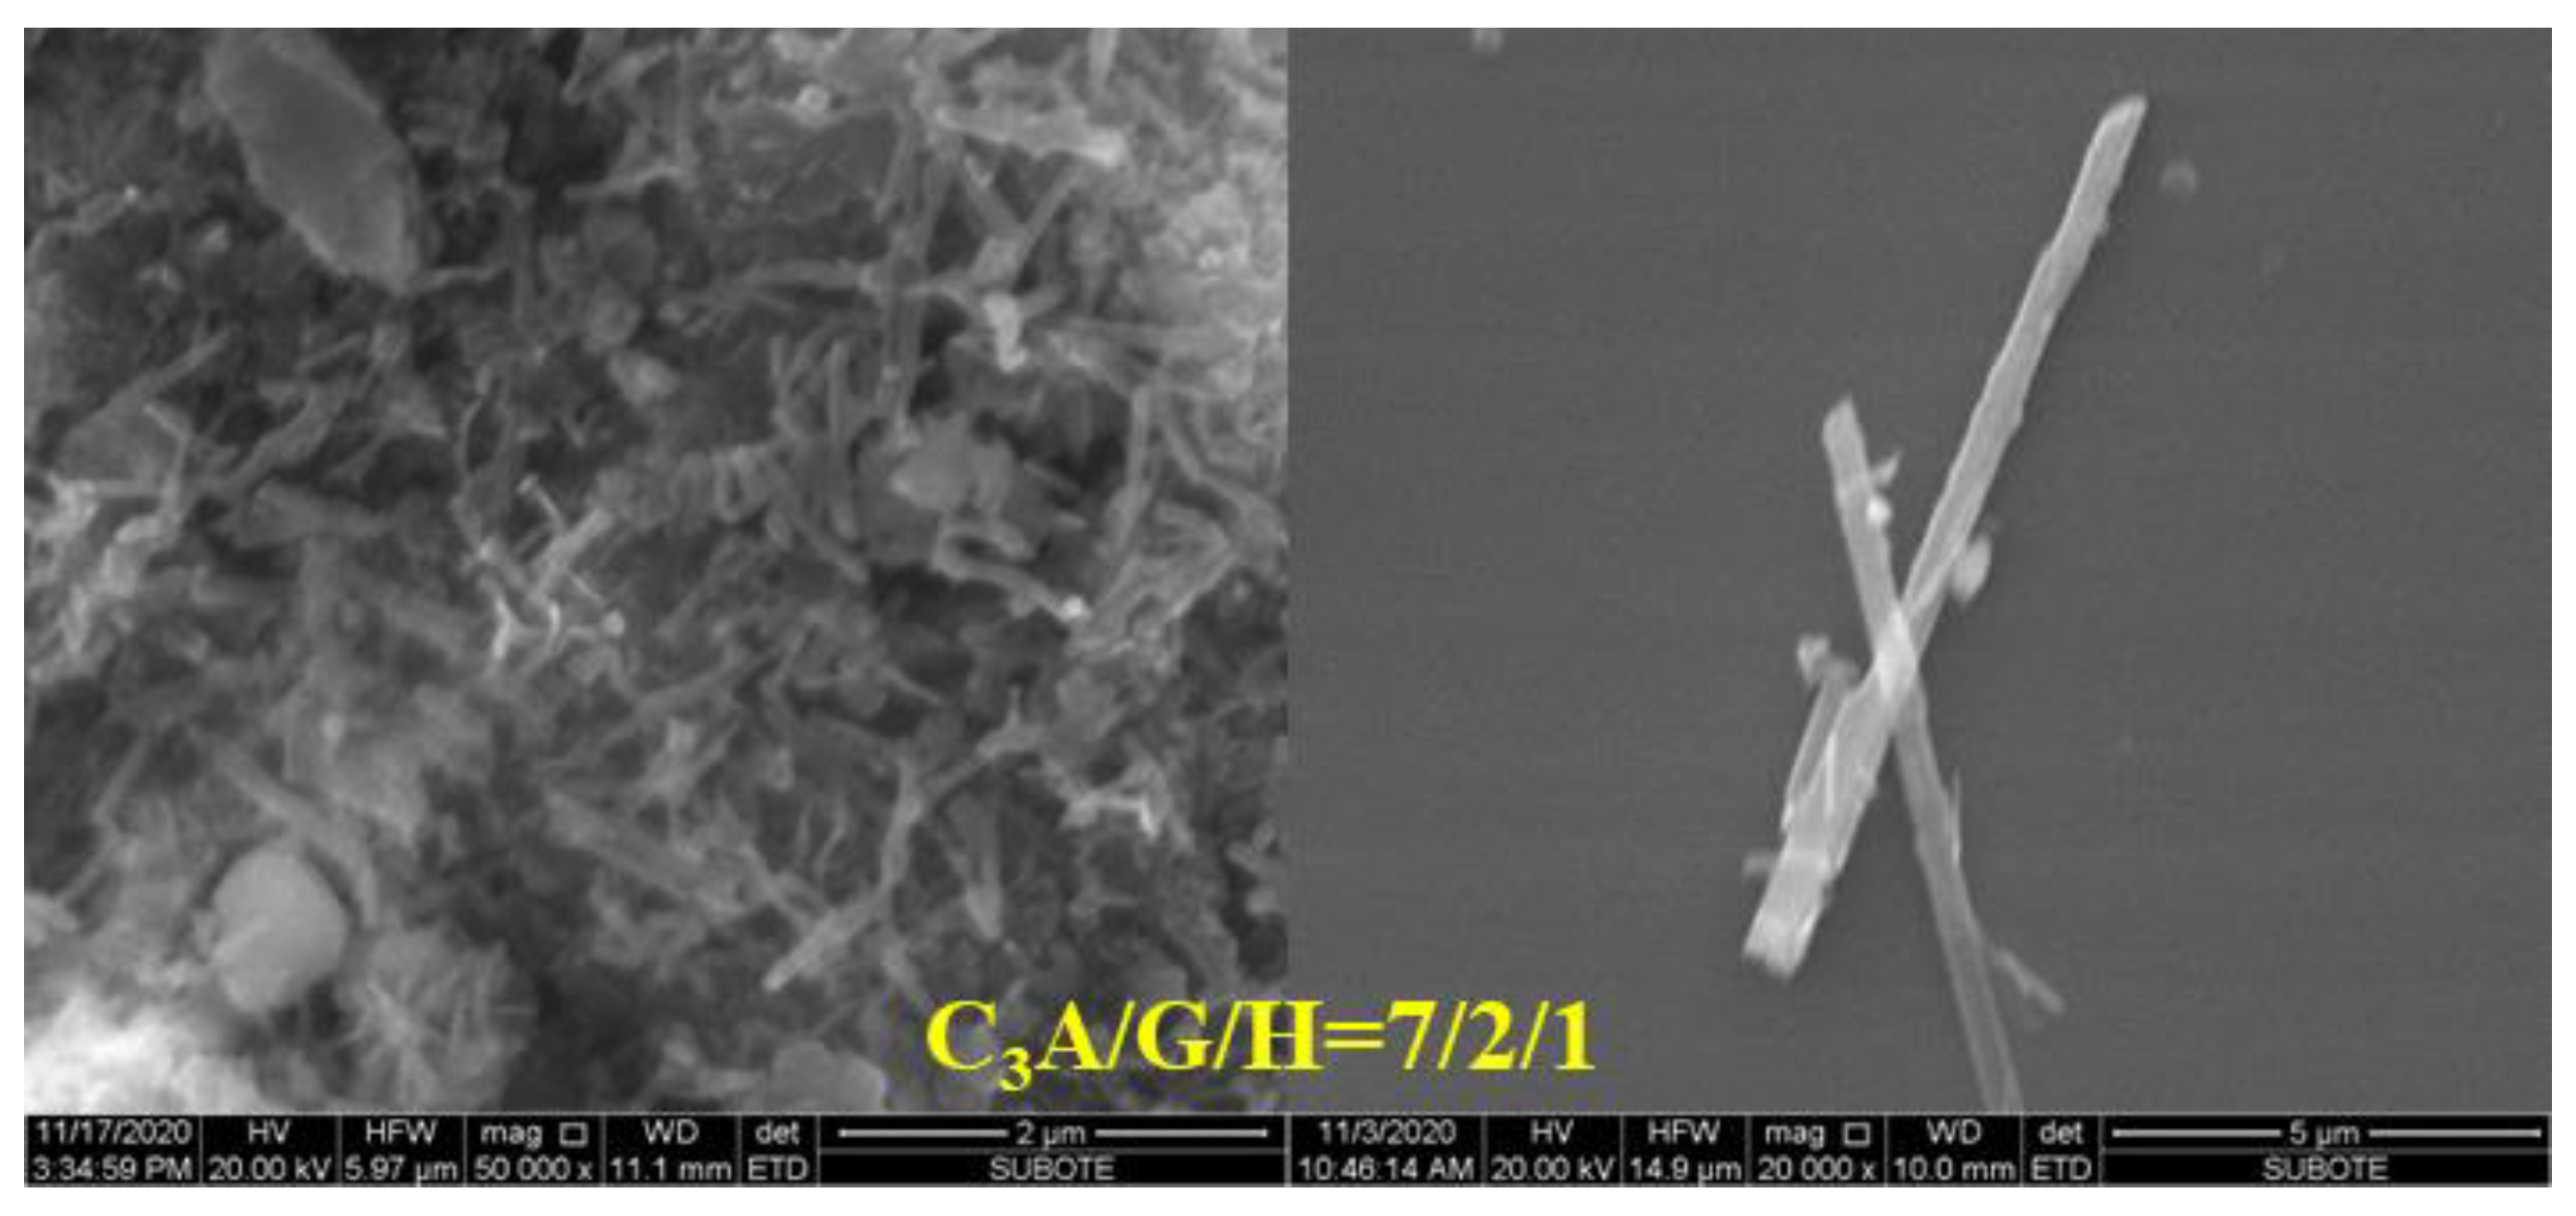
The change of the SSA of ettringite must be caused by its morphology; therefore, the morphology of ettringite was observed via SEM and the results are shown in Figure 6, Figure 7 and Figure 8. As the proportion of gypsum in the C3A-gypsum systems increased, the diameter of the needle-shaped ettringite slightly increased. For the system with C3A/G of 70/30 in the simulated solution, ettringite was longer and larger in diameter when the SO42− concentration was 0 and 0.015 mol/L. However, when the SO42− concentration in the simulated solution was increased to 0.06 mol/L, the ettringite with a larger diameter but a shorter length was found. It can be seen clearly from Figure 8 that two processes of ettringite precipitation and gypsum precipitation occurred as hemihydrate was added during the hydration process of the C3A-gypsum system. It was consistent with the previous speculation. The long, rod-shaped gypsum particle was found, but its length and width were several times that of ettringite.
For all the samples, except those with hemihydrate, the size of ettringite at the very beginning was small; therefore it had a larger SSA, resulting in the great increase in the SSA of the hydrated sample within 5 min. Along the C3A hydration reaction, the formation of ettringite increased, and the total SSA of the hydrated sample continued to increase. However, the slowing down of the formation rate of ettringite and the growth of ettringite led to the decrease in its SSA, and both resulted in the slow growth of the SSA in the hydrated sample. For the samples with hemihydrate, the large increase in the SSA at the very beginning could be considered to be caused by the precipitation of ettringite and gypsum. However, with the increase in the amount of precipitated gypsum and rapid growth, the proportion of gypsum in the hydrated sample increased. Due to its larger size, the SSA of the hydrated sample decreased. However, the SSA of the hydrated sample would continue to increase with the increase in precipitated ettringite as the C3A hydration continued.
However, it should be noted that it was still extremely difficult to answer how sulfate affects the nucleation and growth of ettringite crystals. It had been suggested that the growth or nucleation of ettringite was closely related to the surface energy of ettringite. For a higher surface energy, ettringite tended to grow rather than nucleate; thus, the size was larger and its SSA was smaller.
Pourchet et al. [22] proposed that the PC in solution could make complex ions and/or reduce the surface energy of ettringite, which is beneficial to homogeneous nucleation, and that the PC strongly interacted with ettringite crystals and slowed down/prevented their growth. For this study, it was suggested that the surface energy of ettringite in the simulated solution was higher, and thus, the size was larger and the specific surface area was smaller. Adding Na2SO4 in a solid and increasing the proportion of gypsum could significantly increase the ionic strength of the solution. Therefore, ettringite had a higher surface energy and a larger specific surface area.
The amount and morphology of ettringite will affect the inter-particle interaction force [30], which eventually affects the rheological properties of cement paste. Therefore, further studies should be put forward on how the hydration of C3A-gypsum acts on the time-dependent rheological properties of cement paste.

4. Conclusions

Early hydration of the C3A-gypsum system was systematically studied in the presence of various types of sulfates such as gypsum, hemihydrate and Na2SO4 in the first hour. The BET method using nitrogen combined with a DSC analysis enabled us to quantitatively characterize the amount of precipitated ettringite and its specific surface area along the hydration. Based on the experimental results, the following conclusions can be drawn:
  • A large part of the ettringite precipitated within the first 20 min of the hydration reaction, whereas this reaction became very slow after 20 min. The amount of ettringite precipitated increased first and then decreased with the increasing proportion of gypsum in the C3A-gypsum system and SO42− concentration in the simulated solution. The rate of precipitation of ettringite in first 20 min was greatly promoted by incorporating a small amount of Na2SO4 in a solid in the C3A-gypsum system.
  • The specific surface area of the hydrated sample strongly increased within the first 5 min, but obvious differences were found when different sulfates were added after 5 min. The specific surface area of all the C3A-gypsum systems, except those with hemihydrate, slowly increased after 5 min, whereas the specific surface area of the C3A-gypsum system with hemihydrate decreased at 20 min and then increased.
  • The specific surface area of ettringite gradually decreased along the C3A hydration reaction. For all the C3A-gypsum systems, except those with hemihydrate, both the slowing down of the precipitation of ettringite and the growth of ettringite resulted in the slow growth of the specific surface area after 5 min. For the C3A-gypsum system with hemihydrate, two processes of ettringite precipitation and gypsum precipitation occurred. The nucleation and growth of ettringite and gypsum resulted in the complex changes in specific surface area, which first increased at the very beginning, then decreased and, finally, increased. In addition, different hydration environments had a very significant effect on the morphology of ettringite. The specific surface area of ettringite in the simulated solution was significantly lower than that in deionized water. The specific surface area of ettringite could be significantly reduced by adding a small amount of Na2SO4 in a solid.

Author Contributions

Data curation, X.W.; formal analysis, Q.Z.; funding acquisition, Q.R.; investigation, Y.Y.; methodology, Q.Z.; resources, Q.R.; validation, X.S.; writing – original draft, Y.Y.; writing – review & editing, X.S. and Q.R. All authors have read and agreed to the published version of the manuscript.

Funding

This research was funded by the National Science Fund for Distinguished Young Scholars, grant number 51825203 and National Natural Science Foundation of Jiangsu Province, grant number BK20201075.

Institutional Review Board Statement

Not applicable.

Informed Consent Statement

Not applicable.

Data Availability Statement

Not applicable.

Conflicts of Interest

The authors declare no conflict of interest.

References

  1. Taylor, H.F.W. Cement Chemistry; Academic Press: Cambridge, MA, USA, 1997. [Google Scholar]
  2. Collepardi, M.; Baldini, G.; Pauri, M.; Corradi, M. Tricalcium aluminate hydration in the presence of lime, gypsum or sodium sulfate. Cem. Concr. Res. 1978, 8, 571–580. [Google Scholar] [CrossRef]
  3. Scrivener, K.L.; Juilland, P.; Monteiro, P.J.M. Advances in understanding hydration of Portland cement. Cem. Concr. Res. 2015, 78, 38–56. [Google Scholar] [CrossRef]
  4. Scrivener, K.; Pratt, P. Microstructural studies of the hydration of C3A and C4AF independently and in cement paste. Proc. Br. Ceram. Soc. 1984, 35, 207–219. [Google Scholar]
  5. Minard, H.; Garrault, S.; Regnaud, L.; Nonat, A. Mechanisms and parameters controlling the tricalcium aluminate reactivity in the presence of gypsum. Cem. Concr. Res. 2007, 37, 1418–1426. [Google Scholar] [CrossRef]
  6. Zingg, A.; Winnefeld, F.; Holzer, L.; Pakusch, J.; Becker, S.; Gauckler, L. Adsorption of polyelectrolytes and its influence on the rheology, zeta potential, and microstructure of various cement and hydrate phases. J. Colloid Interface Sci. 2008, 323, 301–312. [Google Scholar] [CrossRef] [PubMed]
  7. Quennoz, A.; Scrivener, K.L. Hydration of C3A-gypsum systems. Cem. Concr. Res. 2012, 42, 1032–1041. [Google Scholar] [CrossRef]
  8. Kirchheim, A.P.; Rodríguez, E.D.; Myers, R.J.; Gobbo, L.A.; Monteiro, P.J.M.; Molin, D.C.C.D.; de Souza, R.B.; Cincotto, M.A. Effect of gypsum on the early hydration of cubic and Na-doped orthorhombic tricalcium aluminate. Materials 2018, 11, 568. [Google Scholar] [CrossRef] [Green Version]
  9. Joseph, S.; Skibsted, J.; Cizer, Ö. A quantitative study of the C3A hydration. Cem. Concr. Res. 2019, 115, 145–159. [Google Scholar] [CrossRef]
  10. Black, L.; Breen, C.; Yarwood, J.; Deng, C.; Phipps, J.; Maitland, G. Hydration of tricalcium aluminate (C3A) in the presence and absence of gypsum—Studied by Raman spectroscopy and X-ray diffraction. J. Mater. Chem. 2006, 16, 1263–1272. [Google Scholar] [CrossRef]
  11. Meredith, P.; Donald, A.M.; Meller, N.; Hall, C. Tricalcium aluminate hydration: Microstructural observations by in-situ electron microscopy. J. Mater. Sci. 2004, 39, 997–1005. [Google Scholar] [CrossRef]
  12. Tian, H.; Kong, X.; Su, T.; Wang, D. Comparative study of two PCE superplasticizers with varied charge density in Portland cement and sulfoaluminate cement systems. Cem. Concr. Res. 2019, 115, 43–58. [Google Scholar] [CrossRef]
  13. Dalas, F.; Pourchet, S.; Rinaldi, D.; Nonat, A.; Sabio, S.; Mosquet, M. Modification of the rate of formation and surface area of ettringite by polycarboxylate ether superplasticizers during early C3A-CaSO4 hydration. Cem. Concr. Res. 2015, 69, 105–113. [Google Scholar] [CrossRef]
  14. Zhang, Z.; Scherer, G.W.; Bauer, A. Morphology of cementitious material during early hydration. Cem. Concr. Res. 2018, 107, 85–100. [Google Scholar] [CrossRef]
  15. Fung, W.W.S.; Kwan, A.K.H. Role of water film thickness in rheology of CSF mortar. Cem. Concr. Compos. 2010, 32, 255–264. [Google Scholar] [CrossRef]
  16. Bensted, J. Effects of the clinker-gypsum grinding temperature upon early hydration of Portland cement. Cem. Concr. Res. 1982, 12, 341–348. [Google Scholar] [CrossRef]
  17. Sakai, E.; Kang, J.K.; Daimon, M. Influence of superplasticizers on the very early hydration of Ca3Al2O6 in the presence of gypsum, CaSO4 0.5H2O and CaO. Cem. Sci. Concr. Technol. 2002, 56, 36–41. [Google Scholar]
  18. Geng, G.; Myers, R.J.; Yu, Y.-S.; Shapiro, D.A.; Winarski, R.; Levitz, P.E.; Kilcoyne, D.A.L.; Monteiro, P.J.M. Synchrotron X-ray nanotomographic and spectromicroscopic study of the tricalcium aluminate hydration in the presence of gypsum. Cem. Concr. Res. 2018, 111, 130–137. [Google Scholar] [CrossRef] [Green Version]
  19. Myers, R.J.; Geng, G.; Rodriguez, E.D.; da Rosa, P.; Kirchheim, A.P.; Monteiro, P.J.M. Solution chemistry of cubic and orthorhombic tricalcium aluminate hydration. Cem. Concr. Res. 2017, 100, 176–185. [Google Scholar] [CrossRef] [Green Version]
  20. Neto, J.S.A.; de Matos, P.R.; Angeles, G.; Campos, C.E.; Gleize, P.J.; Monteiro, P.J.; Kirchheim, A.P. The role of sodium and sulfate sources on the rheology and hydration of C3A polymorphs. Cem. Concr. Res. 2022, 151, 106639. [Google Scholar] [CrossRef]
  21. Holly, R.; Peemoeller, H.; Zhang, M.; Reardon, E.; Hansson, C.M. Magnetic resonance in situ study of C3A hydration in the presence of gypsum. J. Am. Ceram. Soc. 2006, 89, 1022–1027. [Google Scholar] [CrossRef]
  22. Pourchet, S.; Regnaud, L.; Perez, J.P.; Nonat, A. Early C3A hydration in the presence of different kinds of calcium sulfate. Cem. Concr. Res. 2009, 39, 989–996. [Google Scholar] [CrossRef] [Green Version]
  23. Liu, X.; Feng, P.; Chen, L.; Ye, S. The role of sulfate ions in tricalcium aluminate hydration: New insights. Cem. Concr. Res. 2020, 130, 105973. [Google Scholar] [CrossRef]
  24. Mantellato, S.; Palacios, M.; Flatt, R.J. Impact of sample preparation on the specific surface area of synthetic ettringite. Cem. Concr. Res. 2016, 86, 20–28. [Google Scholar] [CrossRef]
  25. Marchon, D.; Juilland, P.; Gallucci, E.; Frunz, L.; Flatt, R.J. Molecular and submolecular scale effects of comb-copolymers on tri-calcium silicate reactivity: Toward molecular design. J. Am. Ceram. Soc. 2017, 100, 817–841. [Google Scholar] [CrossRef] [Green Version]
  26. Mantellato, S.; Palacios, M.; Flatt, R.J. Reliable specific surface area measurements on anhydrous cements. Cem. Concr. Res. 2015, 67, 286–291. [Google Scholar] [CrossRef]
  27. Zingg, A.; Holzer, L.; Kaech, A.; Winnefeld, F.; Pakusch, J.; Becker, S.; Gauckler, L. The microstructure of dispersed and non-dispersed fresh cement pastes-new insight by cryo-microscopy. Cem. Concr. Res. 2008, 38, 522–529. [Google Scholar] [CrossRef]
  28. Hesse, C.; Goetz-Neunhoeffer, F.; Neubauer, J. A new approach in quantitative in-situ XRD of cement pastes: Correlation of heat flow curves with early hydration reactions. Cem. Concr. Res. 2011, 41, 123–128. [Google Scholar] [CrossRef]
  29. Wang, Y.W.; Kim, Y.-Y.; Christenson, H.K.; Meldrum, F.C. A new precipitation pathway for calcium sulfate dihydrate (gypsum) via amorphous and hemihydrate intermediates. Chem. Commun. 2012, 48, 504–506. [Google Scholar] [CrossRef]
  30. Ferrari, L.; Kaufmann, J.; Winnefeld, F.; Plank, J. Impact of particle size on interaction forces between ettringite and dispersing comb-polymers in various electrolyte solutions. J. Colloid Interface Sci. 2014, 419, 17–24. [Google Scholar] [CrossRef]
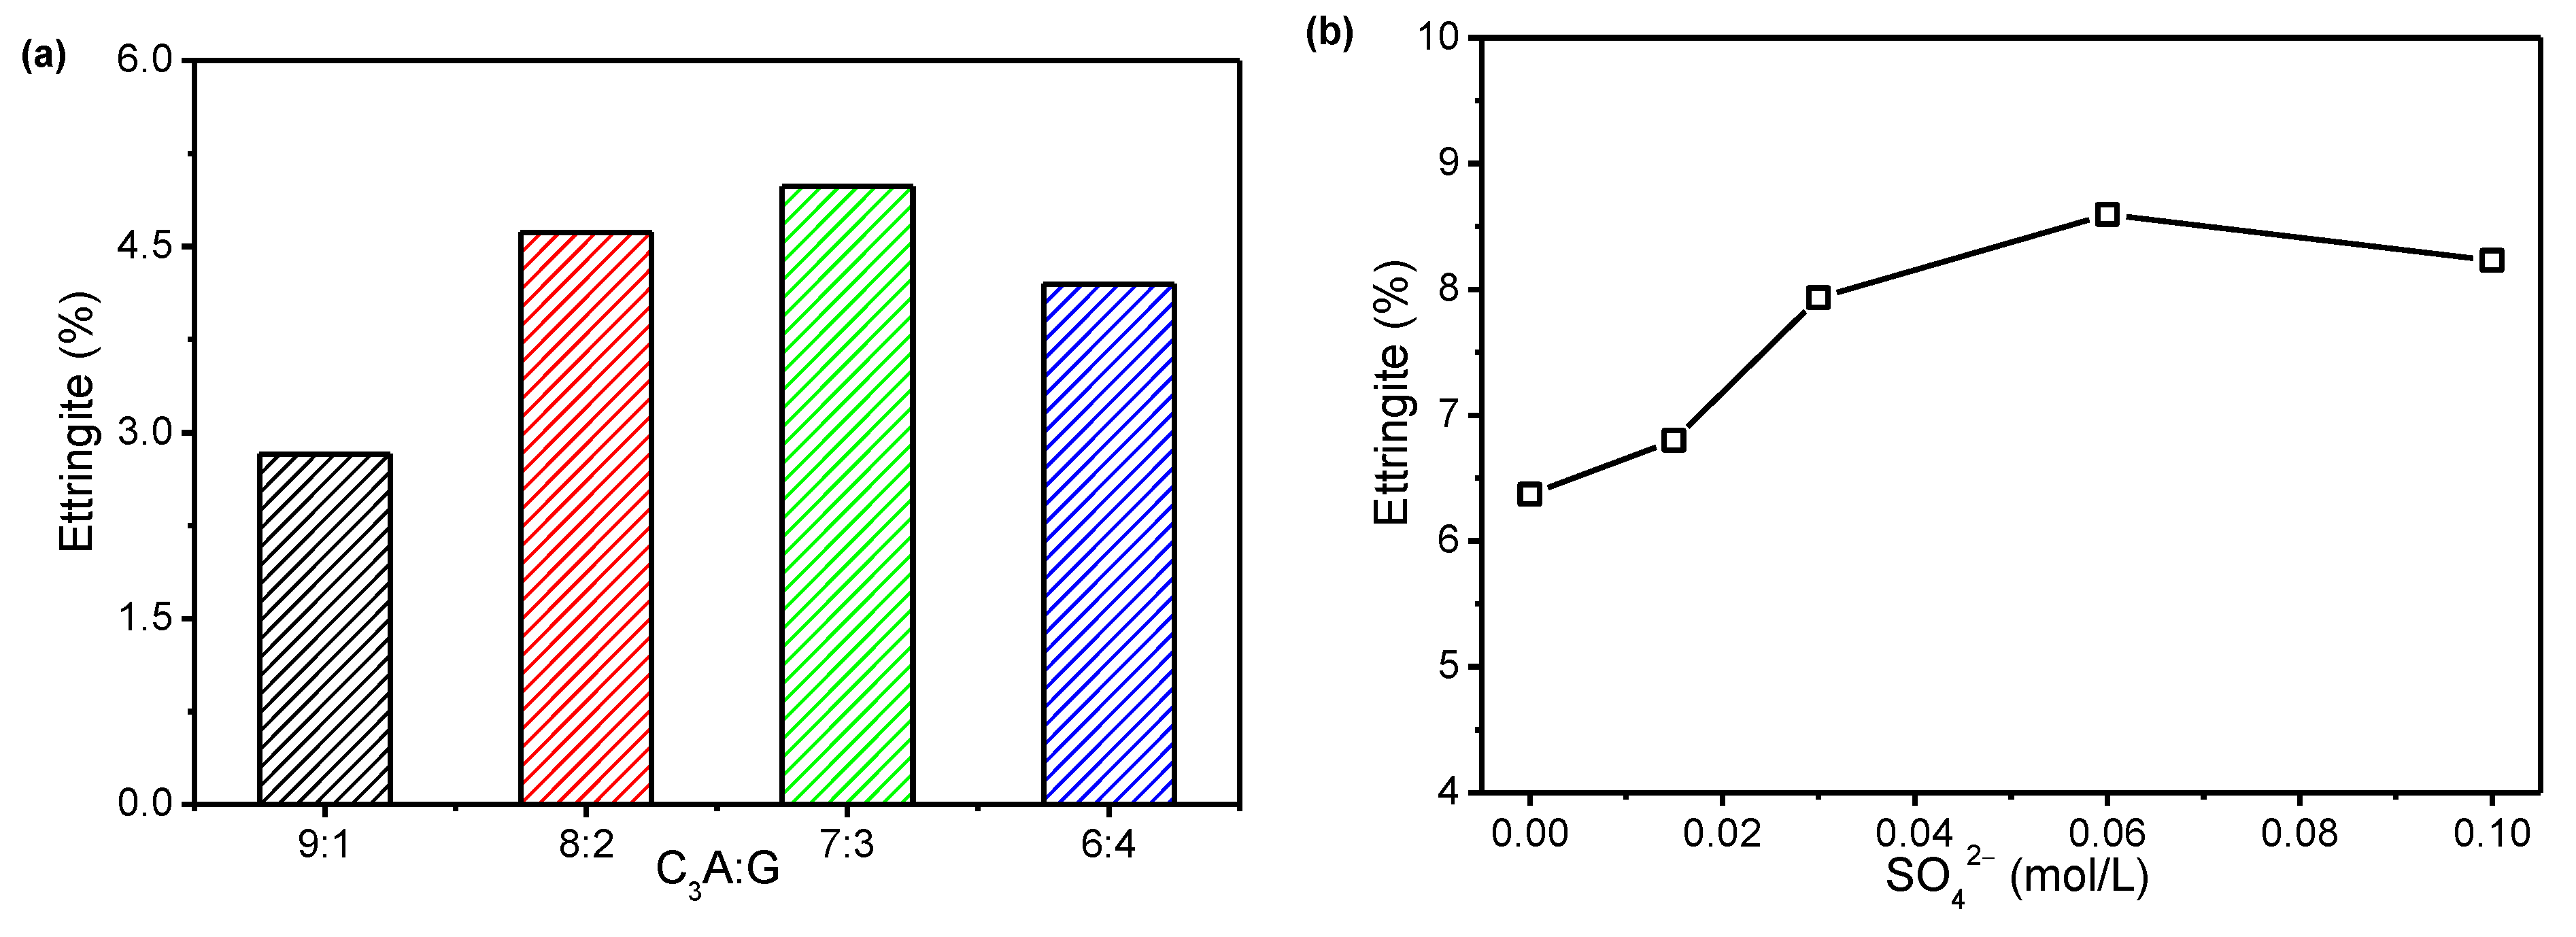
Figure 1. Amount of precipitated ettringite at 20 min: (a) effect of C3A/G; (b) effect of SO42− concentration in simulated solution.
Materials 15 06934 g001
Figure 2. Amount of precipitated ettringite during the first hour: (a) effect of SO42− concentration in simulated solution; (b) effect of hemihydrate and Na2SO4 in solid.
Materials 15 06934 g002
Figure 3. Specific surface area at the first 20 min: (a) effect of C3A/G; (b) effect of the SO42− concentration in simulated solutions.
Materials 15 06934 g003
Figure 4. Specific surface area along C3A hydration: (a) effect of SO42− concentration in simulated solution; (b) effect of hemihydrate and Na2SO4 in solid.
Materials 15 06934 g004
Figure 5. Specific surface area of ettringite precipitating along the C3A hydration: (a) effect of SO42− concentration in simulated solution; (b) effect of Na2SO4 in solid.
Materials 15 06934 g005
Figure 6. Effect of the proportion of gypsum in the C3A-gypsum system on morphology of precipitated ettringite.
Materials 15 06934 g006
Figure 7. Effect of SO42− concentration in simulated solution and Na2SO4 in solid on morphology of precipitated ettringite.
Materials 15 06934 g007
Figure 8. Morphology of precipitated ettringite and gypsum in the C3A-gypsum systems with hemihydrate.
Materials 15 06934 g008
Table 1. The compositions of the simulated solutions.
CodeNa2SO4 (mol/L)NaNO3 (mol/L)Na+ (mol/L)SO42− (mol/L)
S-000.20.20
S-0.015 mol/L0.0150.170.20.015
S-0.03 mol/L0.030.140.20.03
S-0.06 mol/L0.060.080.20.06
S-0.1 mol/L0.100.20.1
Table 2. Mixture proportions and codes for C3A hydration at 20 min.
CodeC3A%G%PC/%Mix Water
C3A/G = 90/1090100.1Deionized water
C3A/G = 80/2080200.1
C3A/G = 70/3070300.1
C3A/G = 60/4060400.1
S-070300.1S-0
S-0.01570300.1S-0.015
S-0.0370300.1S-0.03
S-0.0670300.1S-0.06
S-0.170300.1S-0.1
Table 3. Mixture proportions and codes for C3A hydration in the first hour.
CodeC3A/%G/%H/%S/%PC/%Mix Water
S07030000.1S0
S0-0.0157030000.1S0-0.015
S0-0.067030000.1S0-0.06
C3A/G = 70/307030000.1Deionized water
C3A/G/H = 70/20/1070201000.1
C3A/G/H = 70/10/2070102000.1
C3A/G/S = 70/28.3/1.77028.301.70.1
C3A/G/S = 70/26.4/3.47026.403.40.1
Publisher’s Note: MDPI stays neutral with regard to jurisdictional claims in published maps and institutional affiliations.