
Characterization of Synovial Fluid Components: Albumin-Chondroitin Sulfate Interactions Seen through Molecular Dynamics


Abstract
1. Introduction
2. Materials and Methods
2.1. Characterisation of Simulated Materials
2.2. Molecular Dynamic Simulation Details
3. Results and Discussion
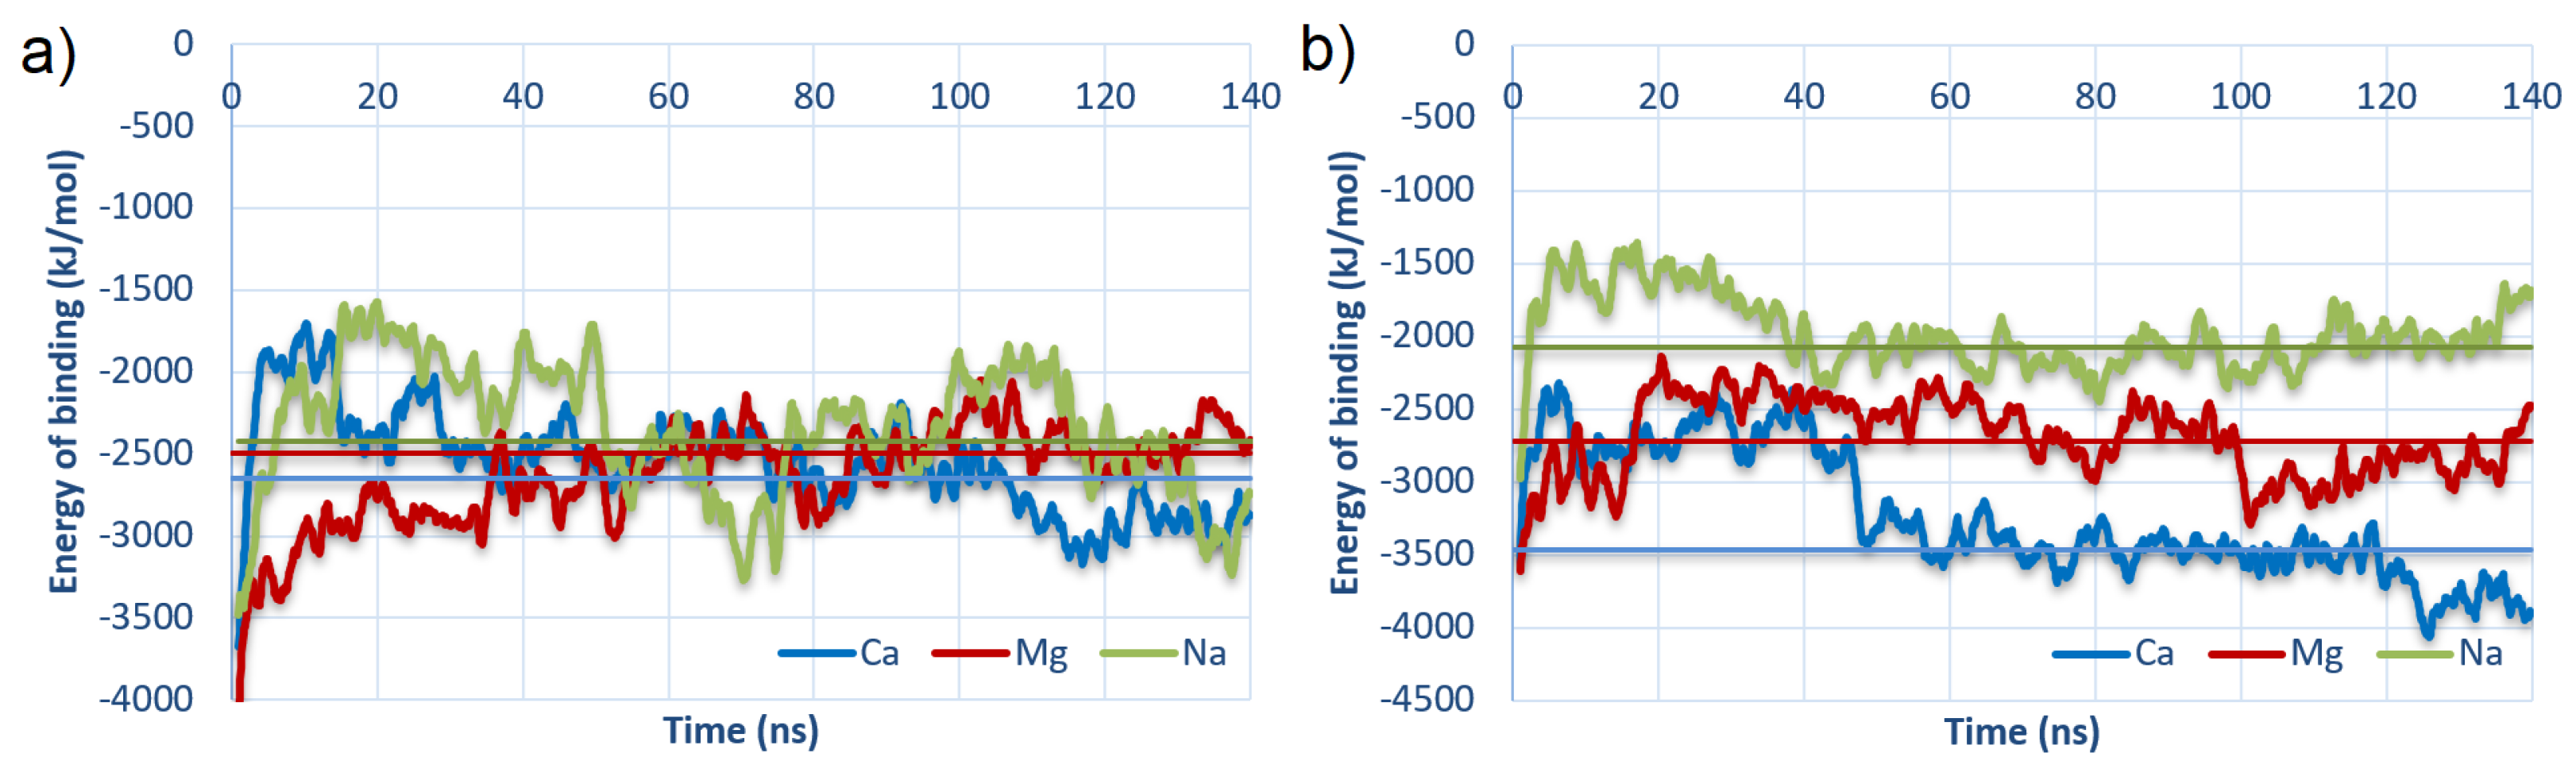
3.1. Energy of Binding
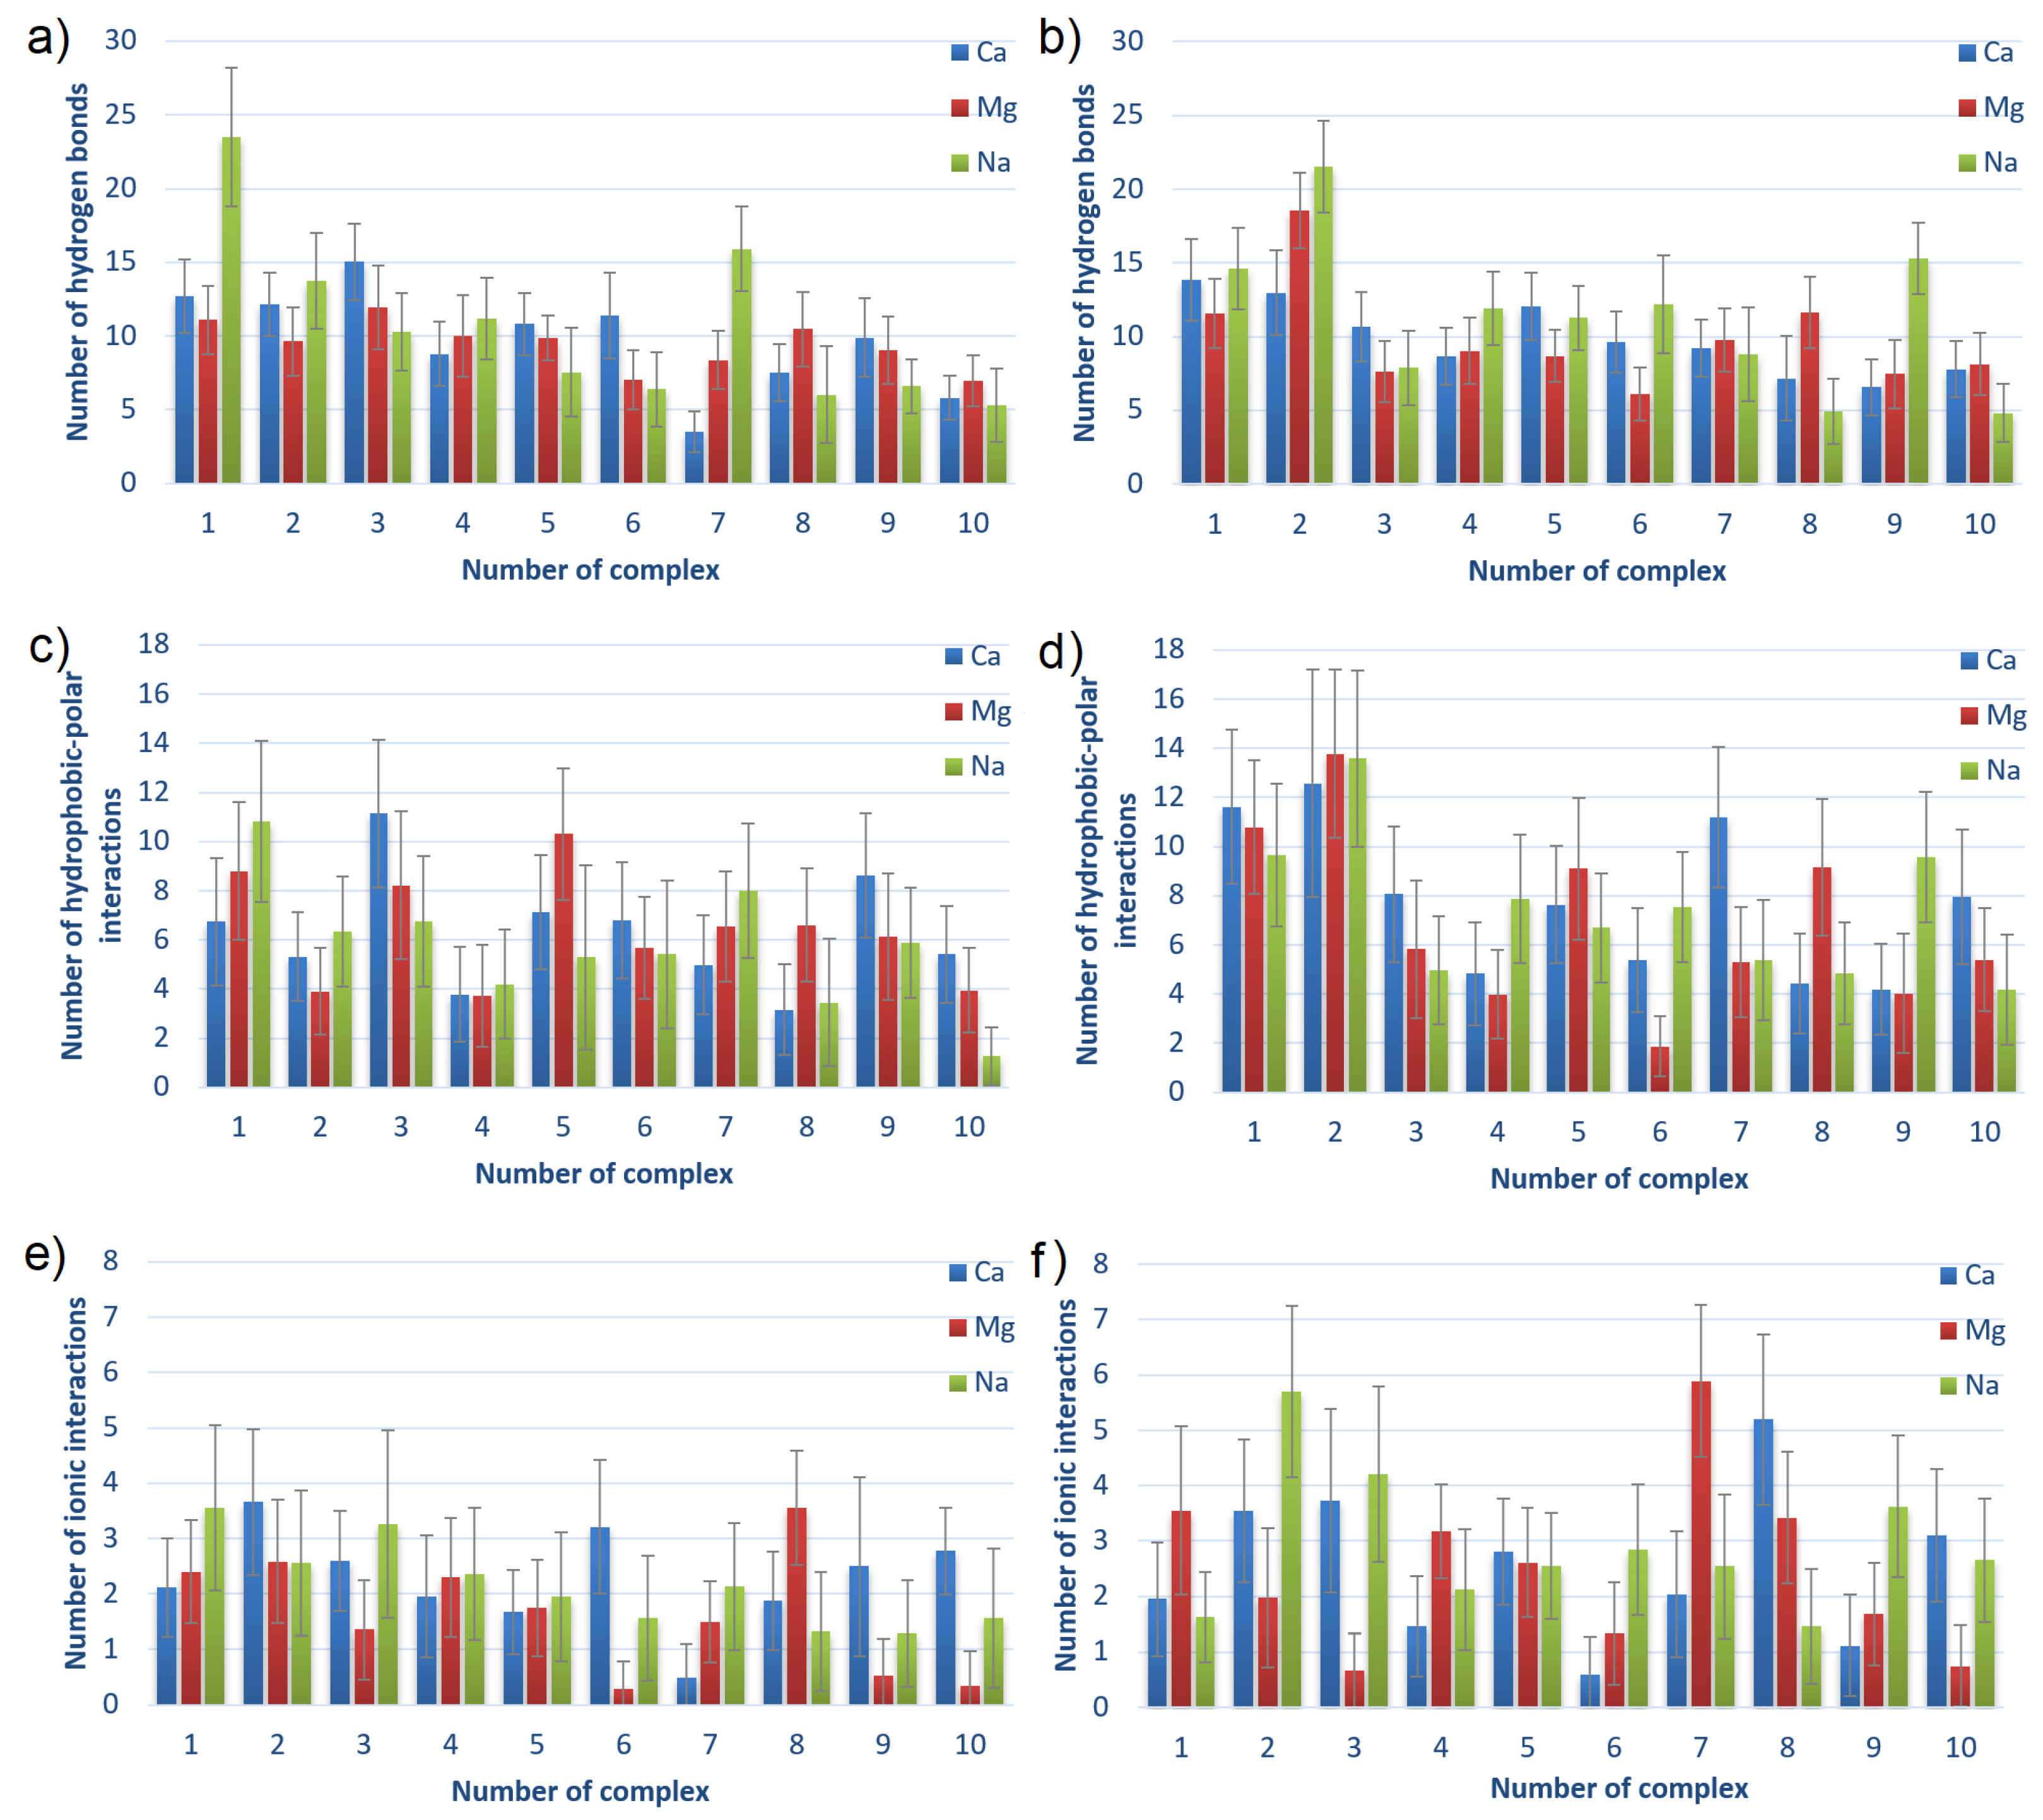
3.2. Intermolecular Interactions
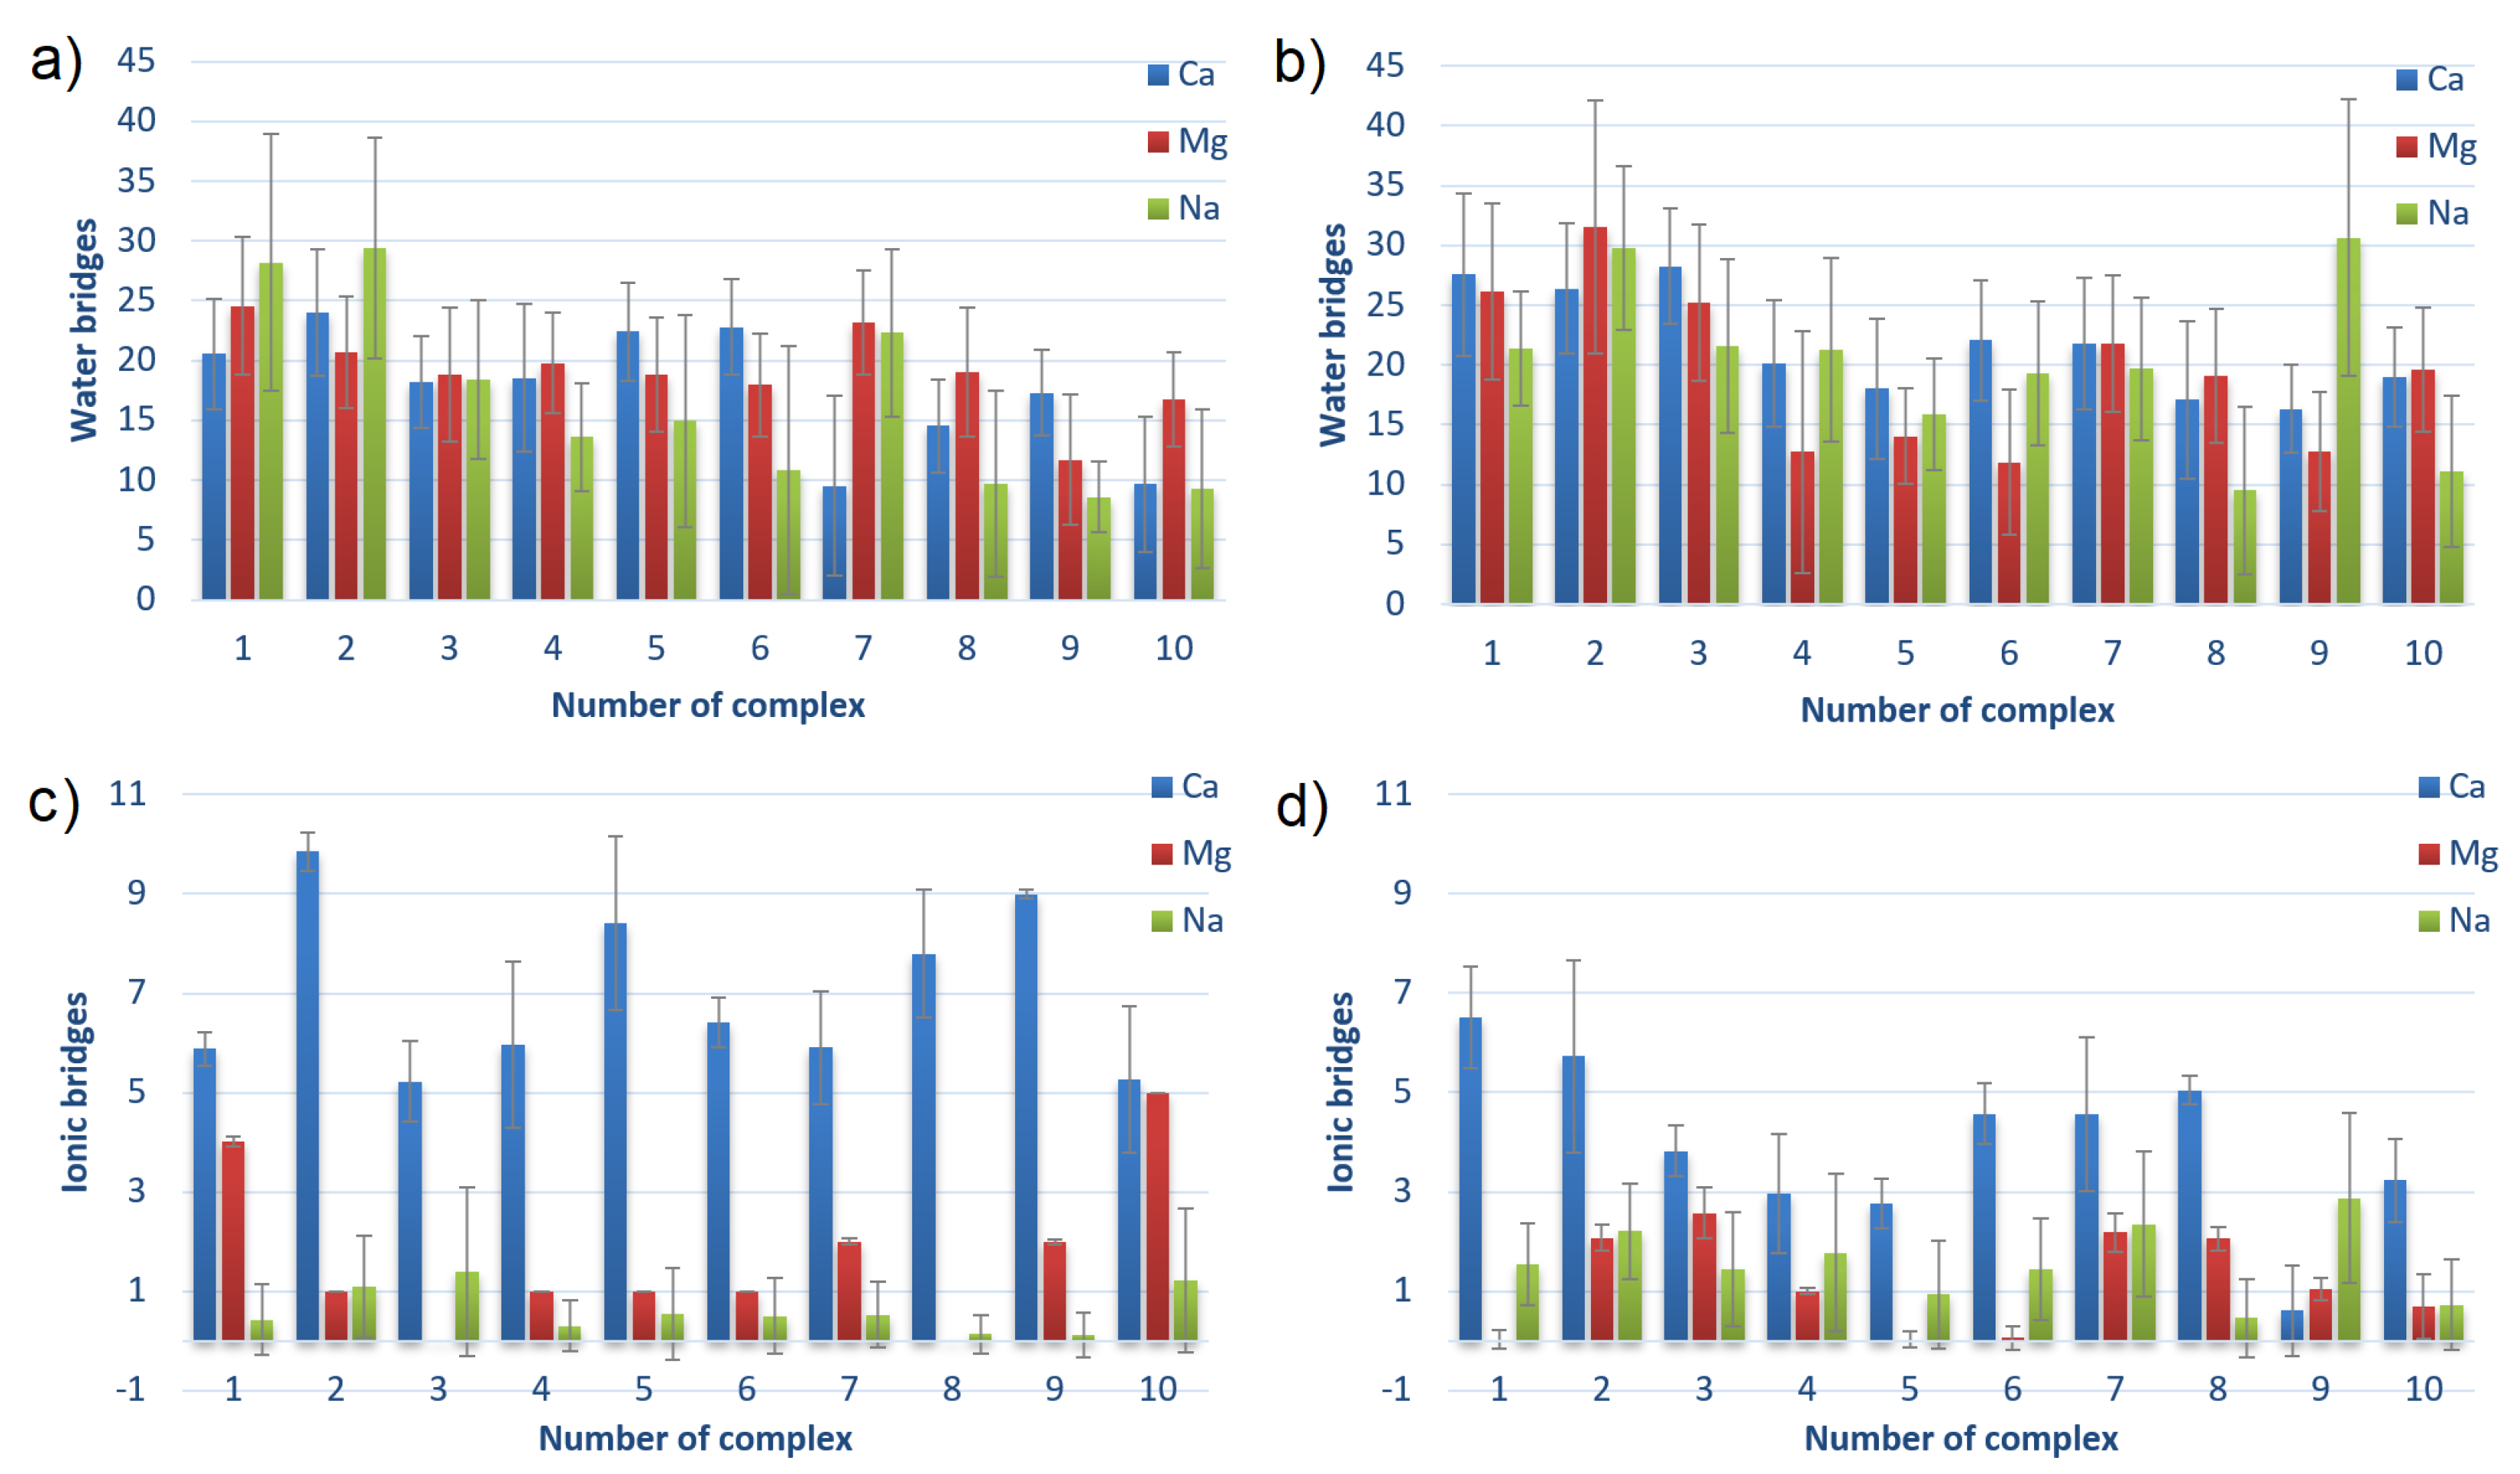
3.3. Water and Ionic Bridges
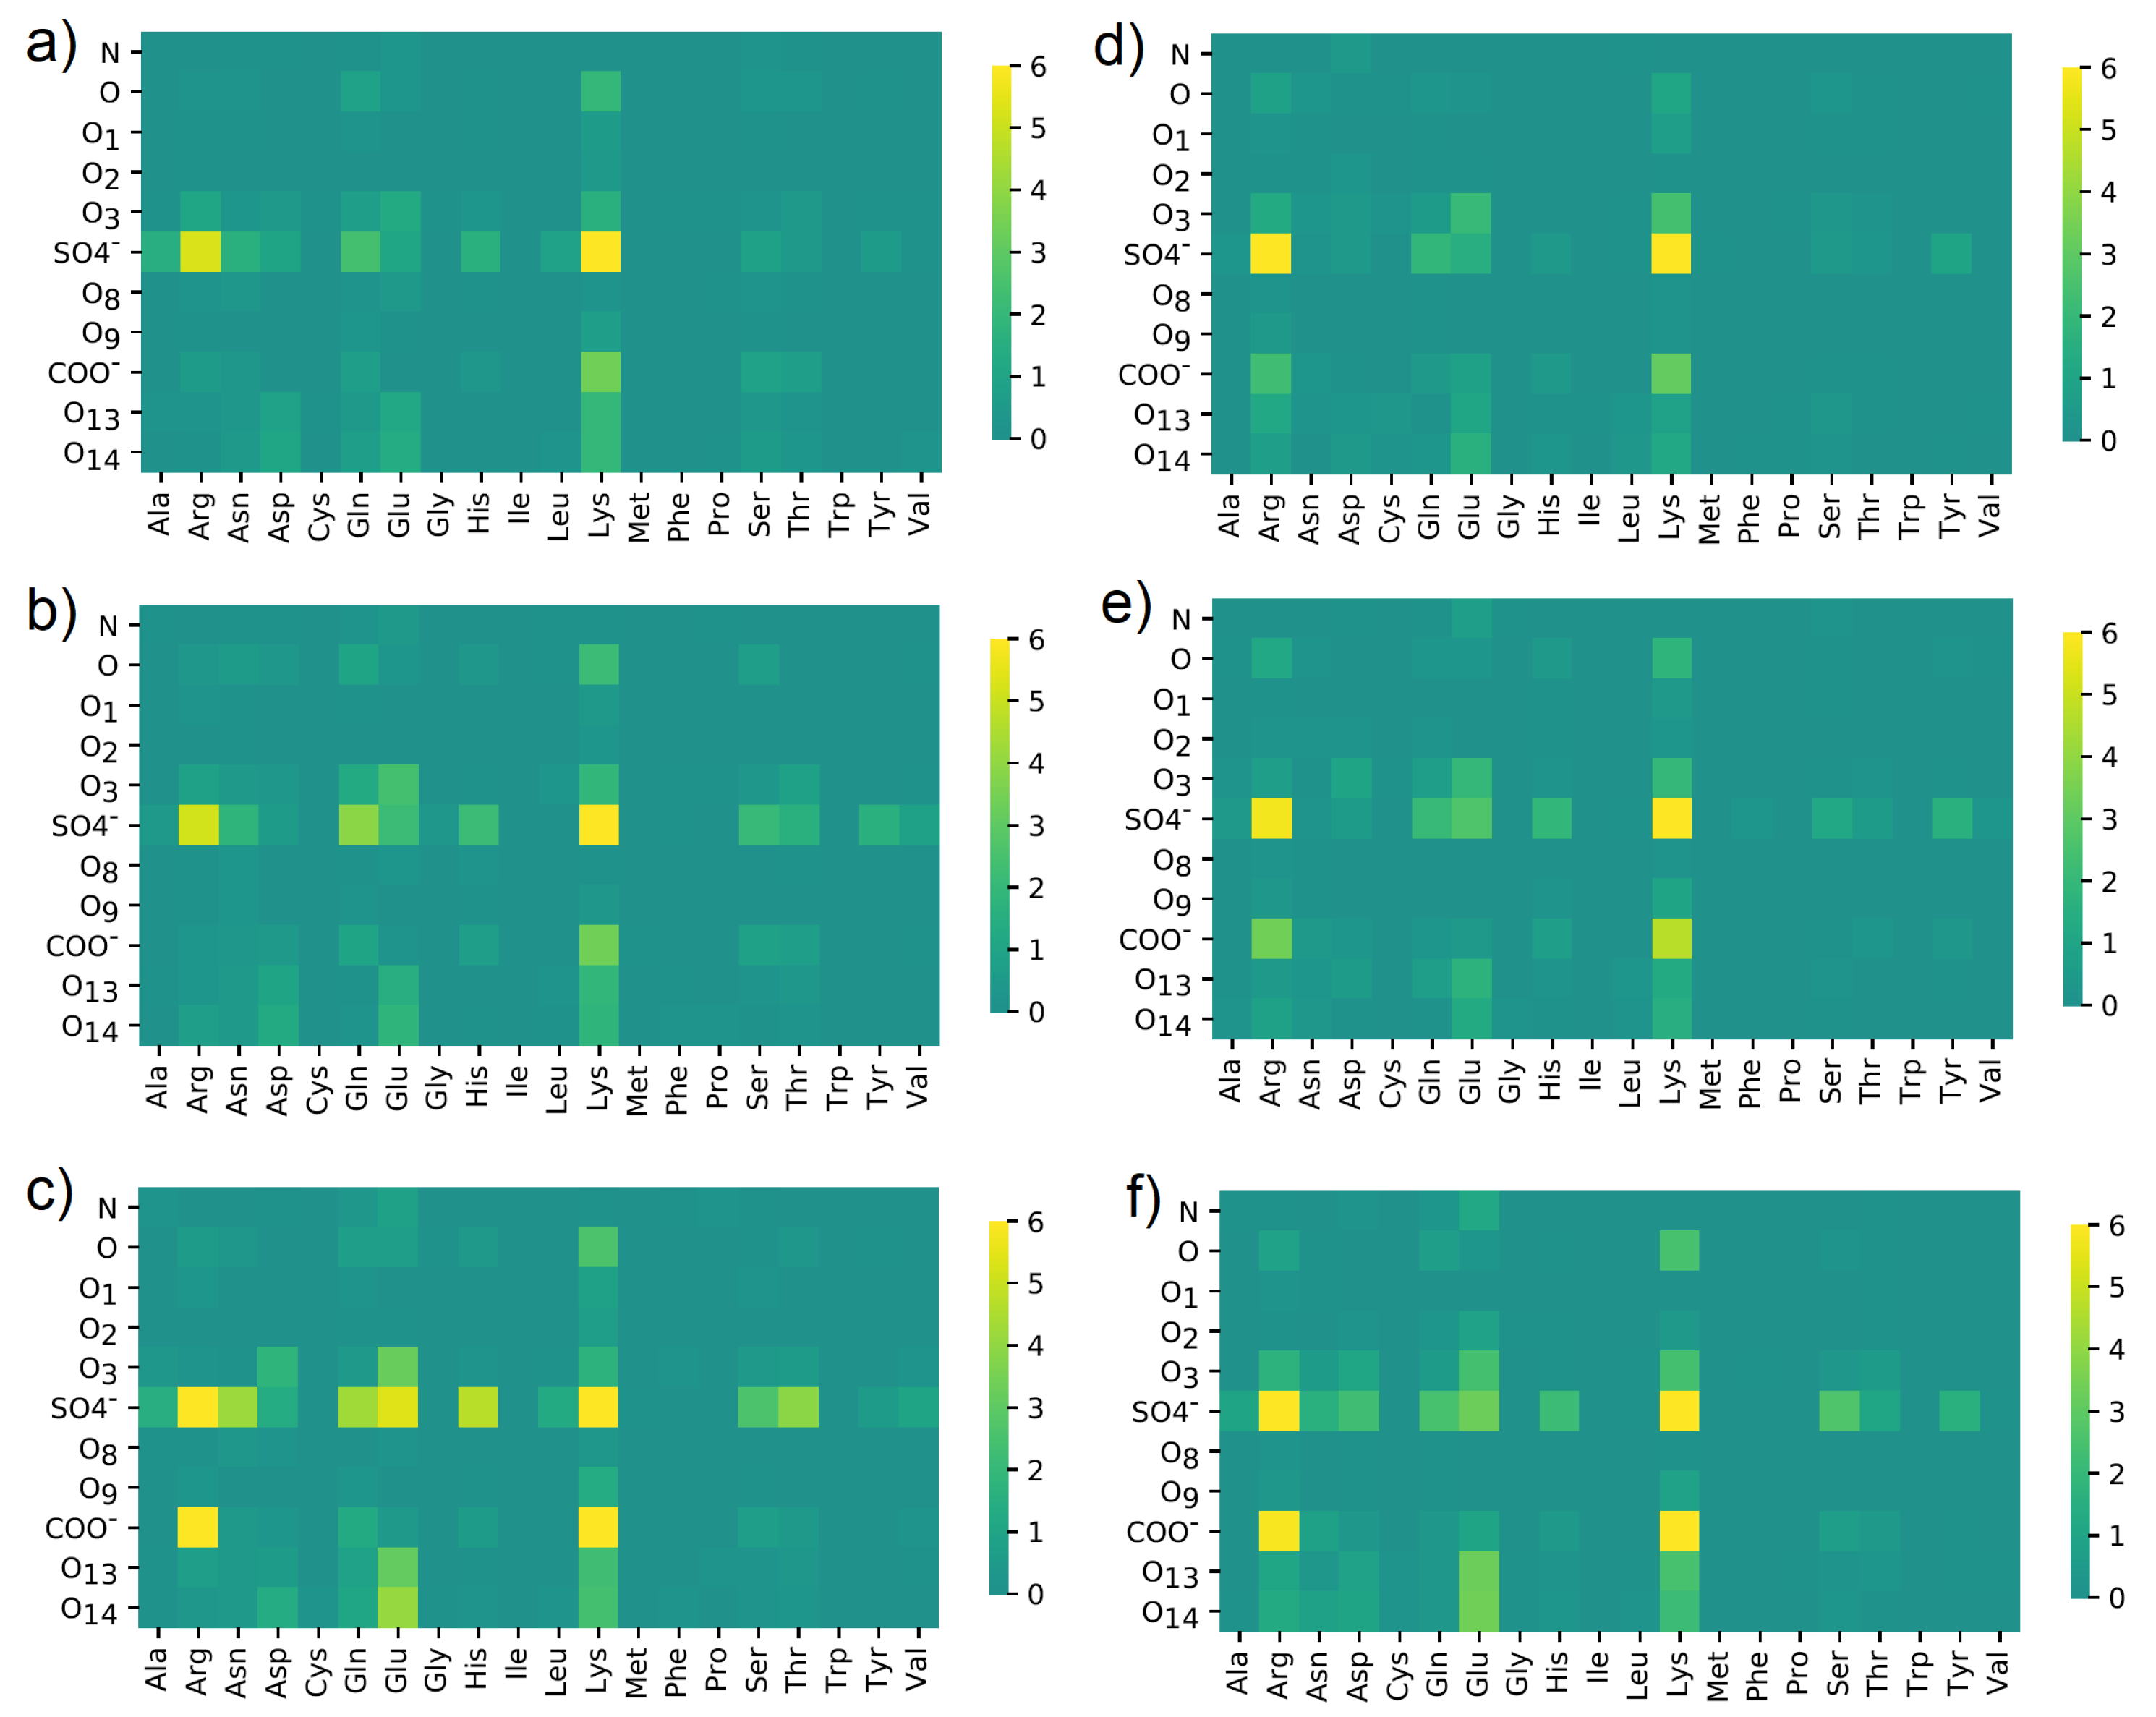
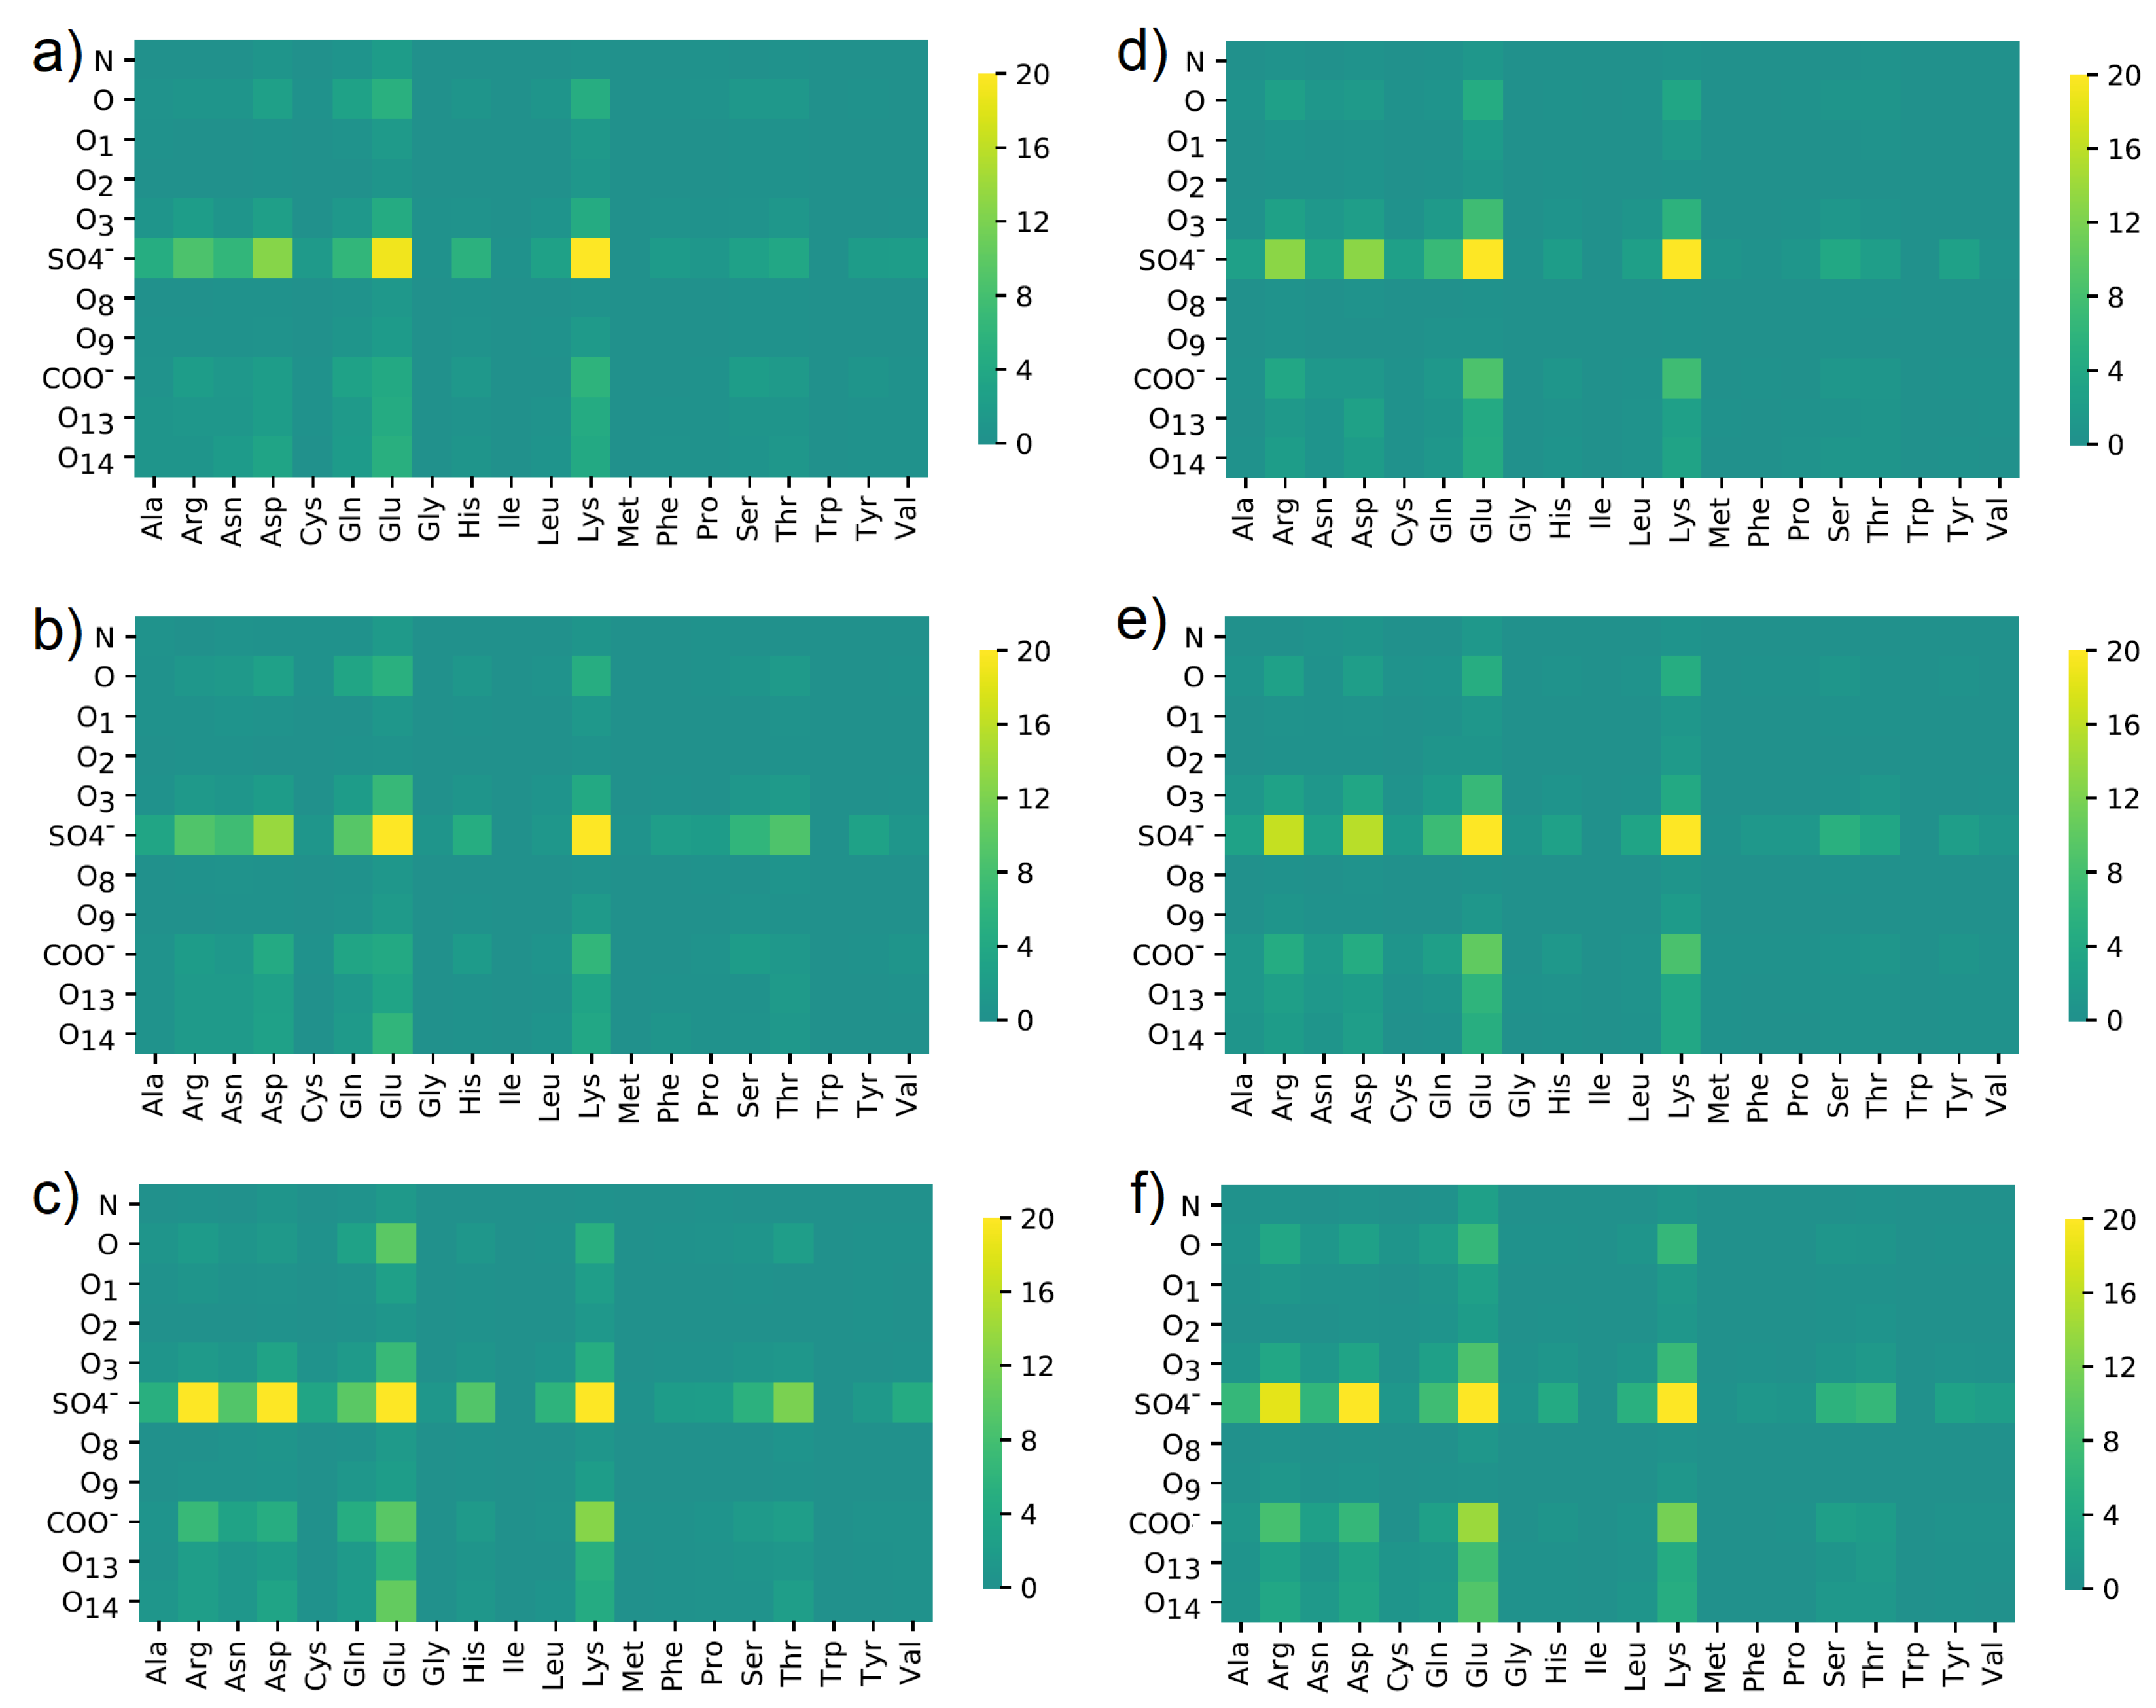
3.4. Maps of Interactions
4. Conclusions
Supplementary Materials
Author Contributions
Funding
Institutional Review Board Statement
Informed Consent Statement
Data Availability Statement
Acknowledgments
Conflicts of Interest
Abbreviations
| AC | articular cartilage |
| SF | synovial fluid |
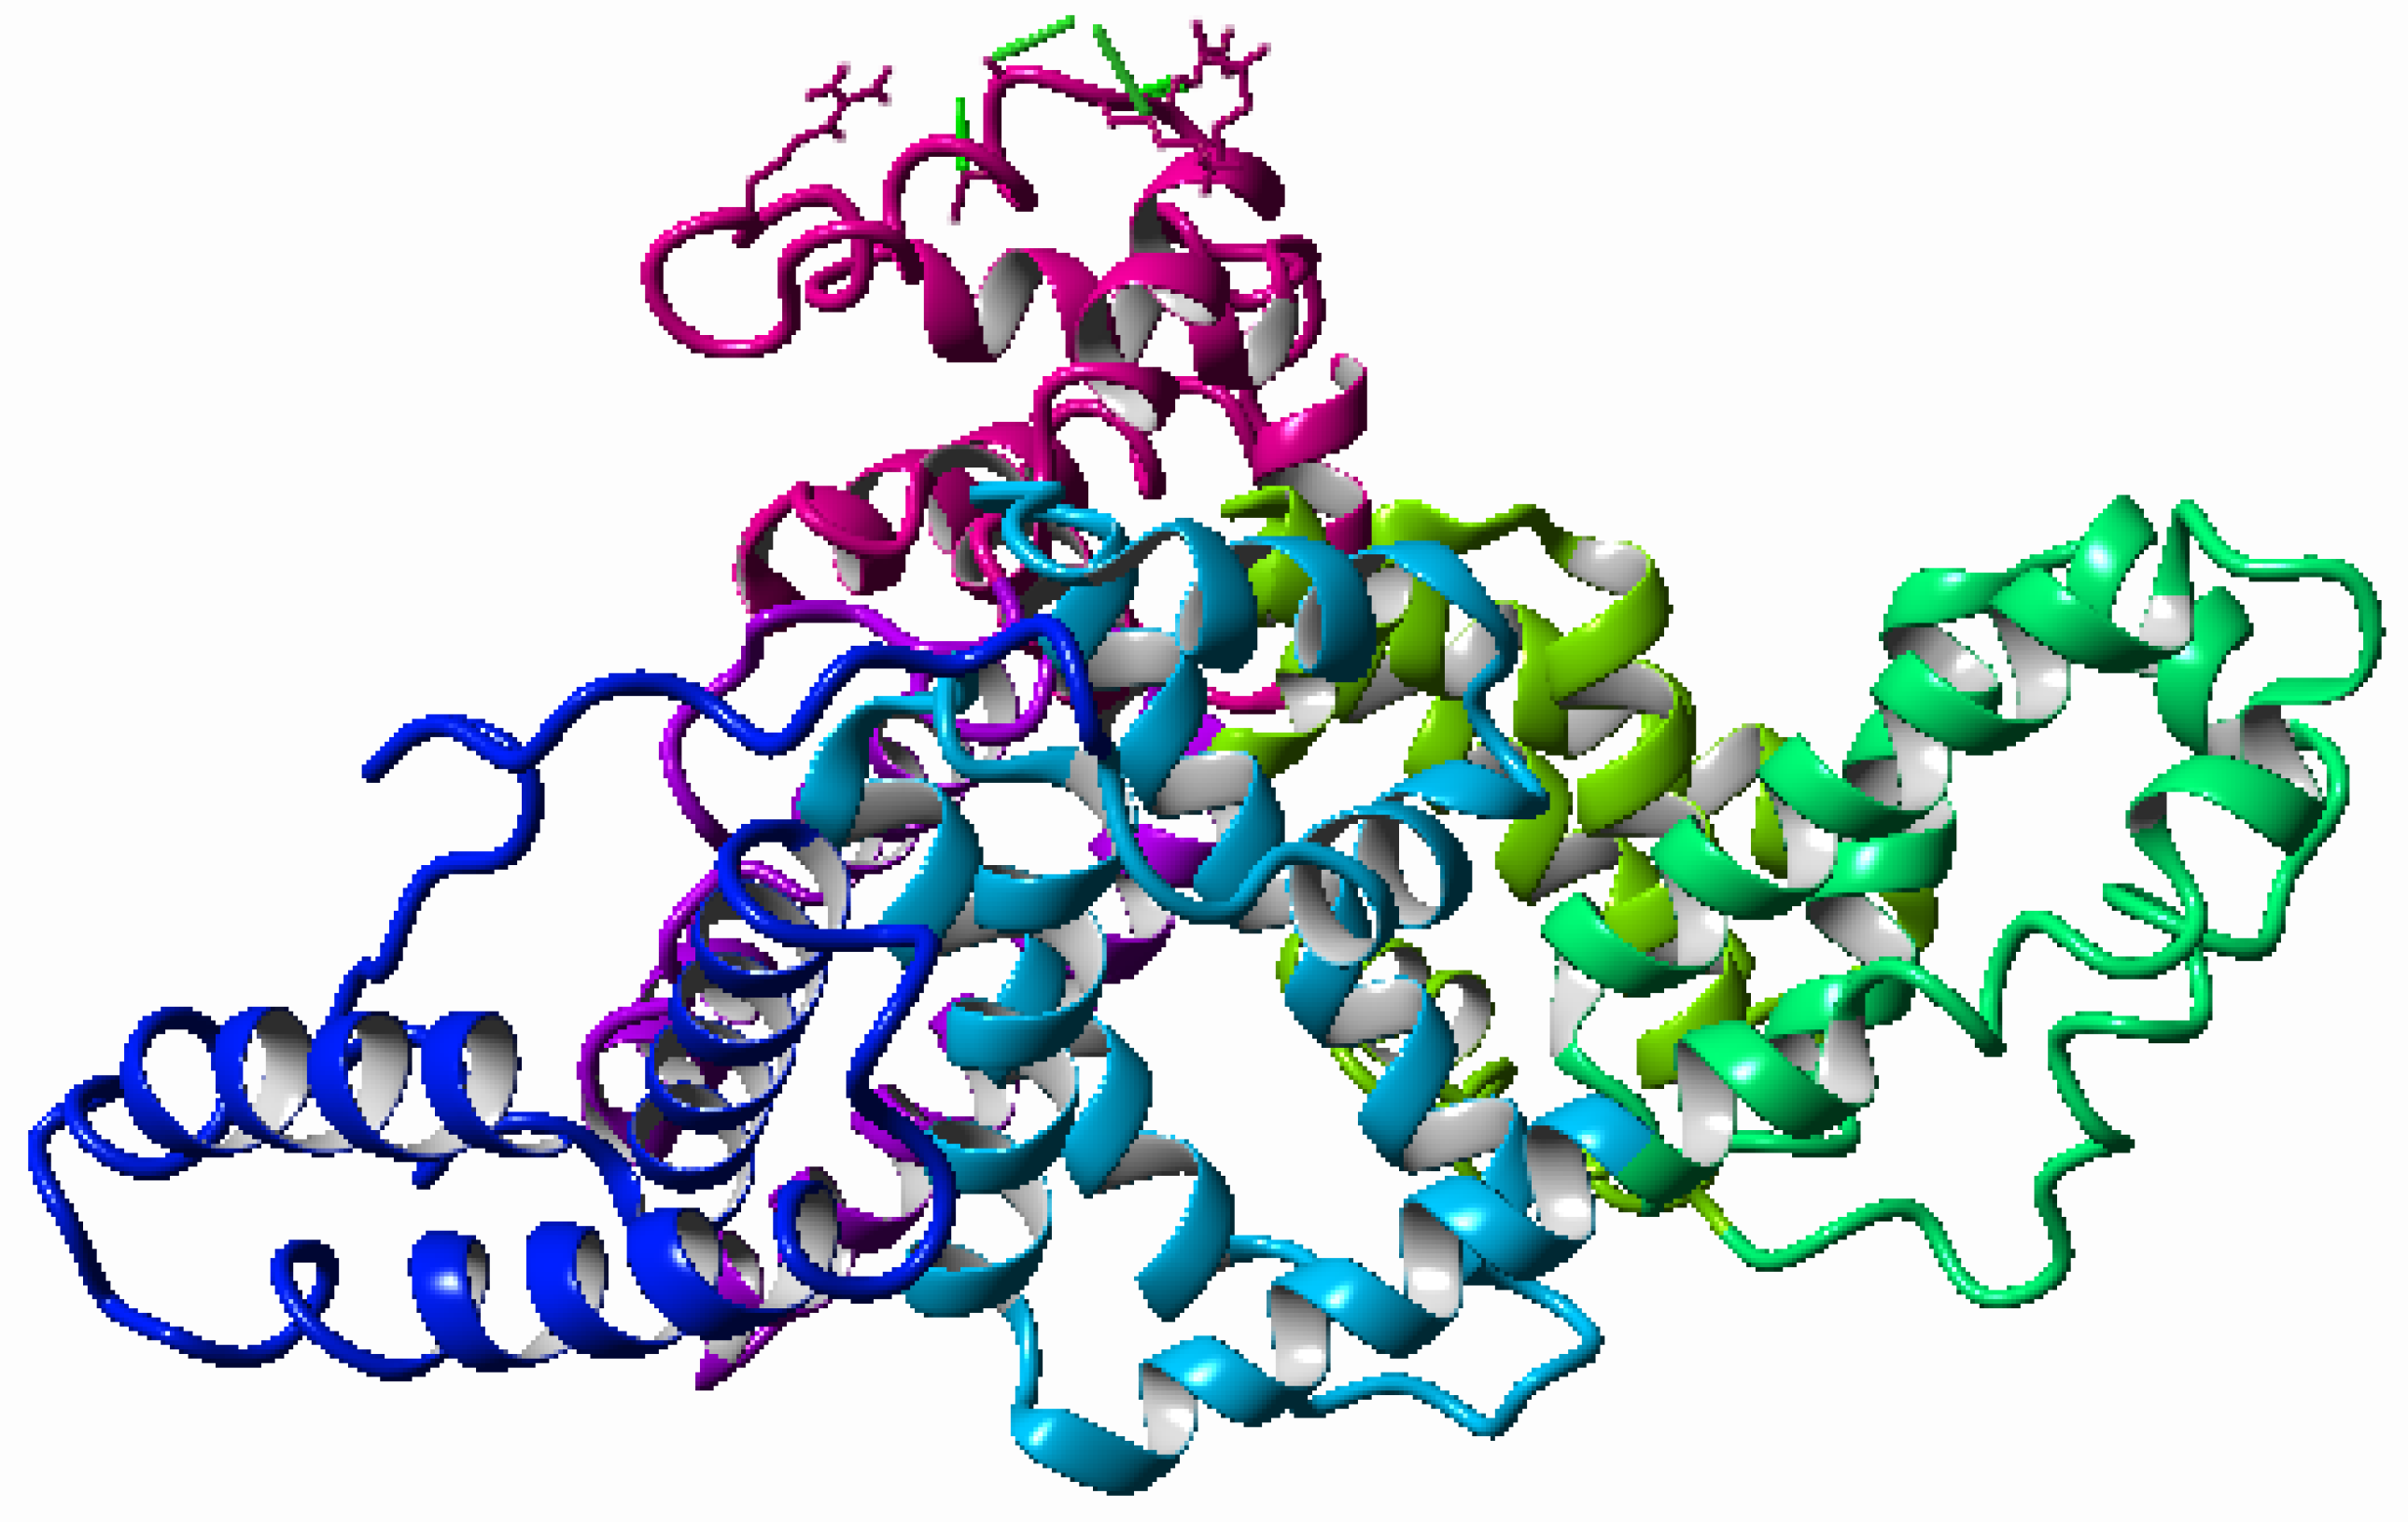
| HSA | human serum albumin |
| HA | hyaluronic acid |
| CS | chondroitin sulfate |
| CS-4 | chondroitin 4 sulfate |
| CS-6 | chondroitin 6 sulfate |
| GAG | glycosaminoglycan |
| MD | molecular dynamics |
| MDoc | molecular docking |
| PDB | Protein Data Bank |
| EoB | energy of binding |
References
- Furmann, D.; Nečas, D.; Rebenda, D.; Čipek, P.; Vrbka, M.; Křupka, I.; Hartl, M. The effect of synovial fluid composition, speed and load on frictional behaviour of articular cartilage. Materials 2020, 13, 1334. [Google Scholar] [CrossRef]
- Mazurkiewicz, A. The effect of trabecular bone storage method on its elastic properties. Acta Bioeng. Biomech. 2018, 20, 21–27. [Google Scholar] [CrossRef] [PubMed]
- Mazurkiewicz, A.; Topoliński, T. Relationship between the mineral content of human trabecular bone and selected parameters determined from fatigue test at stepwise-increasing amplitude. Acta Bioeng. Biomech. 2017, 19, 19–26. [Google Scholar] [CrossRef] [PubMed]
- Topoliński, T.; Cichański, A.; Mazurkiewicz, A.; Nowicki, K. Fatigue Energy Dissipation in Trabecular Bone Samples with Stepwise-Increasing Amplitude Loading. Mater. Test. 2011, 53, 344–350. [Google Scholar] [CrossRef]
- Jones, B.K.; Durney, K.M.; Hung, C.T.; Ateshian, G.A. The friction coefficient of shoulder joints remains remarkably low over 24h of loading. J. Biomech. 2015, 48, 3945–3949. [Google Scholar] [CrossRef][Green Version]
- Bełdowski, P.; Kruszewska, N.; Yuvan, S.; Dendzik, Z.; Goudoulas, T.; Gadomski, A. Capstan-like mechanism in hyaluronan-phospholipid systems. Chem. Phys. Lipids 2018, 216, 17–24. [Google Scholar] [CrossRef] [PubMed]
- Pawlak, Z.; Urbaniak, W.; Hagner-Derengowska, M.; Hagner, W. The Probable Explanation for the Low Friction of Natural Joints. Cell Biochem. Biophys. 2015, 71, 1615–1621. [Google Scholar] [CrossRef]
- Ateshian, G.A. A theoretical formulation for boundary friction in articular cartilage. J. Biomech. Eng. 1997, 119, 81–86. [Google Scholar] [CrossRef] [PubMed]
- Gadomski, A.; Pawlak, Z.; Oloyede, A. Directed ion transport as virtual cause of some facilitated friction–lubrication mechanism prevailing in articular cartilage: A hypothesis. Tribol. Lett. 2008, 30, 83–90. [Google Scholar] [CrossRef]
- Gadomski, A.; Bełdowski, P.; Rubí, J.M.; Urbaniak, W.; Augé, W.K.; Santamaría-Holek, I.; Pawlak, Z. Some conceptual thoughts toward nanoscale oriented friction in a model of articular cartilage. Math. Biosci. 2013, 244, 188–200. [Google Scholar] [CrossRef]
- McNary, S.M.; Athanasiou, K.A.; Reddi, A.H. Engineering lubrication in articular cartilage. Tiss. Eng. Part B Rev. 2012, 18, 88–100. [Google Scholar] [CrossRef]
- Bełdowski, P.; Przybyłek, M.; Raczyński, P.; Dėdinaitė, A.; Górny, K.; Wieland, F.; Dendzik, Z.; Sionkowska, A.; Claesson, P.M. Albumin-Hyaluronan Interactions: Influence of Ionic Composition Probed by Molecular Dynamics. Int. J. Mol. Sci. 2021, 22, 12360. [Google Scholar] [CrossRef]
- Dėdinaitė, A.; Wieland, D.F.; Bełdowski, P.; Claesson, P.M. Biolubrication synergy: Hyaluronan—Phospholipid interactions at interfaces. Adv. Colloid Interf. Sci. 2019, 274, 102050. [Google Scholar] [CrossRef]
- Bełdowski, P.; Mazurkiewicz, A.; Topoliński, T.; Małek, T. Hydrogen and Water Bonding between Glycosaminoglycans and Phospholipids in the Synovial Fluid: Molecular Dynamics Study. Materials 2019, 12, 2060. [Google Scholar] [CrossRef]
- Kruszewska, N.; Domino, K.; Drelich, R.; Urbaniak, W.; Petelska, A.D. Interactions between Beta-2-Glycoprotein-1 and Phospholipid Bilayer-A Molecular Dynamic Study. Membranes 2020, 10, 396. [Google Scholar] [CrossRef]
- Dėdinaitė, A.; Claesson, P.M. Synergies in lubrication. Phys. Chem. Chem. Phys. 2017, 19, 23677–23689. [Google Scholar] [CrossRef]
- Zander, T.; Garamus, V.M.; Dédinaité, A.; Claesson, P.M.; Bełdowski, P.; Górny, K.; Dendzik, Z.; Wieland, D.C.F.; Willumeit-Römer, R. Influence of the Molecular Weight and the Presence of Calcium Ions on the Molecular Interaction of Hyaluronan and DPPC. Molecules 2020, 25, 3907. [Google Scholar] [CrossRef]
- Zander, T.; Wieland, D.F.; Raj, A.; Wang, M.; Nowak, B.; Krywka, C.; Dėdinaitė, A.; Claesson, P.M.; Garamus, V.M.; Schreyer, A.; et al. The influence of hyaluronan on the structure of a DPPC—bilayer under high pressures. Colloids Surf. B Biointerf. 2016, 142, 230–238. [Google Scholar] [CrossRef]
- Nalbant, S.; Martinez, J.; Kitumnuaypong, T.; Clayburne, G.; Sieck, M.; Schumacher, H. Synovial fluid features and their relations to osteoarthritis severity: New findings from sequential studies. Osteoarthr. Cartil. 2003, 11, 50–54. [Google Scholar] [CrossRef]
- Struglics, A.; Larsson, S.; Pratta, M.; Kumar, S.; Lark, M.; Lohmander, L. Human osteoarthritis synovial fluid and joint cartilage contain both aggrecanase- and matrix metalloproteinase-generated aggrecan fragments. Osteoarthr. Cartil. 2006, 14, 101–113. [Google Scholar] [CrossRef]
- Goudoulas, T.B.; Kastrinakis, E.G.; Nychas, S.G.; Papazoglou, L.G.; Kazakos, G.M.; Kosmas, P.V. Rheological study of synovial fluid obtained from dogs: Healthy, pathological, and post-surgery, after spontaneous rupture of cranial cruciate ligament. Ann. Biomed. Eng. 2010, 38, 57–65. [Google Scholar] [CrossRef] [PubMed]
- Lin, W.; Mashiah, R.; Seror, J.; Kadar, A.; Dolkart, O.; Pritsch, T.; Goldberg, R.; Klein, J. Lipid-hyaluronan synergy strongly reduces intrasynovial tissue boundary friction. Acta Biomater. 2019, 83, 314–321. [Google Scholar] [CrossRef] [PubMed]
- Seror, J.; Zhu, L.; Goldberg, R.; Day, A.J.; Klein, J. Supramolecular synergy in the boundary lubrication of synovial joints. Nat. Commun. 2015, 6, 6497. [Google Scholar] [CrossRef] [PubMed]
- Bełdowski, P.; Yuvan, S.; Dėdinaitė, A.; Claesson, P.M.; Pöschel, T. Interactions of a short hyaluronan chain with a phospholipid membrane. Colloids Surf. B Biointerf. 2019, 184, 110539. [Google Scholar] [CrossRef]
- Gold, E.W. An interaction of albumin with hyaluronic acid and chondroitin sulfate: A study of affinity chromatography and circular dichroism. Biopolymers 1980, 19, 1407–1414. [Google Scholar] [CrossRef]
- Gandhi, N.S.; Mancera, R.L. The Structure of Glycosaminoglycans and their Interactions with Proteins. Chem. Biol. Drug Des. 2008, 72, 455–482. [Google Scholar] [CrossRef]
- Hubert, J.; Beil, F.T.; Rolvien, T.; Butscheidt, S.; Hischke, S.; Püschel, K.; Frosch, S.; Mussawy, H.; Ries, C.; Hawellek, T. Cartilage calcification is associated with histological degeneration of the knee joint: A highly prevalent, age-independent systemic process. Osteoarthr. Cartil. 2020, 28, 1351–1361. [Google Scholar] [CrossRef]
- Mourão, P.A. Distribution of chondroitin 4-sulfate and chondroitin 6-sulfate in human articular and growth cartilage. Arthritis Rheum. 1988, 31, 1028–1033. [Google Scholar] [CrossRef]
- Baeurle, S.; Kiselev, M.; Makarova, E.; Nogovitsin, E. Effect of the counterion behavior on the frictional-compressive properties of chondroitin sulfate solutions. Polymer 2009, 50, 1805–1813. [Google Scholar] [CrossRef]
- Zhang, Z.; Barman, S.; Christopher, G.F. The role of protein content on the steady and oscillatory shear rheology of model synovial fluids. Soft Matter 2014, 10, 5965–5973. [Google Scholar] [CrossRef]
- Katta, J.; Jin, Z.; Ingham, E.; Fisher, J. Chondroitin sulphate: An effective joint lubricant? Osteoarthr. Cartil. 2009, 17, 1001–1008. [Google Scholar] [CrossRef]
- Basalo, I.M.; Chahine, N.O.; Kaplun, M.; Chen, F.H.; Hung, C.T.; Ateshian, G.A. Chondroitin sulfate reduces the friction coefficient of articular cartilage. J. Biomech. 2007, 40, 1847–1854. [Google Scholar] [CrossRef]
- Wu, T.t.; Gan, X.q.; Cai, Z.b.; Zhu, M.h.; Qiao, M.t.; Yu, H.y. The lubrication effect of hyaluronic acid and chondroitin sulfate on the natural temporomandibular cartilage under torsional fretting wear. Lubr. Sci. 2014, 27, 29–44. [Google Scholar] [CrossRef]
- Guizado, T.R.C. Analysis of the structure and dynamics of human serum albumin. J. Mol. Model. 2014, 20, 2450. [Google Scholar] [CrossRef] [PubMed]
- Fasano, M.; Curry, S.; Terreno, E.; Galliano, M.; Fanali, G.; Narciso, P.; Notari, S.; Ascenzi, P. The extraordinary ligand binding properties of human serum albumin. IUBMB Life Int. Union Biochem. Mol. Biol. Life 2005, 57, 787–796. [Google Scholar] [CrossRef]
- De Simone, G.; di Masi, A.; Ascenzi, P. Serum Albumin: A Multifaced Enzyme. Int. J. Mol. Sci. 2021, 22, 10086. [Google Scholar] [CrossRef] [PubMed]
- Sugio, S.; Kashima, A.; Mochizuki, S.; Noda, M.; Kobayashi, K. Crystal structure of human serum albumin at 2.5A resolution. Protein Eng. Des. Sel. 1999, 12, 439–446. [Google Scholar] [CrossRef]
- Spector, A. Fatty acid binding to plasma albumin. J. Lipid Res. 1975, 16, 165–179. [Google Scholar] [CrossRef]
- van der Vusse, G.J. Albumin as Fatty Acid Transporter. Drug Metab. Pharmacokinet. 2009, 24, 300–307. [Google Scholar] [CrossRef]
- Baker, M.E. Albumin’s role in steroid hormone action and the origins of vertebrates: Is albumin an essential protein? FEBS Lett. 1998, 439, 9–12. [Google Scholar] [CrossRef]
- Jacobsen, J.; Brodersen, R. Albumin-bilirubin binding mechanism. J. Biol. Chem. 1983, 258, 6319–6326. [Google Scholar] [CrossRef]
- Murakami, T.; Yarimitsu, S.; Nakashima, K.; Sawae, Y.; Sakai, N. Influence of synovia constituents on tribological behaviors of articular cartilage. Friction 2013, 1, 150–162. [Google Scholar] [CrossRef]
- Čipek, P.; Vrbka, M.; Rebenda, D.; Nečas, D.; Křupka, I. Biotribology of Synovial Cartilage: A New Method for Visualization of Lubricating Film and Simultaneous Measurement of the Friction Coefficient. Materials 2020, 13, 2075. [Google Scholar] [CrossRef]
- Gadomska, M.; Musiał, K.; Sionkowska, A. New materials based on hyaluronic acid and egg albumin mixture. Eng. Biomater. 2021, 160, 15–21. [Google Scholar] [CrossRef]
- Maurya, P.; Singh, S.; Mishra, N.; Pal, R.; Singh, N.; Parashar, P.; Saraf, S.A. Albumin-based nanomaterials in drug delivery and biomedical applications. In Biopolymer-Based Nanomaterials in Drug Delivery and Biomedical Applications; Bera, H., Hossain, C.M., Saha, S., Eds.; Academic Press: Cambridge, MA, USA, 2021; pp. 465–496. [Google Scholar] [CrossRef]
- Zewde, B.; Atoyebi, O.; Gugssa, A.; Gaskell, K.J.; Raghavan, D. An Investigation of the Interaction between Bovine Serum Albumin-Conjugated Silver Nanoparticles and the Hydrogel in Hydrogel Nanocomposites. ACS Omega 2021, 6, 11614–11627. [Google Scholar] [CrossRef]
- Krieger, E.; Vriend, G. YASARA View—molecular graphics for all devices—from smartphones to workstations. Bioinformatics 2014, 30, 2981–2982. [Google Scholar] [CrossRef]
- Trott, O.; Olson, A.J. AutoDock Vina: Improving the speed and accuracy of docking with a new scoring function, efficient optimization, and multithreading. J. Comput. Chem. 2010, 31, 455–461. [Google Scholar] [CrossRef]
- Duan, Y.; Wu, C.; Chowdhury, S.; Lee, M.C.; Xiong, G.; Zhang, W.; Yang, R.; Cieplak, P.; Luo, R.; Lee, T.; et al. A point-charge force field for molecular mechanics simulations of proteins based on condensed-phase quantum mechanical calculations. J. Comput. Chem. 2003, 24, 1999–2012. [Google Scholar] [CrossRef] [PubMed]
- Maier, J.A.; Martinez, C.; Kasavajhala, K.; Wickstrom, L.; Hauser, K.E.; Simmerling, C. ff14SB: Improving the Accuracy of Protein Side Chain and Backbone Parameters from ff99SB. J. Chem. Theory Comput. 2015, 11, 3696–3713. [Google Scholar] [CrossRef] [PubMed]
- Krieger, E.; Dunbrack, R.L.; Hooft, R.W.; Krieger, B. Assignment of protonation states in proteins and ligands: Combining PKA prediction with hydrogen bonding network optimization. In Methods in Molecular Biology; Springer: New York, NY, USA, 2012; pp. 405–421. [Google Scholar] [CrossRef]
- Krieger, E.; Vriend, G. New ways to boost molecular dynamics simulations. J. Comput. Chem. 2015, 36, 996–1007. [Google Scholar] [CrossRef] [PubMed]
- Wang, Q.; Canutescu, A.A.; Roland, L. Dunbrack, J. SCWRL and MolIDE: Computer programs for side-chain conformation prediction and homology modeling. Nat. Protoc. 2008, 3, 1832. [Google Scholar] [CrossRef]
- Kirschner, K.N.; Yongye, A.B.; Tschampel, S.M.; González-Outeiriño, J.; Daniels, C.R.; Foley, B.L.; Woods, R.J. GLYCAM06: A generalizable biomolecular force field. Carbohydrates. J. Comput. Chem. 2008, 29, 622–655. [Google Scholar] [CrossRef]
- Hornak, V.; Abel, R.; Okur, A.; Strockbine, B.; Roitberg, A.E.; Simmerling, C. Comparison of multiple Amber force fields and development of improved protein backbone parameters. Proteins Struct. 2006, 65, 712–725. [Google Scholar] [CrossRef]
- Essmann, U.; Perera, L.E.; Berkowitz, M.L.; Darden, T.A.; Lee, H.C.; Pedersen, L.G. A smooth particle mesh Ewald method. J. Chem. Phys. 1995, 103, 8577–8593. [Google Scholar] [CrossRef]
- Berendsen, H.J.C.; Postma, J.P.M.; van Gunsteren, W.F.; Dinola, A.; Haak, J.R. Molecular dynamics with coupling to an external bath. J. Chem. Phys. 1984, 81, 3684–3690. [Google Scholar] [CrossRef]
- Radibratovic, M.; Minic, S.; Stanic-Vucinic, D.; Nikolic, M.; Milcic, M.; Cirkovic Velickovic, T. Stabilization of Human Serum Albumin by the Binding of Phycocyanobilin, a Bioactive Chromophore of Blue-Green Alga Spirulina: Molecular Dynamics and Experimental Study. PLoS ONE 2016, 11, e0167973. [Google Scholar] [CrossRef] [PubMed]
- Shi, D.; Sheng, A.; Chi, L. Glycosaminoglycan-protein interactions and their roles in human disease. Front. Mol. Biosci. 2021, 8, 639666. [Google Scholar] [CrossRef] [PubMed]
- Qiu, H.; Jin, L.; Chen, J.; Shi, M.; Shi, F.; Wang, M.; Li, D.; Xu, X.S.; Su, X.; Yin, X.; et al. Comprehensive Glycomic Analysis Reveals That Human Serum Albumin Glycation Specifically Affects the Pharmacokinetics and Efficacy of Different Anticoagulant Drugs in Diabetes. Diabetes 2020, 69, 760–770. [Google Scholar] [CrossRef]
- Brown, K.L.; Banerjee, S.; Feigley, A.; Abe, H.; Blackwell, T.S.; Pozzi, A.; Hudson, B.G.; Zent, R. Salt-bridge modulates differential calcium-mediated ligand binding to integrin alpha1- and alpha2-I domains. Sci. Rep. 2018, 8, 1–14. [Google Scholar] [CrossRef]
- Matsarskaia, O.; Roosen-Runge, F.; Schreiber, F. Multivalent ions and biomolecules: Attempting a comprehensive perspective. ChemPhysChem 2020, 21, 1742–1767. [Google Scholar] [CrossRef] [PubMed]
- Siódmiak, J.; Bełdowski, P.; Augé, W.; Ledziński, D.; Śmigiel, S.; Gadomski, A. Molecular dynamic analysis of hyaluronic acid and phospholipid interaction in tribological surgical adjuvant design for osteoarthritis. Molecules 2017, 22, 1436. [Google Scholar] [CrossRef] [PubMed]
- van Os, G.A.; Koopman-van Eupen, J.H. The interaction of sodium, potassium, calcium, and magnesium with human serum albumin, studied by means of conductivity measurements. Recueil Travaux Chimiques Pays-Bas 2010, 76, 390–400. [Google Scholar] [CrossRef]
- Yan, L.Y.; Li, W.; Mesgari, S.; Leong, S.S.; Chen, Y.; Loo, L.S.; Mu, Y.; Chan-Park, M.B. Use of a chondroitin sulfate isomer as an effective and removable dispersant of single-walled carbon nanotubes. Small 2011, 7, 2758–2768. [Google Scholar] [CrossRef]


| HSA-CS6 Rank | EoB (kJ/mol) | HSA Binding Sites |
|---|---|---|
| 1(2) | −2522 ± 339 | IA-IB-IIA-IIIA-IIIB |
| 2(6) | −2133± 301 | IB-IIIA-IIIB |
| 3(9) | −1694± 665 | IB-IIIA-IIIB |
| 4(7) | −1670± 388 | IA-IIA-IIB-IIIA |
| 5(1) | −1628± 792 | IA-IIA-IIIA-IIIB |
| 6(5) | −1542± 665 | IA-IIA-IIIA-IIIB |
| 7(4) | −1498± 399 | IA-IIA-IIIA-IIIB |
| 8(3) | −1472± 675 | IA-IIA |
| 9(10) | −1363± 550 | IIA-IIB |
| 10(8) | −1033± 453 | IA-IB |
| HSA-CS4 Rank | EoB (kJ/mol) | HSA Binding Sites |
| 1(3) | −2755 ± 624 | IB-IIIA-IIIB |
| 2(9) | −2737 ± 386 | IB-IIA-IIIA-IIIB |
| 3(8) | −2194 ± 702 | IA-IB-IIA |
| 4(10) | −1906 ± 556 | IA-IB-IIA-IIIA |
| 5(4) | −1904 ± 441 | IA-IB-IIA-IIB |
| 6(5) | −1641 ± 659 | IB-IIA-IIB-IIIA-IIIB |
| 7(7) | −1639 ± 374 | IA-IB-IIA-IIIA-IIIB |
| 8(2) | −1637 ± 674 | IA-IB-IIIA-IIIB |
| 9(1) | −1613 ± 531 | IB-IIA-IIIA-IIIB |
| 10(6) | −1516 ± 493 | IB-IIIA-IIIB |
Publisher’s Note: MDPI stays neutral with regard to jurisdictional claims in published maps and institutional affiliations. |
© 2022 by the authors. Licensee MDPI, Basel, Switzerland. This article is an open access article distributed under the terms and conditions of the Creative Commons Attribution (CC BY) license (https://creativecommons.org/licenses/by/4.0/).
Share and Cite
Kruszewska, N.; Mazurkiewicz, A.; Szala, G.; Słomion, M. Characterization of Synovial Fluid Components: Albumin-Chondroitin Sulfate Interactions Seen through Molecular Dynamics. Materials 2022, 15, 6935. https://doi.org/10.3390/ma15196935
Kruszewska N, Mazurkiewicz A, Szala G, Słomion M. Characterization of Synovial Fluid Components: Albumin-Chondroitin Sulfate Interactions Seen through Molecular Dynamics. Materials. 2022; 15(19):6935. https://doi.org/10.3390/ma15196935
Chicago/Turabian StyleKruszewska, Natalia, Adam Mazurkiewicz, Grzegorz Szala, and Małgorzata Słomion. 2022. "Characterization of Synovial Fluid Components: Albumin-Chondroitin Sulfate Interactions Seen through Molecular Dynamics" Materials 15, no. 19: 6935. https://doi.org/10.3390/ma15196935
APA StyleKruszewska, N., Mazurkiewicz, A., Szala, G., & Słomion, M. (2022). Characterization of Synovial Fluid Components: Albumin-Chondroitin Sulfate Interactions Seen through Molecular Dynamics. Materials, 15(19), 6935. https://doi.org/10.3390/ma15196935