


Long-Term Performance Evolution of RIOHTrack Pavement Surface Layer Based on DMA Method


Abstract
:1. Introduction
2. Materials and Tests
2.1. Materials
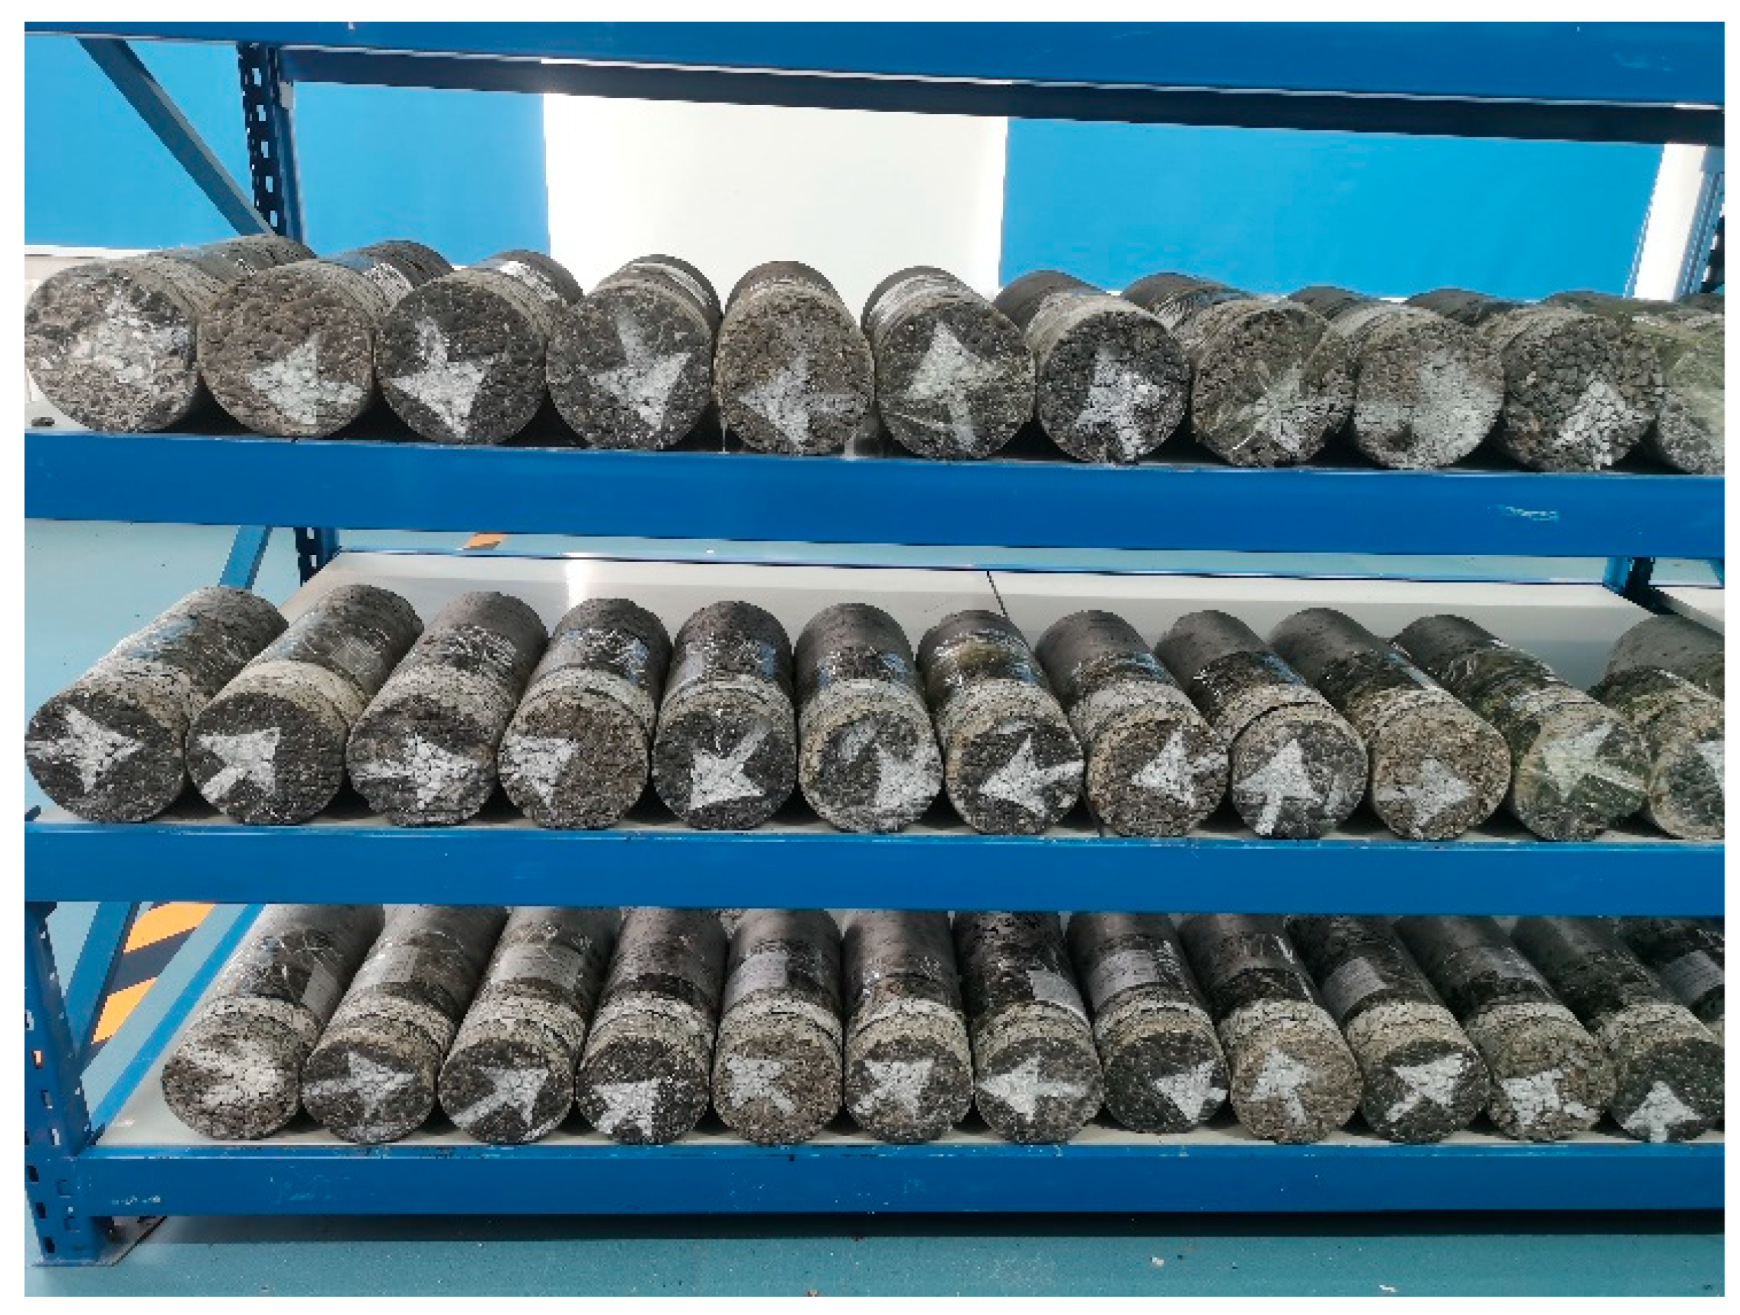
2.1.1. Road Coring
2.1.2. Material Parameters
2.2. Test
2.2.1. Specimen Preparation
2.2.2. Test Principle
2.2.3. Experimental Equipment and Methods
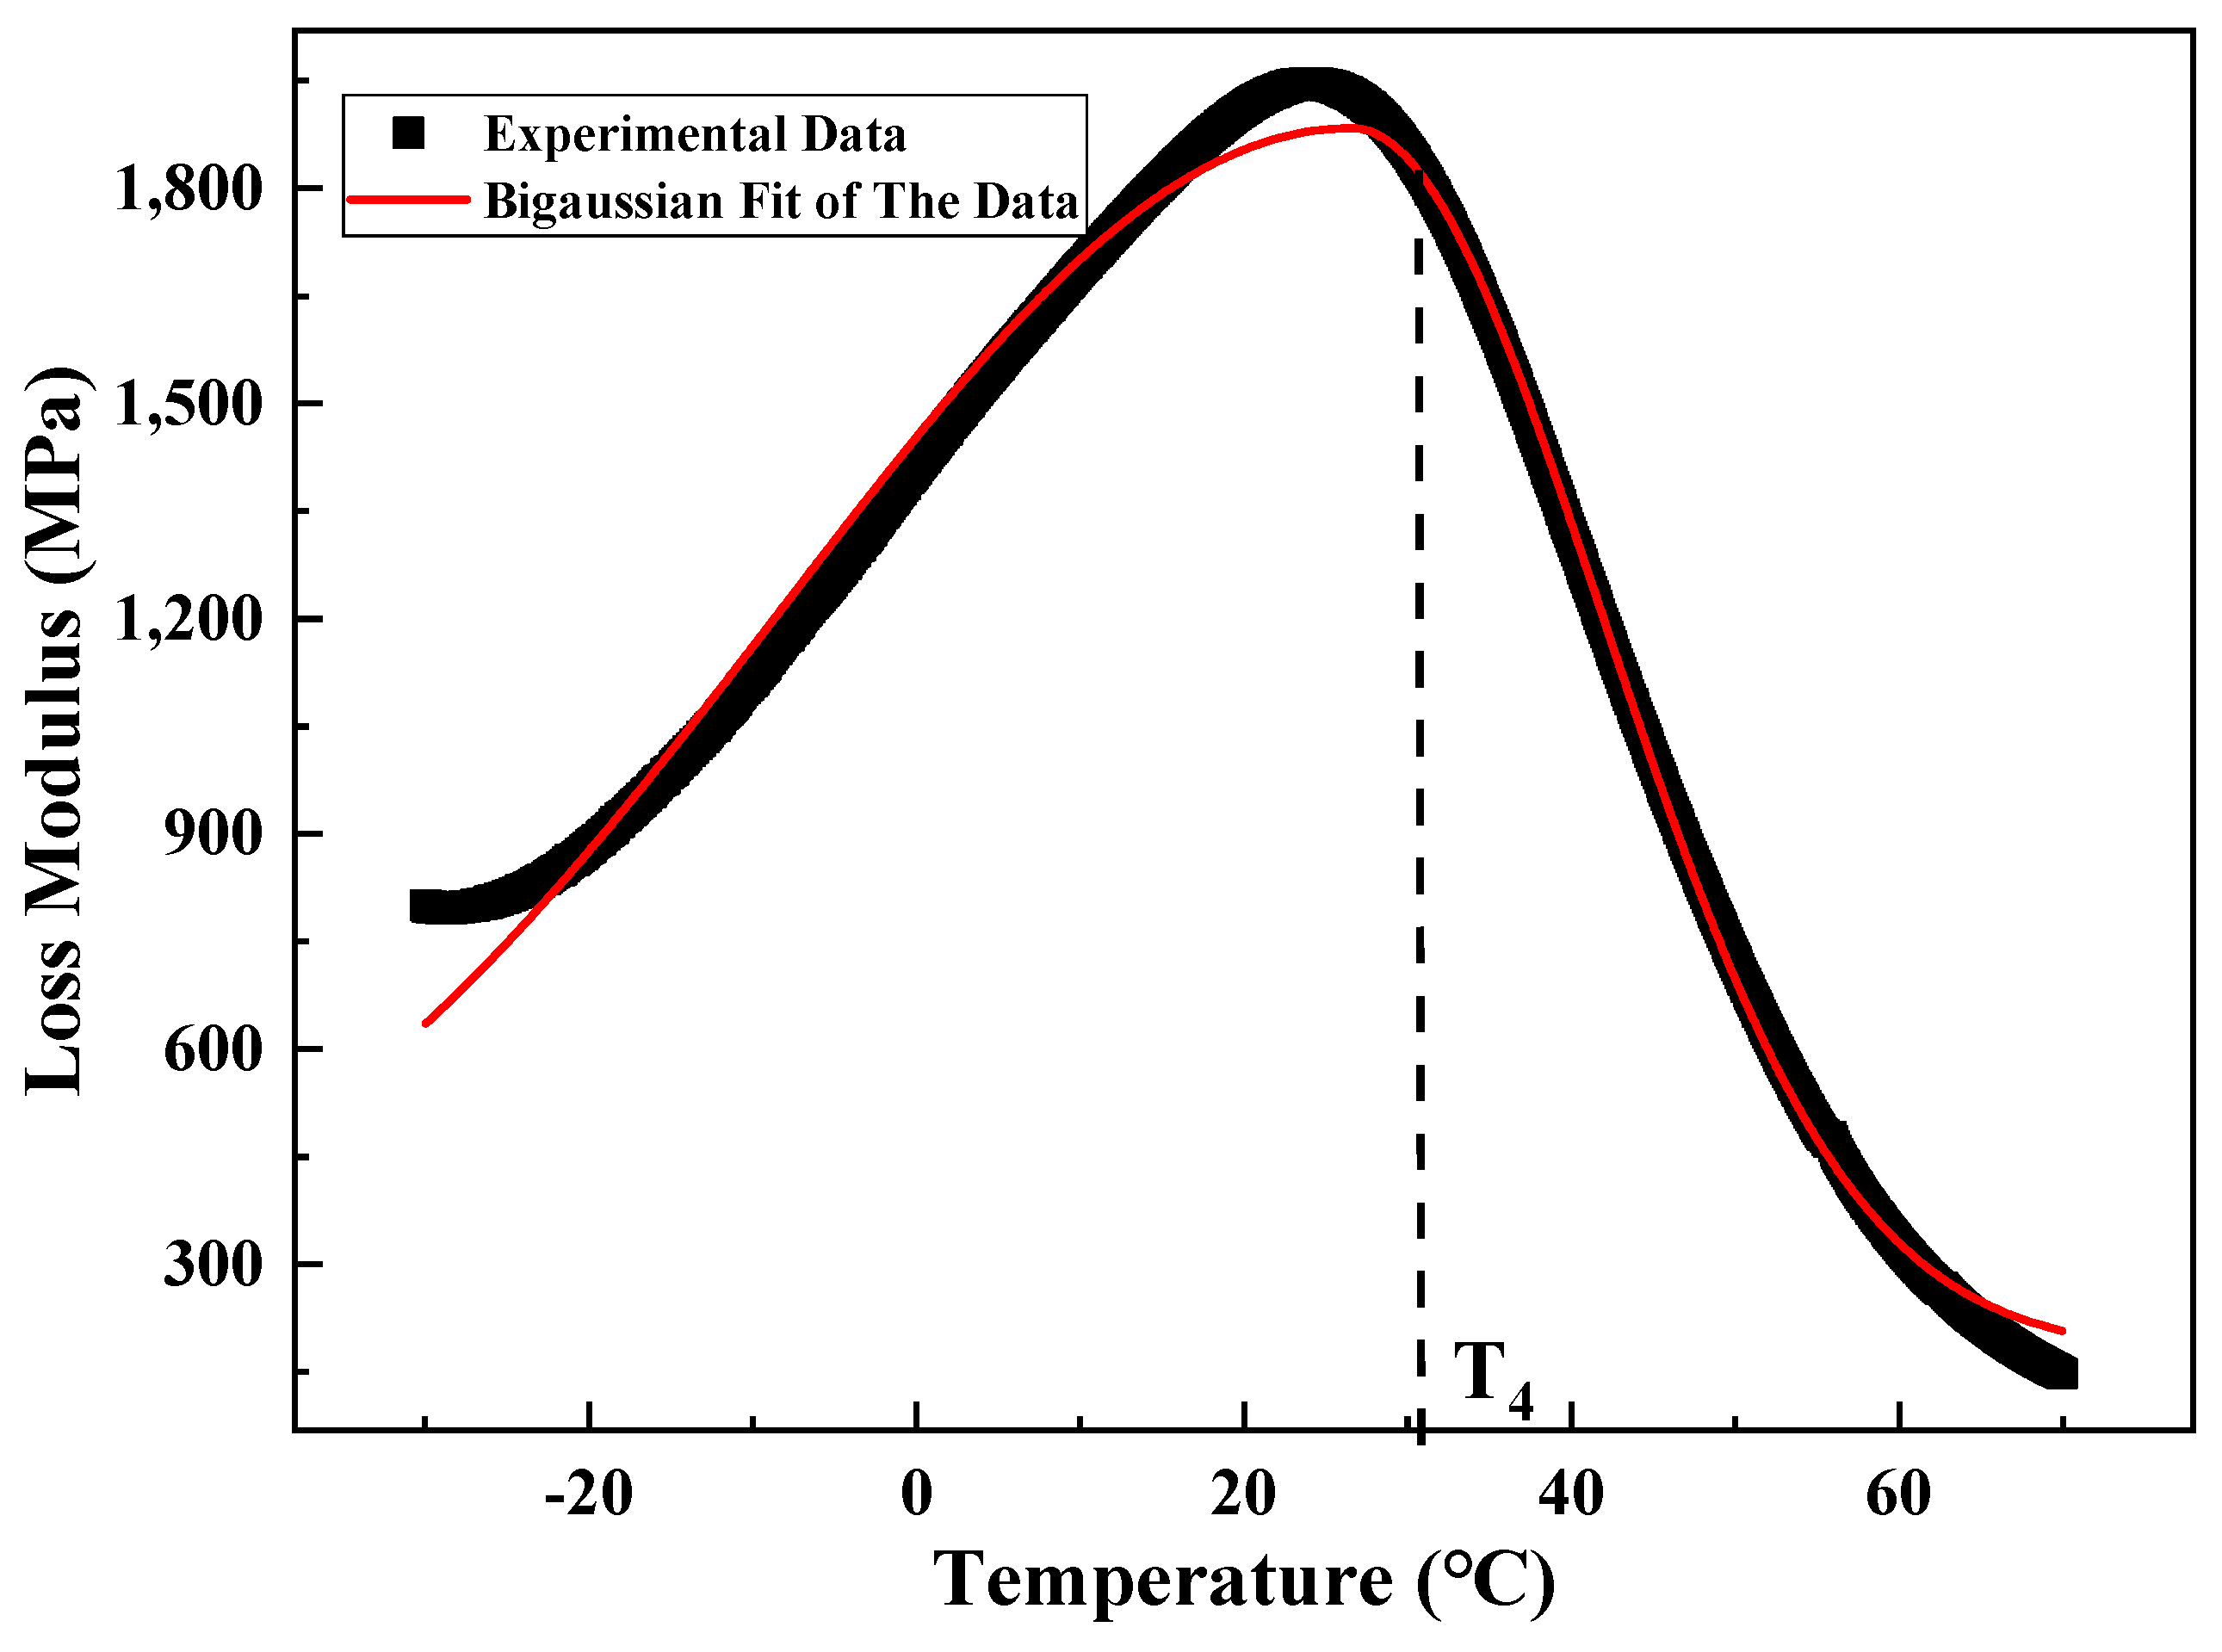
2.2.4. Analysis Method
3. Results and Discussion
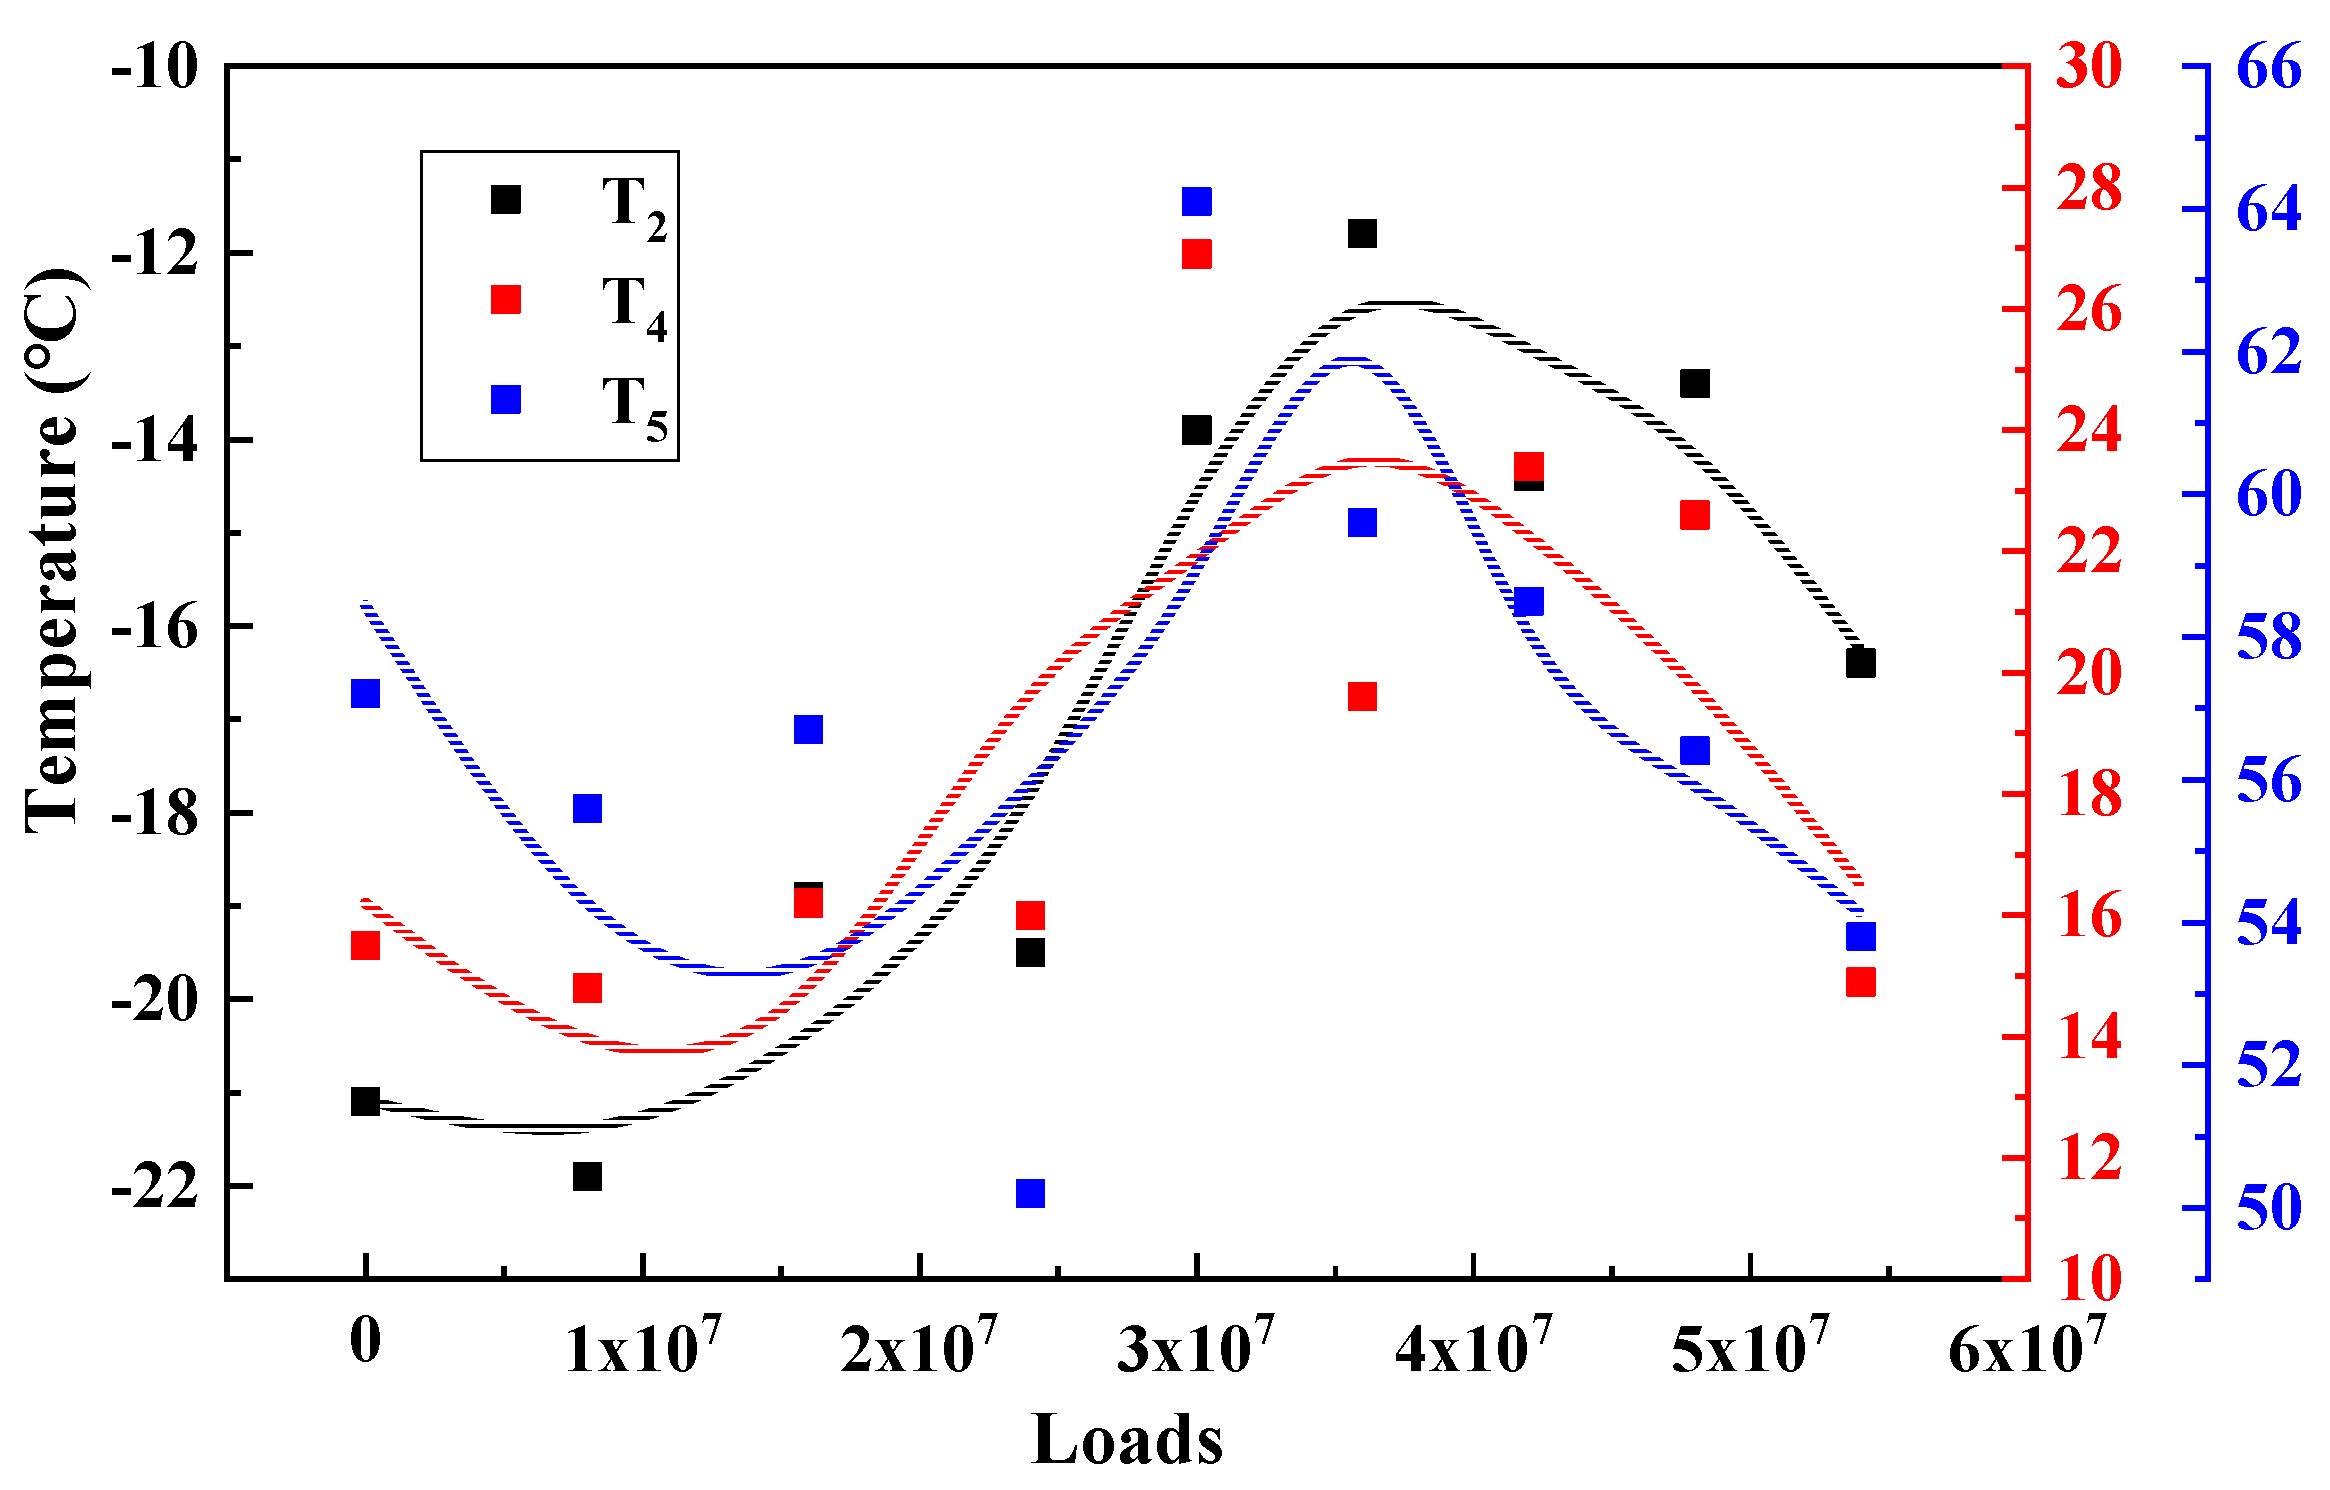
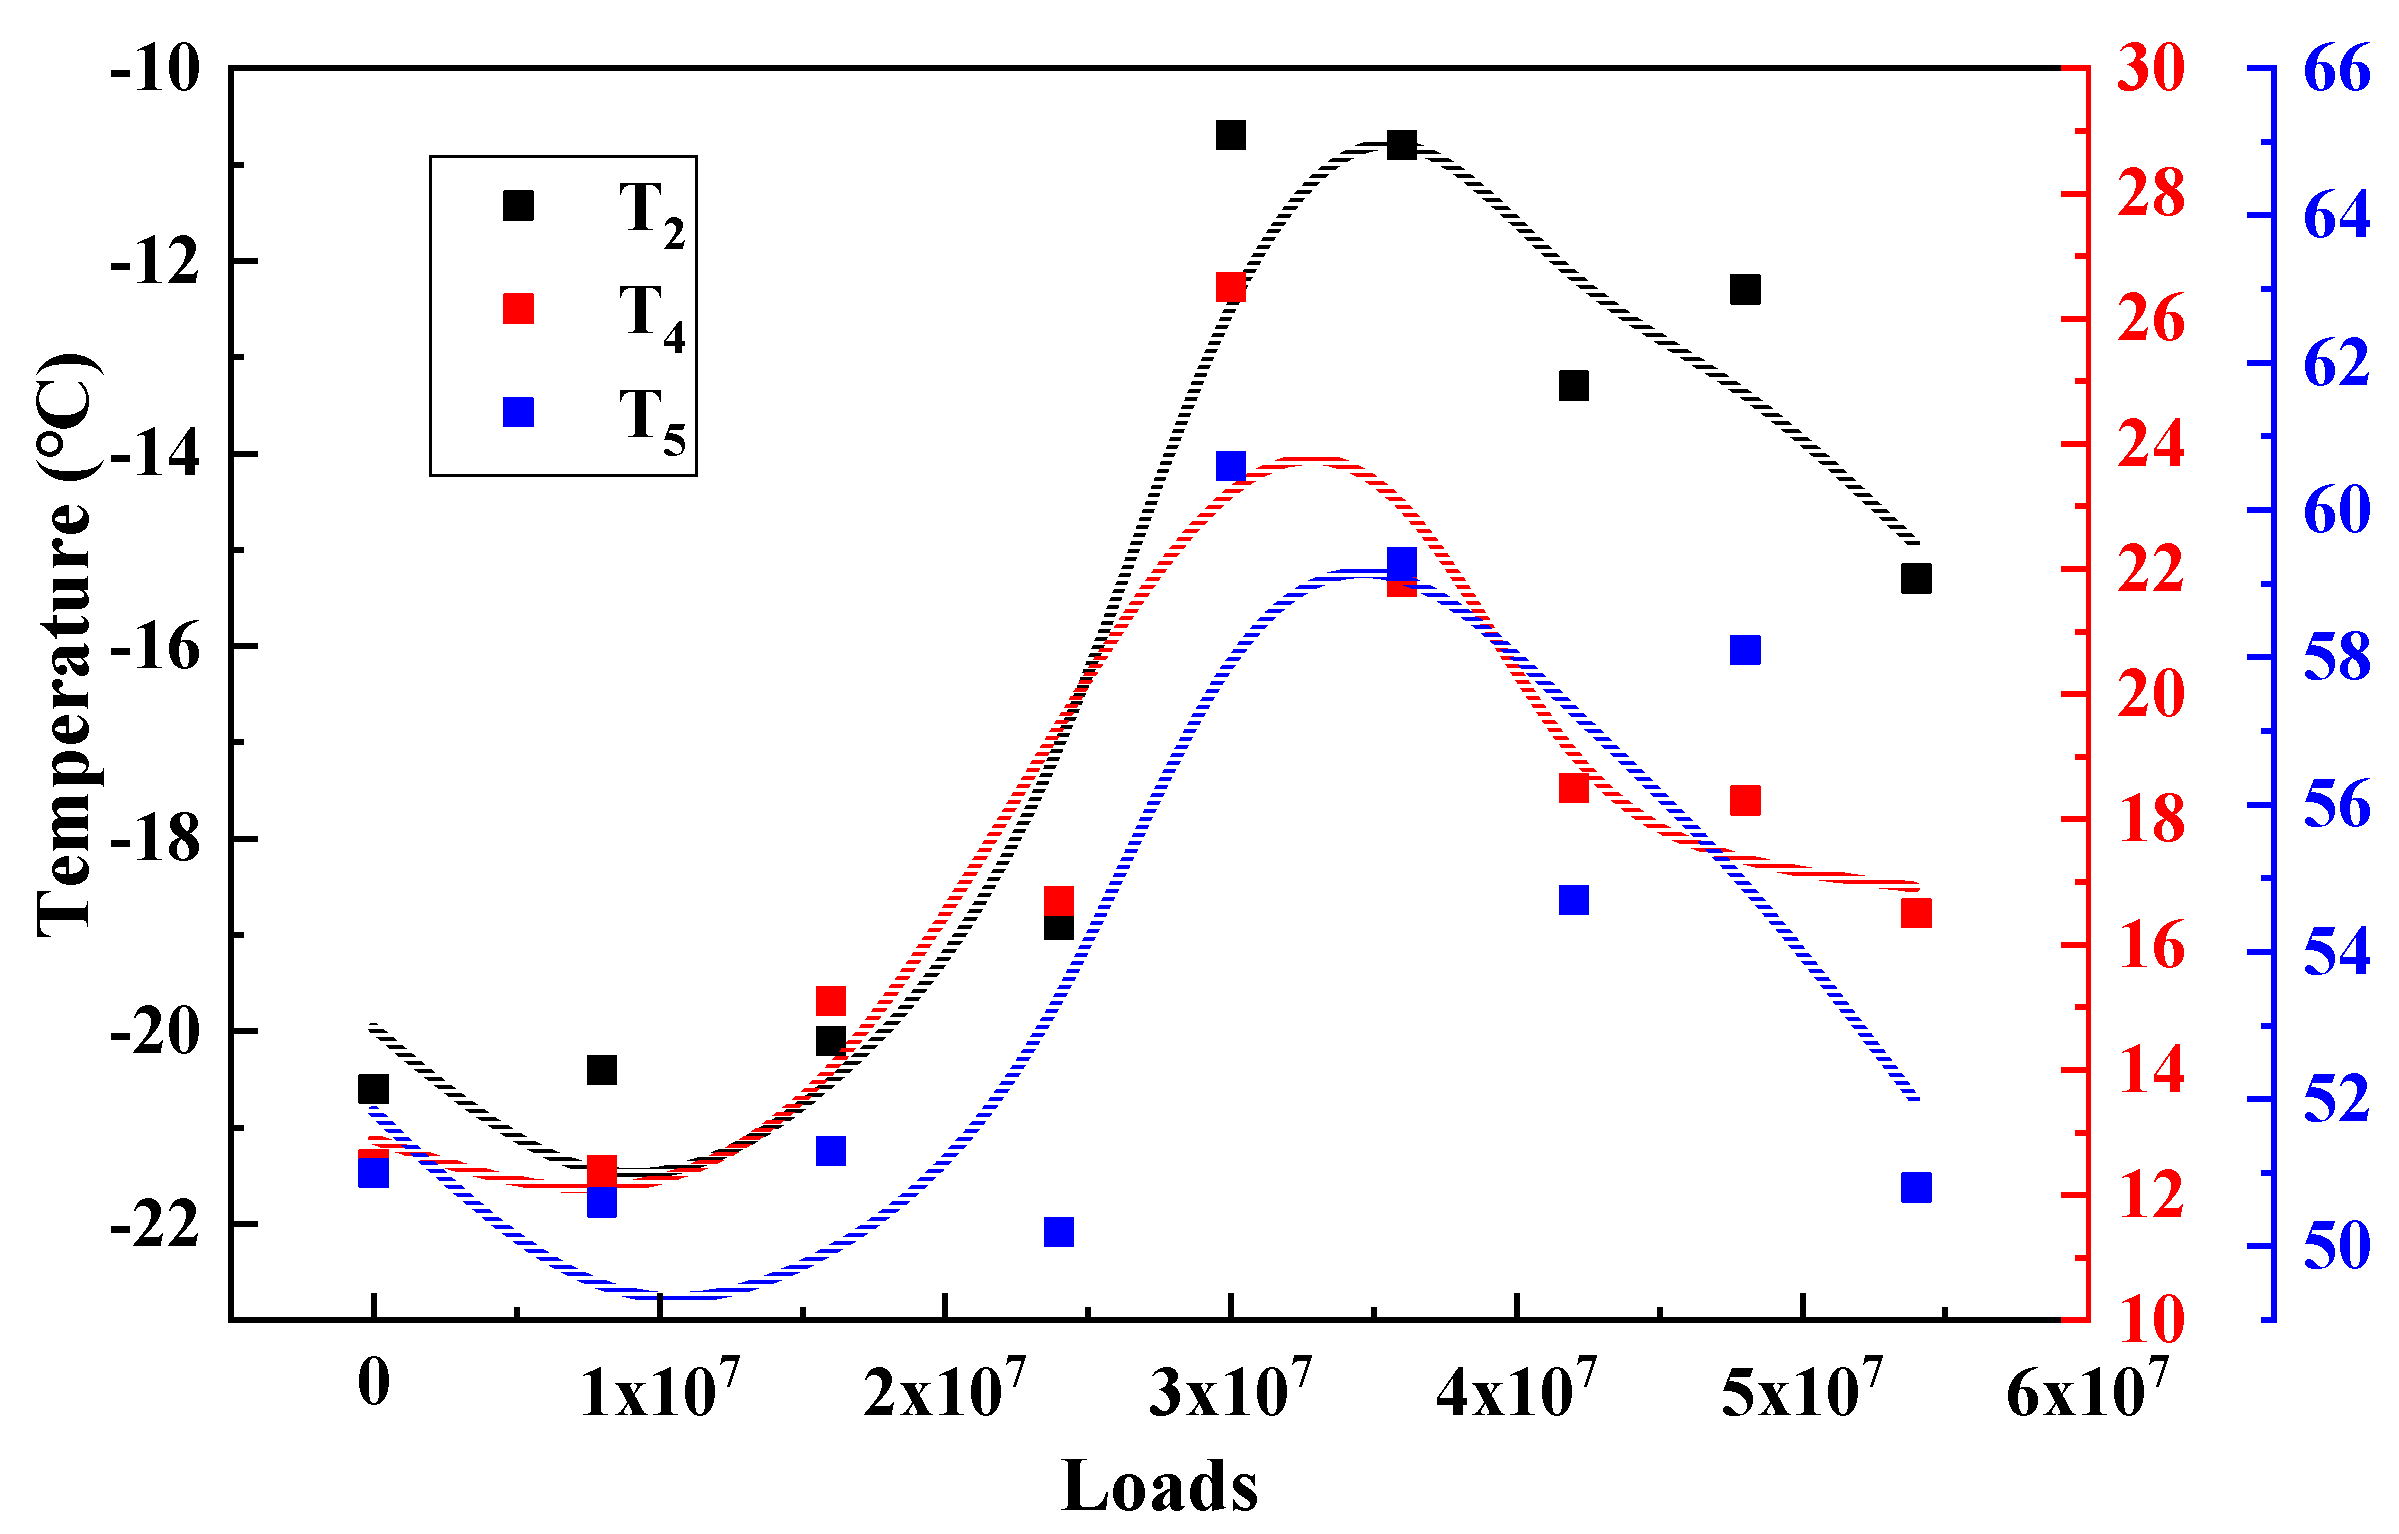
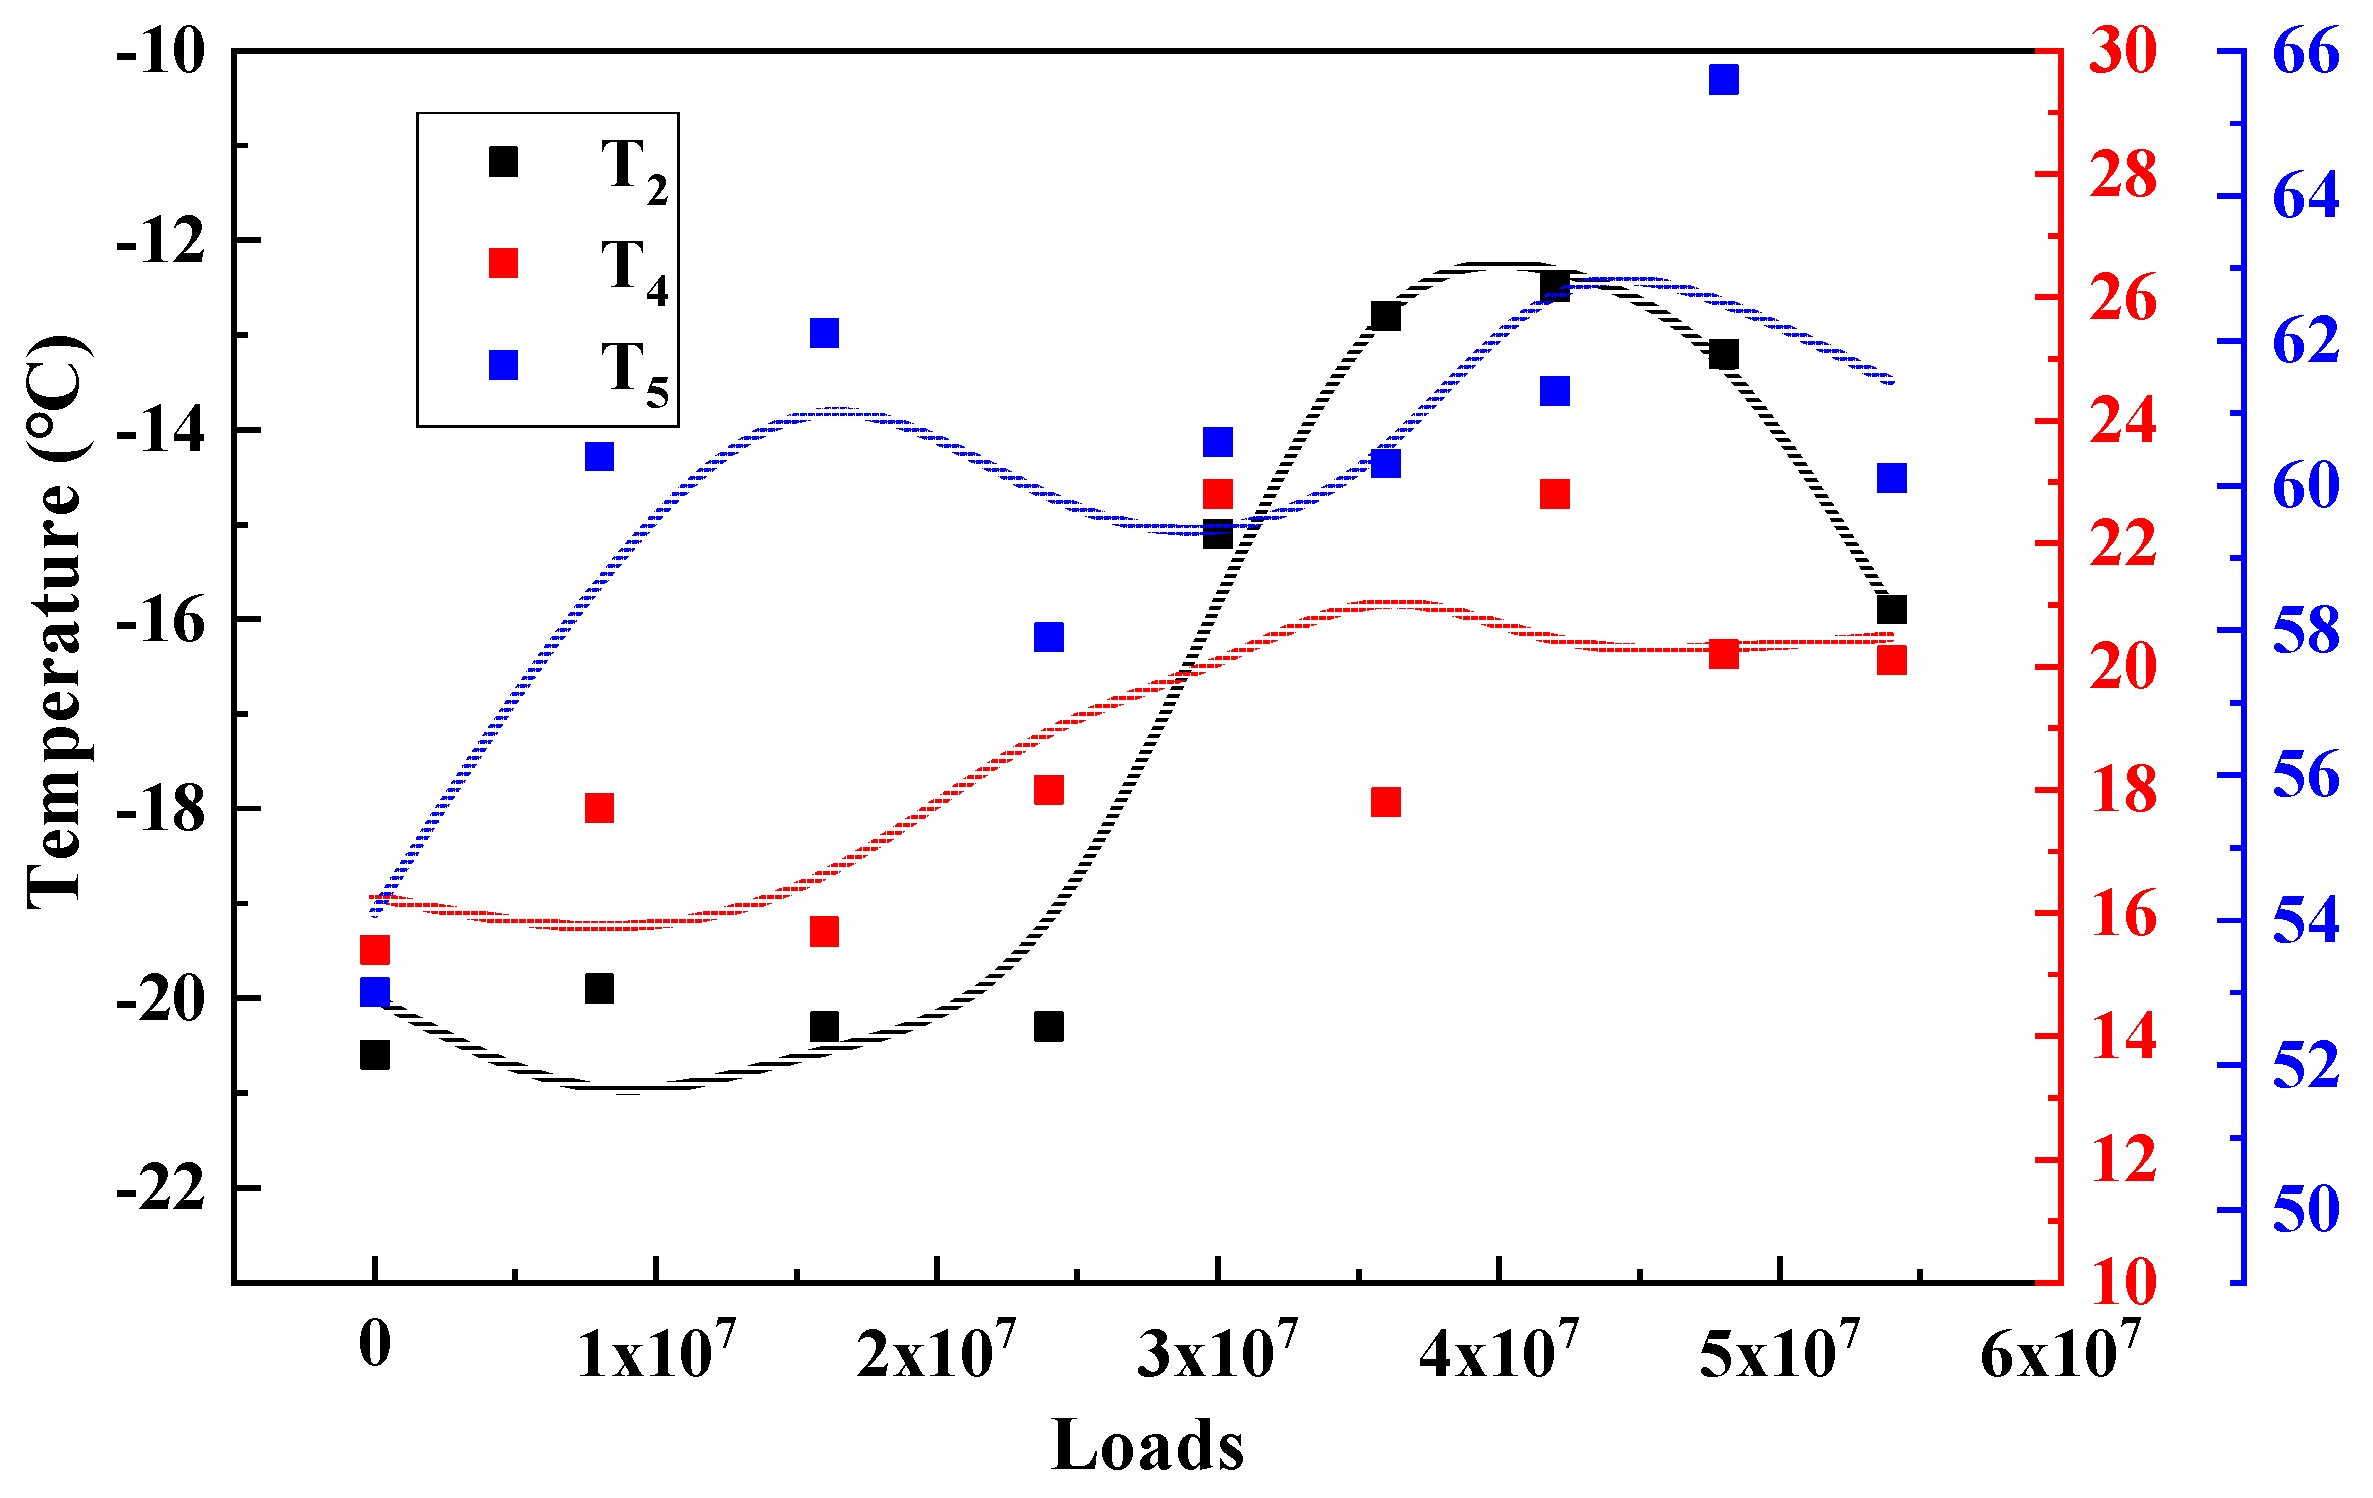
3.1. Effect of Load-Environment Coupling on the Phase Characteristic Temperature of Asphalt Mixtures
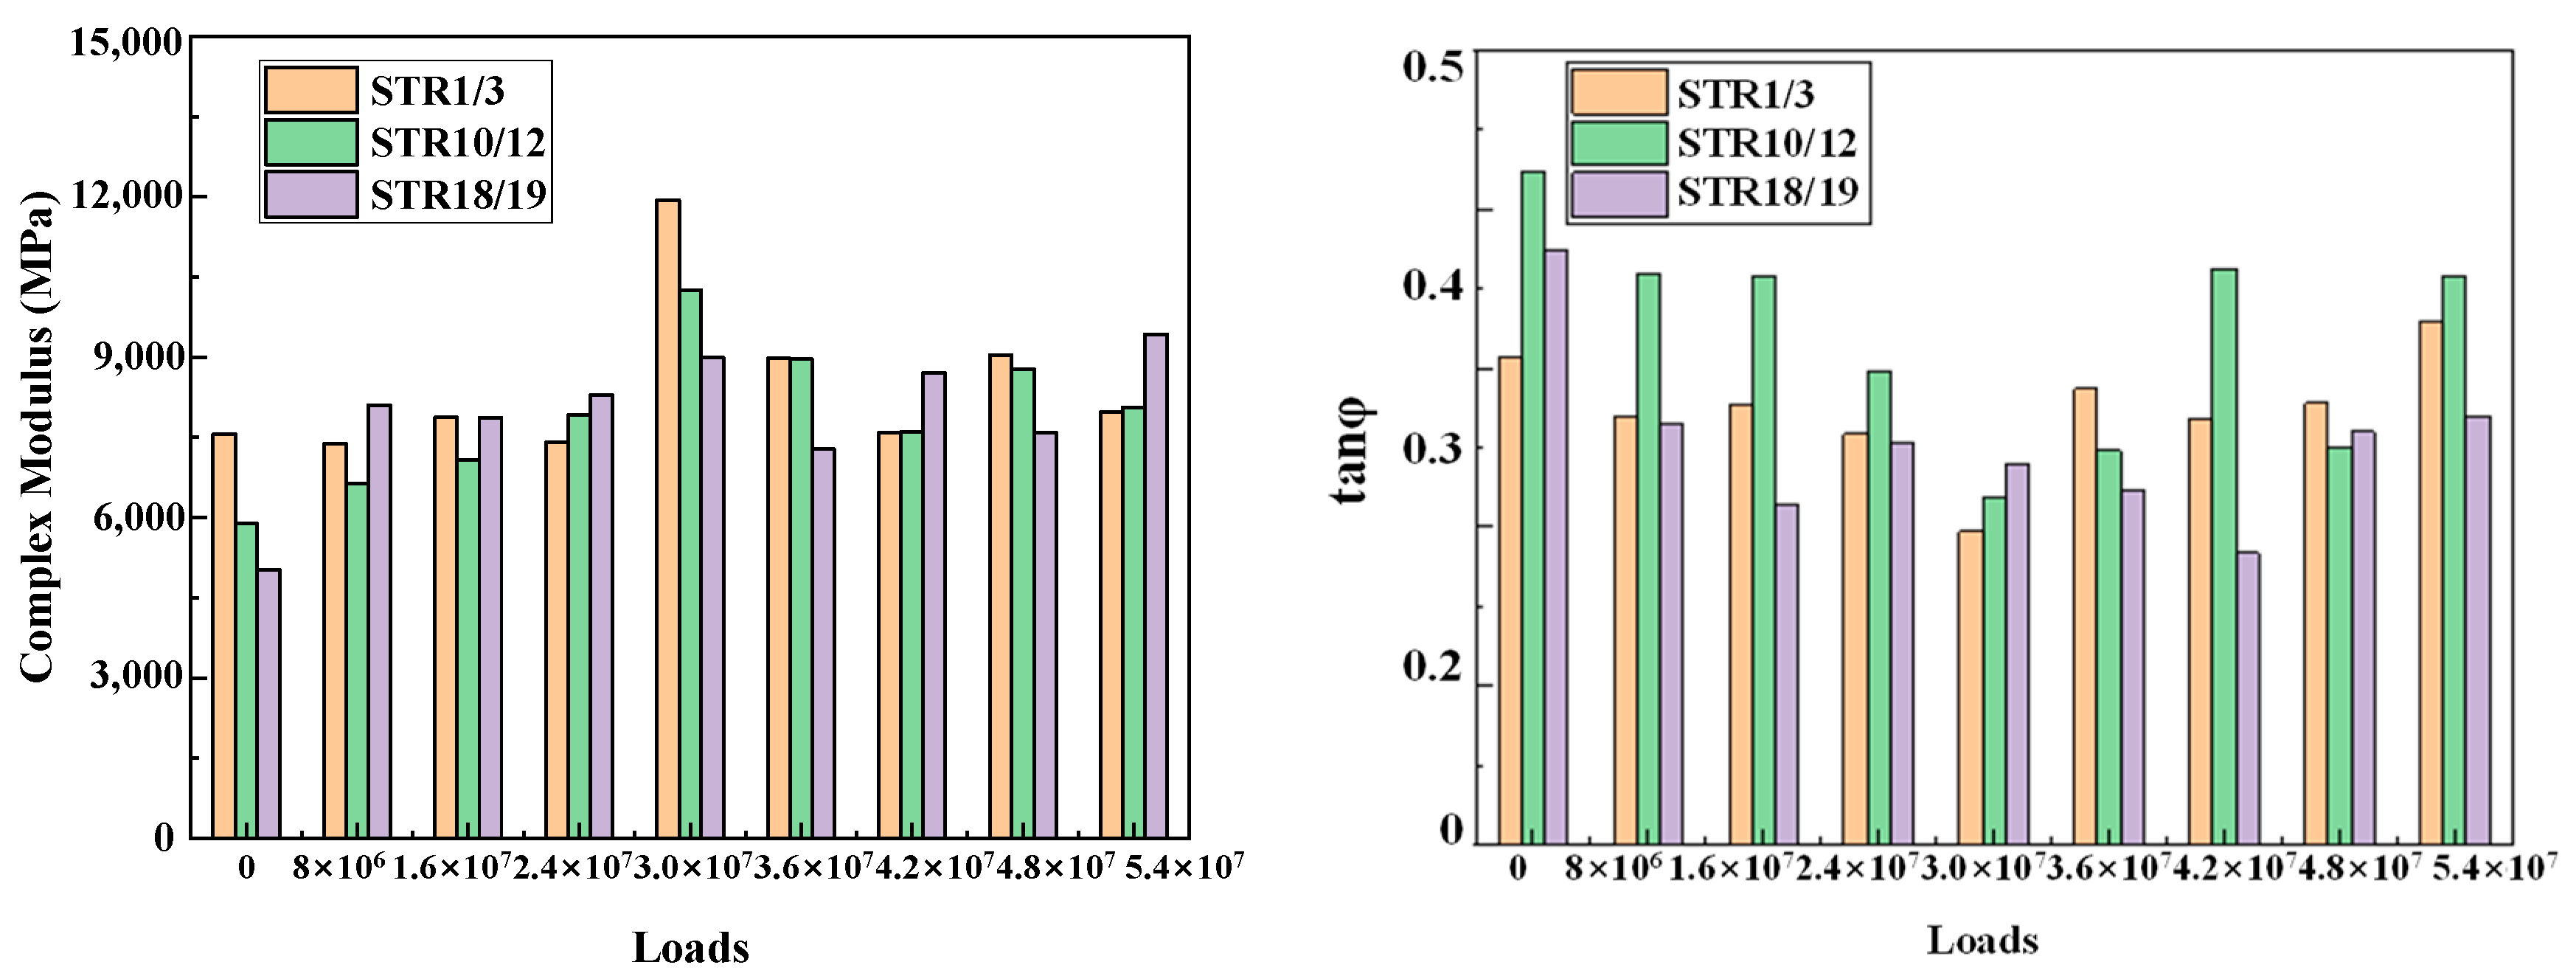
3.2. Long-Term Evolution of Modulus and Phase Angle of Asphalt Mixtures
3.3. Material Variability of Characteristic Temperatures
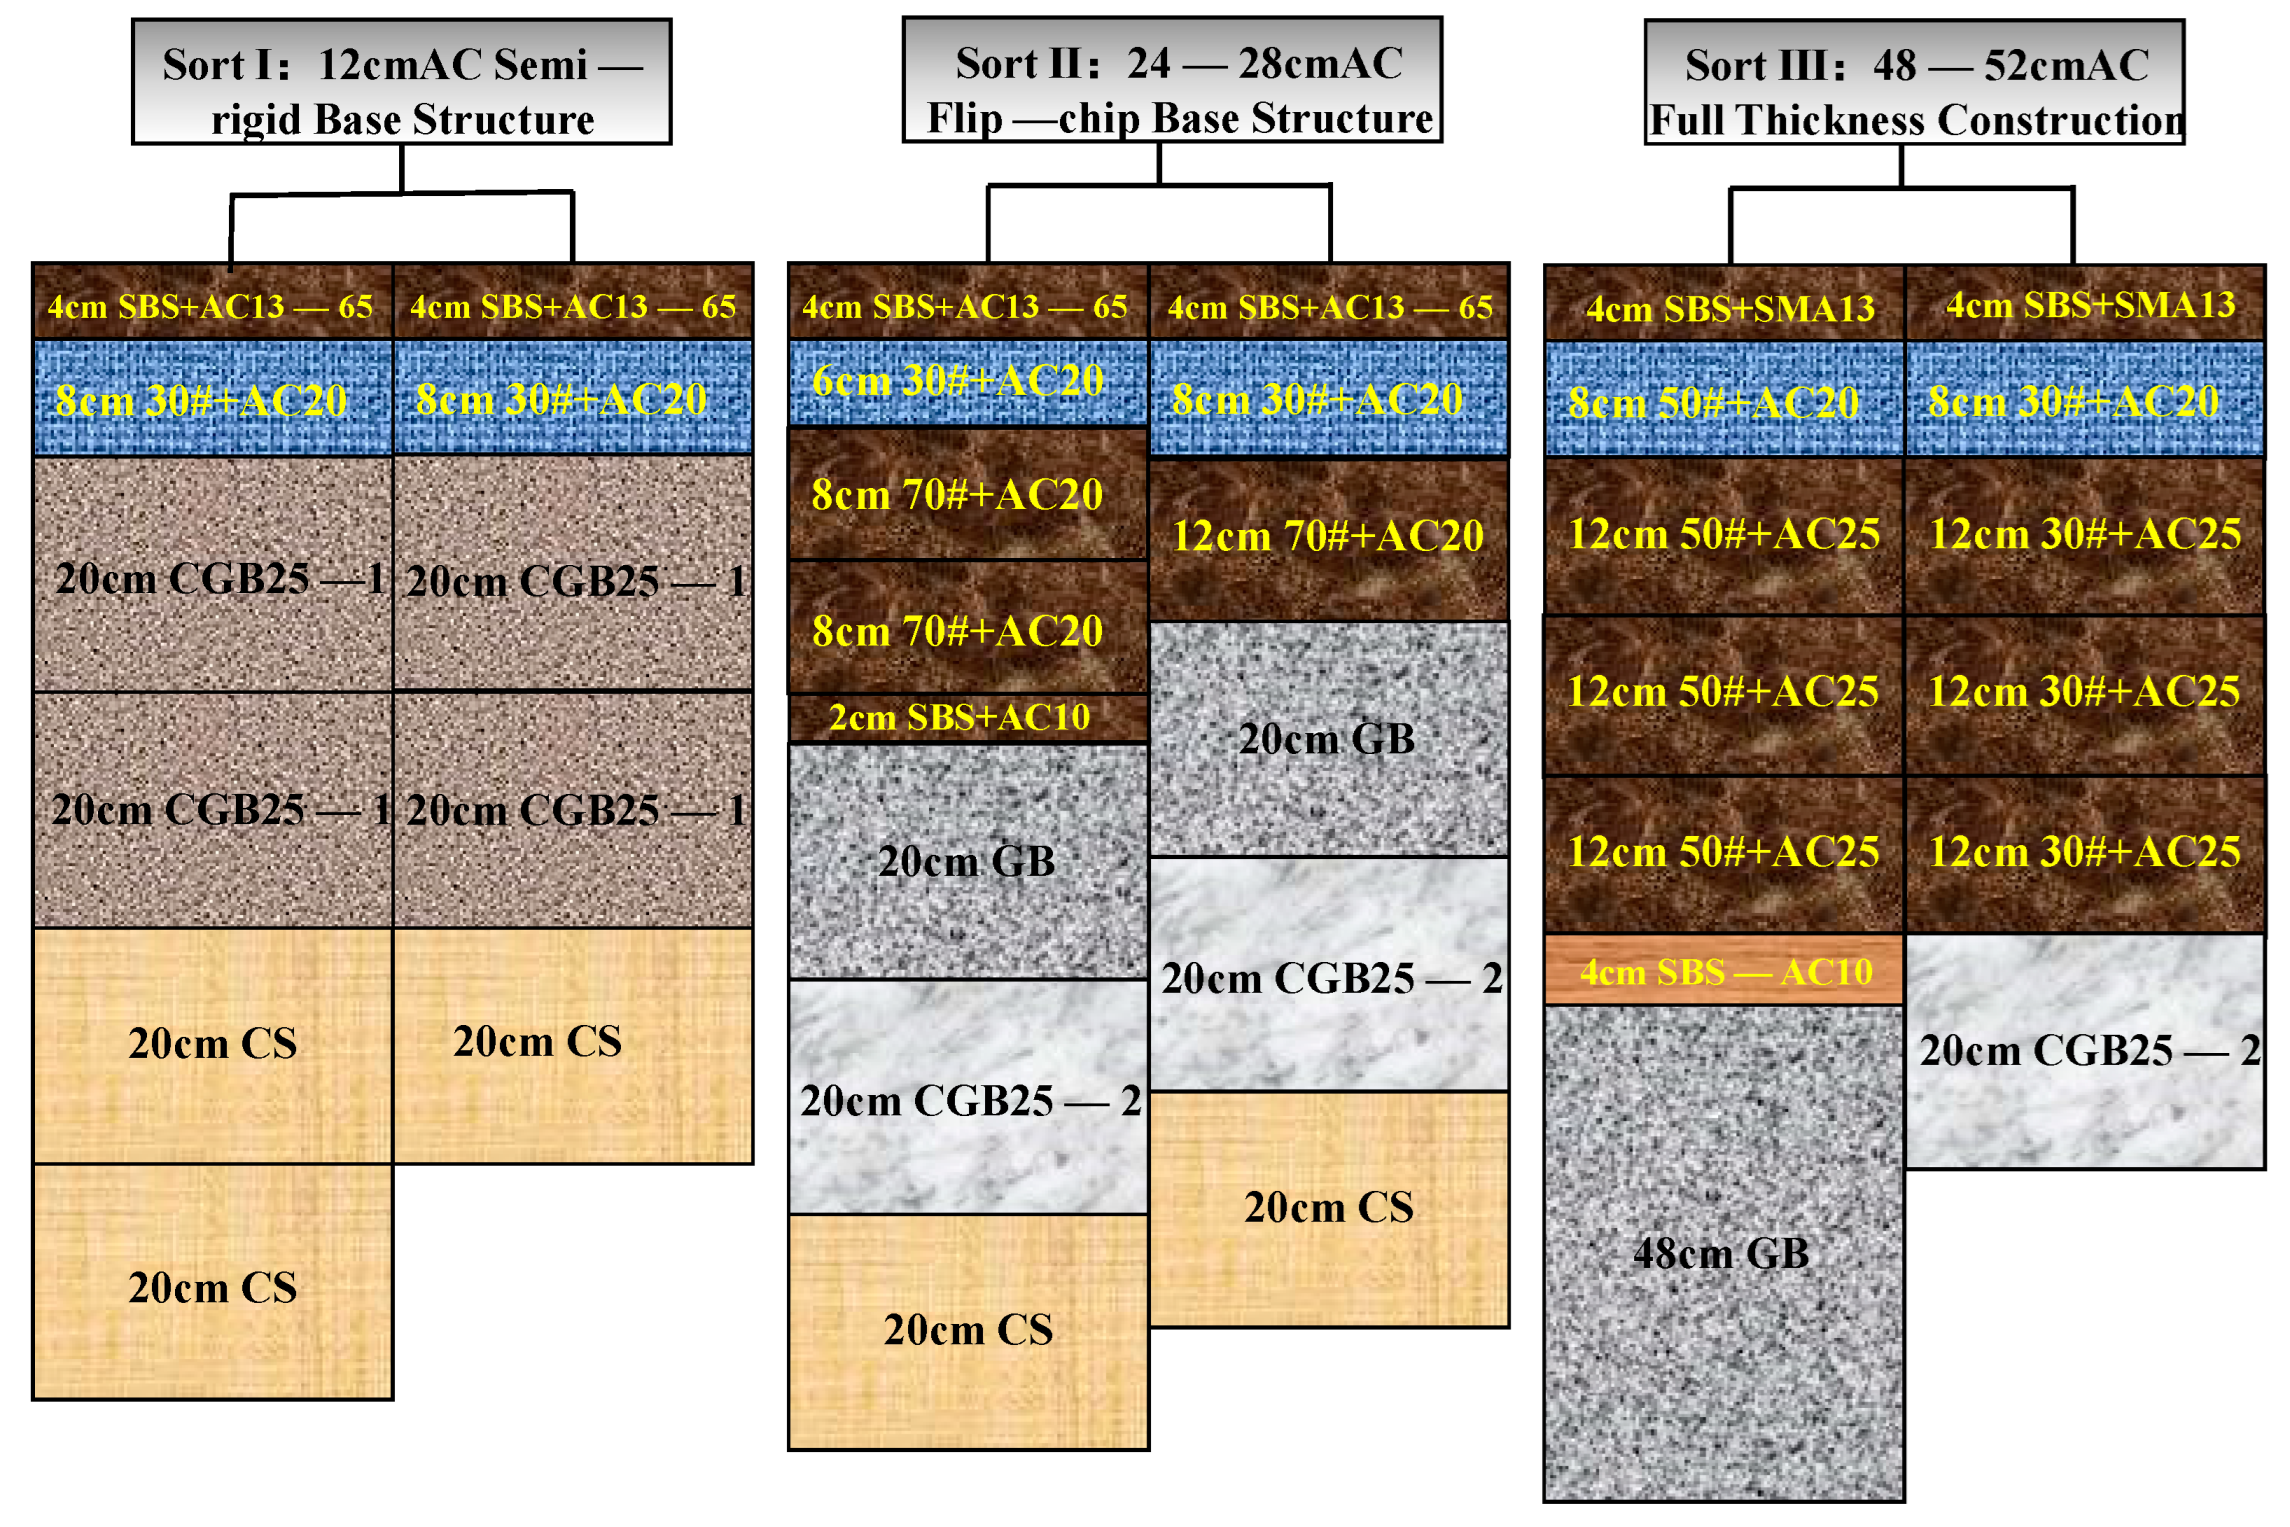
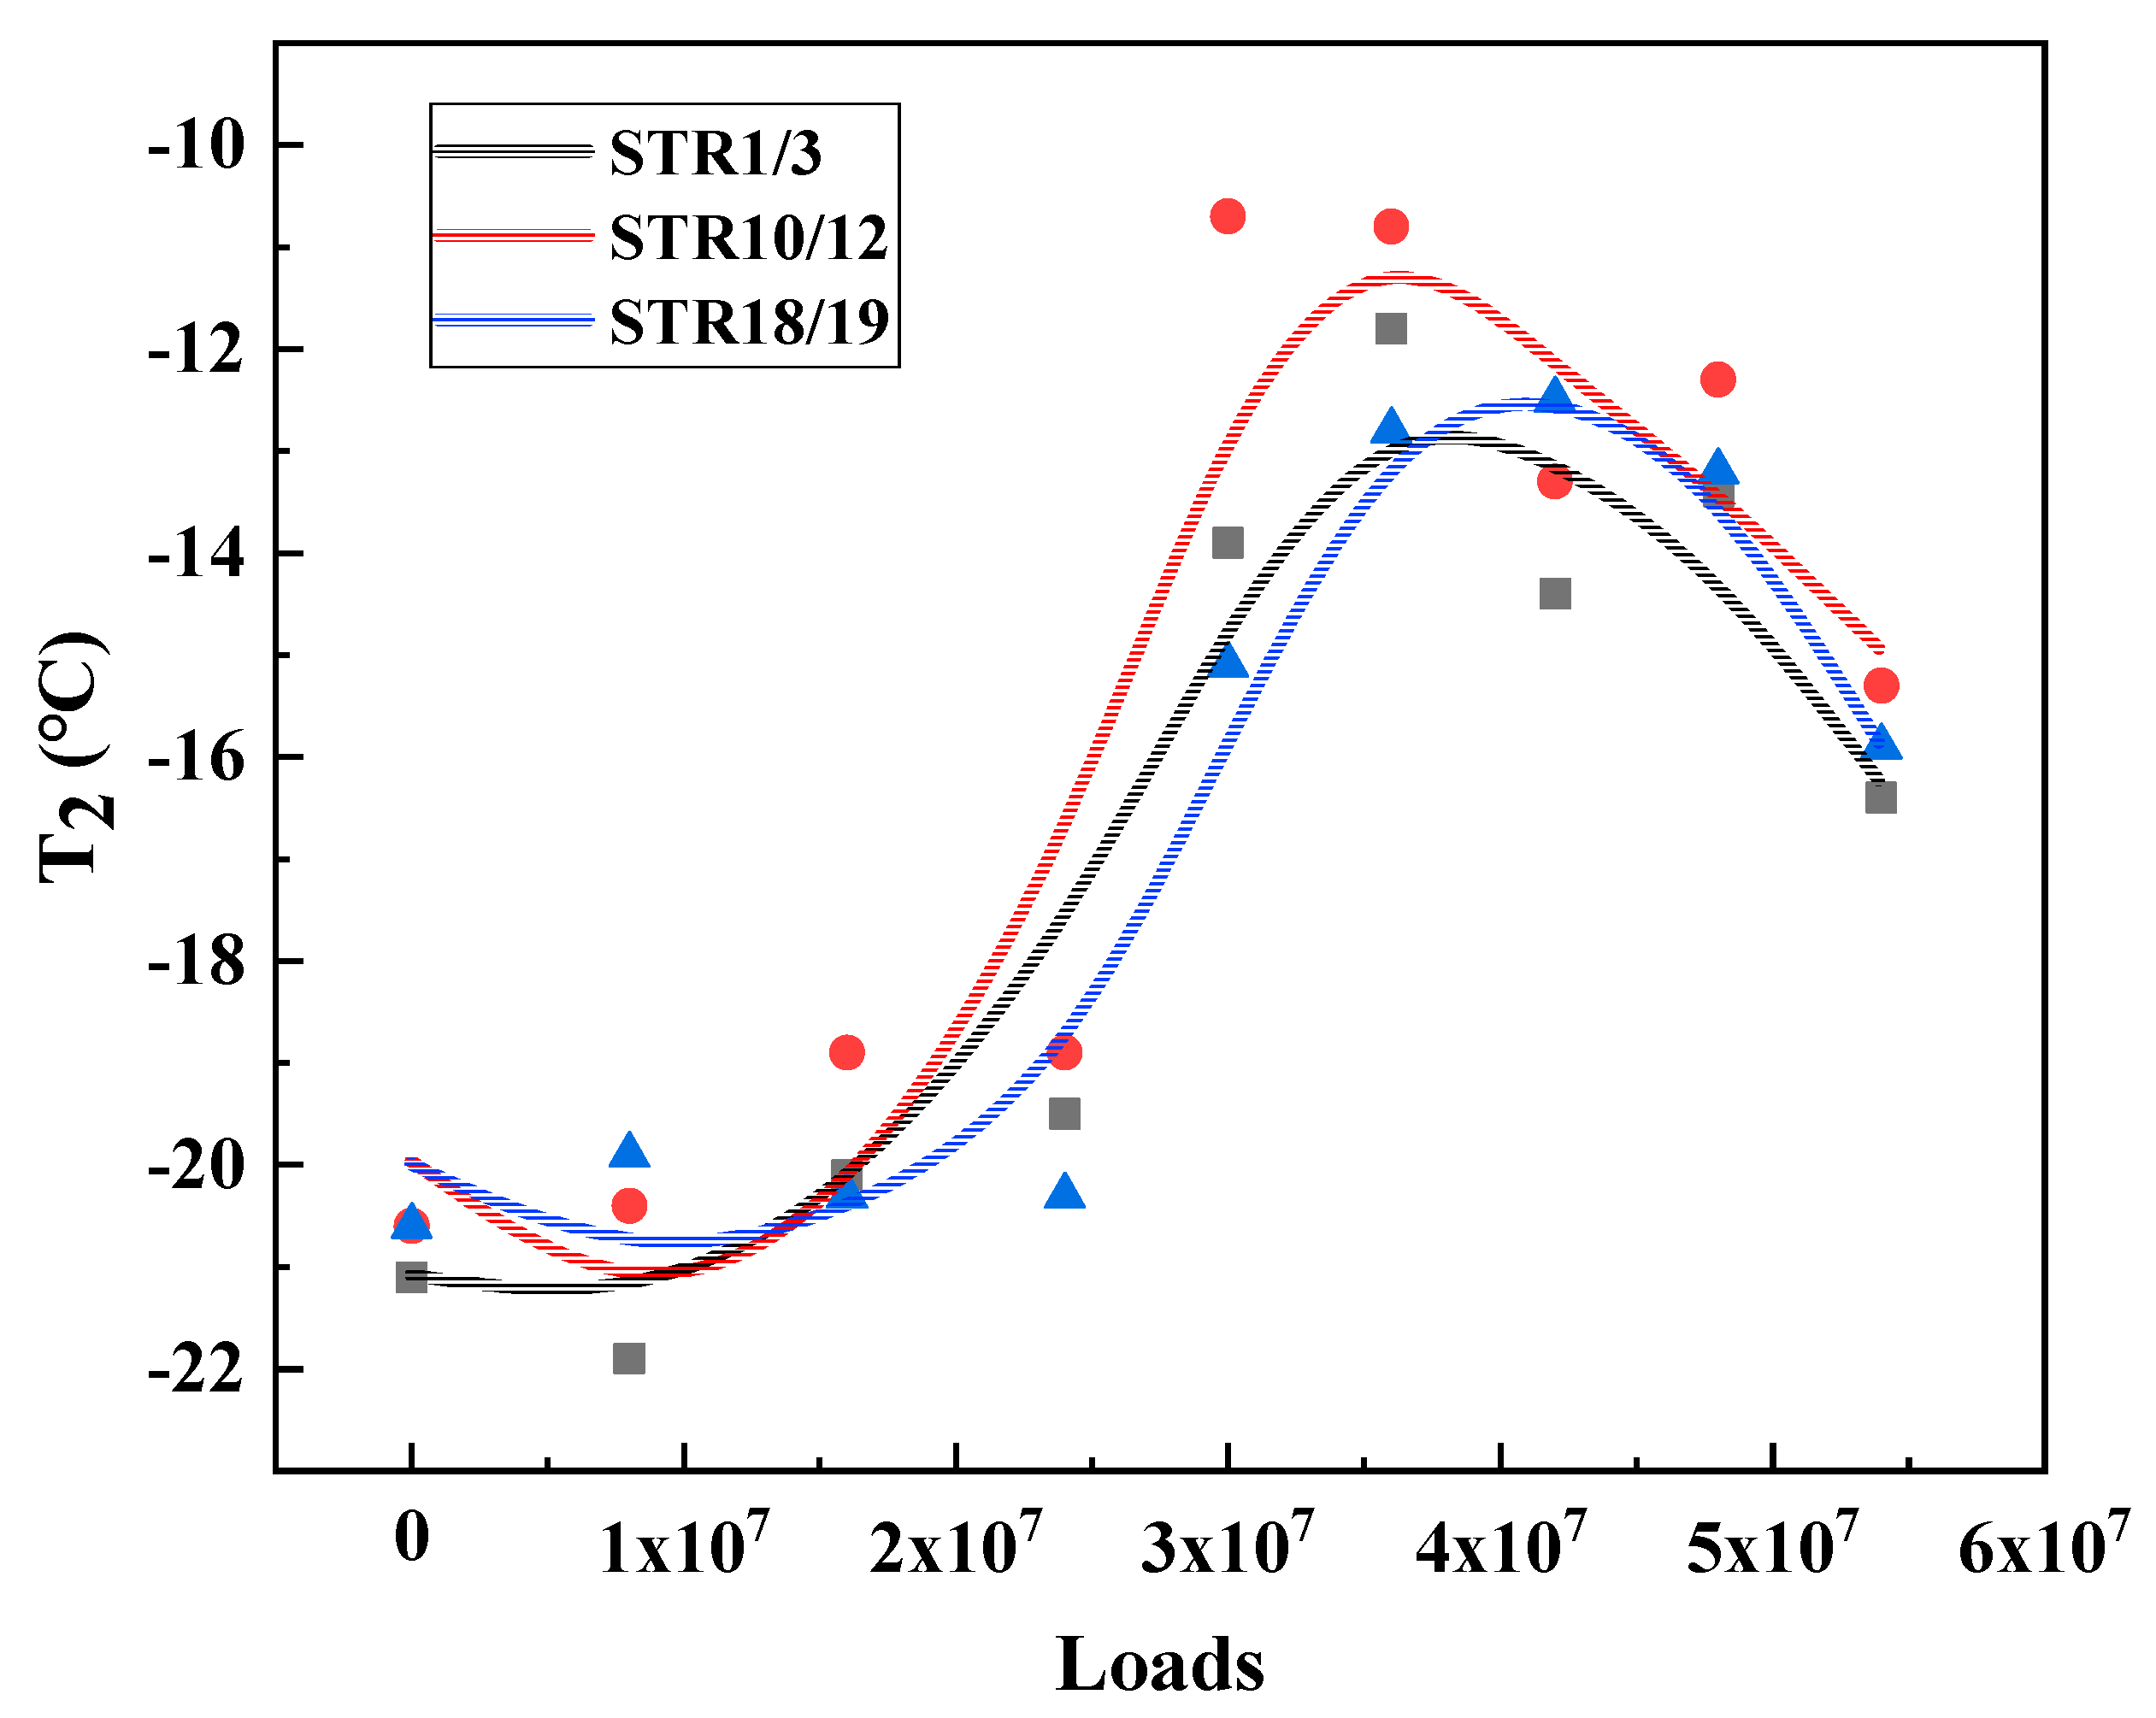
3.4. Structural Dependence of the Characteristic Temperature
4. Conclusions
- (1)
- Under the coupling effect of loading environment, the five-phase transformation characteristic temperatures of the surface layer asphalt mixture all show a trend of first increasing and then decreasing, indicating that with the increase of service time of the pavement, the low temperature crack resistance of the surface layer asphalt mixture first becomes better and then worse, while the high temperature performance first becomes worse and then recovers.
- (2)
- With the coupling of load environment, the modulus of asphalt pavement surface layer asphalt mixture first increases and then gradually decreases, while the phase angle first decreases and then gradually increases, indicating that the asphalt mixture in the actual service process, there are two stages of compression density hardening and then fluctuating softness.
- (3)
- During the long-term service, the phase transition characteristics of the surface layer asphalt mixture temperature shows obvious material variability and structural dependence, SMA-13 shows more stability than AC-13, and is less affected by the environment and loading, while in terms of structure, the semi-rigid base layer thin asphalt surface structure represented by STR1/3 shows better performance than the inverted structure represented by STR10/12. better road performance.
Author Contributions
Funding
Institutional Review Board Statement
Informed Consent Statement
Data Availability Statement
Conflicts of Interest
References
- Gao, Y.; Geng, D.; Huang, X.; Li, G. Degradation evaluation index of asphalt pavement based on mechanical performance of asphalt mixture. Constr. Build. Mater. 2017, 140, 75–81. [Google Scholar] [CrossRef]
- Zhou, F.; Scullion, T. Guidelines for Evaluation of Existing Pavements for HMA Overlay. Concr. Pavements 2007.
- Seo, J.-W.; Kim, S.-I.; Choi, J.-S.; Park, D.-W. Evaluation of layer properties of flexible pave-ment using a pseudo-static analysis procedure of Falling Weight Deflectometer. Constr. Build. Mater. 2009, 23, 3206–3213. [Google Scholar] [CrossRef]
- Nega, A.; Nikraz, H.; Al-Qadi, I.L. Dynamic analysis of falling weight deflectometer. J. Traffic Transp. Eng. 2016, 3, 427–437. [Google Scholar] [CrossRef]
- Sebaaly, B.; Mamlouk, M.; Davies, T. Dynamic Analysis of Falling Weight Deflectometer Data. Transp. Res. Rec. 1986, 1070, 63–68. [Google Scholar]
- Duan, D.; Zha, X.; Zhang, Q. Subgrade resilience modulus measuring by portable falling weight deflectometer(PFWD). J. Traffic Transp. Eng. 2004, 4, 10–12. [Google Scholar] [CrossRef]
- Zha, X. Study of Rapid Test of Subgrade Modulus with PFWD. J. Highw. Transp. Res. Dev. 2009, 26, 26–30. [Google Scholar] [CrossRef]
- Lee, K.; Pape, S.; Castorena, C.; Kim, Y.R. Evaluation of Small Specimen Geometries for Asphalt Mixture Performance Testing and Pavement Performance Prediction. Transp. Res. Rec. J. Transp. Res. Board 2017, 2631, 74–82. [Google Scholar] [CrossRef]
- Yuan, Q.; Liu, W.; Pan, Y.; Deng, D.; Liu, Z. Characterization of Cement Asphalt Mortar for Slab Track by Dynamic Mechanical Thermoanalysis. J. Mater. Civ. Eng. 2016, 28, 04015154.1–04015154.8. [Google Scholar] [CrossRef]
- Kim, H.; Wagoner, M.; Buttlar, W. Micromechanical fracture modeling of asphalt concrete using a single-edge notched beam test. Mater. Struct. 2008, 42, 677–689. [Google Scholar] [CrossRef]
- Wang, Y.; Wang, X.; Ma, Z.; Shan, L.; Zhang, C. Evaluation of the High- and Low-Temperature Performance of Asphalt Mortar Based on the DMA Method. Materials 2022, 15, 3341. [Google Scholar] [CrossRef] [PubMed]
- Chen, D.-H.; Bilyeu, J.; Scullion, T.; Nazarian, S.; Chiu, C.-T. Failure Investigation of a Foamed-Asphalt Highway Project. J. Infrastruct. Syst. 2006, 12, 33–40. [Google Scholar] [CrossRef]
- Tarefder, R.; Ahmad, M. Evaluating the Relationship between Permeability and Moisture Damage of Asphalt Concrete Pavements. J. Mater. Civ. Eng. 2015, 27, 04014172. [Google Scholar] [CrossRef]
- Gu, F.; Luo, X.; Zhang, Y.; Lytton, R.L. Using overlay test to evaluate fracture properties of field-aged asphalt concrete. Constr. Build. Mater. 2015, 101, 1059–1068. [Google Scholar] [CrossRef]
- Soliman, H.; Shalaby, A. Glass Transition Temperature and Low-Temperature Stiffness of Hot-Pour Bituminous Sealants. In Proceedings of the Transportation Research Board Meeting, Washington, DC, USA, 13–17 January 2008. [Google Scholar]
- Lei, Z.; Tan, Y.; Bahia, H. Relationship between glass transition temperature and low temperature properties of oil modified binders. Constr. Build. Mater. 2016, 104, 92–98. [Google Scholar] [CrossRef]
- Jin, L.; Qian, Z.; Zheng, Y. High temperature performance and evaluation index of gussasphalt mortar based on DMA method. J. Southeast Univ. Nat. Sci. Ed. 2014, 44, 1062–1067. [Google Scholar] [CrossRef]
- Yang, G.; Wang, X.; Zhou, X.; Wang, Y. Experimental Study on the Phase Transition Characteristics of Asphalt Mixture for Stress Absorbing Membrane Interlayer. Materials 2020, 13, 474. [Google Scholar] [CrossRef] [PubMed]
- Zhang, C.; Ren, Q.; Qian, Z.; Wang, X. Evaluating the Effects of High RAP Content and Rejuvenating Agents on Fatigue Performance of Fine Aggregate Matrix through DMA Flexural Bending Test. Materials 2019, 12, 1508. [Google Scholar] [CrossRef] [PubMed]
- Gedik, A. A Literature Review of Bitumen Hardening from Past to Present: Aging Mechanism, Indicators, Test Methods, and Retarders. In Proceedings of the International Airfield and Highway Pavements Conference 2021, Austin, TX, USA, 8–10 June 2021. [Google Scholar] [CrossRef]


| Frequency | Coring Time | Loading Axle Time | Core State |
|---|---|---|---|
| 1 | 31 December 2018 | 8 million times | Carriageway (intact) |
| 2 | 23 July 2019 | 16 million times | |
| 3 | 14 January 2020 | 24 million times | |
| 4 | 20 June 2020 | 30 million times | |
| 5 | 3 November 2020 | 36 million times | |
| 6 | 24 February 2021 | 42 million times | |
| 7 | 23 June 2021 | 48 million times | |
| 8 | 19 October 2021 | 54 million times |
| Asphalt | Ductility/cm (10 °C) | Ductility/cm (5 °C) | Penetration/0.1 mm (25 °C) | Softening Point/°C |
|---|---|---|---|---|
| SBS modified asphalt | 48.7 | 28.5 | 63.4 | 72.7 |
| Structure | Material | Pass Rate of Each Grade of Sieve Hole (%) | |||||||||
|---|---|---|---|---|---|---|---|---|---|---|---|
| 16 | 13.2 | 9.5 | 4.75 | 2.36 | 1.18 | 0.6 | 0.3 | 0.15 | 0.075 | ||
| STR1/3 | AC13-65 | 100 | 98.0 | 60.6 | 34.8 | 25.4 | 17.7 | 13.4 | 9.9 | 8.8 | 7.1 |
| STR10/12 | |||||||||||
| STR18/19 | SMA13-75 | 100 | 97.7 | 54.7 | 24.9 | 16.7 | 13.9 | 12.5 | 11.4 | 11.0 | 9.7 |
| Loading Axle Time (Million) | STR1/3 | STR10/12 | Difference |
|---|---|---|---|
| 8 | −21.1 | −20.6 | −0.5 |
| 16 | −21.9 | −20.4 | −1.5 |
| 24 | −20.1 | −18.9 | −1.2 |
| 30 | −19.5 | −18.9 | −0.6 |
| 36 | −13.9 | −10.7 | −3.2 |
| 42 | −11.8 | −10.8 | −1 |
| 48 | −14.4 | −13.3 | −1.1 |
| 54 | −13.4 | −12.3 | −1.1 |
| −16.4 | −15.3 | −1.1 |
| Loading Axle Time (Million) | STR1/3 | STR10/12 | Difference |
|---|---|---|---|
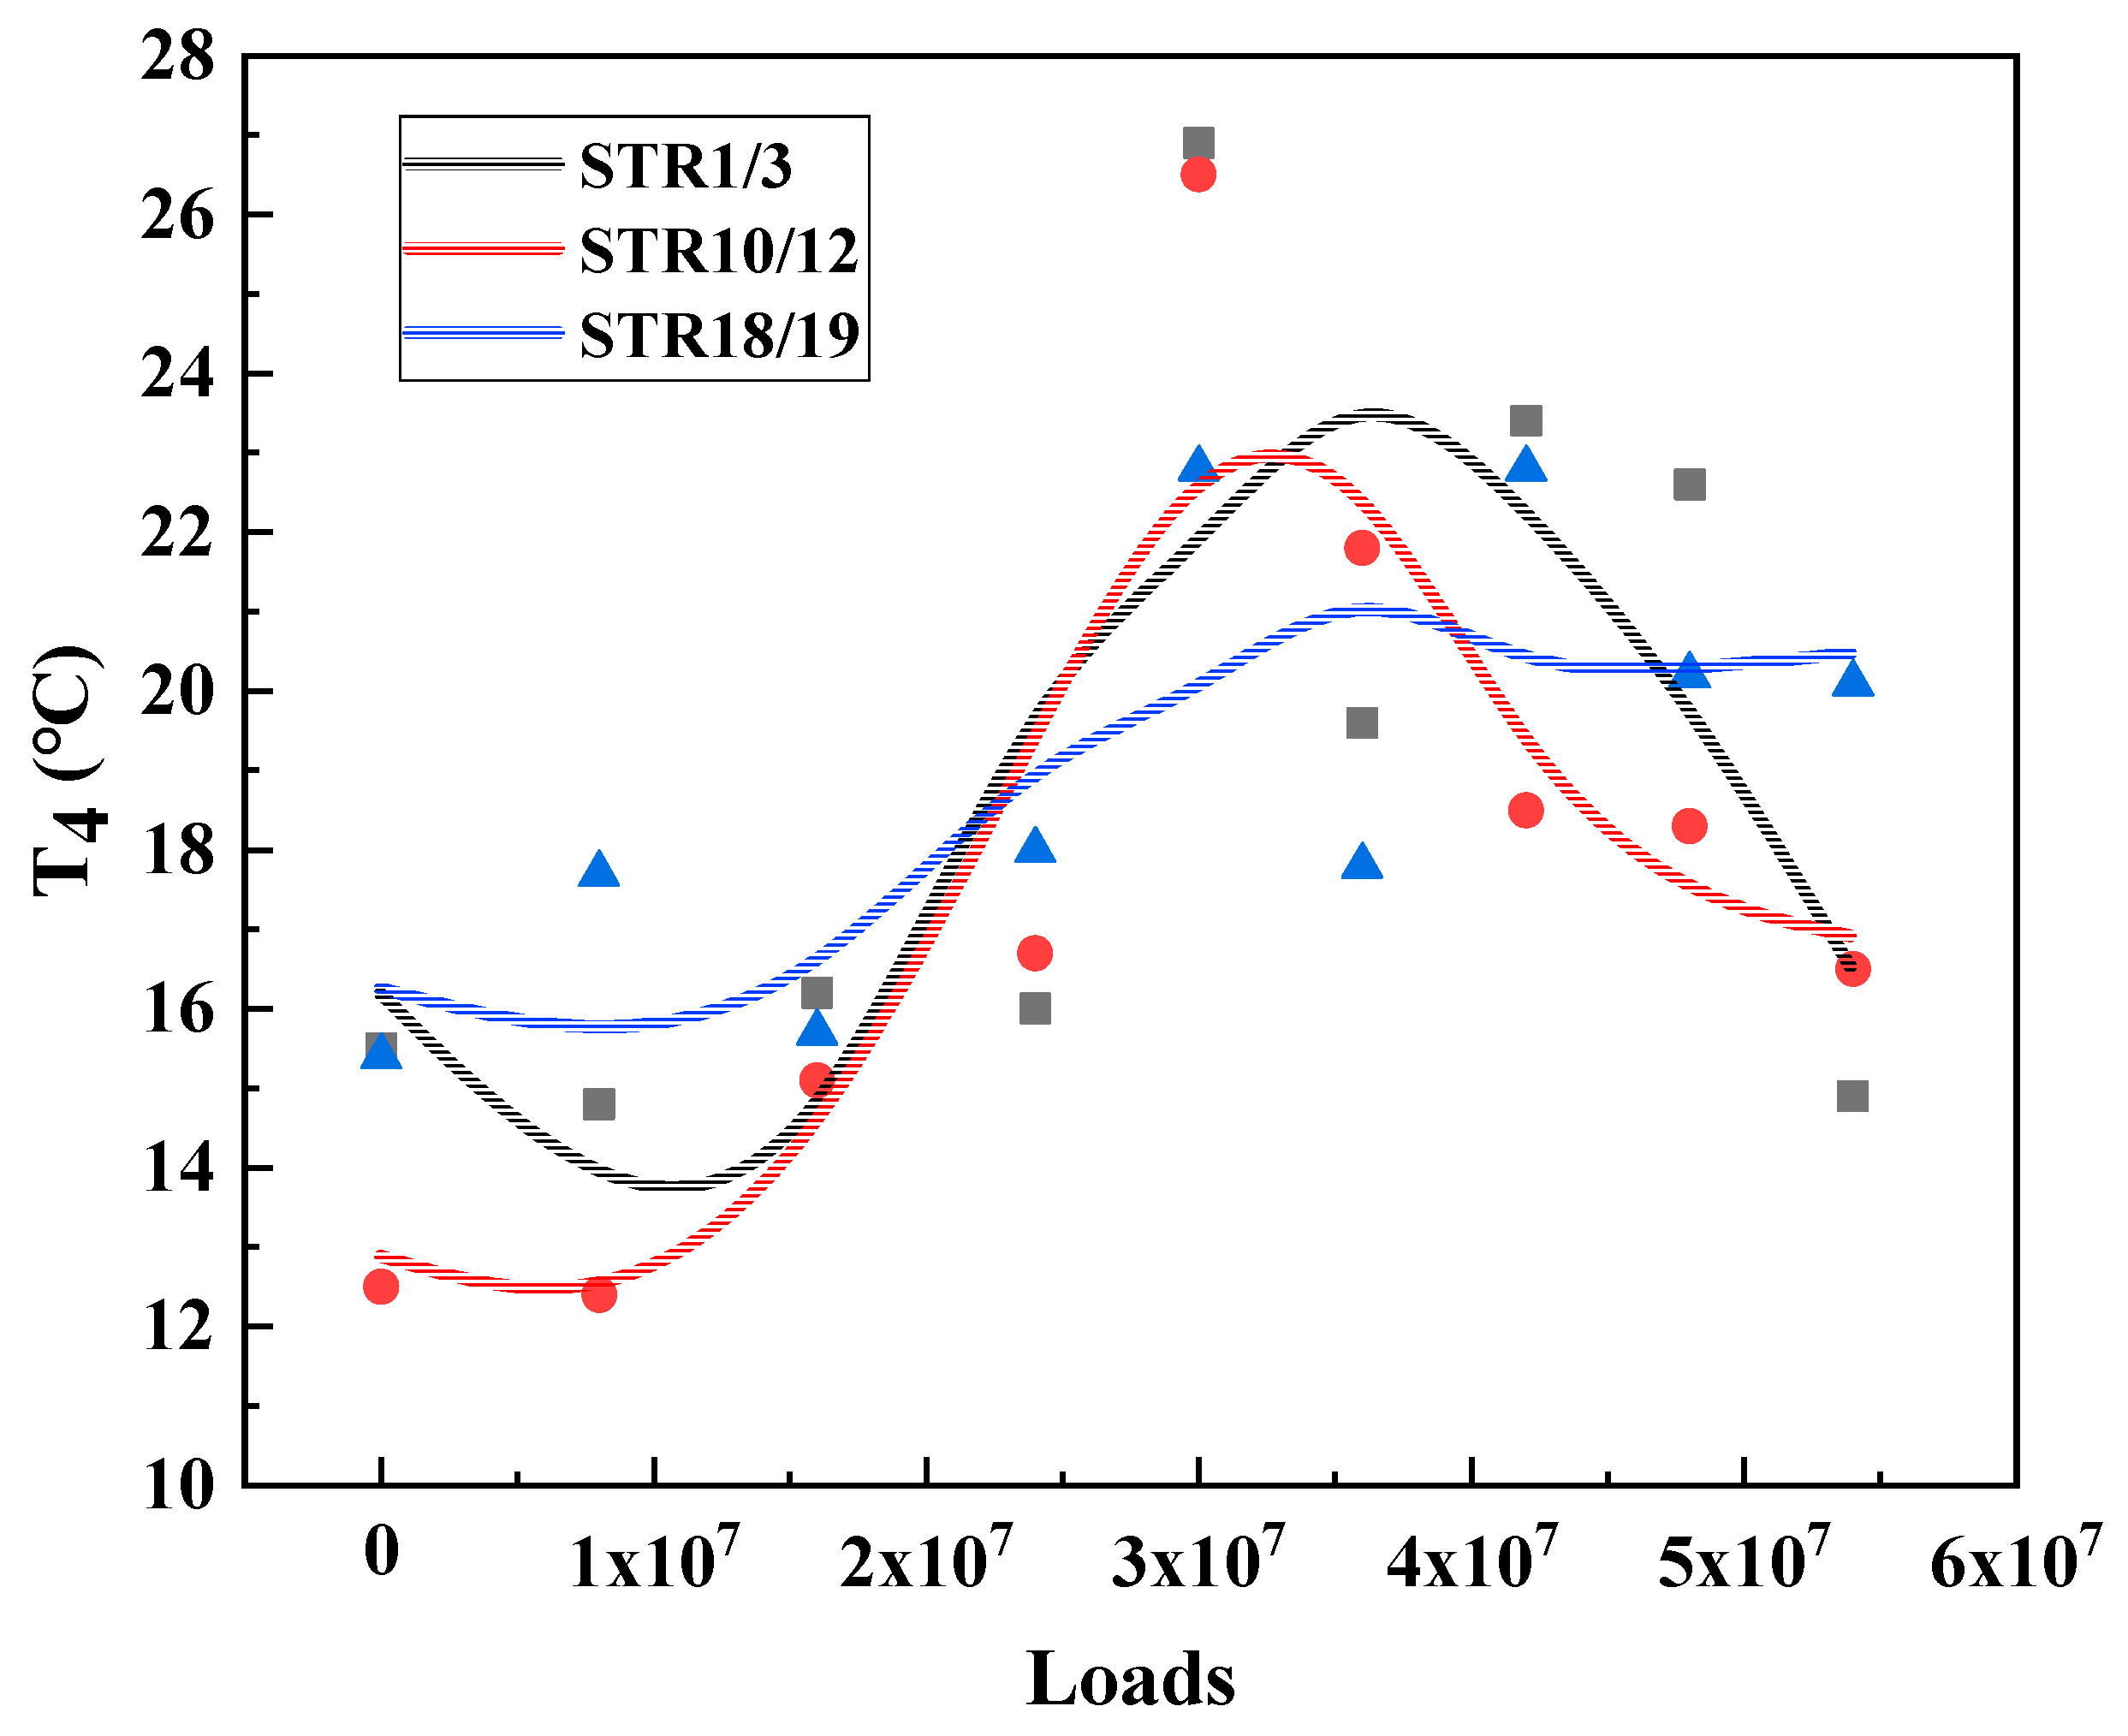
| 0 | 15.5 | 12.5 | 3 |
| 800 | 14.8 | 12.4 | 2.4 |
| 1600 | 16.2 | 15.1 | 1.1 |
| 2400 | 16.0 | 16.7 | −0.7 |
| 3000 | 26.9 | 26.5 | 0.4 |
| 3600 | 19.6 | 21.8 | −2.2 |
| 4200 | 23.4 | 18.5 | 4.9 |
| 4800 | 22.6 | 18.3 | 4.3 |
| 5400 | 14.9 | 16.5 | −1.6 |
| Loading Axle Time (Million) | STR1/3 | STR10/12 | Difference |
|---|---|---|---|
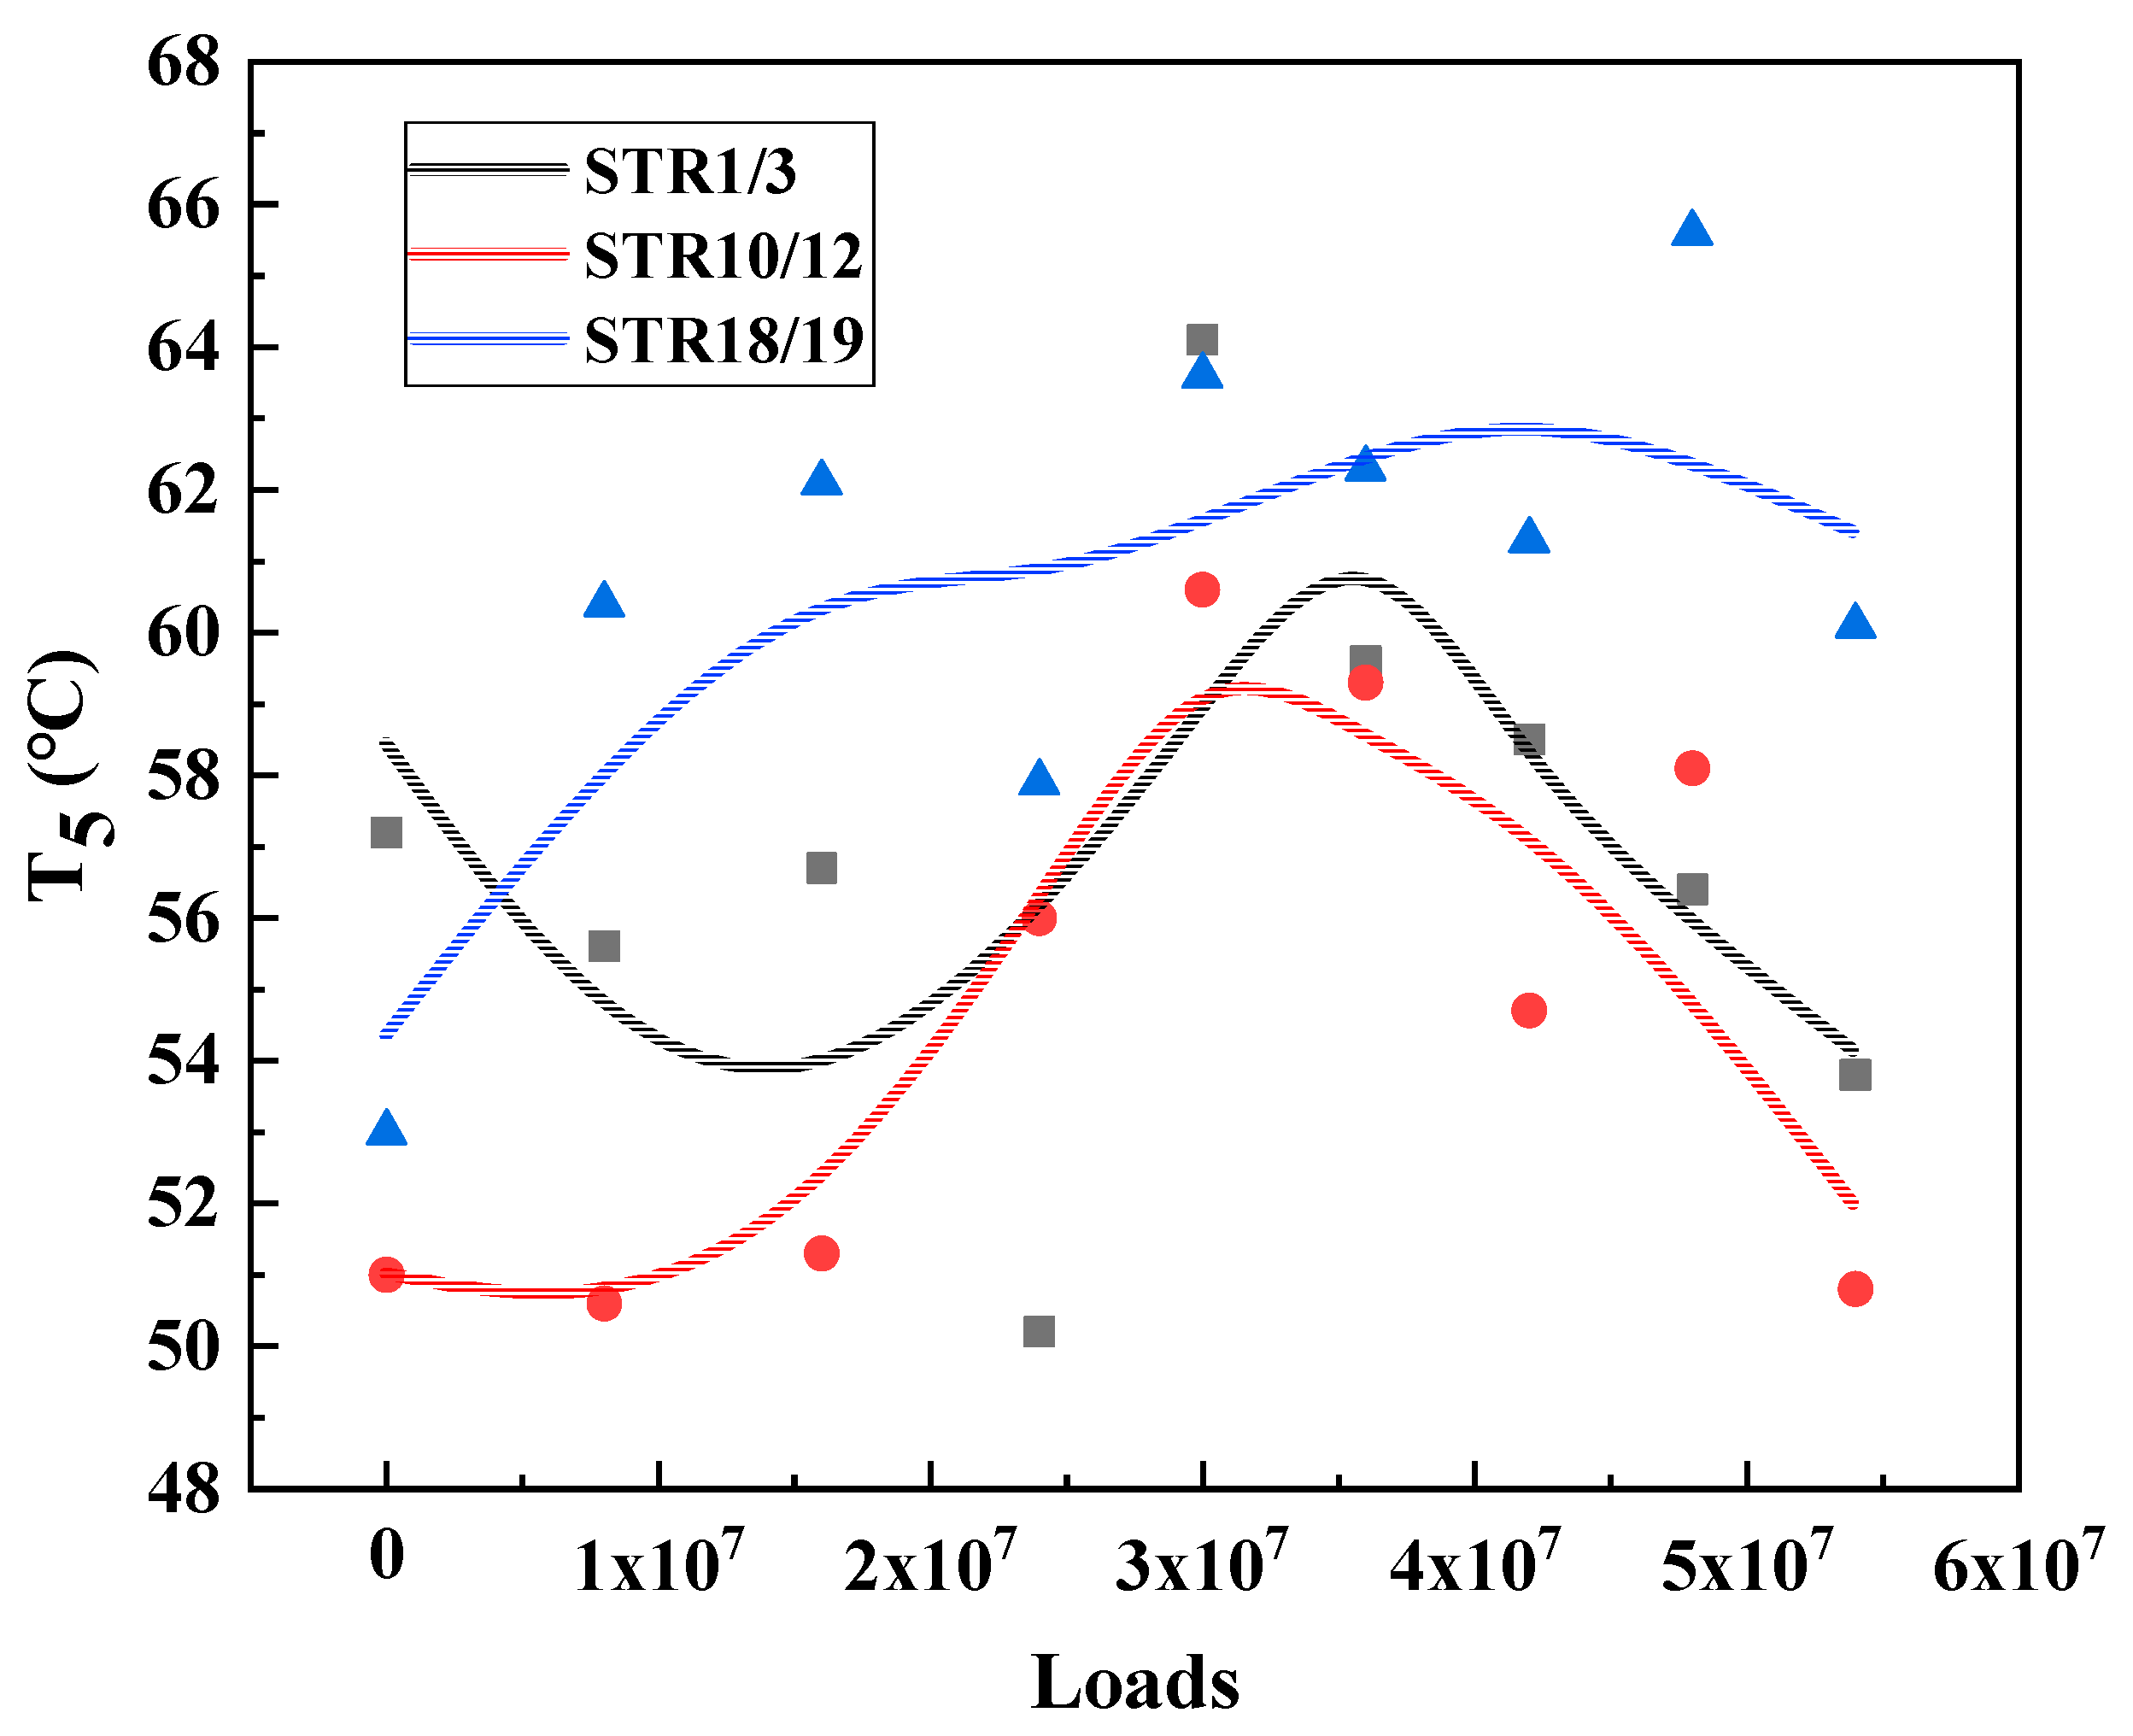
| 0 | 57.2 | 51.0 | 6.2 |
| 800 | 55.6 | 50.6 | 5 |
| 1600 | 56.7 | 51.3 | 5.4 |
| 2400 | 56 | 50.2 | 5.8 |
| 3000 | 64.1 | 60.6 | 3.5 |
| 3600 | 59.6 | 59.3 | 0.3 |
| 4200 | 58.5 | 54.7 | 3.8 |
| 4800 | 56.4 | 58.1 | −1.7 |
| 5400 | 53.8 | 50.8 | 3 |
Publisher’s Note: MDPI stays neutral with regard to jurisdictional claims in published maps and institutional affiliations. |
© 2022 by the authors. Licensee MDPI, Basel, Switzerland. This article is an open access article distributed under the terms and conditions of the Creative Commons Attribution (CC BY) license (https://creativecommons.org/licenses/by/4.0/).
Share and Cite
Ma, Z.; Wang, X.; Wang, Y.; Zhou, X.; Wu, Y. Long-Term Performance Evolution of RIOHTrack Pavement Surface Layer Based on DMA Method. Materials 2022, 15, 6461. https://doi.org/10.3390/ma15186461
Ma Z, Wang X, Wang Y, Zhou X, Wu Y. Long-Term Performance Evolution of RIOHTrack Pavement Surface Layer Based on DMA Method. Materials. 2022; 15(18):6461. https://doi.org/10.3390/ma15186461
Chicago/Turabian StyleMa, Zhimin, Xudong Wang, Yanzhu Wang, Xingye Zhou, and Yang Wu. 2022. "Long-Term Performance Evolution of RIOHTrack Pavement Surface Layer Based on DMA Method" Materials 15, no. 18: 6461. https://doi.org/10.3390/ma15186461
APA StyleMa, Z., Wang, X., Wang, Y., Zhou, X., & Wu, Y. (2022). Long-Term Performance Evolution of RIOHTrack Pavement Surface Layer Based on DMA Method. Materials, 15(18), 6461. https://doi.org/10.3390/ma15186461