
Evaluation of Polysaccharide–Peptide Conjugates Containing the RGD Motif for Potential Use in Muscle Tissue Regeneration

 , , ,
, , ,  ,
,  , , , , ,
Abstract
1. Introduction
2. Materials and Methods
2.1. Synthesis of Peptides Containing the RGD Motif
2.1.1. Synthesis of H-RGDS-OH (1)
2.1.2. Synthesis of H-GRGDS-NH2 (2)
2.1.3. Synthesis of cyclo(RGDfC) (3)
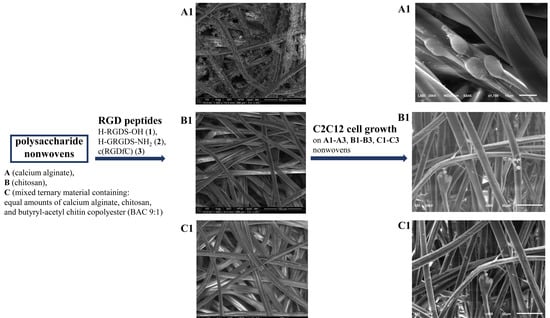
2.2. Preparation of Nonwovens A, B, and C Based on Polysaccharides
Formation of Nonwoven C from Alginate/Chitosan/BAC 9:1 Fibers
2.3. Synthesis of Conjugates A1–A3, B1–B3, and C1–C3 of Polysaccharide Nonwovens A–C Modified with Peptides 1–3 Containing the RGD Motif
2.4. Biological Research
2.4.1. Cell Culture
2.4.2. Cytotoxicity of Polysaccharide Conjugates A–C with Peptides 1–3
2.4.3. Cell Proliferation (Ki-67 Assay) of Polysaccharide Conjugates A–C with Peptides 1–3
2.4.4. Sample Preparation for Microscopic Examination
- Sample preparation for scanning electron microscopy (SEM) imaging
- Sample preparation for optical microscopy imaging
2.4.5. Antibacterial Properties of the Conjugates of Polysaccharides A–C with Peptides 1–3
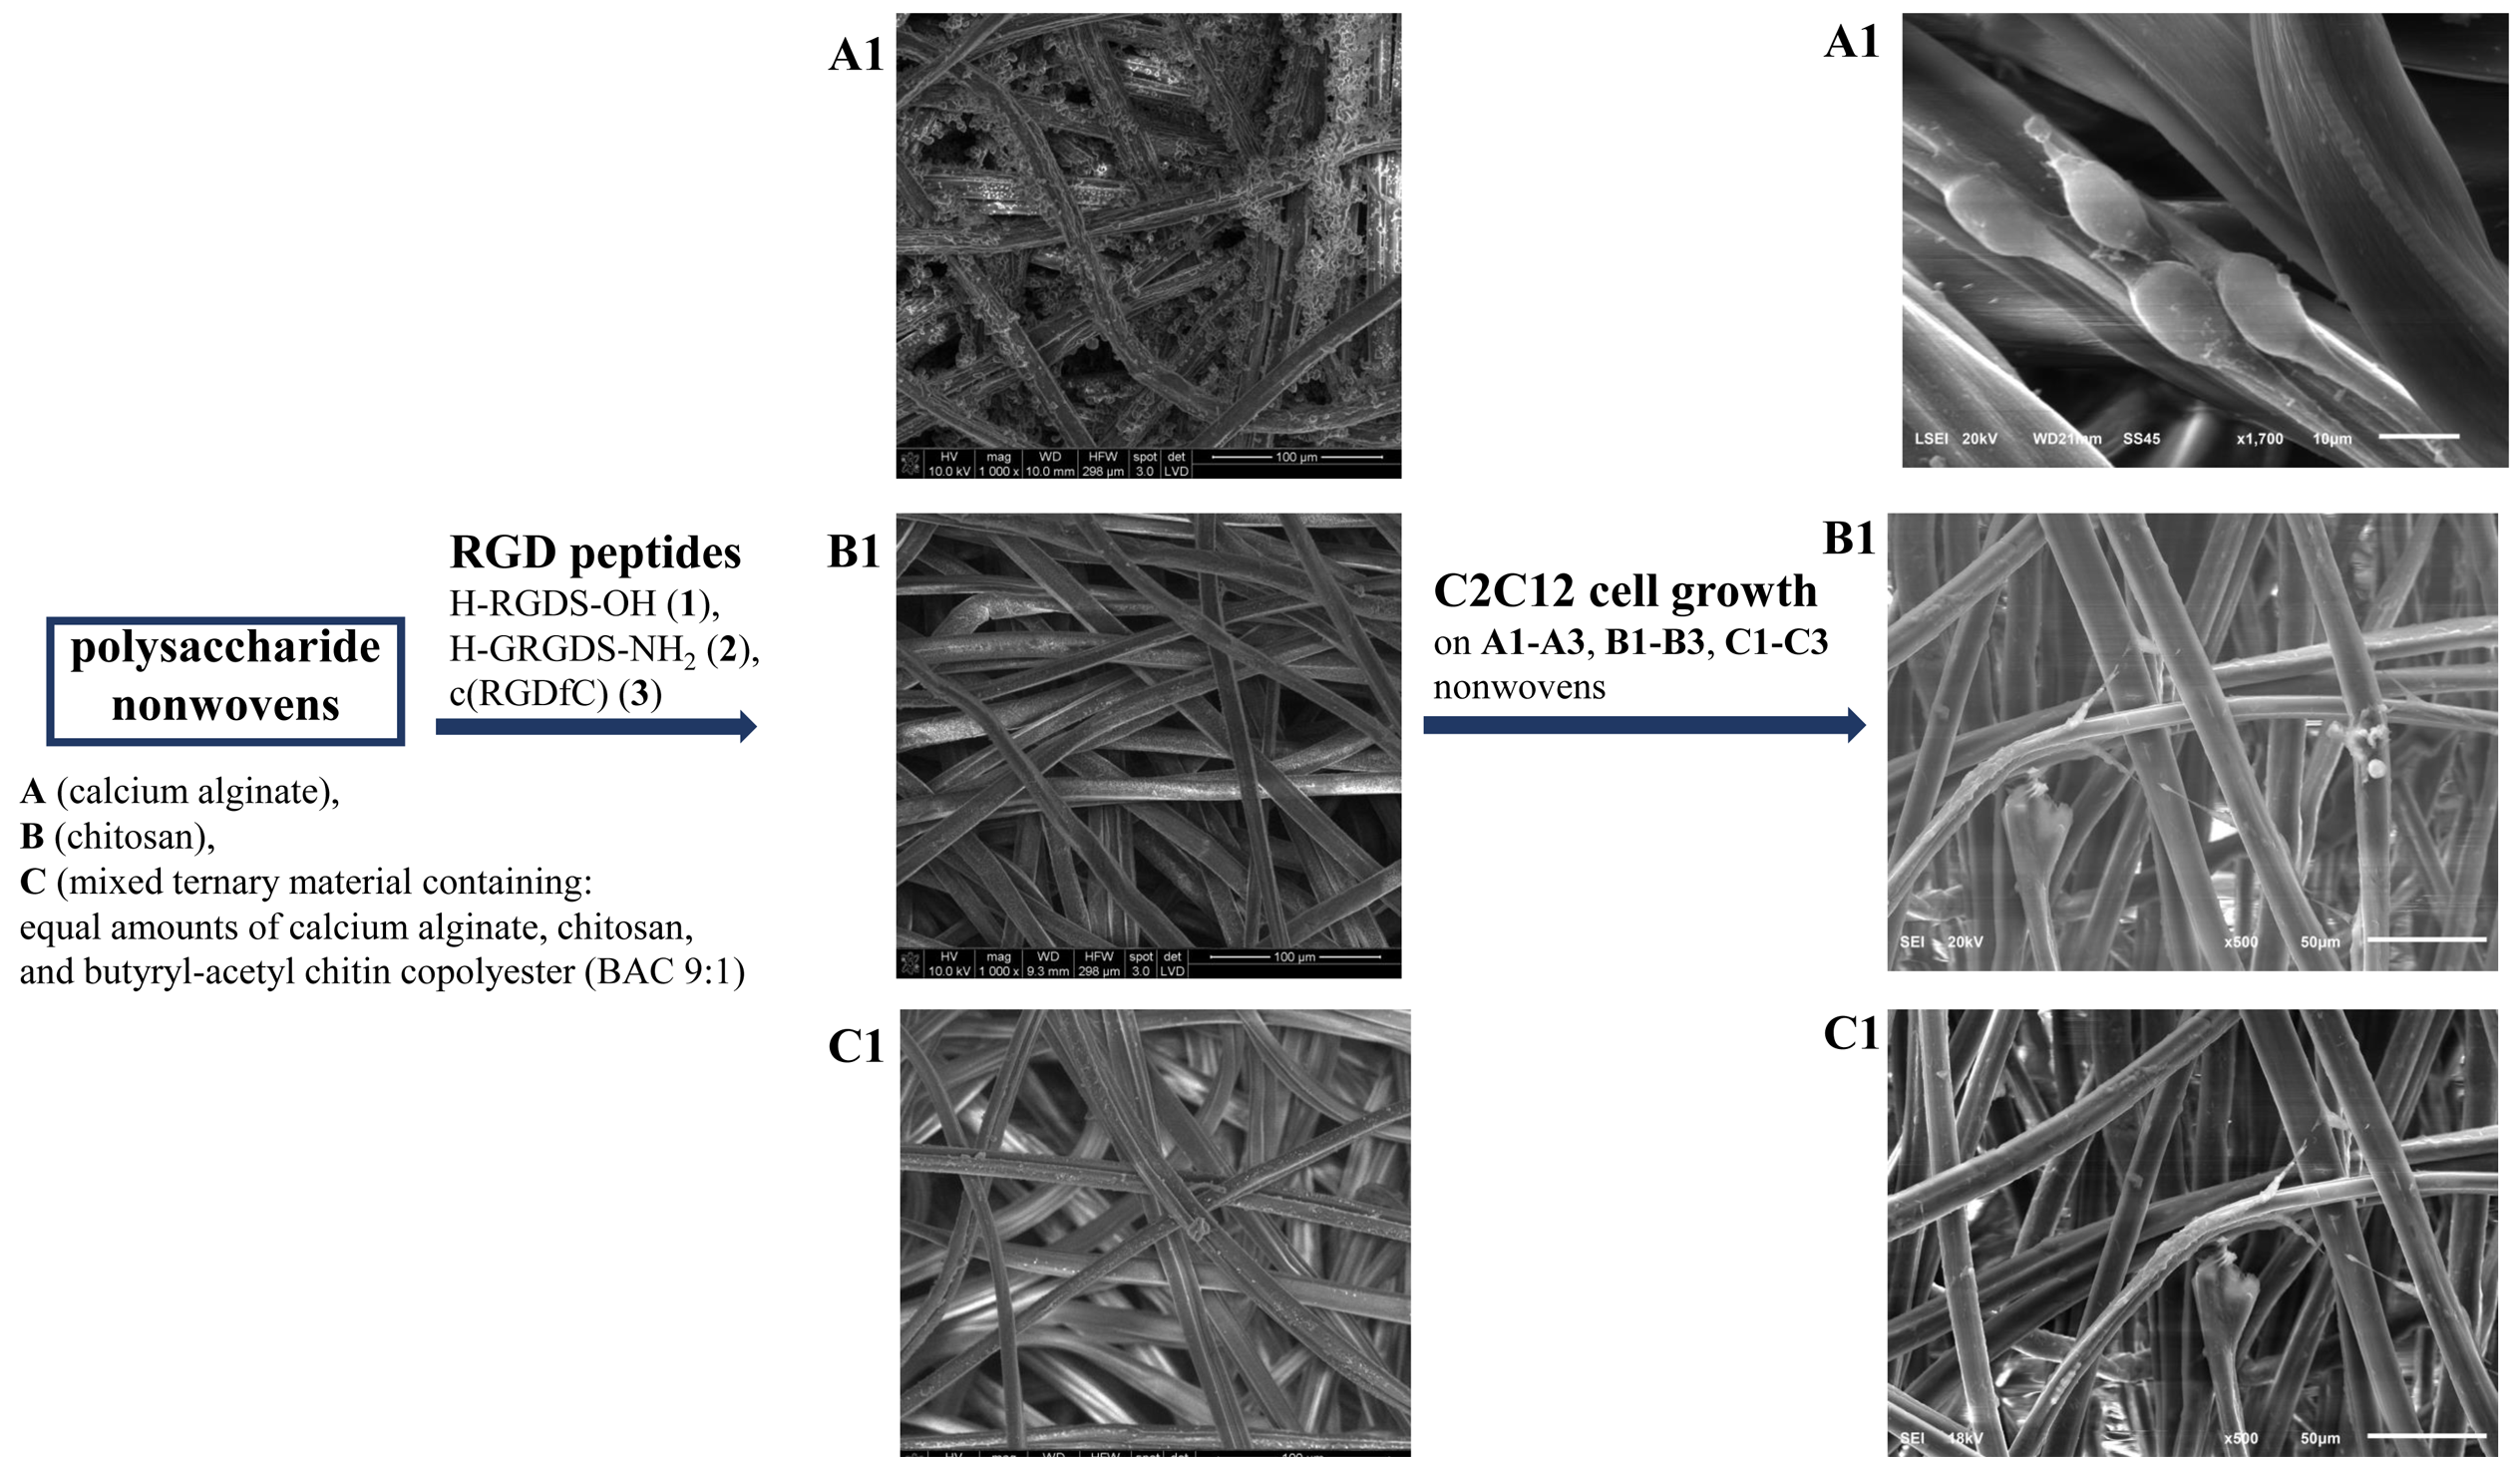
2.4.6. Release of Peptides 1–3 from A1–A3, B1–B3, and C1–C3 Conjugates
2.4.7. Effects of Peptides 1–3 on C2C12 Cells
- Alamarblue® and LDH assays
- Genotoxicity analysis
- Cell viability, apoptosis, and necrosis analysis
- Proliferation (Ki-67 assay) and cell cycle analysis
- Statistical analysis of studies on peptides 1–3
3. Results
3.1. Preparation and Characterization of Polysaccharide–Peptide Conjugates
3.2. Biological Activity of Polysaccharide–Peptide Conjugates Derived from Nonwovens A–C and Peptides 1–3
3.2.1. Antimicrobial Activity of Polysaccharide–Peptide Conjugates
3.2.2. Release Study of Peptides 1–3 from A1–A3, B1–B3, and C1–C3 Materials
3.3. Biological Activity of Peptides 1–3
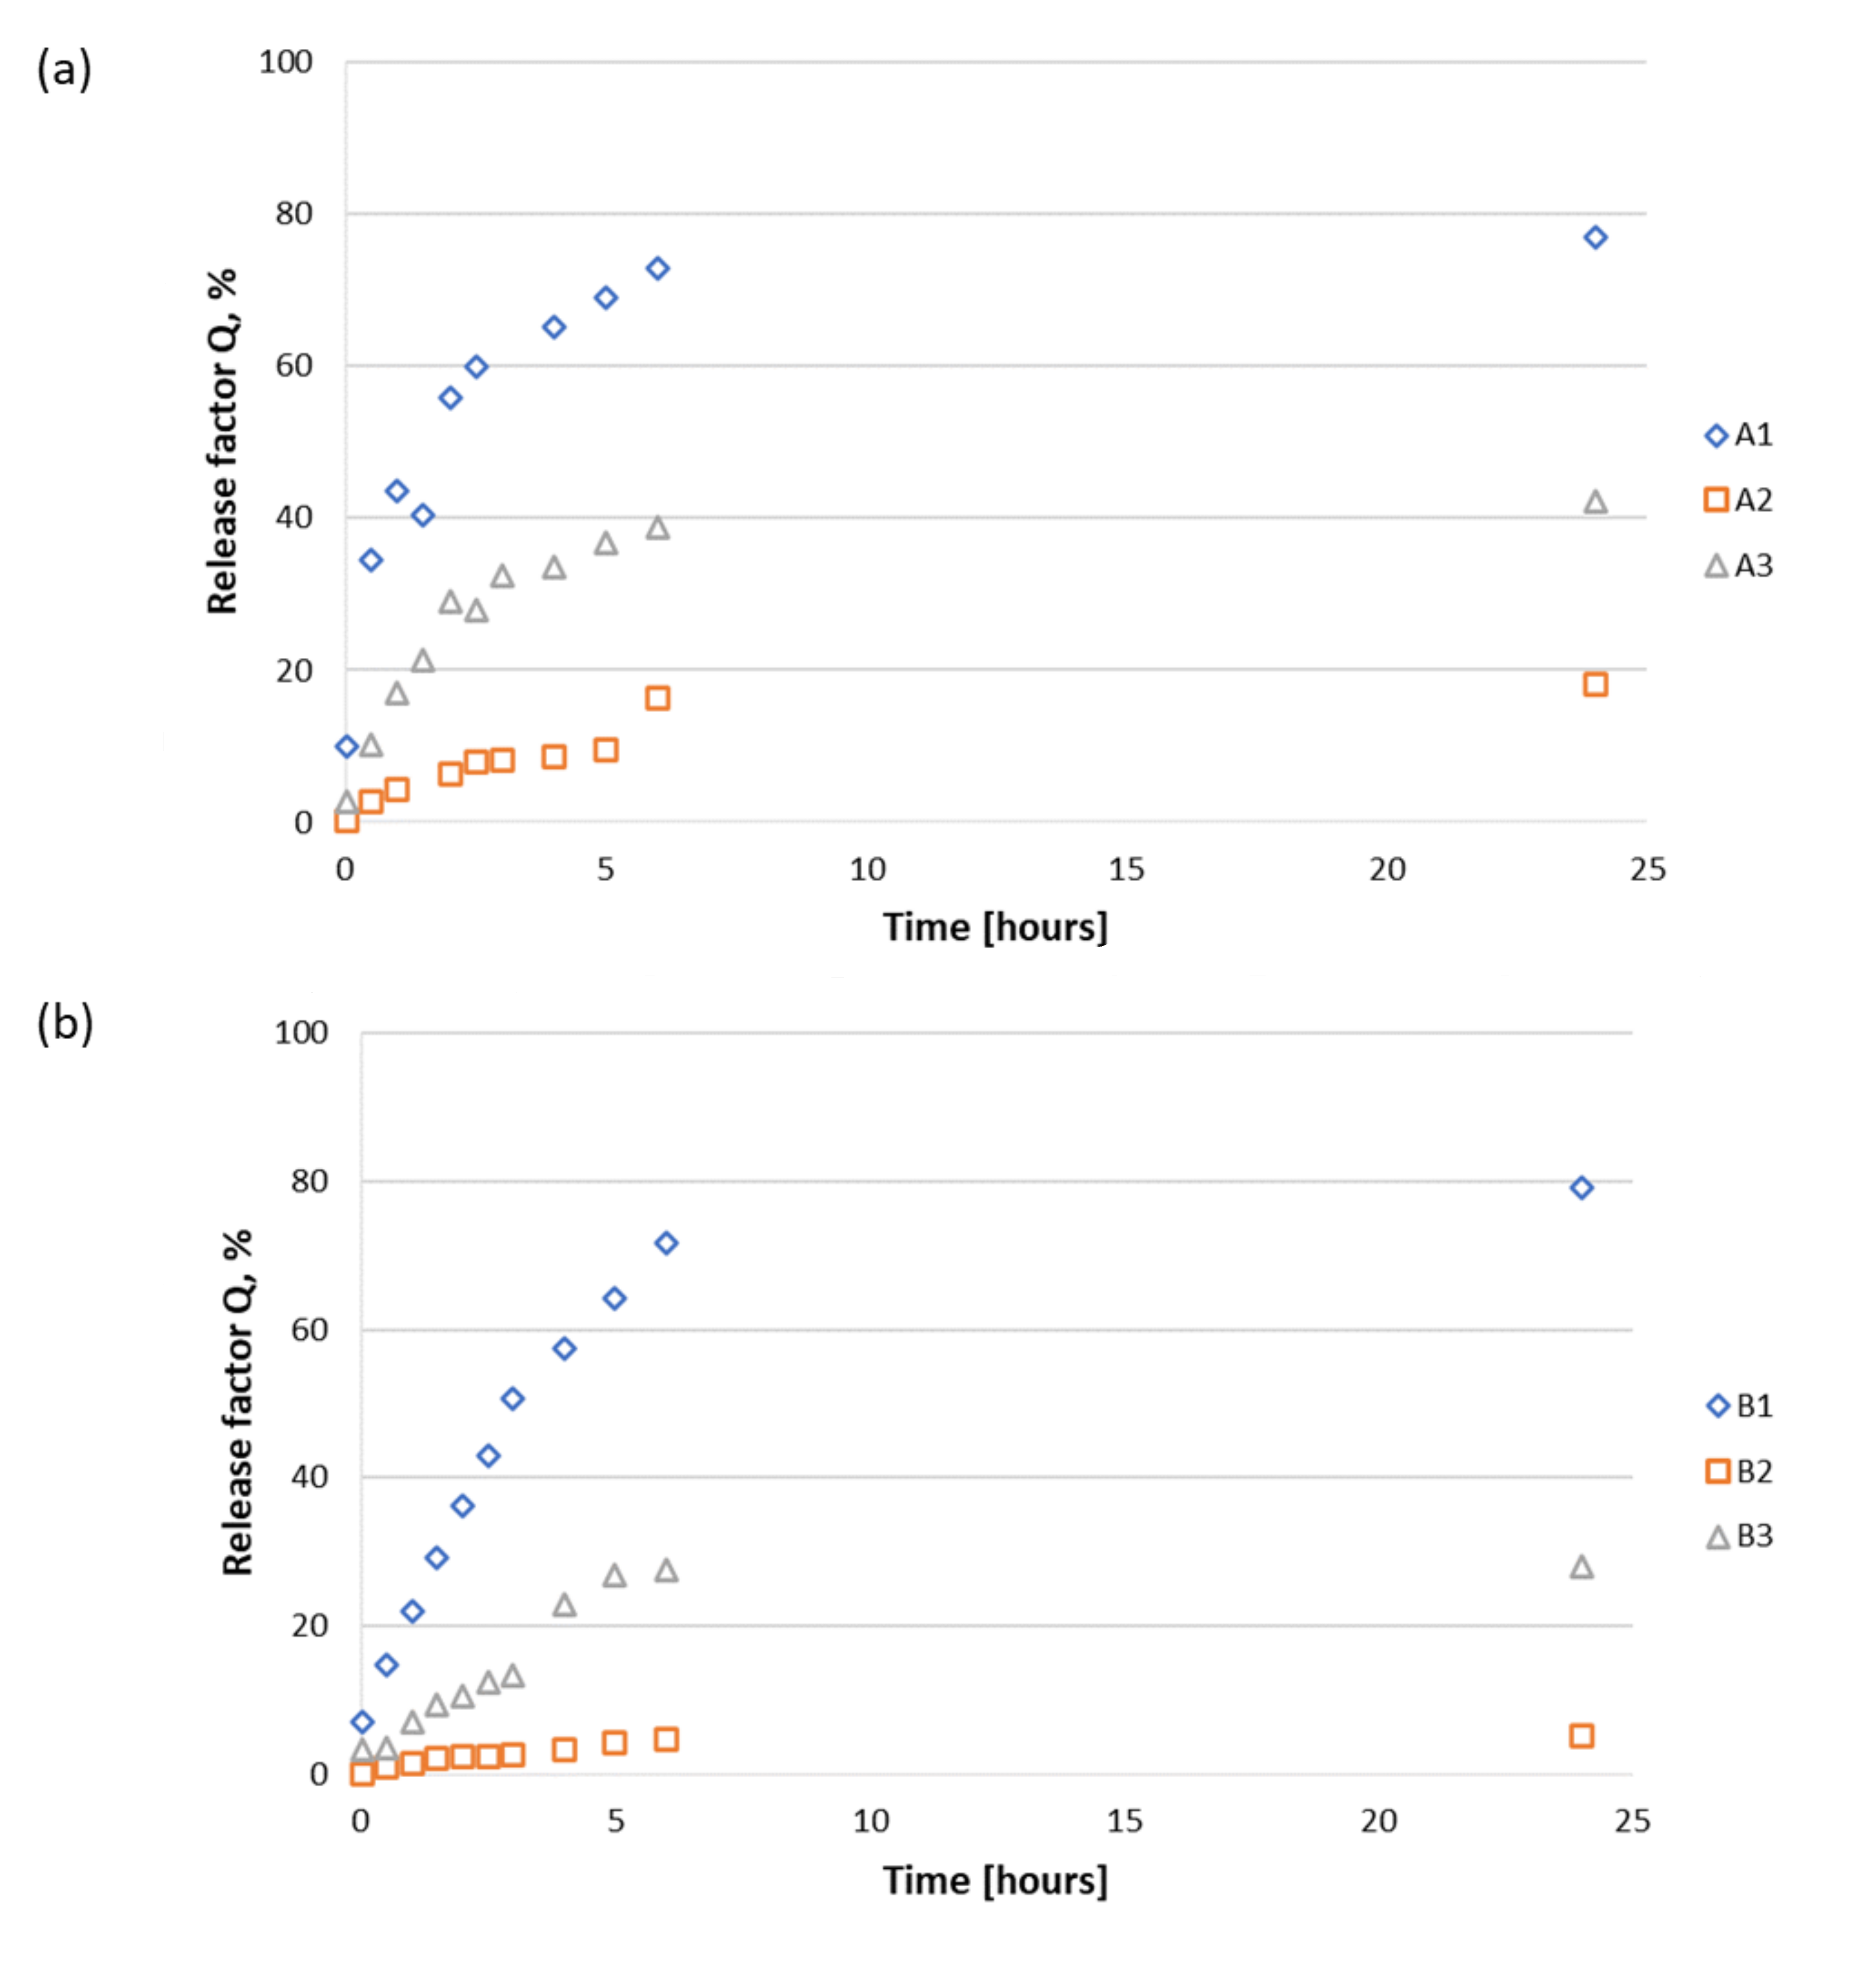
3.3.1. Influence of Peptides 1–3 on the Viability of C2C12 Cells
3.3.2. Genotoxicity of Peptides 1–3
3.3.3. Assessment of Cell Viability, Apoptosis, and Necrosis of C2C12 Cells Treated with Peptides 1–3
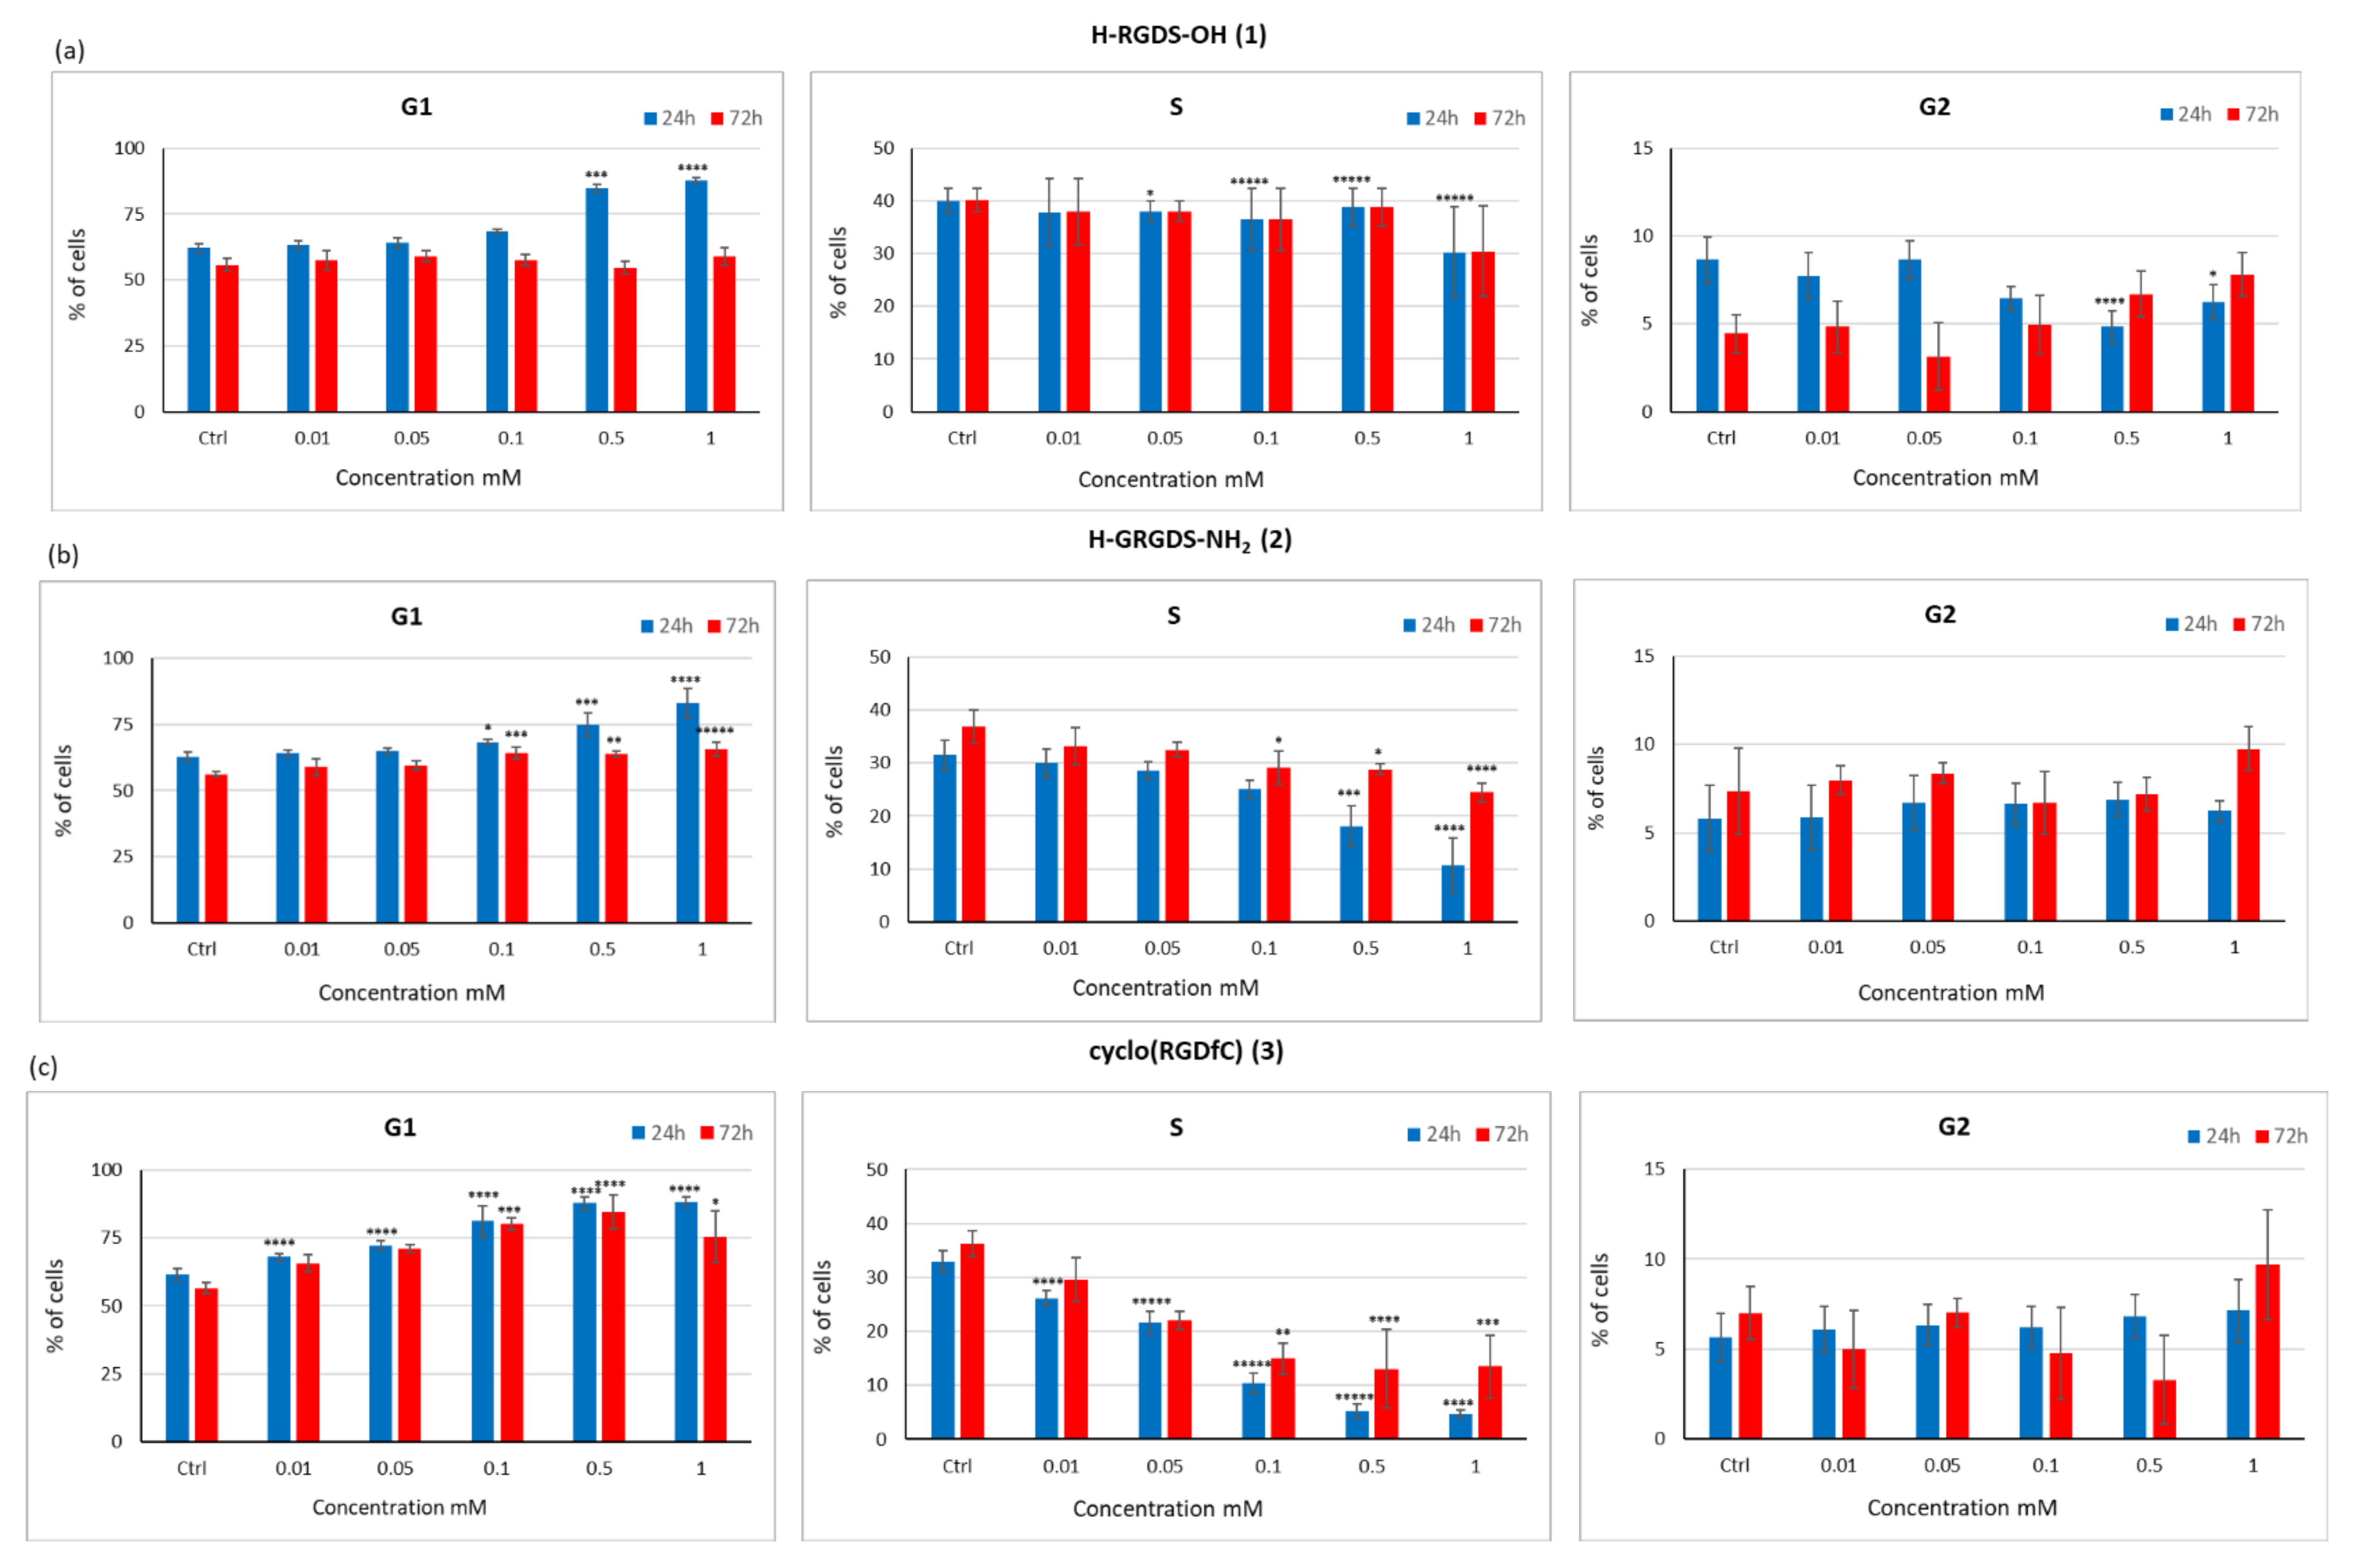
3.3.4. Influence of Peptides 1–3 on the Proliferation Capacity and Cell Cycle of the C2C12 Cell Line
4. Discussion
5. Conclusions
Supplementary Materials
Author Contributions
Funding
Informed Consent Statement
Data Availability Statement
Acknowledgments
Conflicts of Interest
References
- Kwee, B.J.; Mooney, D.J. Biomaterials for skeletal muscle tissue engineering. Curr. Opin. Biotechnol. 2017, 47, 16–22. [Google Scholar] [CrossRef] [PubMed]
- Forcina, L.; Cosentino, M.; Musarò, A. Mechanisms Regulating Muscle Regeneration: Insights into the Interrelated and Time-Dependent Phases of Tissue Healing. Cells 2020, 9, 1297. [Google Scholar] [CrossRef] [PubMed]
- Tedesco, F.S.; Dellavalle, A.; Diaz-Manera, J.; Messina, G.; Cossu, G. Repairing skeletal muscle: Regenerative potential of skeletal muscle stem cells. J. Clin. Investig. 2010, 120, 11–19. [Google Scholar] [CrossRef] [PubMed]
- Wu, X.; Corona, B.T.; Chen, X.; Walters, T.J. A Standardized Rat Model of Volumetric Muscle Loss Injury for the Development of Tissue Engineering Therapies. BioRes. Open Access 2012, 1, 280–290. [Google Scholar] [CrossRef]
- Grogan, B.F.; Hsu, J.R. Volumetric muscle loss. J. Am. Acad. Orthop. Surg. 2011, 19, S35–S37. [Google Scholar] [CrossRef]
- Corona, B.T.; Rivera, J.C.; Owens, J.G.; Wenke, J.C.; Rathbone, C.R. Volumetric muscle loss leads to permanent disability following extremity trauma. J. Rehabil. Res. Dev. 2015, 52, 785–792. [Google Scholar] [CrossRef]
- Liu, J.; Saul, D.; Böker, K.O.; Ernst, J.; Lehman, W.; Schilling, A.F. Current Methods for Skeletal Muscle Tissue Repair and Regeneration. BioMed Res. Int. 2018, 2018, 1984879. [Google Scholar] [CrossRef]
- Pollot, B.E.; Corona, B.T. Volumetric muscle loss. Methods Mol. Biol. 2016, 1460, 19–31. [Google Scholar]
- Counsel, P.; Breidahl, W. Muscle injuries of the lower leg. Semin. Musculoskelet. Radiol. 2010, 14, 162–175. [Google Scholar] [CrossRef]
- Turner, N.J.; Badylak, S.F. Regeneration of skeletal muscle. Cell Tissue Res. 2012, 347, 759–774. [Google Scholar] [CrossRef]
- Saure, C.; Caminiti, C.; Weglinski, J.; de Castro Perez, F.; Monges, S. Energy expenditure, body composition, and prevalence of metabolic disorders in patients with Duchenne muscular dystrophy. Diabetes Metab. Syndr. 2018, 12, 81–85. [Google Scholar] [CrossRef]
- Pansarasa, O.; Rossi, D.; Berardinelli, A.; Cereda, C. Amyotrophic lateral sclerosis and skeletal muscle: An update. Mol. Neurobiol. 2014, 49, 984–990. [Google Scholar] [CrossRef]
- Jani-Acsadi, A.; Ounpuu, S.; Pierz, K.; Acsadi, G. Pediatric Charcot-Marie-Tooth Disease. Pediatr. Clin. North Am. 2015, 62, 767–786. [Google Scholar] [CrossRef]
- You, E.M.; Kornberg, A.J. Duchenne muscular dystrophy. J. Paediatr. Child Health 2015, 51, 759–764. [Google Scholar] [CrossRef]
- Kalyani, R.R.; Corriere, M.; Ferrucci, L. Age-related and disease-related muscle loss: The effect of diabetes, obesity, and other diseases. Lancet Diabetes Endocrinol. 2014, 2, 819–829. [Google Scholar] [CrossRef]
- Tuffaha, S.H.; Budihardjo, J.D.; Sarhane, K.A.; Khusheim, M.; Song, D.; Broyles, J.M.; Salvatori, R.; Means, K.R., Jr.; Higgins, J.P.; Shores, J.T.; et al. Growth hormone therapy accelerates axonal regeneration, promotes motor reinnervation, and reduces muscle atrophy following peripheral nerve injury. Plast. Reconstr. Surg. 2016, 137, 1771–1780. [Google Scholar] [CrossRef]
- Pannérec, A.; Marazzi, G.; Sassoon, D. Stem cells in the hood: The skeletal muscle niche. Trends Mol. Med. 2012, 18, 599–606. [Google Scholar] [CrossRef]
- Trappmann, B.; Gautrot, J.E.; Connelly, J.T.; Strange, D.G.T.; Li, Y.; Oyen, M.L.; Cohen Stuart, M.A.; Boehm, H.; Li, B.; Vogel, V.; et al. Extracellular-matrix tethering regulates stem-cell fate. Nat. Mater. 2012, 11, 642–649. [Google Scholar] [CrossRef]
- Ten Broek, R.W.; Grefte, S.; Von Den Hoff, J.W. Regulatory factors and cell populations involved in skeletal muscle regeneration. J. Cell. Physiol. 2010, 224, 7–16. [Google Scholar] [CrossRef]
- Gordon, B.S.; Kelleher, A.R.; Kimball, S.R. Regulation of muscle protein synthesis and the effects of catabolic states. Int. J. Biochem. Cell Biol. 2013, 45, 2147–2157. [Google Scholar] [CrossRef]
- Schiaffino, S.; Dyar, K.A.; Ciciliot, S.; Blaauw, B.; Sandri, M. Mechanisms regulating skeletal muscle growth and atrophy. FEBS J. 2013, 280, 4294–4314. [Google Scholar] [CrossRef] [PubMed]
- Wu, P.; Chawla, A.; Spinner, R.J.; Yu, C.; Yaszemski, M.J.; Windebank, A.J.; Wang, H. Key changes in denervated muscles and their impact on regeneration and reinnervation. Neural Regen. Res. 2014, 9, 1796–1809. [Google Scholar] [PubMed]
- Mertens, J.P.; Sugg, K.B.; Lee, J.D.; Larkin, L.M. Engineering muscle constructs for the creation of functional engineered musculoskeletal tissue. Regen. Med. 2014, 9, 89–100. [Google Scholar] [CrossRef] [PubMed]
- Nakayama, K.H.; Shayan, M.; Huang, N.F. Engineering Biomimetic Materials for Skeletal Muscle Repair and Regeneration. Adv. Healthc. Mater. 2019, 8, 1801168. [Google Scholar] [CrossRef]
- Cezar, C.A.; Mooney, D.J. Biomaterial-based delivery for skeletal muscle repair. Adv. Drug Deliv. Rev. 2015, 84, 188–197. [Google Scholar] [CrossRef] [PubMed]
- Judson, R.N.; Rossi, F.M.V. Towards stem cell therapies for skeletal muscle repair. NPJ Regen. Med. 2020, 5, 10. [Google Scholar] [CrossRef] [PubMed]
- Smith, A.S.T.; Passey, S.; Greensmith, L.; Mudera, V.; Lewis, M.P. Characterization and optimization of a simple, repeatable system for the long term in vitro culture of aligned myotubes in 3D. J. Cell. Biochem. 2012, 113, 1044–1053. [Google Scholar] [CrossRef]
- Ma, J.; Holden, K.; Zhu, J.; Pan, H.; Li, Y. The Application of Three-Dimensional Collagen-Scaffolds Seeded with Myoblasts to Repair Skeletal Muscle Defects. J. Biomed. Biotechnol. 2011, 2011, 812135. [Google Scholar] [CrossRef]
- Glowacki, J.; Mizuno, S. Collagen scaffolds for tissue engineering. Biopolymers 2008, 89, 338–344. [Google Scholar] [CrossRef]
- Matsumoto, T.; Sasaki, J.-I.; Alsberg, E.; Egusa, H.; Yatani, H.; Sohmura, T. Three-Dimensional Cell and Tissue Patterning in a Strained Fibrin Gel System. PLoS ONE 2007, 2, e1211. [Google Scholar] [CrossRef]
- Hosseini, V.; Ahadian, S.; Ostrovidov, S.; Camci-Unal, G.; Chen, S.; Kaji, H.; Ramalingam, M.; Khademhosseini, A. Engineered contractile skeletal muscle tissue on a microgrooved methacrylated gelatin substrate. Tissue Eng. Part A 2012, 18, 2453–2465. [Google Scholar] [CrossRef]
- Passipieri, J.A.; Baker, H.B.; Siriwardane, M.; Ellenburg, M.D.; Vadhavkar, M.; Saul, J.M.; Tomblyn, S.; Burnett, L.; Christ, G.J. Keratin Hydrogel Enhances In Vivo Skeletal Muscle Function in a Rat Model of Volumetric Muscle Loss. Tissue Eng. Part A 2017, 23, 556–571. [Google Scholar] [CrossRef]
- Highley, C.B.; Prestwich, G.D.; Burdick, J.A. Recent advances in hyaluronic acid hydrogels for biomedical applications. Curr. Opin. Biotechnol. 2016, 40, 35–40. [Google Scholar] [CrossRef]
- Jana, S.; Cooper, A.; Zhang, M. Chitosan scaffolds with unidirectional microtubular pores for large skeletal myotube generation. Adv. Healthc. Mater. 2013, 2, 557–561. [Google Scholar] [CrossRef]
- Chaudhuri, O.; Gu, L.; Klumpers, D.; Darnell, M.; Bencherif, S.A.; Weaver, J.C.; Huebsch, N.; Lee, H.-P.; Lippens, E.; Duda, G.N.; et al. Hydrogels with tunable stress relaxation regulate stem cell fate and activity. Nat. Mater. 2016, 15, 326–334. [Google Scholar] [CrossRef]
- Qazi, T.H.; Mooney, D.J.; Pumberger, M.; Geissler, S.; Duda, G.N. Biomaterials based strategies for skeletal muscle tissue engineering: Existing technologies and future trends. Biomaterials 2015, 53, 502–521. [Google Scholar] [CrossRef]
- Kang, M.S.; Lee, S.H.; Park, W.J.; Lee, J.E.; Kim, B.; Han, D.-W. Advanced Techniques for Skeletal Muscle Tissue Engineering and Regeneration. Bioengineering 2020, 7, 99. [Google Scholar] [CrossRef]
- Ramos, T.; Moroni, L. Tissue Engineering and Regenerative Medicine 2019: The Role of Biofabrication—A Year in Review. Tissue Eng. Part C Methods 2020, 26, 91–106. [Google Scholar] [CrossRef]
- Corona, B.T.; Ward, C.L.; Baker, H.B.; Walters, T.J.; Christ, G.J. Implantation of in vitro tissue engineered muscle repair constructs and bladder acellular matrices partially restore in vivo skeletal muscle function in a rat model of volumetric muscle loss injury. Tissue Eng. Part A 2014, 20, 705–715. [Google Scholar]
- Sicari, B.M.; Rubin, J.P.; Dearth, C.L.; Wolf, M.T.; Ambrosio, F.; Boninger, M.; Turner, N.J.; Weber, D.J.; Simpson, T.W.; Wyse, A.; et al. An acellular biologic scaffold promotes skeletal muscle formation in mice and humans with volumetric muscle loss. Sci. Transl. Med. 2014, 6, 234ra58. [Google Scholar] [CrossRef]
- Ku, S.H.; Lee, S.H.; Park, C.B. Synergic effects of nanofiber alignment and electroactivity on myoblast differentiation. Biomaterials 2012, 33, 6098–6104. [Google Scholar] [CrossRef]
- Maleiner, B.; Tomasch, J.; Heher, P.; Spadiut, O.; Rünzler, D.; Fuchs, C. The Importance of Biophysical and Biochemical Stimuli in Dynamic Skeletal Muscle Models. Front. Physiol. 2018, 9, 1130. [Google Scholar] [CrossRef]
- Borselli, C.; Storrie, H.; Benesch-Lee, F.; Shvartsman, D.; Cezar, C.; Lichtman, J.W.; Vandenburgh, H.H.; Mooney, D.J. Functional muscle regeneration with combined delivery of angiogenesis and myogenesis factors. Proc. Natl. Acad. Sci. USA 2010, 107, 3287–3292. [Google Scholar] [CrossRef]
- Mooney, D.J.; Borselli, C.; Vandenburgh, H.; Shvartsman, D.; Storrie, H.; Lichtman, J. Enhancement of Skeletal Muscle Stem Cell Engraftment by Dual Delivery of vegf and igf-1. Google Patents No. US9610328B2, 4 April 2017. [Google Scholar]
- Tajdaran, K.; Gordon, T.; Wood, M.D.; Shoichet, M.S.; Borschel, G.H. A glial cell line-derived neurotrophic factor delivery system enhances nerve regeneration across acellular nerve allografts. Acta Biomater. 2016, 29, 62–70. [Google Scholar] [CrossRef]
- Hernández-Hernández, J.M.; García-González, E.G.; Brun, C.E.; Rudnicki, M.A. The Myogenic Regulatory Factors, Determinants of Muscle Development, Cell Identity and Regeneration. Semin. Cell Dev. Biol. 2017, 72, 10–18. [Google Scholar] [CrossRef]
- Shvartsman, D.; Storrie-White, H.; Lee, K.; Kearney, C.; Brudno, Y.; Ho, N.; Cezar, C.; McCann, C.; Anderson, E.; Koullias, J.; et al. Sustained Delivery of VEGF Maintains Innervation and Promotes Reperfusion in Ischemic Skeletal Muscles Via NGF/GDNF Signaling. Mol. Ther. 2014, 22, 1243–1253. [Google Scholar] [CrossRef]
- Buchtova, M.; Chaloupkova, R.; Zakrzewska, M.; Vesela, I.; Cela, P.; Barathova, J.; Gudernova, I.; Zajickova, R.; Trantirek, L.; Martin, J.; et al. Instability Restricts Signaling of Multiple Fibroblast Growth Factors. Cell. Mol. Life Sci. 2015, 72, 2445–2459. [Google Scholar] [CrossRef]
- Pawlikowski, B.; Vogler, T.O.; Gadek, K.; Olwin, B.B. Regulation of skeletal muscle stem cells by fibroblast growth factors. Dev. Dyn. 2017, 246, 359–367. [Google Scholar] [CrossRef]
- Hill, E.; Boontheekul, T.; Mooney, D.J. Designing scaffolds to enhance transplanted myoblast survival and migration. Tissue Eng. 2006, 12, 1295–1304. [Google Scholar] [CrossRef]
- Ruvinov, E.; Leor, J.; Cohen, S. The effects of controlled HGF delivery from an affinity-binding alginate biomaterial on angiogenesis and blood perfusion in a hindlimb ischemia model. Biomaterials 2010, 31, 4573–4582. [Google Scholar] [CrossRef]
- Kuraitis, D.; Zhang, P.; Zhang, Y.; Padavan, D.; McEwan, K.; Sofrenovic, T.; McKee, D.; Zhang, J.; Griffith, M.; Cao, X.; et al. A stromal cell-derived factor-1 releasing matrix enhances the progenitor cell response and blood vessel growth in ischaemic skeletal muscle. Eur. Cells Mater. 2011, 22, 109–123. [Google Scholar] [CrossRef] [PubMed]
- Rybalko, V.Y.; Pham, C.B.; Hsieh, P.-L.; Hammers, D.W.; Merscham-Banda, M.; Suggs, L.J.; Farrar, R.P. Controlled delivery of SDF-1α and IGF-1: CXCR4(+) cell recruitment and functional skeletal muscle recovery. Biomater. Sci. 2015, 3, 1475–1486. [Google Scholar] [CrossRef] [PubMed]
- Martins, K.J.; Gehrig, S.M.; Naim, T.; Saenger, S.; Baum, D.; Metzger, F.; Lynch, G.S. Intramuscular administration of PEGylated IGF-I improves skeletal muscle regeneration after myotoxic injury. Growth Horm. IGF Res. 2013, 23, 128–133. [Google Scholar] [CrossRef] [PubMed]
- Hosoyama, K.; Lazurko, C.; Muñoz, M.; McTiernan, C.D.; Alarcon, E.I. Peptide-Based Functional Biomaterials for Soft-Tissue Repair. Front. Bioeng. Biotechnol. 2019, 7, 205. [Google Scholar] [CrossRef]
- Arnaout, M.A.; Mahalingam, B.; Xiong, J.-P. Integrin structure, allostery, and bidirectional signaling. Annu. Rev. Cell Dev. Biol. 2005, 21, 381–410. [Google Scholar] [CrossRef]
- Bellis, S.L. Advantages of RGD peptides for directing cell association with biomaterials. Biomaterials 2011, 32, 4205–4210. [Google Scholar] [CrossRef]
- Alipour, M.; Baneshi, M.; Hosseinkhani, S.; Mahmoudi, R.; Arabzadeh, A.J.; Akrami, M.; Mehrzad, J.; Bardania, H. Recent progress in biomedical applications of RGD-based ligand: From precise cancer theranostics to biomaterial engineering: A systematic review. J. Biomed. Mater. Res. A 2020, 108, 839–850. [Google Scholar] [CrossRef]
- Sevostianova, V.V.; Antonova, L.V.; Mironov, A.V.; Yuzhalin, A.E.; Silnikov, V.N.; Glushkova, T.V.; Godovikova, T.S.; Krivkina, E.O.; Bolbasov, E.; Akentyeva, T.N.; et al. Biodegradable Patches for Arterial Reconstruction Modified with RGD Peptides: Results of an Experimental Study. ACS Omega 2020, 5, 21700–21711. [Google Scholar] [CrossRef]
- Gribova, V.; Gauthier-Rouvière, C.; Albigès-Rizo, C.; Auzely-Velty, R.; Picart, C. Effect of RGD functionalization and stiffness modulation of polyelectrolyte multilayer films on muscle cell differentiation. Acta Biomater. 2013, 9, 6468–6480. [Google Scholar] [CrossRef]
- Garcia, J.M.S.; Panitch, A.; Calve, S. Functionalization of hyaluronic acid hydrogels with ECM-derived peptides to control myoblast behavior. Acta Biomater. 2019, 84, 169–179. [Google Scholar] [CrossRef]
- Lecarpentier, Y.; Kindler, V.; Bochaton-Piallat, M.-L.; Sakic, A.; Claes, V.; Hébert, J.-L.; Vallée, A.; Schussler, O. Tripeptide Arg-Gly-Asp (RGD) modifies the molecular mechanical properties of the nonmuscle myosin IIA in human bone marrow-derived myofibroblasts seeded in a collagen scaffold. PLoS ONE 2019, 14, e0222683. [Google Scholar] [CrossRef]
- Yasa, I.C.; Gunduz, N.; Kilinc, M.; Guler, M.O.; Tekinay, A.B. Basal Lamina Mimetic Nanofibrous Peptide Networks for Skeletal Myogenesis. Sci. Rep. 2015, 5, 16460. [Google Scholar] [CrossRef]
- Lambert, J.N.; Mitchell, J.P.; Roberts, K.D. The synthesis of cyclic peptides. J. Chem. Soc. Perkin Trans. 2001, 471–484. [Google Scholar] [CrossRef]
- Kolesinska, B.; Rozniakowski, K.K.; Fraczyk, J.; Relich, I.; Papini, A.M.; Kaminski, Z.J. The Effect of Counterion and Tertiary Amine on the Efficiency of N-Triazinylammonium Sulfonates in Solution and Solid-Phase Peptide Synthesis. Eur. J. Org. Chem. 2015, 2015, 401–408. [Google Scholar] [CrossRef]
- Wasko, J.; Fraczyk, J.; Becht, A.; Kaminski, Z.J.; Flinčec Grgac, S.; Tarbuk, A.; Kaminska, M.; Dudek, M.; Gliscinska, E.; Draczynski, Z.; et al. Conjugates of Chitosan and Calcium Alginate with Oligoproline and Oligohydroxyproline Derivatives for Potential Use in Regenerative Medicine. Materials 2020, 13, 3079. [Google Scholar] [CrossRef]
- Boguń, M.; Szparaga, G.; Król, P.; Mikołajczyk, T.; Rabiej, S. Calcium alginate fibers containing metallic nanoadditives. J. Appl. Polym. Sci. 2014, 131, 40223. [Google Scholar] [CrossRef]
- Wawro, D.; Pighinelli, L. Chitosan fibers modified with HAp/[beta]-TCP nanoparticles. Int. J. Mol. Sci. 2011, 12, 7286–7300. [Google Scholar] [CrossRef]
- Draczyński, Z.; Boguń, M.; Mikołajczyk, T.; Szparaga, G.; Król, P. The influence of forming conditions on the properties of the fibers made of chitin butyryl-acetic copolyester for medical applications. J. Appl. Polym. Sci. 2013, 127, 3569–3577. [Google Scholar] [CrossRef]
- Draczynski, Z.; Boguń, M.; Sujka, W.; Kolesińska, B. An industrial-scale synthesis of biodegradable soluble in organic solvents butyric-acetic chitin copolyesters. Adv. Polym. Technol. 2018, 37, 3210–3221. [Google Scholar] [CrossRef]
- Draczynski, Z.; Kolesinska, B.; Latanska, I.; Sujka, W. Preparation Method of Porous Dressing Materials Based on Butyric-Acetic Chitin Co-Polyesters. Materials 2018, 11, 2359. [Google Scholar] [CrossRef]
- Rokicki, D.; Zdanowski, R.; Lewicki, S.; Leśniak, M.; Suska, M.; Wojdat, E.; Skopińska-Różewska, E.; Skopiński, P. Inhibition of proliferation, migration and invasiveness of endothelial murine cells culture induced by resveratrol. Cent. Eur. J. Immunol. 2014, 39, 449–454. [Google Scholar] [CrossRef]
- Leśniak, M.; Zdanowski, R.; Suska, M.; Brewczyńska, A.; Stankiewicz, W.; Kloc, M.; Kubiak, J.Z.; Lewicki, S. Effects of hexachlorophene, a chemical accumulating in adipose tissue, on mouse and human mesenchymal stem cells. Tissue Eng. Regen. Med. 2018, 15, 211–222. [Google Scholar] [CrossRef]
- Złotek, U.; Jakubczyk, A.; Rybczyńska-Tkaczyk, K.; Ćwiek, P.; Baraniak, B.; Lewicki, S. Characteristics of new peptides GQLGEHGGAGMG, GEHGGAGMGGGQFQPV, EQGFLPGPEESGR, RLARAGLAQ, YGNPVGGVGH, and GNPVGGVGHGTTGT as inhibitors of enzymes involved in metabolic syndrome and antimicrobial potential. Molecules 2020, 25, 2492. [Google Scholar] [CrossRef] [PubMed]
- Scholzen, T.; Gerdes, J. The Ki-67 protein: From the known and the unknown. J. Cell. Physiol. 2000, 182, 311–322. [Google Scholar] [CrossRef]
- Bruno, S.; Darzynkiewicz, Z. Cell cycle dependent expression and stability of the nuclear protein detected by Ki-67 antibody in HL-60 cells. Cell Prolif. 1992, 25, 31–40. [Google Scholar] [CrossRef]
- Darzynkiewicz, Z.; Zhao, H.; Zhang, S.; Lee, M.Y.; Lee, E.Y.; Zhang, Z. Initiation and termination of DNA replication during S phase in relation to cyclins D1, E and A, p21WAF1, Cdt1 and the p12 subunit of DNA polymerase δ revealed in individual cells by cytometry. Oncotarget 2015, 6, 11735–11750. [Google Scholar] [CrossRef]
- Ruoslahti, E. RGD and other recognition sequences for integrins. Annu. Rev. Cell Dev. Biol. 1996, 12, 697–715. [Google Scholar] [CrossRef]
- Karaś, M.; Jakubczyk, A.; Szymanowska, U.; Jęderka, K.; Lewicki, S.; Złotek, U. Different Temperature Treatments of Millet Grains Affect the Biological Activity of Protein Hydrolyzates and Peptide Fractions. Nutrients 2019, 11, 550. [Google Scholar] [CrossRef]
- Hersel, U.; Dahmen, C.; Kessler, H. RGD modified polymers: Biomaterials for stimulated cell adhesion and beyond. Biomaterials 2003, 24, 4385–4415. [Google Scholar] [CrossRef]
- Cipriani, F.; Bernhagen, D.; García-Arévalo, C.; de Torre, I.G.; Timmerman, P.; Rodríguez-Cabello, J.C. Bicyclic RGD peptides with high integrin αvβ3 and α5β1 affinity promote cell adhesion on elastin-like recombinamers. Biomed. Mater. 2019, 14, 035009. [Google Scholar] [CrossRef] [PubMed]
- Ortega-Velázquez, R.; Díez-Marqués, M.L.; Ruiz-Torres, M.P.; González-Rubio, M.; Rodríguez-Puyol, M.; Rodríguez Puyol, D. Arg-Gly-Asp-Ser peptide stimulates transforming growth factor-β1 transcription and secretion through integrin activation. FASEB J. 2003, 17, 1529–1531. [Google Scholar] [CrossRef]
- Kanemoto, T.; Martin, G.R.; Hamilton, T.C.; Fridman, R. Effects of synthetic peptides and protease inhibitors on the interaction of a human ovarian carcinoma cell line (NIH:OVCAR-3) with a reconstituted basement membrane (Matrigel). Invasion Metastasis 1991, 11, 84–92. [Google Scholar] [PubMed]
- Senger, D.R.; Perruzzi, C.A. Cell migration promoted by a potent GRGDS-containing thrombin-cleavage fragment of osteopontin. Biochim. Biophys. Acta 1996, 1314, 13–24. [Google Scholar] [CrossRef]
- Stickel, S.K.; Wang, Y.L. Synthetic peptide GRGDS induces dissociation of alpha-actinin and vinculin from the sites of focal contacts. J. Cell Biol. 1988, 107, 1231–1237. [Google Scholar] [CrossRef]
- Prante, O.; Einsiedel, J.; Haubner, R.; Gmeiner, P.; Wester, H.J.; Kuwert, T.; Maschauer, S. 3,4,6-Tri-O-acetyl-2-deoxy-2-[18F]fluoroglucopyranosyl phenylthiosulfonate: A thiolreactive agent for the chemoselective 18F-glycosylation of peptides. Bioconjugate Chem. 2007, 18, 254–262. [Google Scholar] [CrossRef]
- Augst, A.D.; Kong, H.J.; Mooney, D.J. Alginate hydrogels as biomaterials. Macromol. Biosci. 2006, 6, 623–633. [Google Scholar] [CrossRef]
- Szekalska, M.; Puciłowska, A.; Szymańska, E.; Ciosek, P.; Winnicka, K. Alginate: Current Use and Future Perspectives in Pharmaceutical and Biomedical Applications. Int. J. Polym. Sci. 2016, 2016, 7697031. [Google Scholar] [CrossRef]
- Fraczyk, J.; Wasko, J.; Walczak, M.; Kaminski, Z.J.; Puchowicz, D.; Kaminska, I.; Bogun, M.; Kolasa, M.; Stodolak-Zych, E.; Scislowska-Czarnecka, A.; et al. Conjugates of Copper Alginate with Arginine-Glycine-Aspartic Acid (RGD) for Potential Use in Regenerative Medicine. Materials 2020, 13, 337. [Google Scholar] [CrossRef]
- Paul, P.; Kolesinska, B.; Sujka, W. Chitosan and Its Derivatives—Biomaterials with Diverse Biological Activity for Manifold Applications. Mini Rev. Med. Chem. 2019, 19, 737–750. [Google Scholar] [CrossRef]
- Sujka, W.; Draczynski, Z.; Kolesinska, B.; Latanska, I.; Jastrzebski, Z.; Rybak, Z.; Zywicka, B. Influence of Porous Dressings Based on Butyric-Acetic Chitin Co-Polymer on Biological Processes In Vitro and In Vivo. Materials 2019, 12, 970. [Google Scholar] [CrossRef]
- Latańska, I.; Kozera-Żywczyk, A.; Paluchowska, E.B.; Owczarek, W.; Kaszuba, A.; Noweta, M.; Tazbir, J.; Kolesińska, B.; Draczyński, Z.; Sujka, W. Characteristic Features of Wound Dressings Based on Butyric-Acetic Chitin Copolyesters—Results of Clinical Trials. Materials 2019, 12, 4170. [Google Scholar] [CrossRef] [PubMed]
- Chen, S.; Gil, C.J.; Ning, L.; Jin, L.; Perez, L.; Kabboul, G.; Tomov, M.L.; Serpooshan, V. Adhesive Tissue Engineered Scaffolds: Mechanisms and Applications. Front. Bioeng. Biotechnol. 2021, 9, 683079. [Google Scholar] [CrossRef] [PubMed]
- Ali, R.; El-Boubbou, K.; Boudjelal, M. An easy, fast and inexpensive method of preparing a biological specimen for scanning electron microscopy (SEM). MethodsX 2021, 8, 101521. [Google Scholar] [CrossRef] [PubMed]
- Waters, S.L.; Schumacher, L.J.; El Haj, A.J. Regenerative medicine meets mathematical modelling: Developing symbiotic relationships. NPJ Regen. Med. 2021, 6, 24. [Google Scholar] [CrossRef]
- Möller, J.; Pörtner, R. Digital Twins for Tissue Culture Techniques-Concepts, Expectations, and State of the Art. Processes 2021, 9, 447. [Google Scholar] [CrossRef]
- Yilmaz Atay, H. Antibacterial Activity of Chitosan-Based Systems. Funct. Chitosan 2020, 6, 457–489. [Google Scholar]
- Kapp, T.G.; Rechenmacher, F.; Neubauer, S.; Maltsev, O.V.; Cavalcanti-Adam, E.A.; Zarka, R.; Reuning, U.; Notni, J.; Wester, H.-J.; Mas-Moruno, C.; et al. A Comprehensive Evaluation of the Activity and Selectivity Profile of Ligands for RGD-binding Integrins. Sci. Rep. 2017, 7, 39805. [Google Scholar] [CrossRef]
- Guerin, T.F.; Mondido, M.; McClenn, B.; Peasley, B. Application of resazurin for estimating abundance of contaminant-degrading microorganisms. Lett. Appl. Microbiol. 2001, 32, 340–345. [Google Scholar] [CrossRef]
- McClure, M.J.; Clark, N.M.; Hyzy, S.L.; Chalfant, C.E.; Olivares-Navarrete, R.; Boyan, B.D.; Schwartz, Z. Role of integrin α7β1 signaling in myoblast differentiation on aligned polydioxanone scaffolds. Acta Biomater. 2016, 39, 44–54. [Google Scholar] [CrossRef]
- McClure, M.J.; Ramey, A.N.; Rashid, M.; Boyan, B.D.; Schwartz, Z. Integrin-α7 signaling regulates connexin 43, M-cadherin, and myoblast fusion. Am. J. Physiol. Cell Physiol. 2019, 316, C876–C887. [Google Scholar] [CrossRef]


| Fiber | Length [mm] | Linear Density [dTex] | Tenacity [dTex] | Elongation at Break [%] |
|---|---|---|---|---|
| Calcium alginate | 37.1 | 2.0 | 22.47 | 10.17 |
| Chitosan | 37.1 | 2.2 | 11.93 | 6.85 |
| BAC 9:1 | 38.0 | 2.5 | 22.81 | 4.27 |
| Non-Woven | Mass Per Square Meter [g/m2] | Thickness [mm] | Tensile Strength in the Longitudinal Direction [N] | Tensile Strength in the Transverse Direction [N] | Elongation in the Longitudinal Direction [%] | Elongation in the Transverse Direction [%] |
|---|---|---|---|---|---|---|
| A based on calcium alginate | 98.8 | 1.9 | 16.72 | 25.32 | 88.90 | 47.65 |
| B based on chitosan | 116 | 2.1 | 17.23 | 26.70 | 88.39 | 47.29 |
| C containing 1:1:1 calcium alginate:chitosan:BAC 9:1 | 120 | 2.1 | 17.35 | 25.90 | 86.40 | 46.62 |
| Peptide | HPLC, Retention Time [min] | HPLC, Purity [%] | Theoretical Weight | m/z Found |
|---|---|---|---|---|
| H-RGDS-OH (1) | 2.85 | 95 | 433.19 | 434.23 |
| H-GRGDS-NH2 (2) | 2.34 | 98 | 489.23 | 490.23 |
| Cyclo(RGDfC) (3) | 3.65 | 97 | 579.22 | 578.23 |
| Tested Material | S. aureus ATCC 6538 | ||
|---|---|---|---|
| Value of Growth F (F = log CT − log C0) | Value of Growth G (G = log TT − log T0) | Value of Antibacterial Activity A (A = F − G) | |
| A1 | 0.47 | –0.31 | 0.78 |
| A2 | 0.28 | –0.18 | 0.46 |
| A3 | 0.07 | –0.04 | 0.11 |
| B1 | 2.33 | –1.53 | 3.87 |
| B2 | 1.81 | –1.19 | 3.01 |
| B3 | 1.72 | –1.13 | 2.85 |
| C1 | 1.36 | –0.90 | 2.26 |
| C2 | 1.21 | –0.80 | 2.01 |
| C3 | 1.18 | –0.78 | 1.96 |
| Tested Material | K. pneumoniae ATCC 4352 | ||
|---|---|---|---|
| Value of Growth F (F = log CT − log C0) | Value of Growth G (G = log TT − log T0) | Value of Antibacterial Activity A (A = F − G) | |
| A1 | 0.21 | −0.13 | 0.34 |
| A2 | 0.14 | −0.09 | 0.23 |
| A3 | 0.06 | −0.04 | 0.10 |
| B1 | 3.57 | −2.35 | 5.92 |
| B2 | 2.75 | −1.81 | 4.56 |
| B3 | 2.40 | −1.58 | 3.98 |
| C1 | 1.85 | −1.22 | 3.07 |
| C2 | 1.72 | −1.14 | 2.86 |
| C3 | 1.32 | −0.87 | 2.19 |
| Peptide Properties | Peptide | ||
|---|---|---|---|
| H-RGDS-OH (1) | H-GRGDS-NH2 (2) | cyclo(RGDfC) (3) | |
| Polar surface area | 270.05 | 304.94 | 283.5 |
| AlogP | −7.1896 | −8.7574 | −2.4137 |
| Hydrogen acceptor count | 10 | 10 | 9 |
| Hydrogen donor count | 10 | 11 | 10 |
Publisher’s Note: MDPI stays neutral with regard to jurisdictional claims in published maps and institutional affiliations. |
© 2022 by the authors. Licensee MDPI, Basel, Switzerland. This article is an open access article distributed under the terms and conditions of the Creative Commons Attribution (CC BY) license (https://creativecommons.org/licenses/by/4.0/).
Share and Cite
Kolasa, M.; Czerczak, K.; Fraczyk, J.; Szymanski, L.; Lewicki, S.; Bednarowicz, A.; Tarzynska, N.; Sikorski, D.; Szparaga, G.; Draczynski, Z.; et al. Evaluation of Polysaccharide–Peptide Conjugates Containing the RGD Motif for Potential Use in Muscle Tissue Regeneration. Materials 2022, 15, 6432. https://doi.org/10.3390/ma15186432
Kolasa M, Czerczak K, Fraczyk J, Szymanski L, Lewicki S, Bednarowicz A, Tarzynska N, Sikorski D, Szparaga G, Draczynski Z, et al. Evaluation of Polysaccharide–Peptide Conjugates Containing the RGD Motif for Potential Use in Muscle Tissue Regeneration. Materials. 2022; 15(18):6432. https://doi.org/10.3390/ma15186432
Chicago/Turabian StyleKolasa, Marcin, Katarzyna Czerczak, Justyna Fraczyk, Lukasz Szymanski, Slawomir Lewicki, Anna Bednarowicz, Nina Tarzynska, Dominik Sikorski, Grzegorz Szparaga, Zbigniew Draczynski, and et al. 2022. "Evaluation of Polysaccharide–Peptide Conjugates Containing the RGD Motif for Potential Use in Muscle Tissue Regeneration" Materials 15, no. 18: 6432. https://doi.org/10.3390/ma15186432
APA StyleKolasa, M., Czerczak, K., Fraczyk, J., Szymanski, L., Lewicki, S., Bednarowicz, A., Tarzynska, N., Sikorski, D., Szparaga, G., Draczynski, Z., Cierniak, S., Brzoskowska, U., Galita, G., Majsterek, I., Bociaga, D., Krol, P., & Kolesinska, B. (2022). Evaluation of Polysaccharide–Peptide Conjugates Containing the RGD Motif for Potential Use in Muscle Tissue Regeneration. Materials, 15(18), 6432. https://doi.org/10.3390/ma15186432