3.2. Dielectric Response
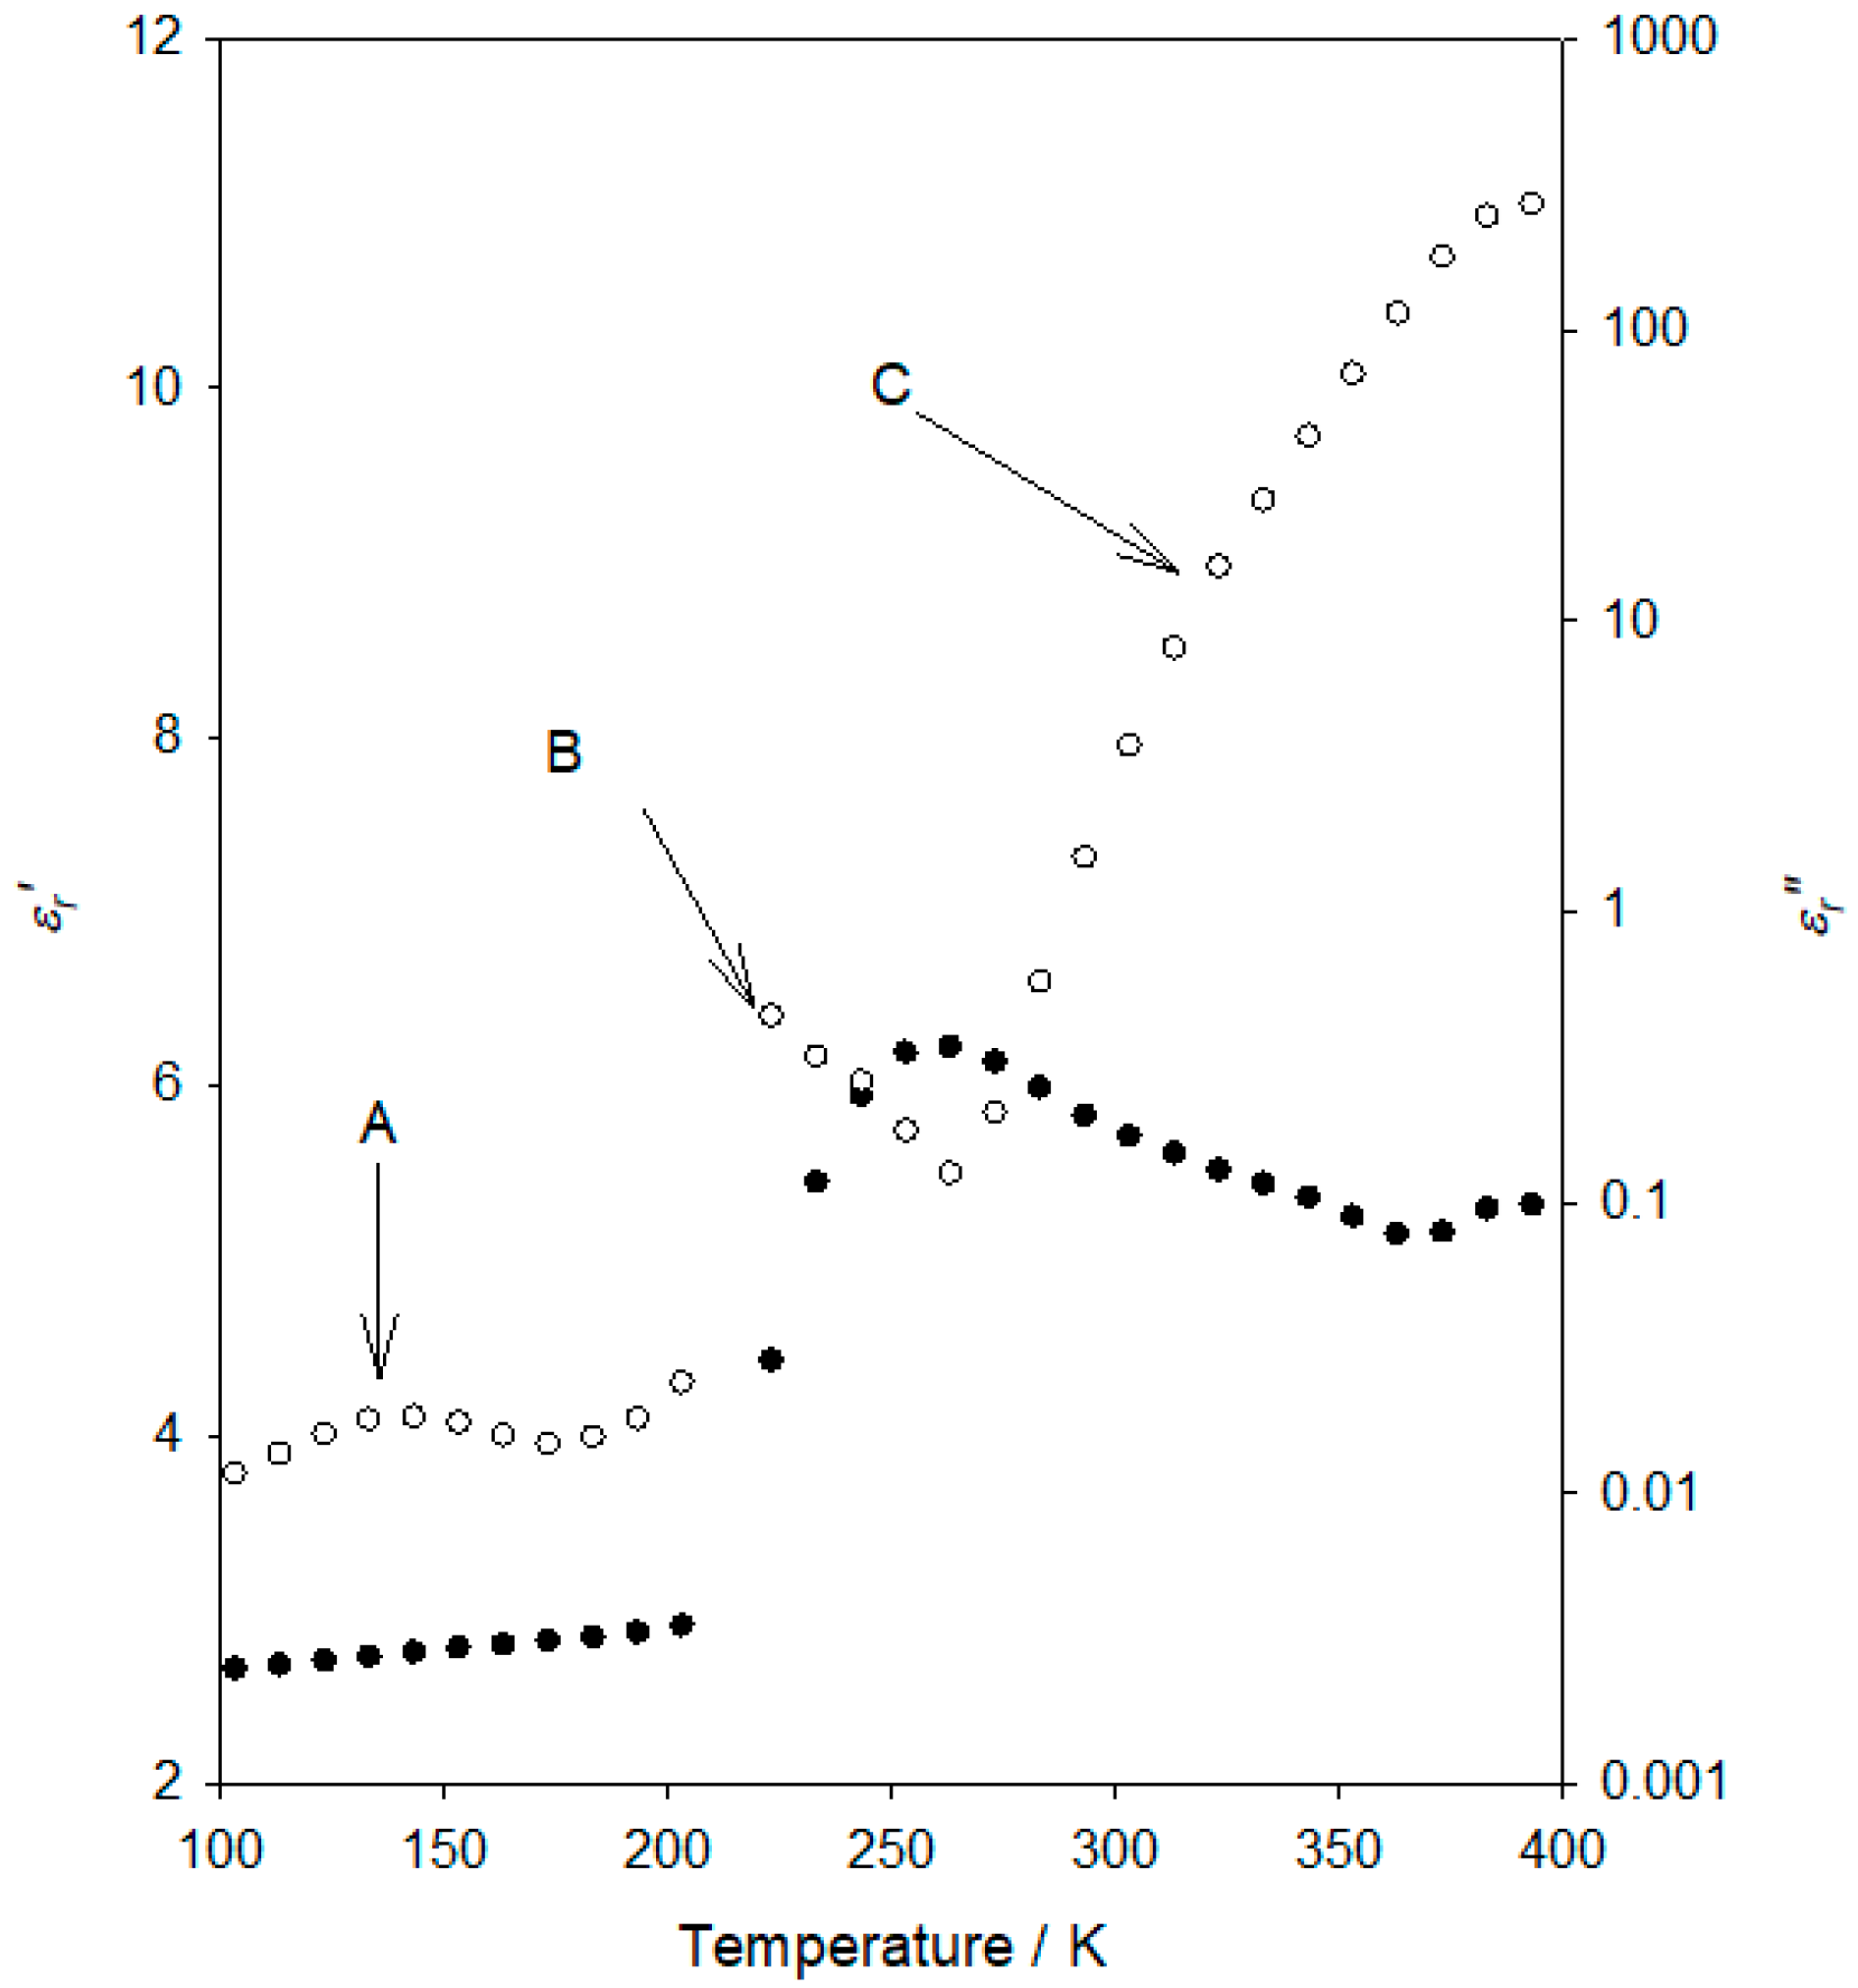
Figure 2 provides an overview of the dielectric response of our selected flexible epoxy resin formulation at an applied frequency of 10 Hz. In this figure, the variation of the real (
εr′) and imaginary (
εr″) parts of the relative permittivity is depicted against temperature.
Consider first the temperature variation of the real part of the relative permittivity shown in
Figure 2, in which a progressive increase in
εr′ is seen at low temperatures, followed by a pronounced, sharp, increase, and finally, a gradual decrease, in
εr′, as the temperature increases further. From the imaginary permittivity data, it is evident that the behaviour of the system can be considered in terms of three processes, which are arrowed and labelled “A” (~140 K), “B” (~220 K) and “C” (temperatures above ~260 K), in order of increasing temperature. Process “B” corresponds to the sharp
εr′ increase.
Before examining these processes in turn, it is worth considering the general form of these plots. Kourkoutsaki et al. [
20] described a study of polymer dynamics in rubbery epoxy networks/polyhedral oligomeric silsesquioxanes (POSS) nanocomposites that were formulated using DGEBA as the epoxy prepolymer and Jeffamine D-2000 as the hardener. As such, that study has close parallels with the investigation described here, albeit a hardener of relatively lower molecular weight, therefore of a slightly “stiffer” nature. In the case of the system containing no POSS, they reported the following four processes: three dielectric relaxation peaks in the temperature range of 140–270 K, together with higher temperature features associated with the normal mode relaxation and charge transport. In line with conventions, these workers termed the weak relaxation seen at about 140 K (10 Hz) as the γ mode, the relaxation at about 190 K as β, and the strong process at ~240 K was termed the α mode. This final attribution was consistent with a DSC-derived
Tg value. These workers also related the reduction in
εr′ above the α mode to processes that are “typically observed in amorphous polymers and glass-forming liquids at temperatures higher than
Tg”. Similar effects in
εr′, at temperatures just above the α relaxation/
Tg, have been observed elsewhere in DGEBA/ethylenediamine systems [
21] and poly(vinyl acetate) [
22] systems. In short, the dielectric data shown in
Figure 2 are broadly consistent with relevant published data.
We consequently concur with the following:
- (1)
The dielectric spectra shown in
Figure 2 are in line with comparable published work;
- (2)
The
Tg of the flexible epoxy resin featured here is around the strong process labelled “B”, about −55 °C (~220 K), which is in good agreement with studies featuring equivalent chemistries (Jeffamine D-4000) [
23,
24];
- (3)
The epoxy resin in [
20] (cured with the “stiffer” Jeffamine D-2000) shows a
Tg ~ 20 degrees higher, as well as one additional apparent relaxation peak than the epoxy in the present work.
3.3. The Lower Temperature Dielectric Relaxation (γ mode)
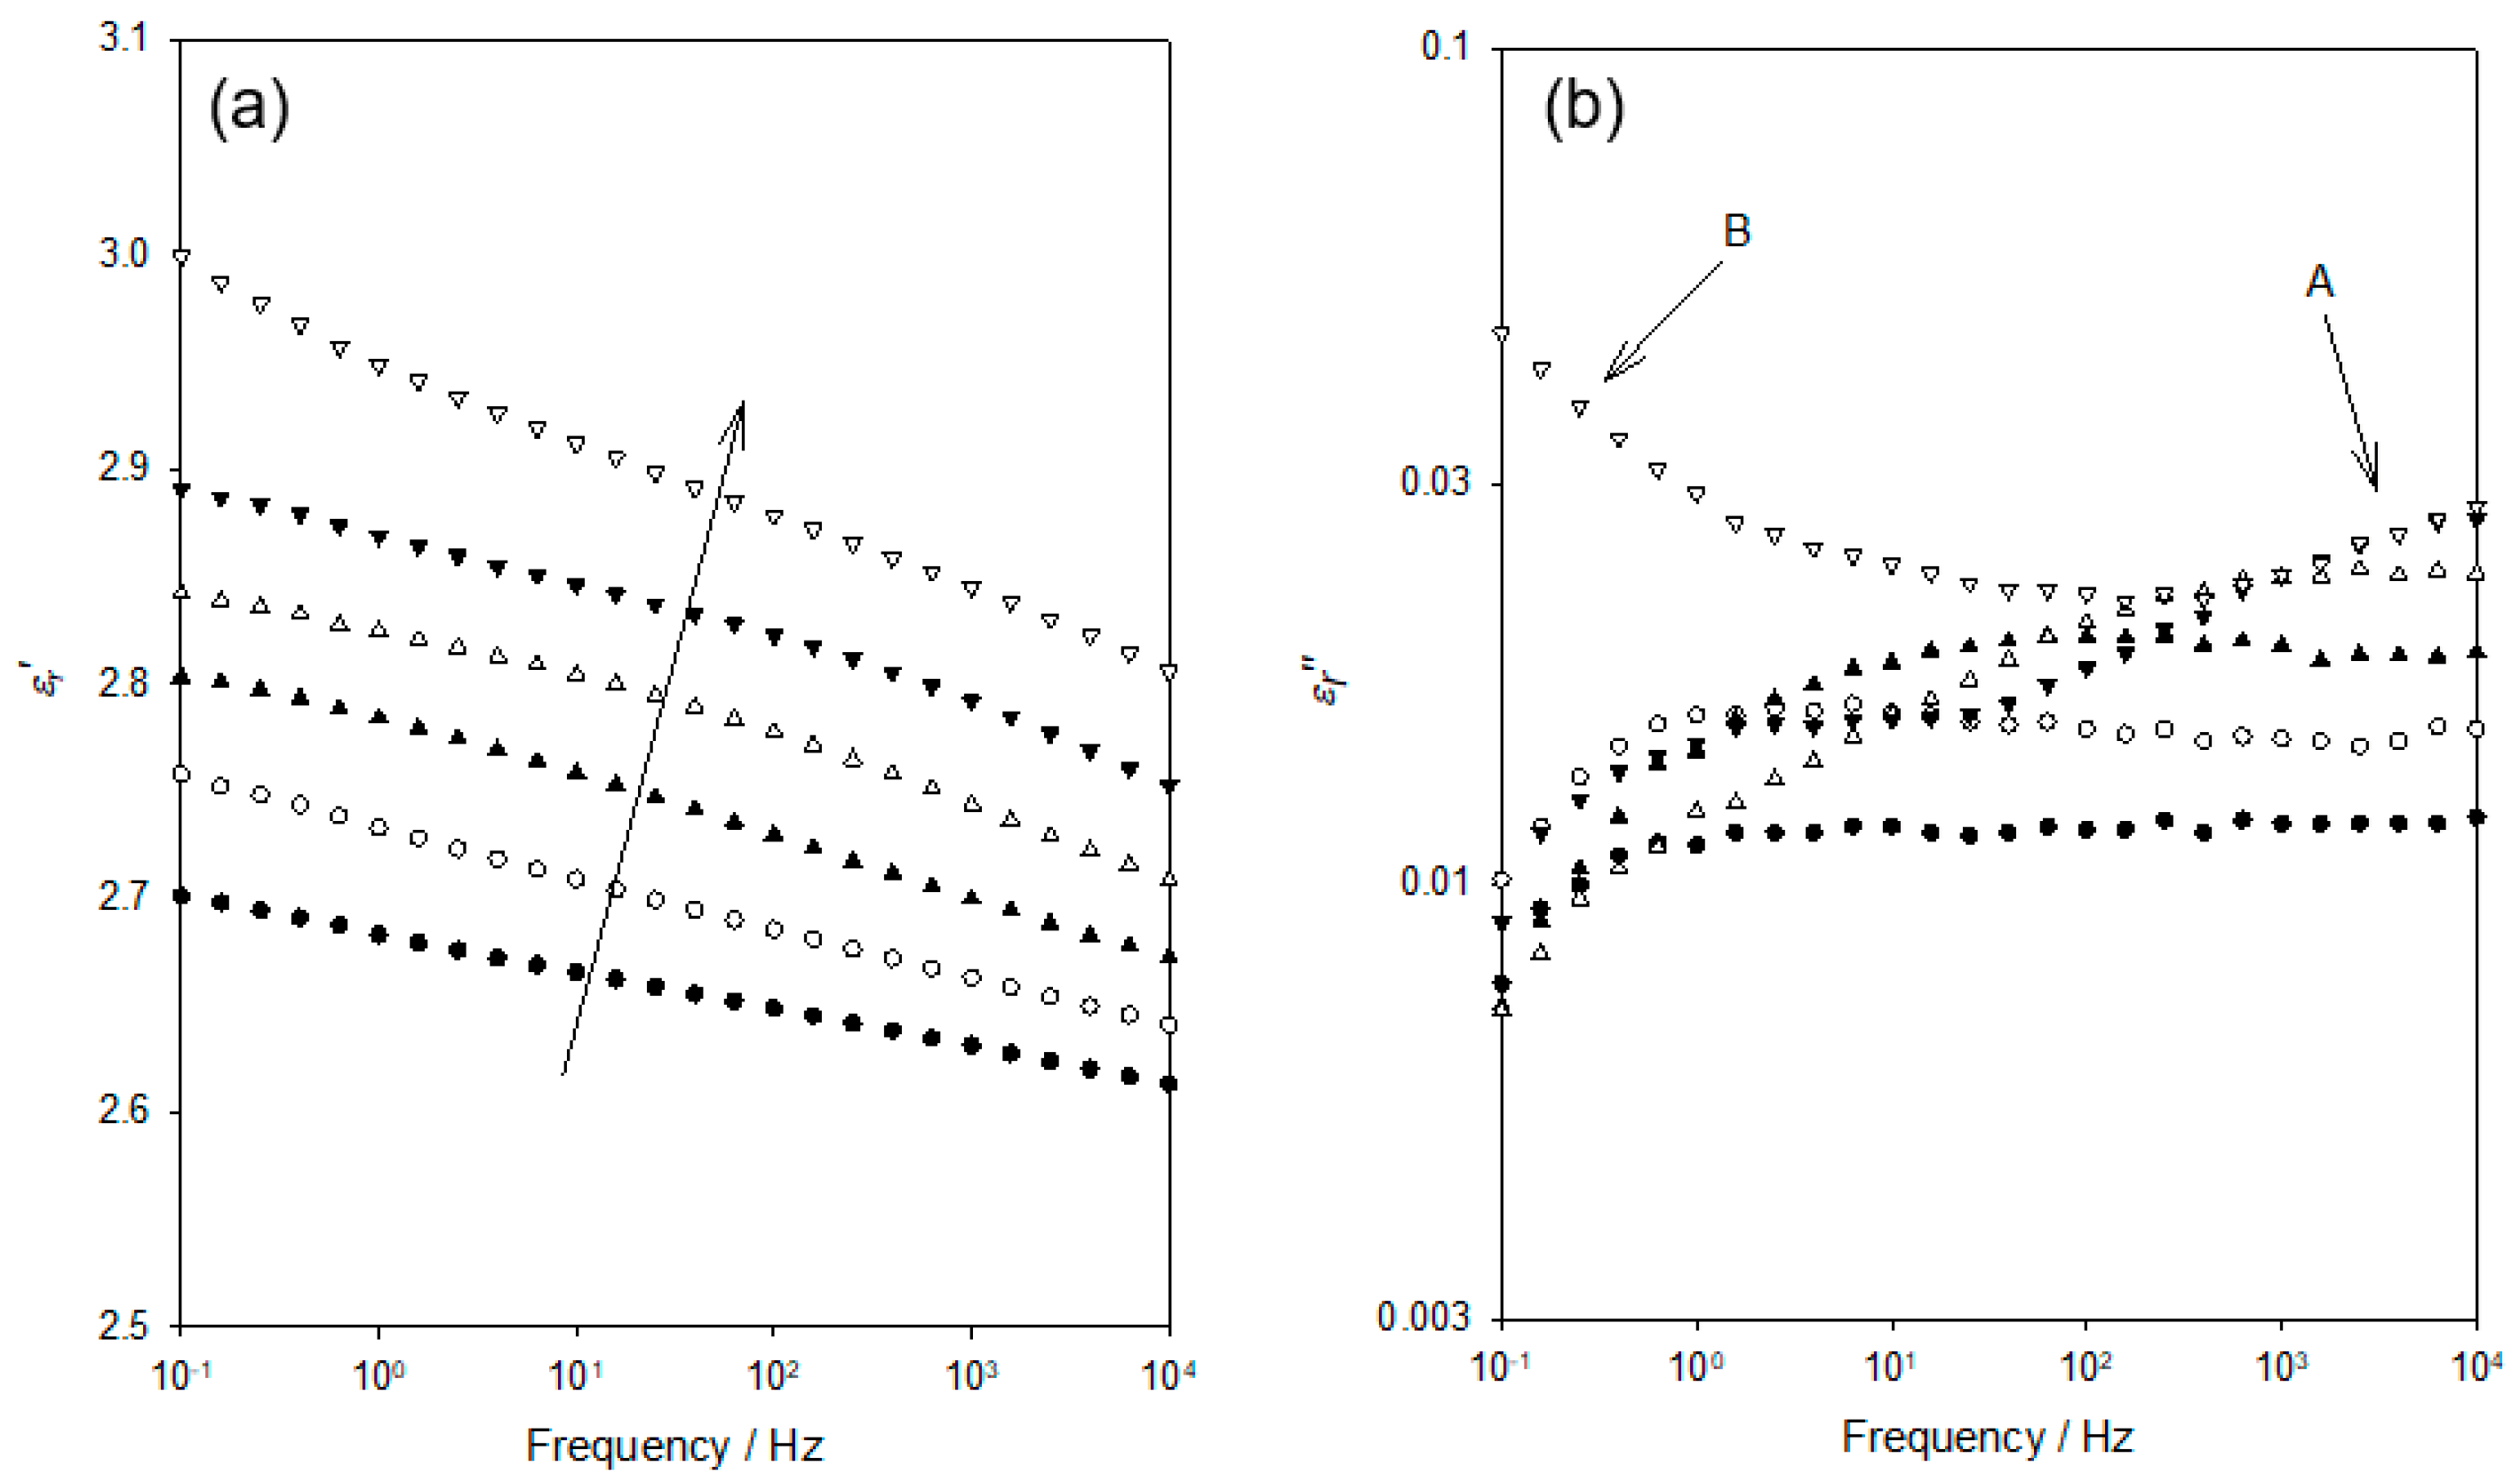
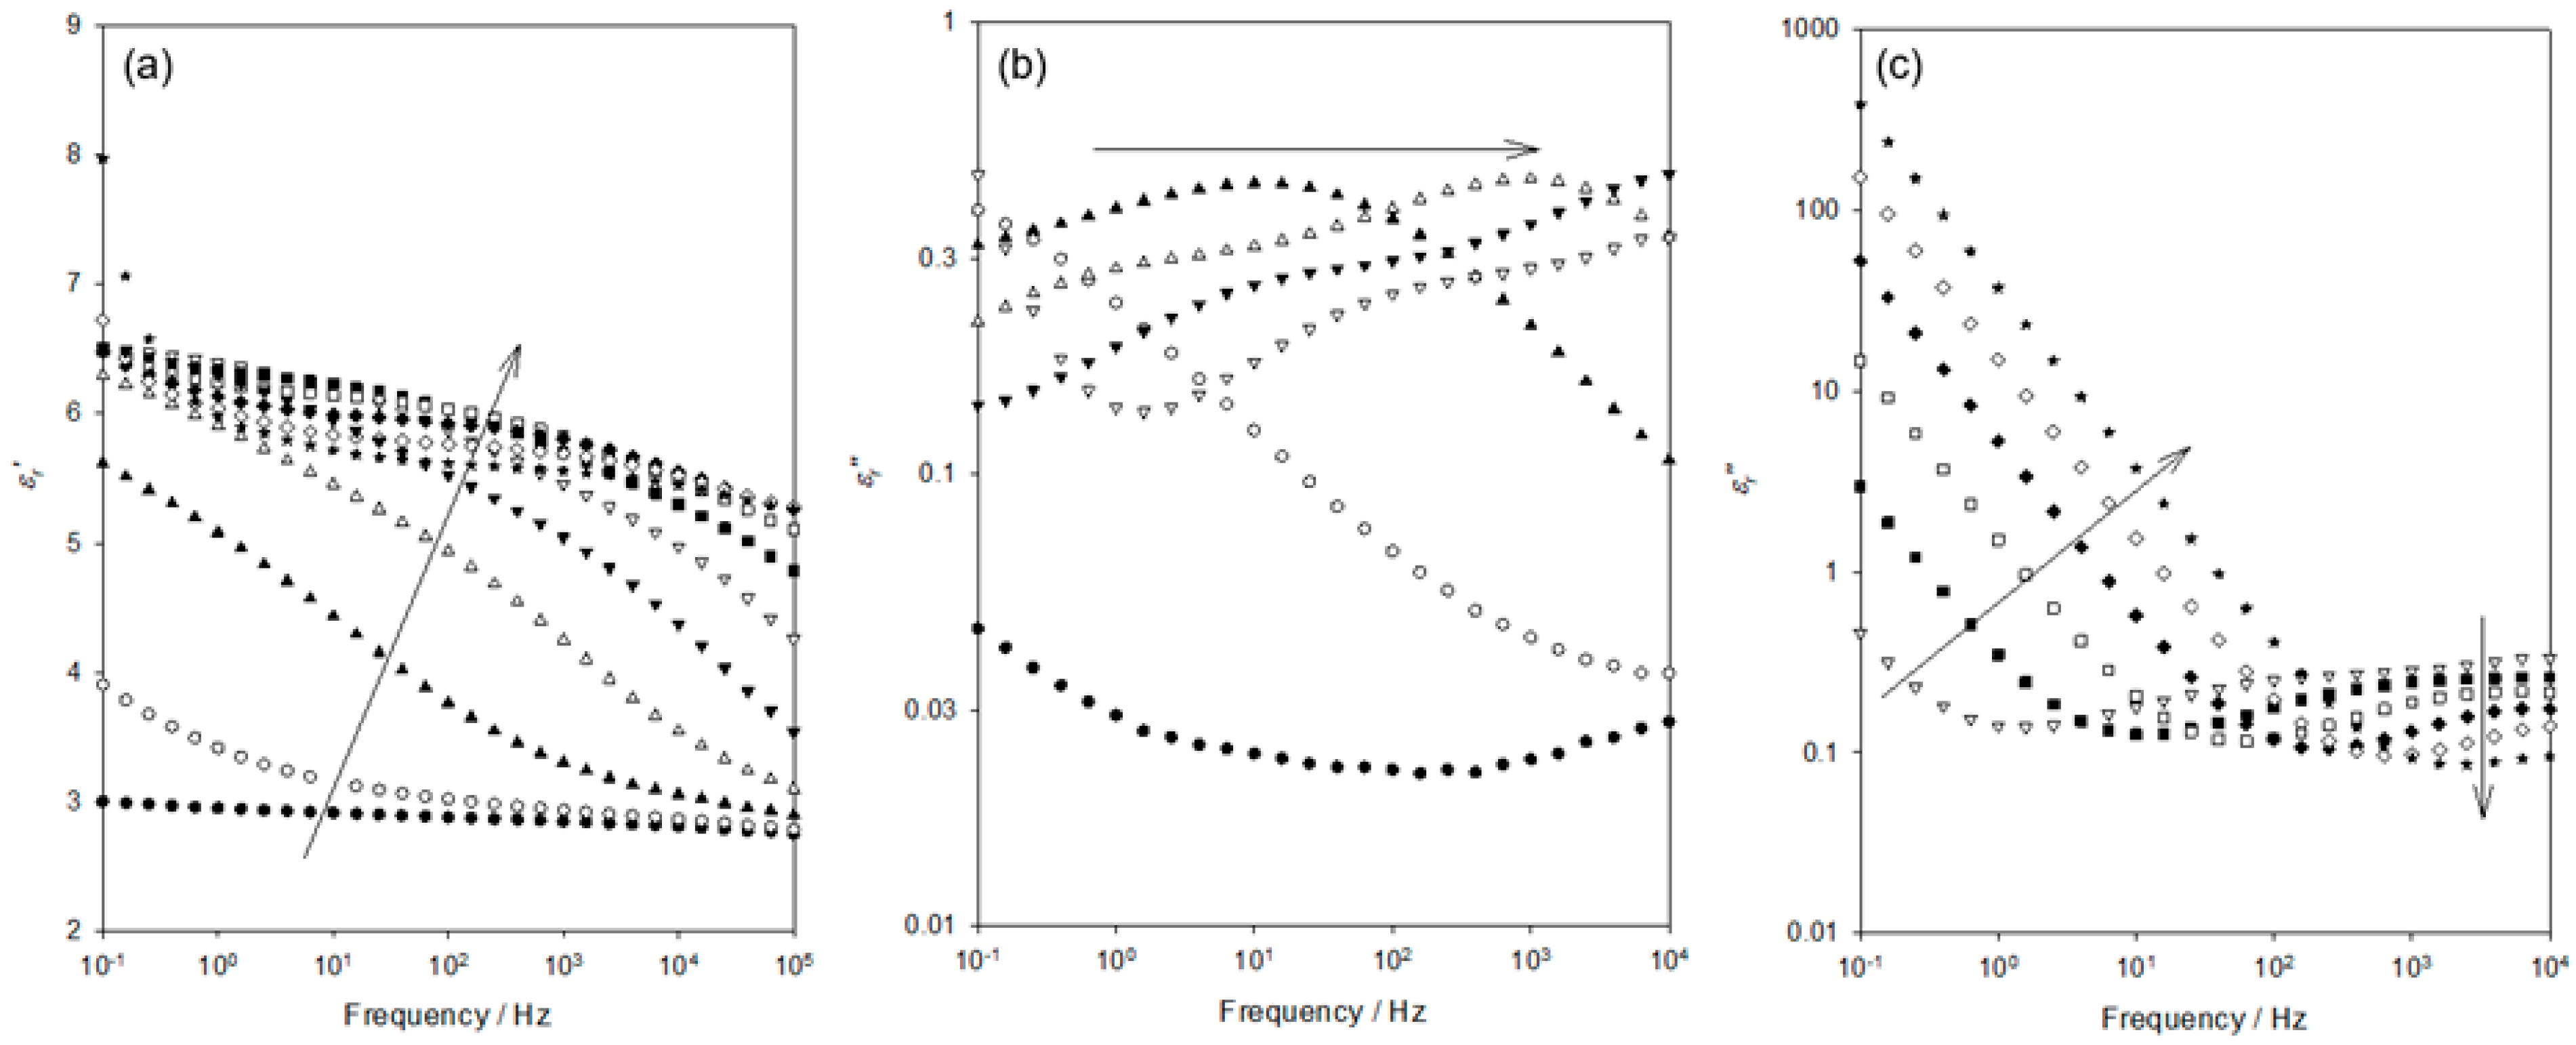
Figure 3 shows the frequency dependence of
εr′ and
εr″ within the temperature range relevant to the process labelled “A” in
Figure 2. Although data were acquired at intervals of 10 K, only six data sets are shown here, for clarity. Considering, first, the
εr′ (
Figure 3a), the data acquired at 103 K evince a progressive increase in permittivity values as the frequency is reduced and the temperature increased.
Figure 3b shows the frequency dependence of
εr″ across the same range of temperatures. At 103 K and ascending frequency, the
εr″ appears first to slightly increase (0.1–1 Hz) and then to remain constant up to a frequency of 10
4 Hz; no distinct peak is evident. While the data acquired at 123 K appear to take a comparable form, albeit with
εr″ increased significantly across the complete frequency range, examination of the numerical data reveals the presence of a very weak maximum at ~6 Hz. At higher temperatures, the associated values of
εr″ continue to increase, with the weak peak maximum occurring, for example, at ~120 Hz at 143 K. At temperatures greater than 163 K, no peak is evident, with the peak maximum seemingly lying beyond our accessible frequency range.
In view of the temperatures and frequencies involved in
Figure 3, we suggest that the dielectric processes involved align with the γ relaxation described in conventional epoxy systems. This process has previously been related to a range of different structural elements, which have been reviewed and shown, in our previous study [
25] to be related either to unreacted chain ends and/or (depending on what is applicable) main chain units, including sequences of methylene groups and polar ether linkages. In the latter work, γ
1 was related to the main chain process, γ
2 was associated with unreacted epoxide units. The characteristic frequency associated with γ
1 was shown to vary slowly with temperature, while that of γ
2 varied much more markedly. From
Figure 3b, it is evident that, in our DGEBA/D-4000 system, the form of the dielectric γ relaxation is highly temperature dependent and that the associated form of any peak is poorly defined and variable, such that a rigorous analysis using, for example, the Havriliak-Negami (HN) formalism [
26] or the time/temperature superposition principle to generate a relaxation master curve is questionable. Nevertheless, it is possible to estimate from the numerical data the frequency,
fp, corresponding to the local maximum in
εr″ in data sets covering a reasonable temperature range (113–163 K) and, as such, it is pertinent to consider the implications of this (see
Figure 4).
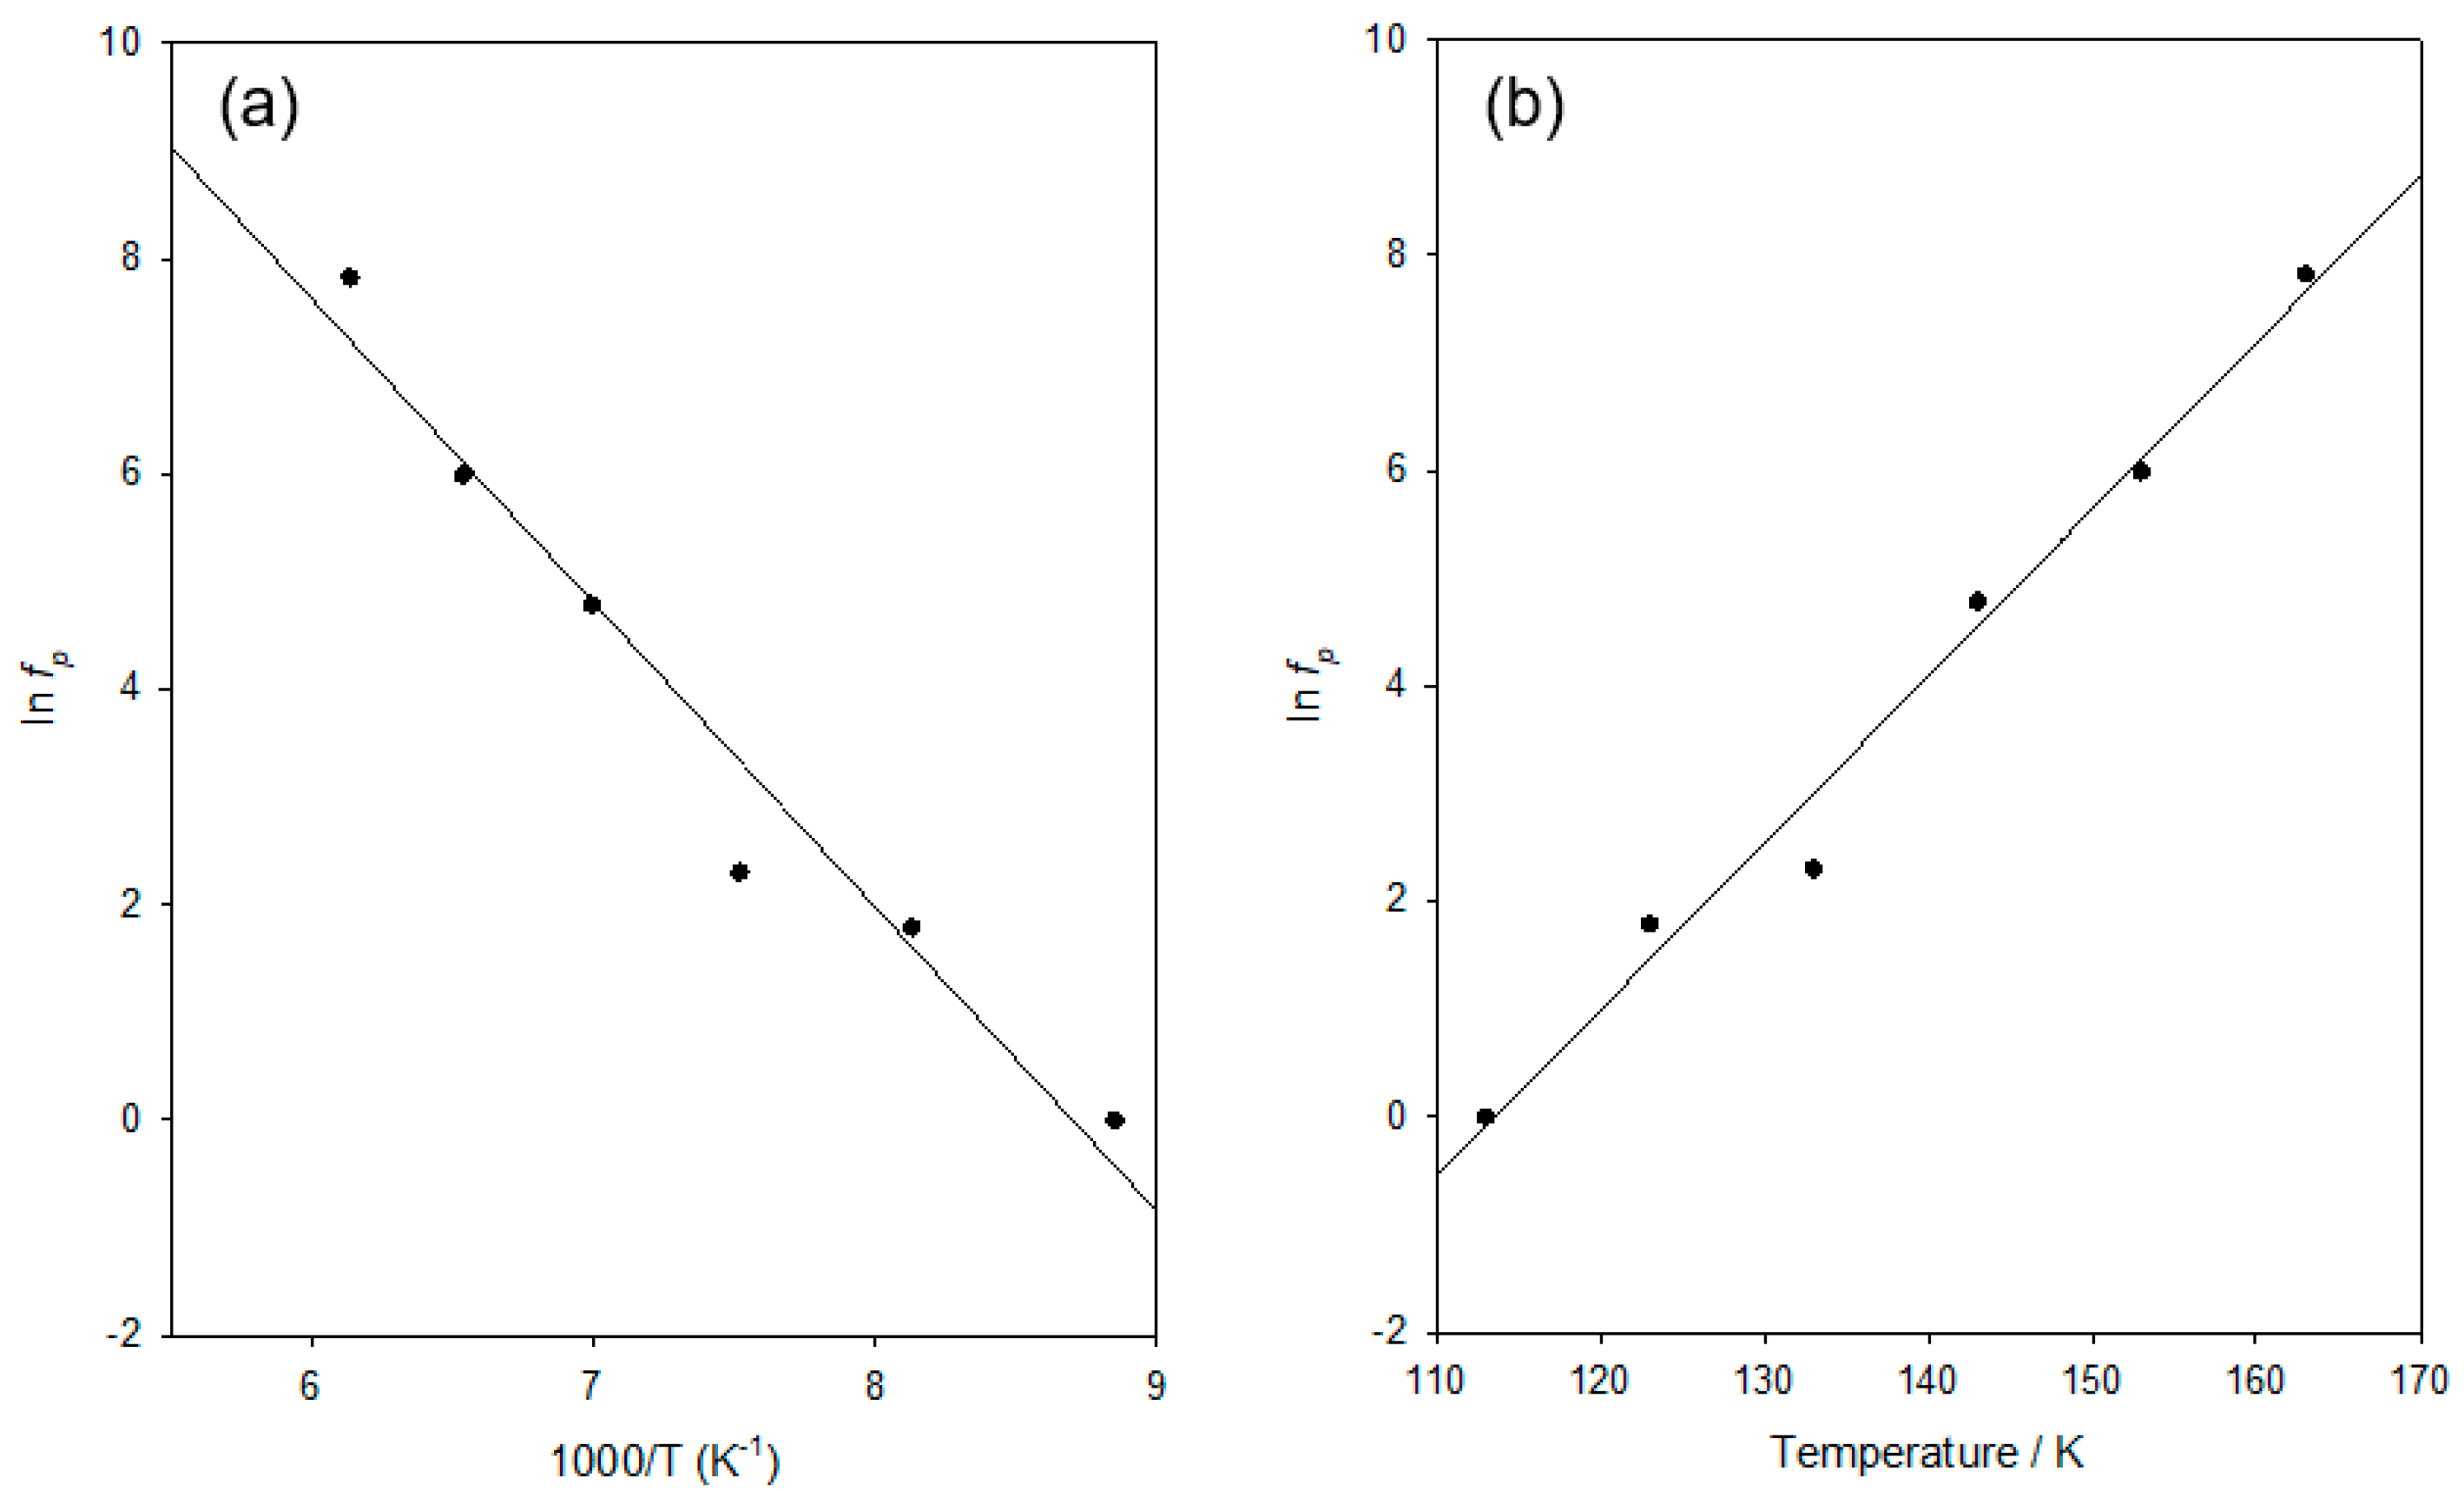
In
Figure 4a, the temperature dependence of the resulting estimated
fp values is represented in a form relevant to the Arrhenius equation, whereby ln(
fp) is plotted against 1/
T to give a linear form. That is as follows:
where
A0 is a constant with dimensions of s
−1 (i.e.,
A0 is equivalent to a frequency) and k is the Boltzmann constant. From this, it is evident that the data conform well to the Arrhenius equation (
R2 value of 0.962). However, it is evident from the residuals that these are not randomly distributed around the best fit line and, consequently, as recently described in our latest work [
27], the same data set was also analysed in terms of the activated tunnelling model of Hill and Dissado [
28]. In short, the approach considers quantum mechanical tunnelling through a potential barrier of height Δ between potential energy minima separated by a distance
d0. That is, while the Arrhenius equation considers thermal excitation over a potential energy barrier, activated tunnelling considers that the transition between states on either side of a potential energy barrier may occur by thermal excitation to a level below the top of the barrier, combined by tunnelling through the barrier. For this, the optimum relaxation rate,
fp, can be written as follows:
where
A and
ft are constants. Thus, plotting ln(
fp) against
T would lead to a linear dependence, if the theory were applicable.
Figure 4b shows such a plot, from which good linearity is evident (
R2 values of 0.983). Furthermore, in this case, the residuals are randomly distributed, indicating that while both approaches describe the behaviour well, the data conform better to the activated tunnelling equation than to the Arrhenius equation.
Parameters derived from both approaches are presented in
Table 2. At first sight, the behaviour presented in
Figure 4 may appear contradictory in that it suggests, from a mathematical perspective, that ln(
fp) varies in a close to the linear manner (
R2 approaching 1) when plotted against both 1/
T and
T. Furthermore, the underlying physics involved in the Arrhenius behaviour and activated tunnelling is also rather different. To address this, it is necessary to examine the concept of activated tunnelling in more detail and, specifically, to consider the temperature range over which the tunnelling aspect has an appreciable mechanistic influence. For the tunnelling process to be significant, thermal activation must occur to an excited state below the top of the potential barrier as follows: that is, the process will only be significant at low temperatures. Previously, Hill and Dissado [
28] have shown that the corresponding maximum temperature,
Tmax, of applicability can be written as follows:
albeit that the form of this equation is dependent on the precise shape of the potential barrier, such that the resulting value of
Tmax should only be considered as an estimate. Nevertheless, the substitution of values from
Table 2 into the above leads to a value of
Tmax of 155 K.
Furthermore, the frequency corresponding to the pre-exponent Arrhenius parameter,
A0, is approaching the THz regime and therefore is physically reasonable; that is, it is of a comparable order to the vibrational frequency of the relevant molecular structural units. In summary, the above results suggest that, over the temperature range considered, the behaviour of the system is moving away from activated tunnelling towards an Arrhenius behaviour. Similar behaviour was reported in [
27], particularly in systems that contained moieties that enhanced molecular mobility. We, therefore, concur with the above suggestion that, in the context of
Figure 4, “pure thermal activation, as described by the Arrhenius equation is […] just a manifestation of activated tunnelling above some material dependent temperature”. Furthermore, the above analysis demonstrates that the data shown in
Figure 3 are quantitatively consistent with the characteristics of the dielectric γ relaxation in other DGEBA-based epoxy systems.
3.4. The Higher Temperature Dielectric Relaxation (αβ mode)
The data set shown in
Figure 3 that was acquired at 203 K includes a pronounced increase in
εr″ at low frequencies, which is arrowed and indicated “B”. This corresponds to the molecular relaxation process similarly labelled “B” in
Figure 2.
Figure 5 contains dielectric data acquired over the temperature range of 203–303 K as follows: the temperature dependence of
εr′ over this complete temperature range is shown in
Figure 5a while, for clarity, the corresponding
εr″ data are shown in
Figure 5b (203–253 K) and
Figure 5c (253–303 K). Consider, first, the former temperature range. From
Figure 5a, it is evident that
εr′ increases markedly over the above temperature range. This increase is a consequence of the strong dielectric relaxation process that moves to progressively higher frequencies as the temperature is increased. From
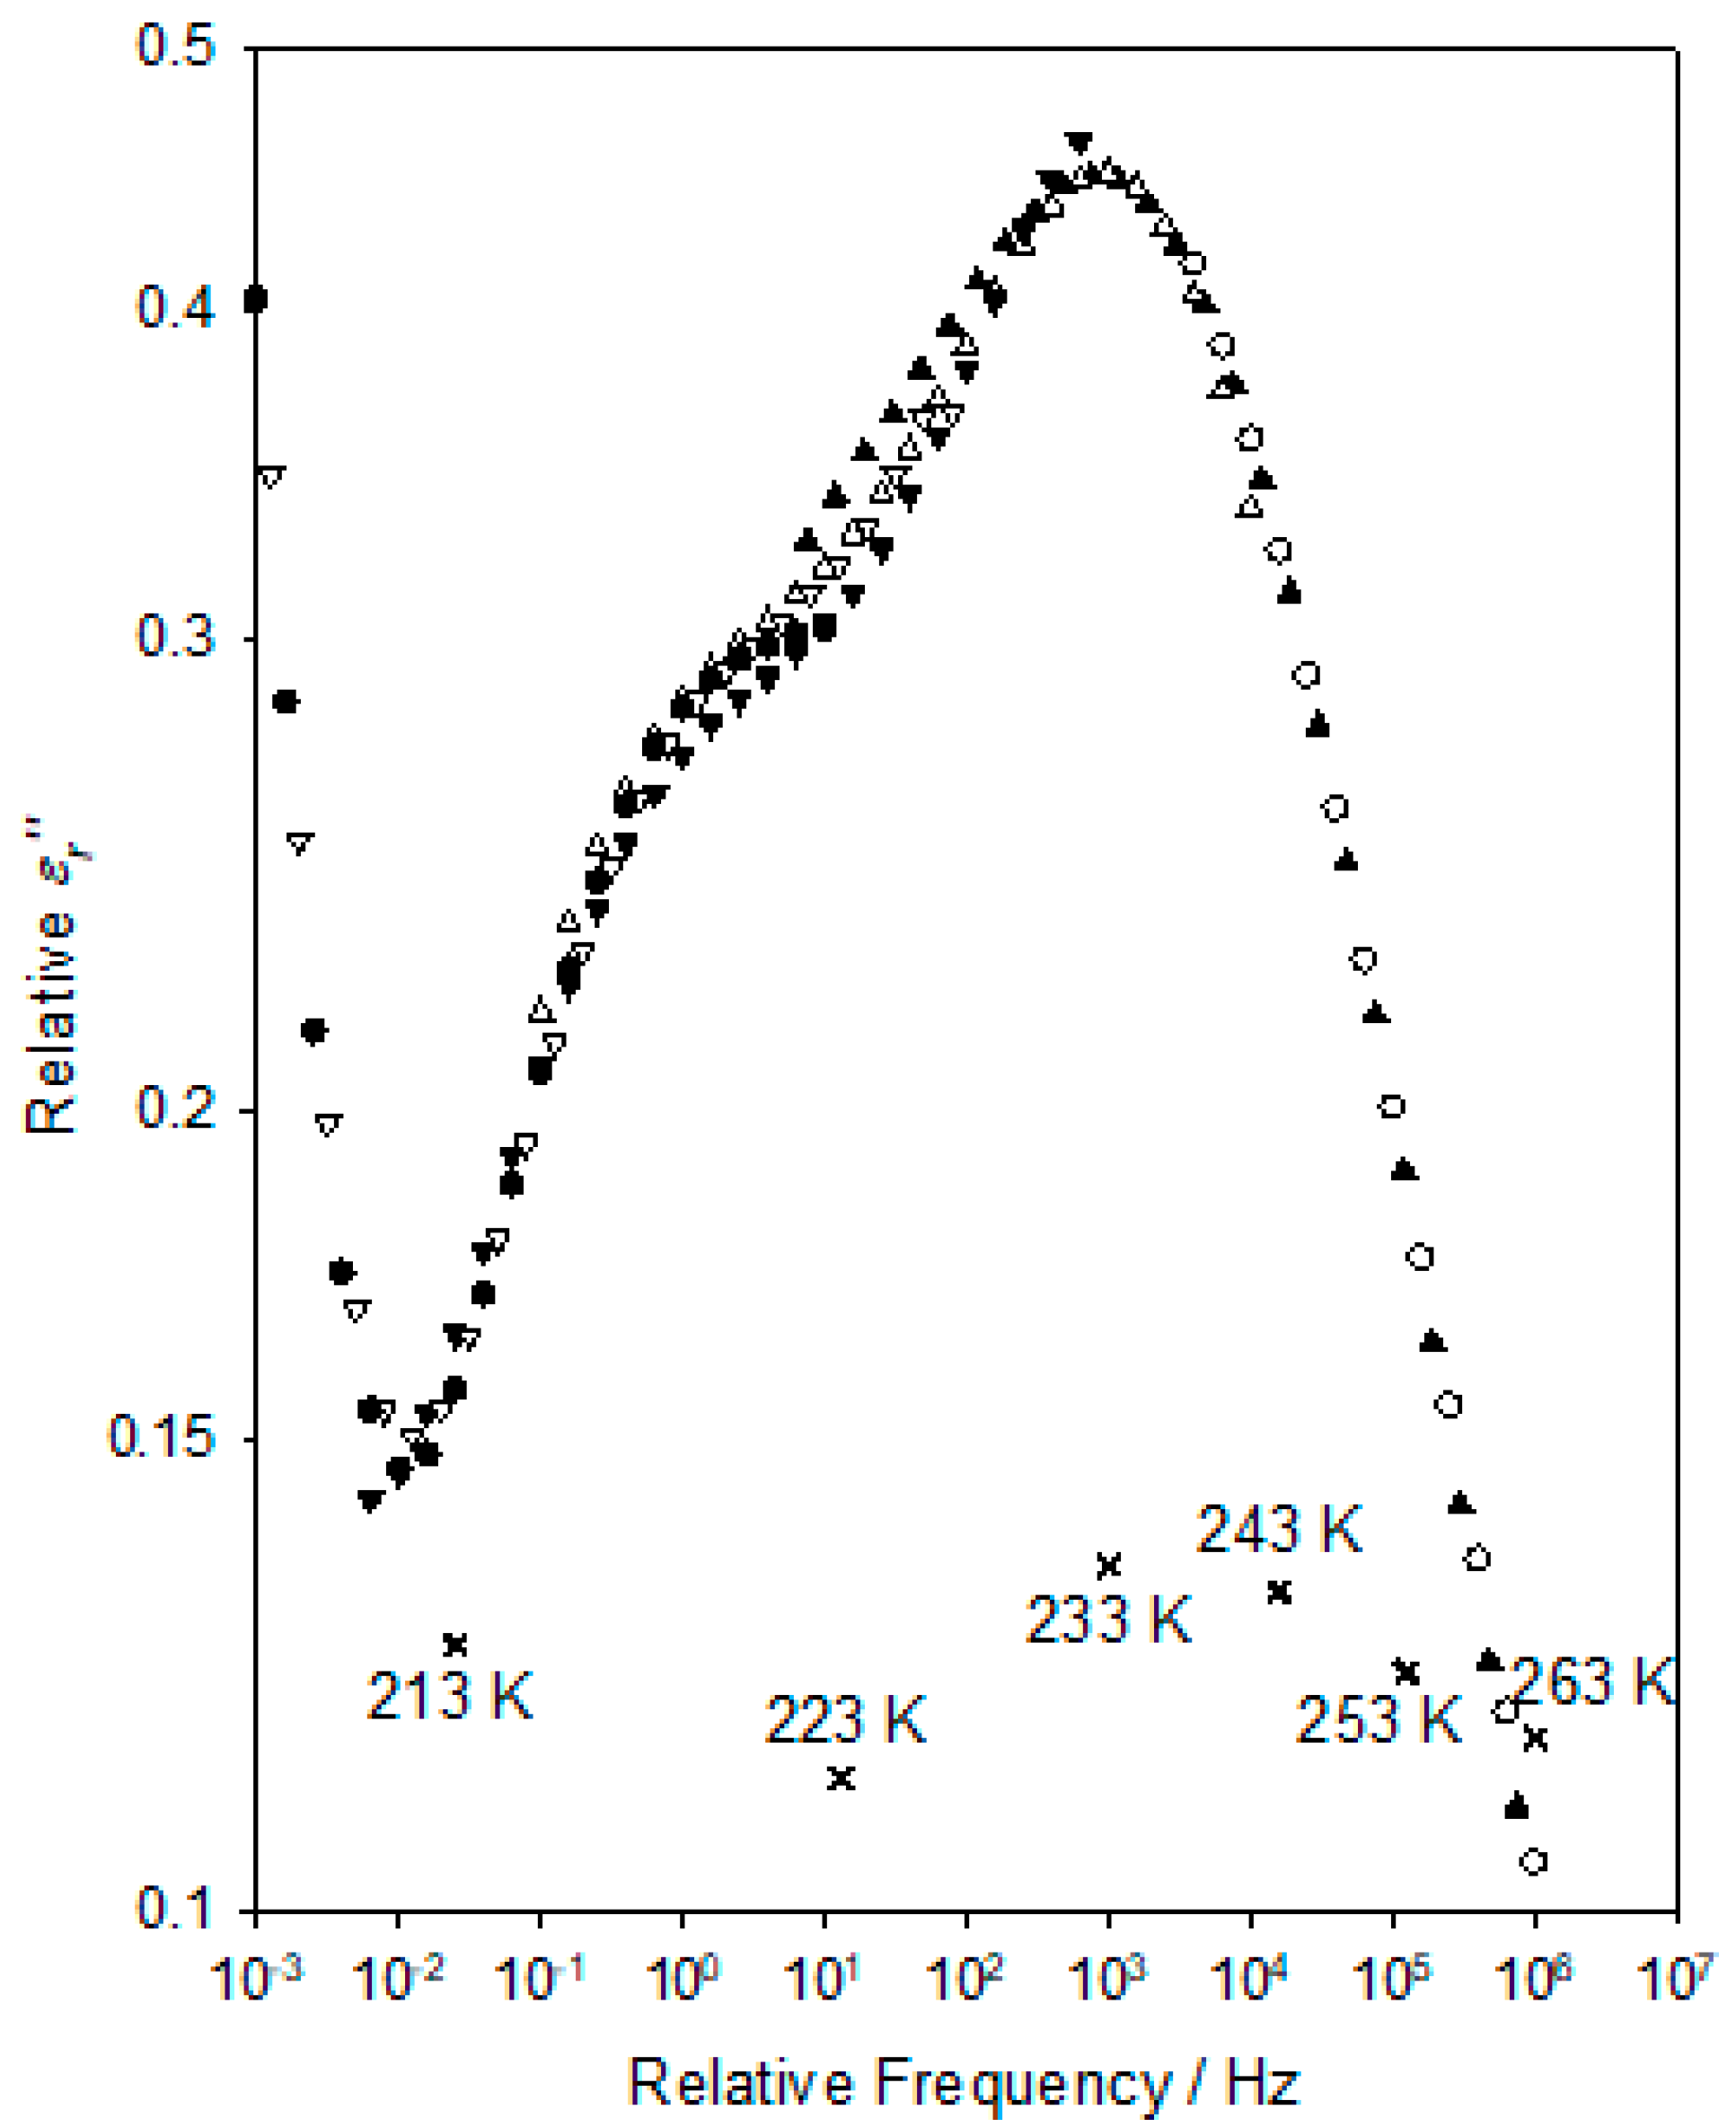
Figure 5b, the following two features are worthy of note: first, the shape and strength of this peak are largely invariant with temperature; second, the form of the peak differs greatly from the ideal Debye relaxation or variants of this such as the HN formalism. Rather, the form of the peak is suggestive of the main process supplemented by an additional shoulder at lower frequencies (see, for example, the data set acquired at 233 K).
This latter feature becomes more evident when the data sets are combined into a relaxation master curve, as shown in
Figure 6; the corresponding relative shifts in frequency and
εr″ values are indicated in this by the
X symbols. The shift factors and consequent relative peak frequency,
fp, values generated in producing
Figure 6 facilitate a quantitative analysis of the temperature dependence of the process and, in this respect, two approaches may be relevant. The low-temperature γ relaxation is typically reported in conventional DGEBA-based systems to be followed at intermediate temperatures by the β relaxation, which, in amine-cured systems, is commonly associated with the local motion of the hydroxyl-ether groups formed during curing [
3]. At yet higher temperatures, the α relaxation is seen, which is related to the motion of larger chain segments that occur around
Tg, the temperature dependence of which is widely reported to conform to the VFT equation [
29,
30] that is the following:
where
AVFTα Bα and
TVFTα are empirical, material-dependent parameters relating to the dielectric α process. However,
TVFTα is typically found to lie some 50 K below
Tg [
31]. A comparison of the temperature dependence of the relative frequency values with the Arrhenius equation demonstrates that the dielectric process shown in
Figure 6 does not conform to the Arrhenius equation (results not shown for the sake of brevity). A number of methodologies are possible in fitting the experimental data to the VFT equation, including the direct approach of treating
AVFTα,
Bα and
TVFTα as free parameters and fitting
fp to
T using appropriate fitting software. However, such an approach is problematic in this case for the following reason: The reliability of the fit and the derived parameters are strongly influenced by the uncertainties in the input data and the local curvature of the objective function hyperplane. Specifically, if the latter in the vicinity of its global minimum is low, then a large number of potential solutions exist that are of close to equal statistical validity. Essentially, if
TVFTα is changed, then the VFT
AVFTα and
Bα parameters can be adjusted to compensate such that another, alternative solution arises with a comparable value of
R2. When the goodness of fit to these different solutions is comparable (bearing in mind the uncertainties in the experimental input data), then it is impossible to choose between them on the grounds of statistical fit alone. However, the above fails to consider the form of the residuals, which can easily be gauged visually. For this reason, the above purely statistical approach was not followed; rather, values of
TVFTα were sequentially chosen and ln(
fp) plotted against 1/(
T −
TVFTα). In this way, it is possible to consider the goodness of fit in terms of the resulting dependence of both
R2 and the form of the residuals on the chosen value of
TVFTα.
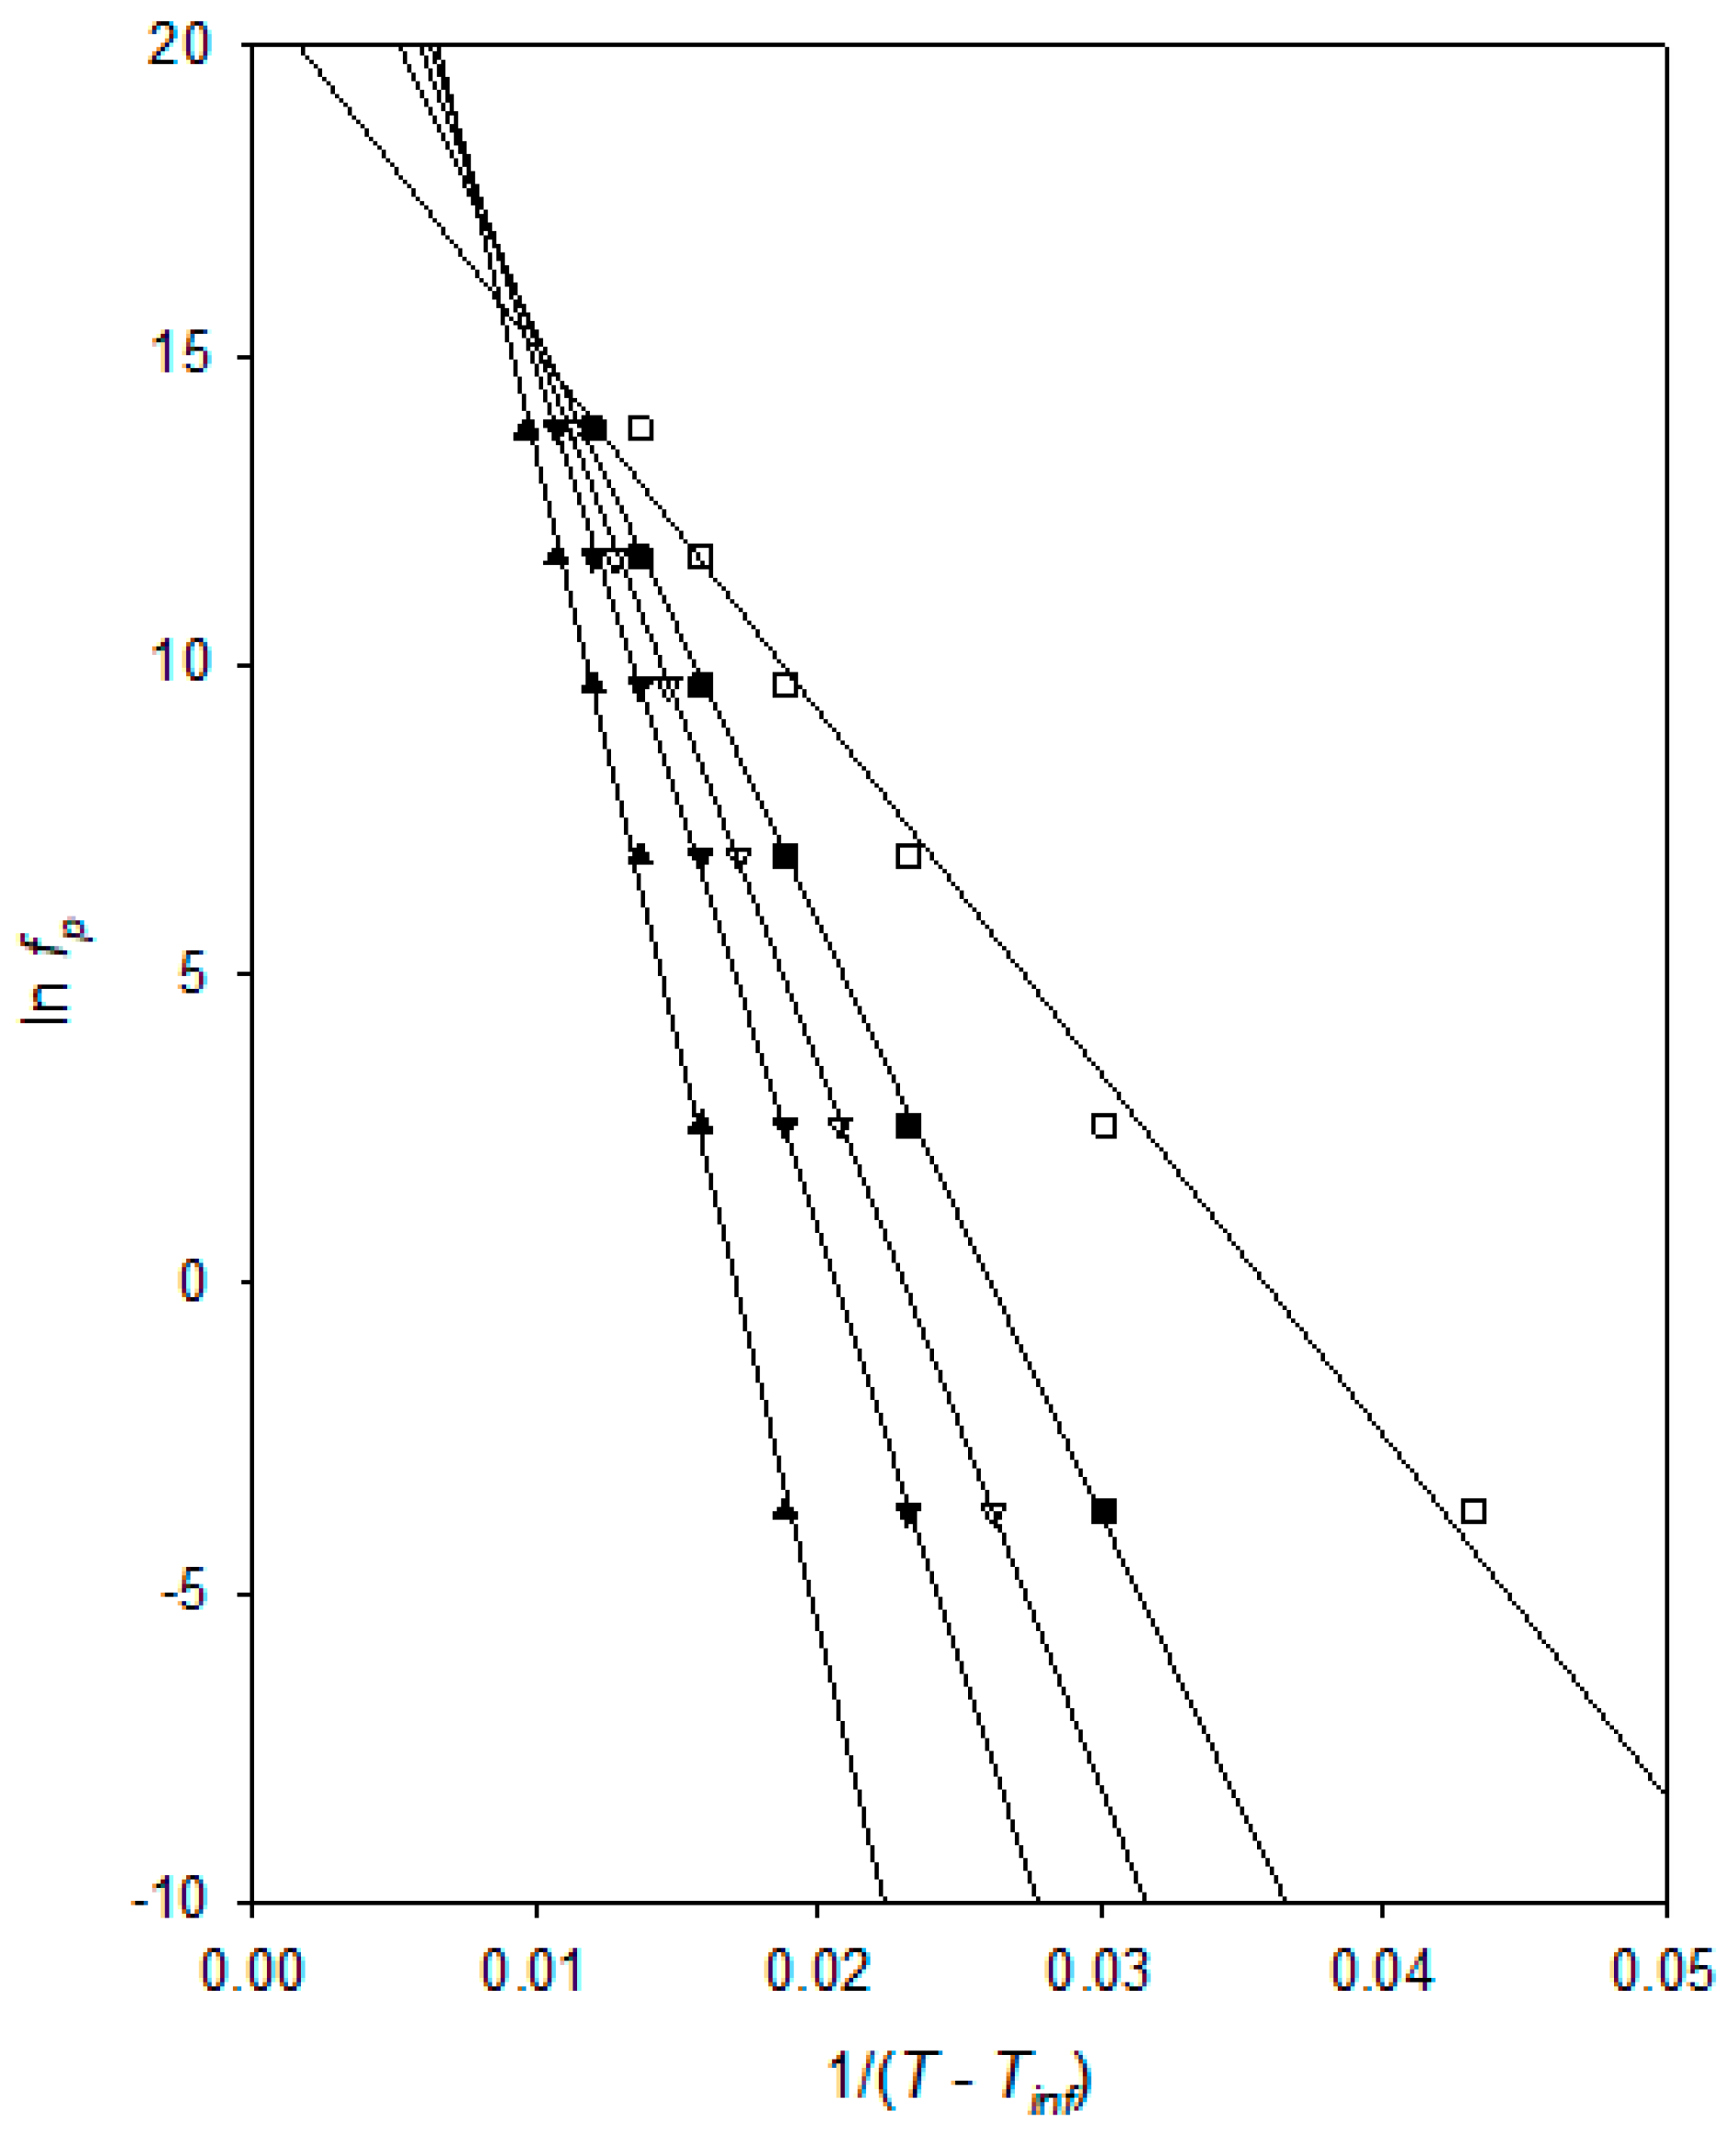
Figure 7 presents a VFT analysis of the peak frequency,
fp, values derived from
Figure 6. In this, the various fit lines shown were obtained by assuming the indicated value for
TVFTα, from which, it is evident that all of these correspond to good fits to the experimental data, with
R2 values varying from 0.9975 (
TVFTα = 160 K) through 0.9996 (
TVFTα = 175 K) to 0.9905 (
TVFTα = 190 K). Furthermore, a comparison of each set of data points with the relevant fit line indicates that the form of the residuals varies systematically with the chosen value of
TVFTα. For example, in the case of
TVFTα = 190 K, the data points fall, not along a straight line, but rather, take the form of a concave curve, (the data points tend to lie
above the fit line at high and low temperatures, but
below the fit line at intermediate values). Conversely, although not as obvious, the data points lie on a convex curve when
TVFTα = 160 K. In summary, both indicators (
R2 and residuals) point to an optimum value of
TVFTα = 175 ± 5K, suggesting a
Tg value around ~225 K, which is in excellent agreement with the assumptions made above (suggesting the
Tg is located around process “B” (~220 K) and the literature reporting a value of about −55 °C (~220 K)). [
23,
24] As such, the above
TVFTα value is physically credible.
It is evident that at temperatures above those associated with the dielectric γ relaxation, the DGEBA/D-4000 system exhibits not the conventional, distinct β and α processes but, rather, just a singular, bimodal, process, the temperature dependence of which aligns with that normally associated with the α relaxation. This form of behaviour is, therefore, the explanation for the “absence” of a relaxation peak in DGEBA/D-4000, in
Figure 2, as compared to the equivalent plot in DGEBA/D-2000, in [
20]. Such an effect is unusual and requires some discussion.
The sub-
Tg relaxation behaviour of epoxy-based systems has been reported by many workers but, here, we will focus on the work of Mangion and Johari [
32,
33], which provides particularly useful insights into the origin of the effects we report. In summary, these workers considered the dielectric relaxation behaviour of DBEBA cured using two amine-based hardeners, namely, with diaminodiphenyl methane (DDM) and diaminodiphenyl sulfone (DDS), and in both systems, they analysed changes in the dielectric relaxation processes during curing. Focusing, first, on the γ and β relaxations, it is reported that, as curing progresses, “the strength of the γ process decreases and reaches a limiting value, while that of the β process initially increases, reaches a maximum value, and then decreases” [
32]. As is usual, these workers associated the β relaxation with hydroxyl-ether segments formed as a consequence of crosslinking reactions between epoxide and amine groups, the concentration of which increases as curing progresses, thereby explaining the initial increase in the associated relaxation strength. Consequently, as curing proceeds further, the hydroxyl-ether group’s concentration is more than offset by constraints on the molecular motion within the glassy structure, thereby the strength of the β relaxation slightly decreases. Furthermore, as curing proceeds, the temperature of the α relaxation increases, such that it becomes increasingly separated from the β process [
32,
33].
Evidently, the system characterised in our study was formulated using the theoretical optimum stoichiometry and was fully cured. Certainly, the data presented in
Figure 3 are consistent with this, based upon previous work [
25], in that there is no evidence of γ
2 mode that would imply unreacted end-groups. As such, when considering the behaviour of any β relaxation in the context of the work of Mangion and Johari [
32,
33], the major difference between systems cured with DDM or DDS and D-4000 is the molecular architecture of the curing agent. Specifically, when fully cured using DDM or DDS, the molecular network of a DGEBA-based epoxy is highly constrained, leading to
Tg values in excess of 370 K [
32,
34]; only slight variations between the β relaxations of the two different systems were observed and assigned to the structures of the respective hardeners, which resulted in local loose packing of chain segments. Conversely, the use of D-4000 leads to a marked increase in the contour length between network nodes and a commensurate reduction in molecular constraints.
In general, the hardener’s structure, whether it be amine-based or anhydride, has been shown in many cases to have a great impact on the α relaxation due to associated variations in the
Tg and a lesser impact on the β relaxation. For instance, one of the very first studies to consider the hardener’s profile in dynamic response was by Shito et al. [
35], where the dielectric and mechanical dynamic spectra of epoxy resins cured with eight different anhydrides revealed the following two relaxations in the examined temperature range: the α mode (WLF behaviour) and the β mode (Arrhenius behaviour). The former was attributed to “motions of large chain segments which are frozen below the
Tg” while the latter was attributed to “smaller segments which are not frozen below the
Tg and freeze at a certain lower temperature”. The importance of structural characteristics on the hardener, such as double bonds and ring structures, was pinpointed and shown to have a greater impact on the
Tg (therefore α relaxation) of the system.
Dammont et al. [
36], in a study involving various prepolymers and (amine-based) hardener structures, showed that the β relaxation displays universal characteristics invariant to prepolymer and hardener structures and was ascribed to the hydroxyl-ether segments of the molecule. It was shown that the location of only the α relaxation (attributed to the
Tg) shifts according to the flexibility (aliphatic) or stiffness (aromatic) of the examined molecular structure. Similar findings were reported by an extensive work by Pogani et al. [
37,
38], where a number of epoxy systems were cured with various ratios of different amine hardeners. The flexibility (aliphatic vs aromatic) of the structure was shown to have a greater impact on the α mode (attributed to
Tg) rather than the secondary relaxations.
Following from the literature review reported above, it is this great effect of hardener’s flexible structure on the α mode, significantly shifting it towards the slightly affected β mode which we suggest results in the absence of distinct, well-separated α and β processes. Previously, under conditions where the α and β processes merge, the resulting process has been termed αβ mode [
39]. Furthermore, Beiner and Ngai [
40] have indicated that secondary relaxations such as the β mode can trigger the many-molecule cooperative α relaxation. That is, in conventional, highly constrained epoxy networks, the α and β do not differ in terms of the dipolar moieties involved but, rather, in terms of the extent to which these are able (due to the network topology) to act cooperatively. In our DGEBA/D-4000 system, these constraints are relaxed to such an extent that α and β processes are, effectively coinciding, and therefore appear merged. In the absence of the local constraints that then differentiate α and β, the behaviour of the resulting αβ process, then exhibits a temperature dependence that conforms to the VFT equation that is, elsewhere, used to characterise only the conventional α process.
3.5. Charge Transport
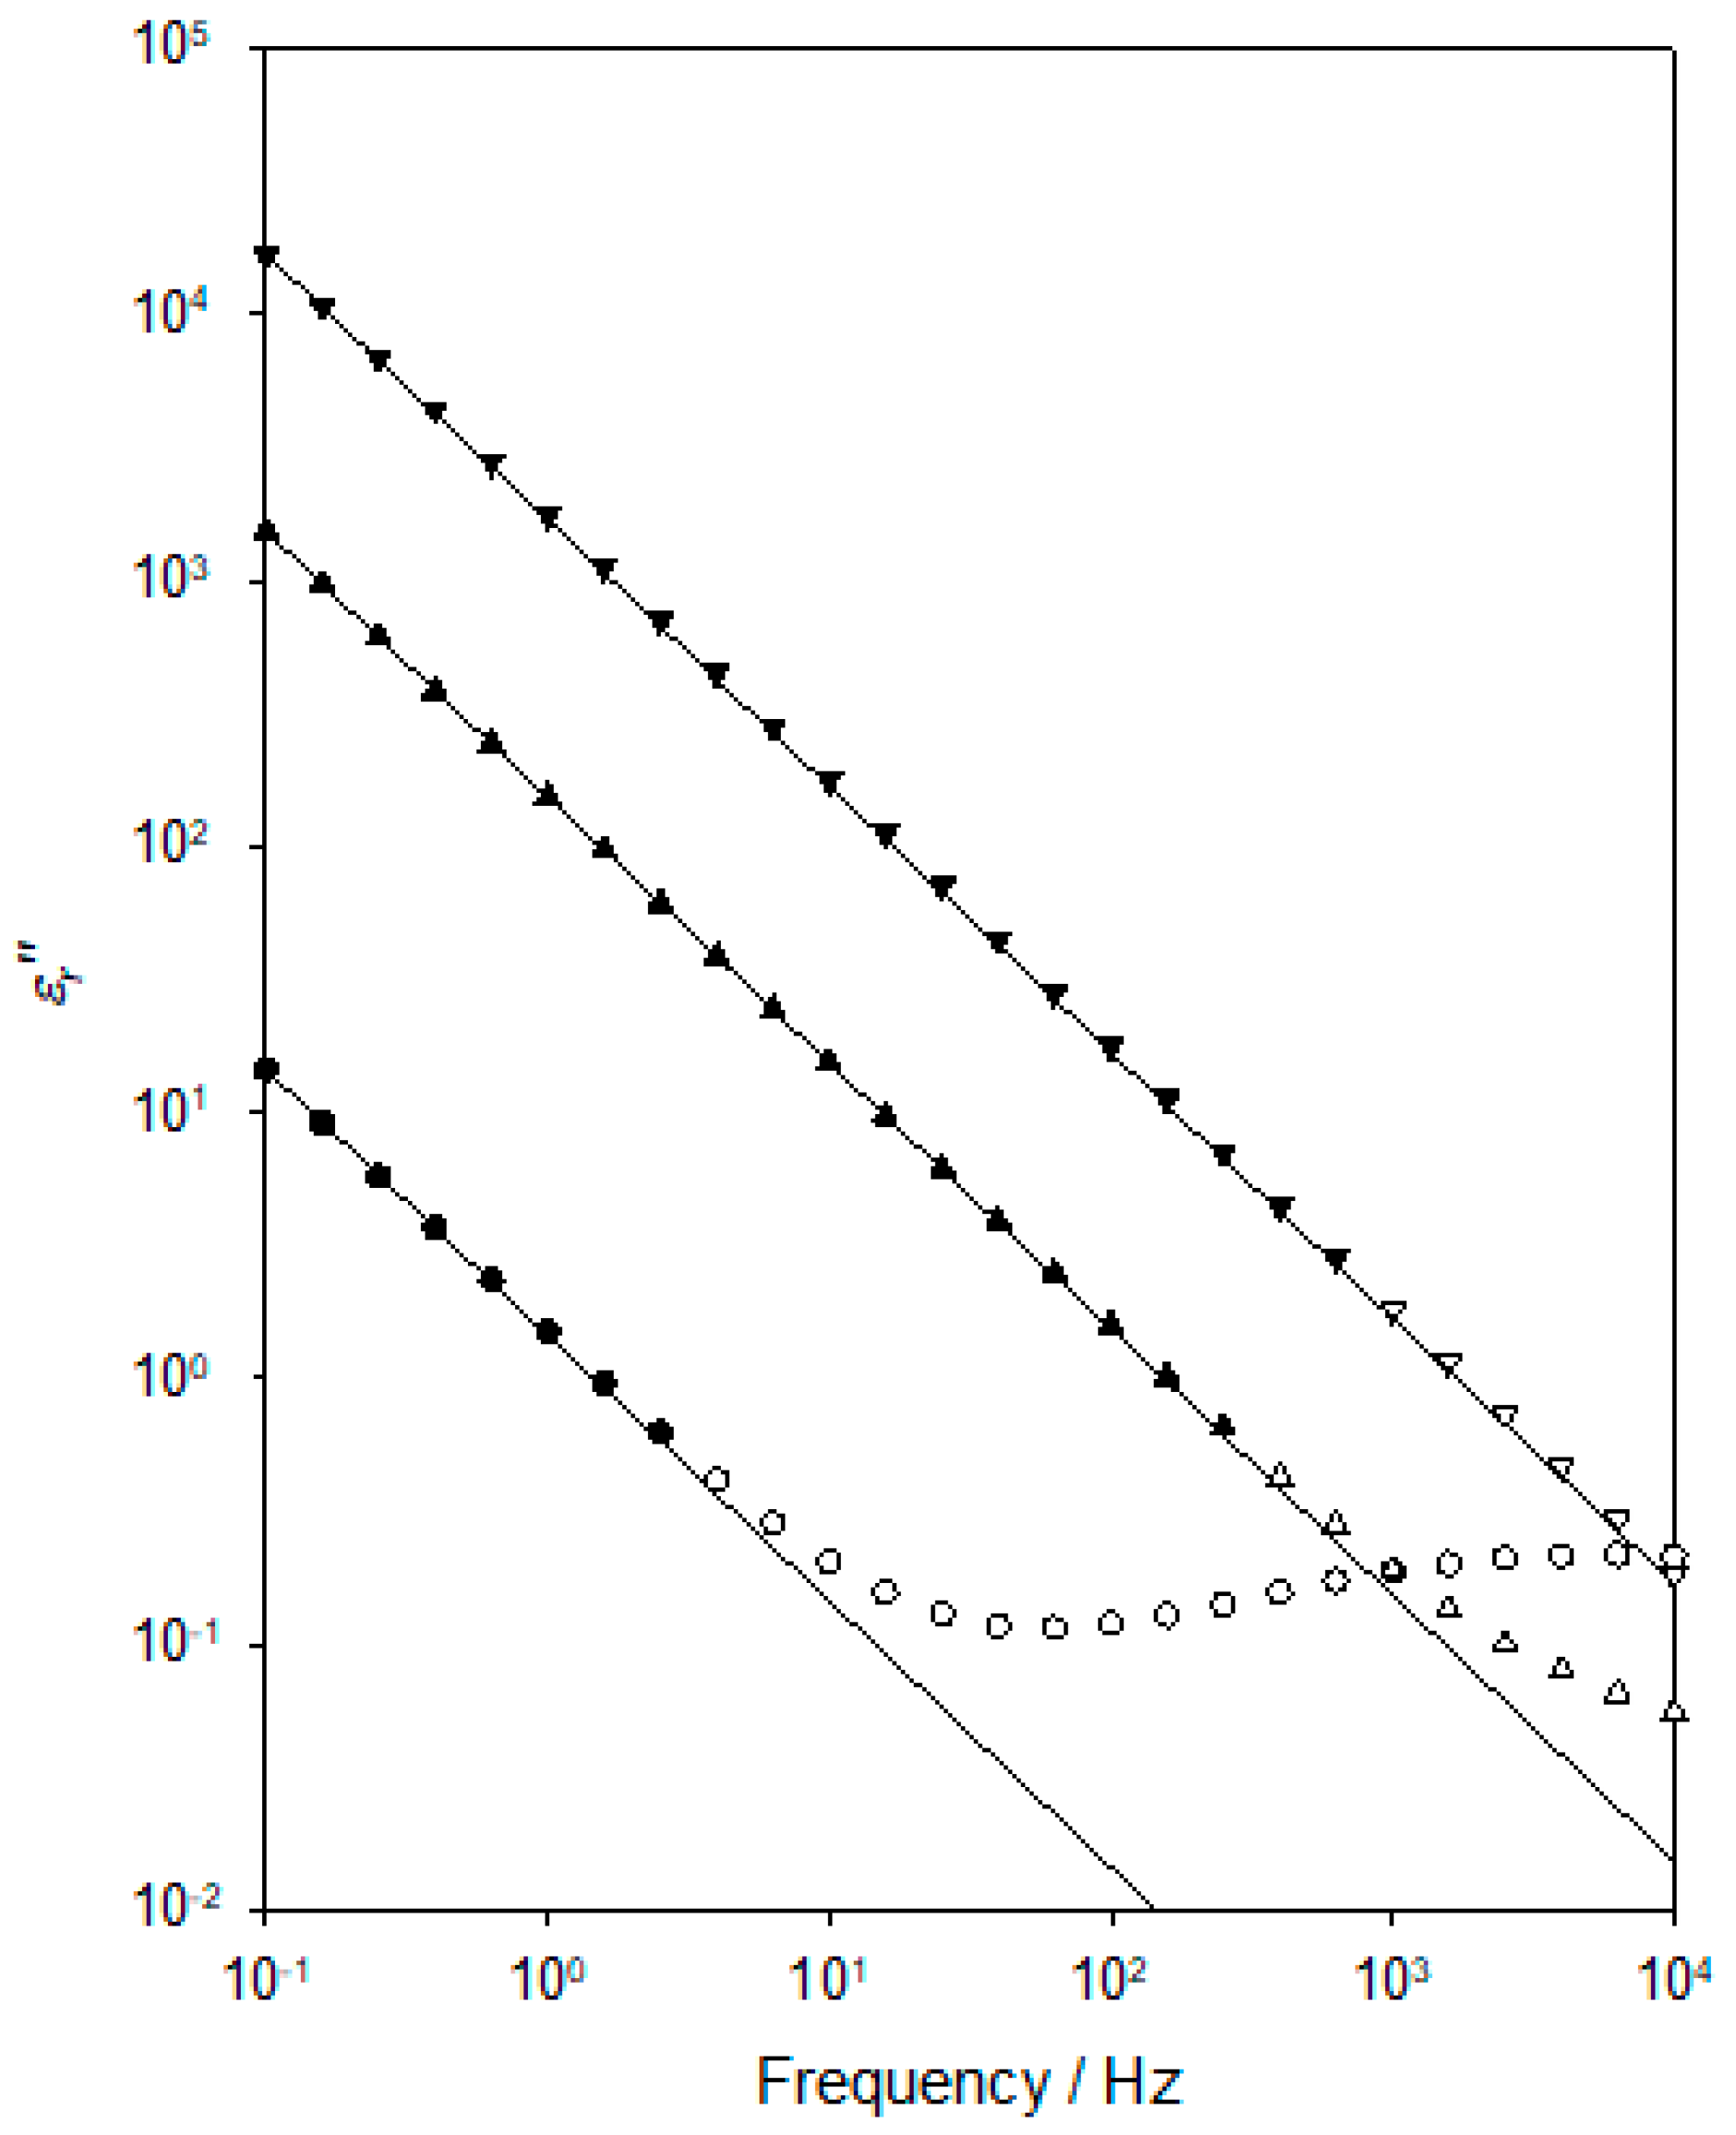
Figure 8 contains representative
εr″ data obtained at three temperatures in the range of 273–303 K. In this figure, for each temperature, the following three plots are shown: the experimentally determined data points (open symbols); a subset of these is used to generate the relevant low-frequency fit line (closed symbols); fit line to the low-frequency data. From theory [
41], DC conduction will manifest itself in the dielectric spectrum through a contribution to the imaginary part (slope of −1 in a log-log scale) of the relative permittivity that varies according to the following:
where
εr″
DC is the contribution to the measured value of
εr″ that arises as a consequence of the DC conductivity,
σDC, of the system,
ε0 is the permittivity of free space, and
ω is the angular frequency.
To examine the extent to which the increase in
εr″ with a decreasing frequency that is evident in
Figure 8 is indeed a consequence of DC conduction, two processes were adopted. First, it is possible to estimate the contribution to
εr″ that arises from polarisation mechanisms using the following form of the Kramers-Kronig equation, a quantity here represented
εr″
deriv as follows [
25]:
Second, it is possible to examine the experimental data, specifically, to test the hypothesis that the frequency dependence of
εr″ is primarily a consequence of DC conduction. In this way, we have shown that, over the temperature range of interest,
εr″ >>
εr″deriv and that
εr″ ∝
ω−1: that is, the variation in
εr″ at low frequencies is indeed, consistent with it predominantly arising from DC conduction. Data of the form shown in
Figure 8 were used to determine the temperature dependence of
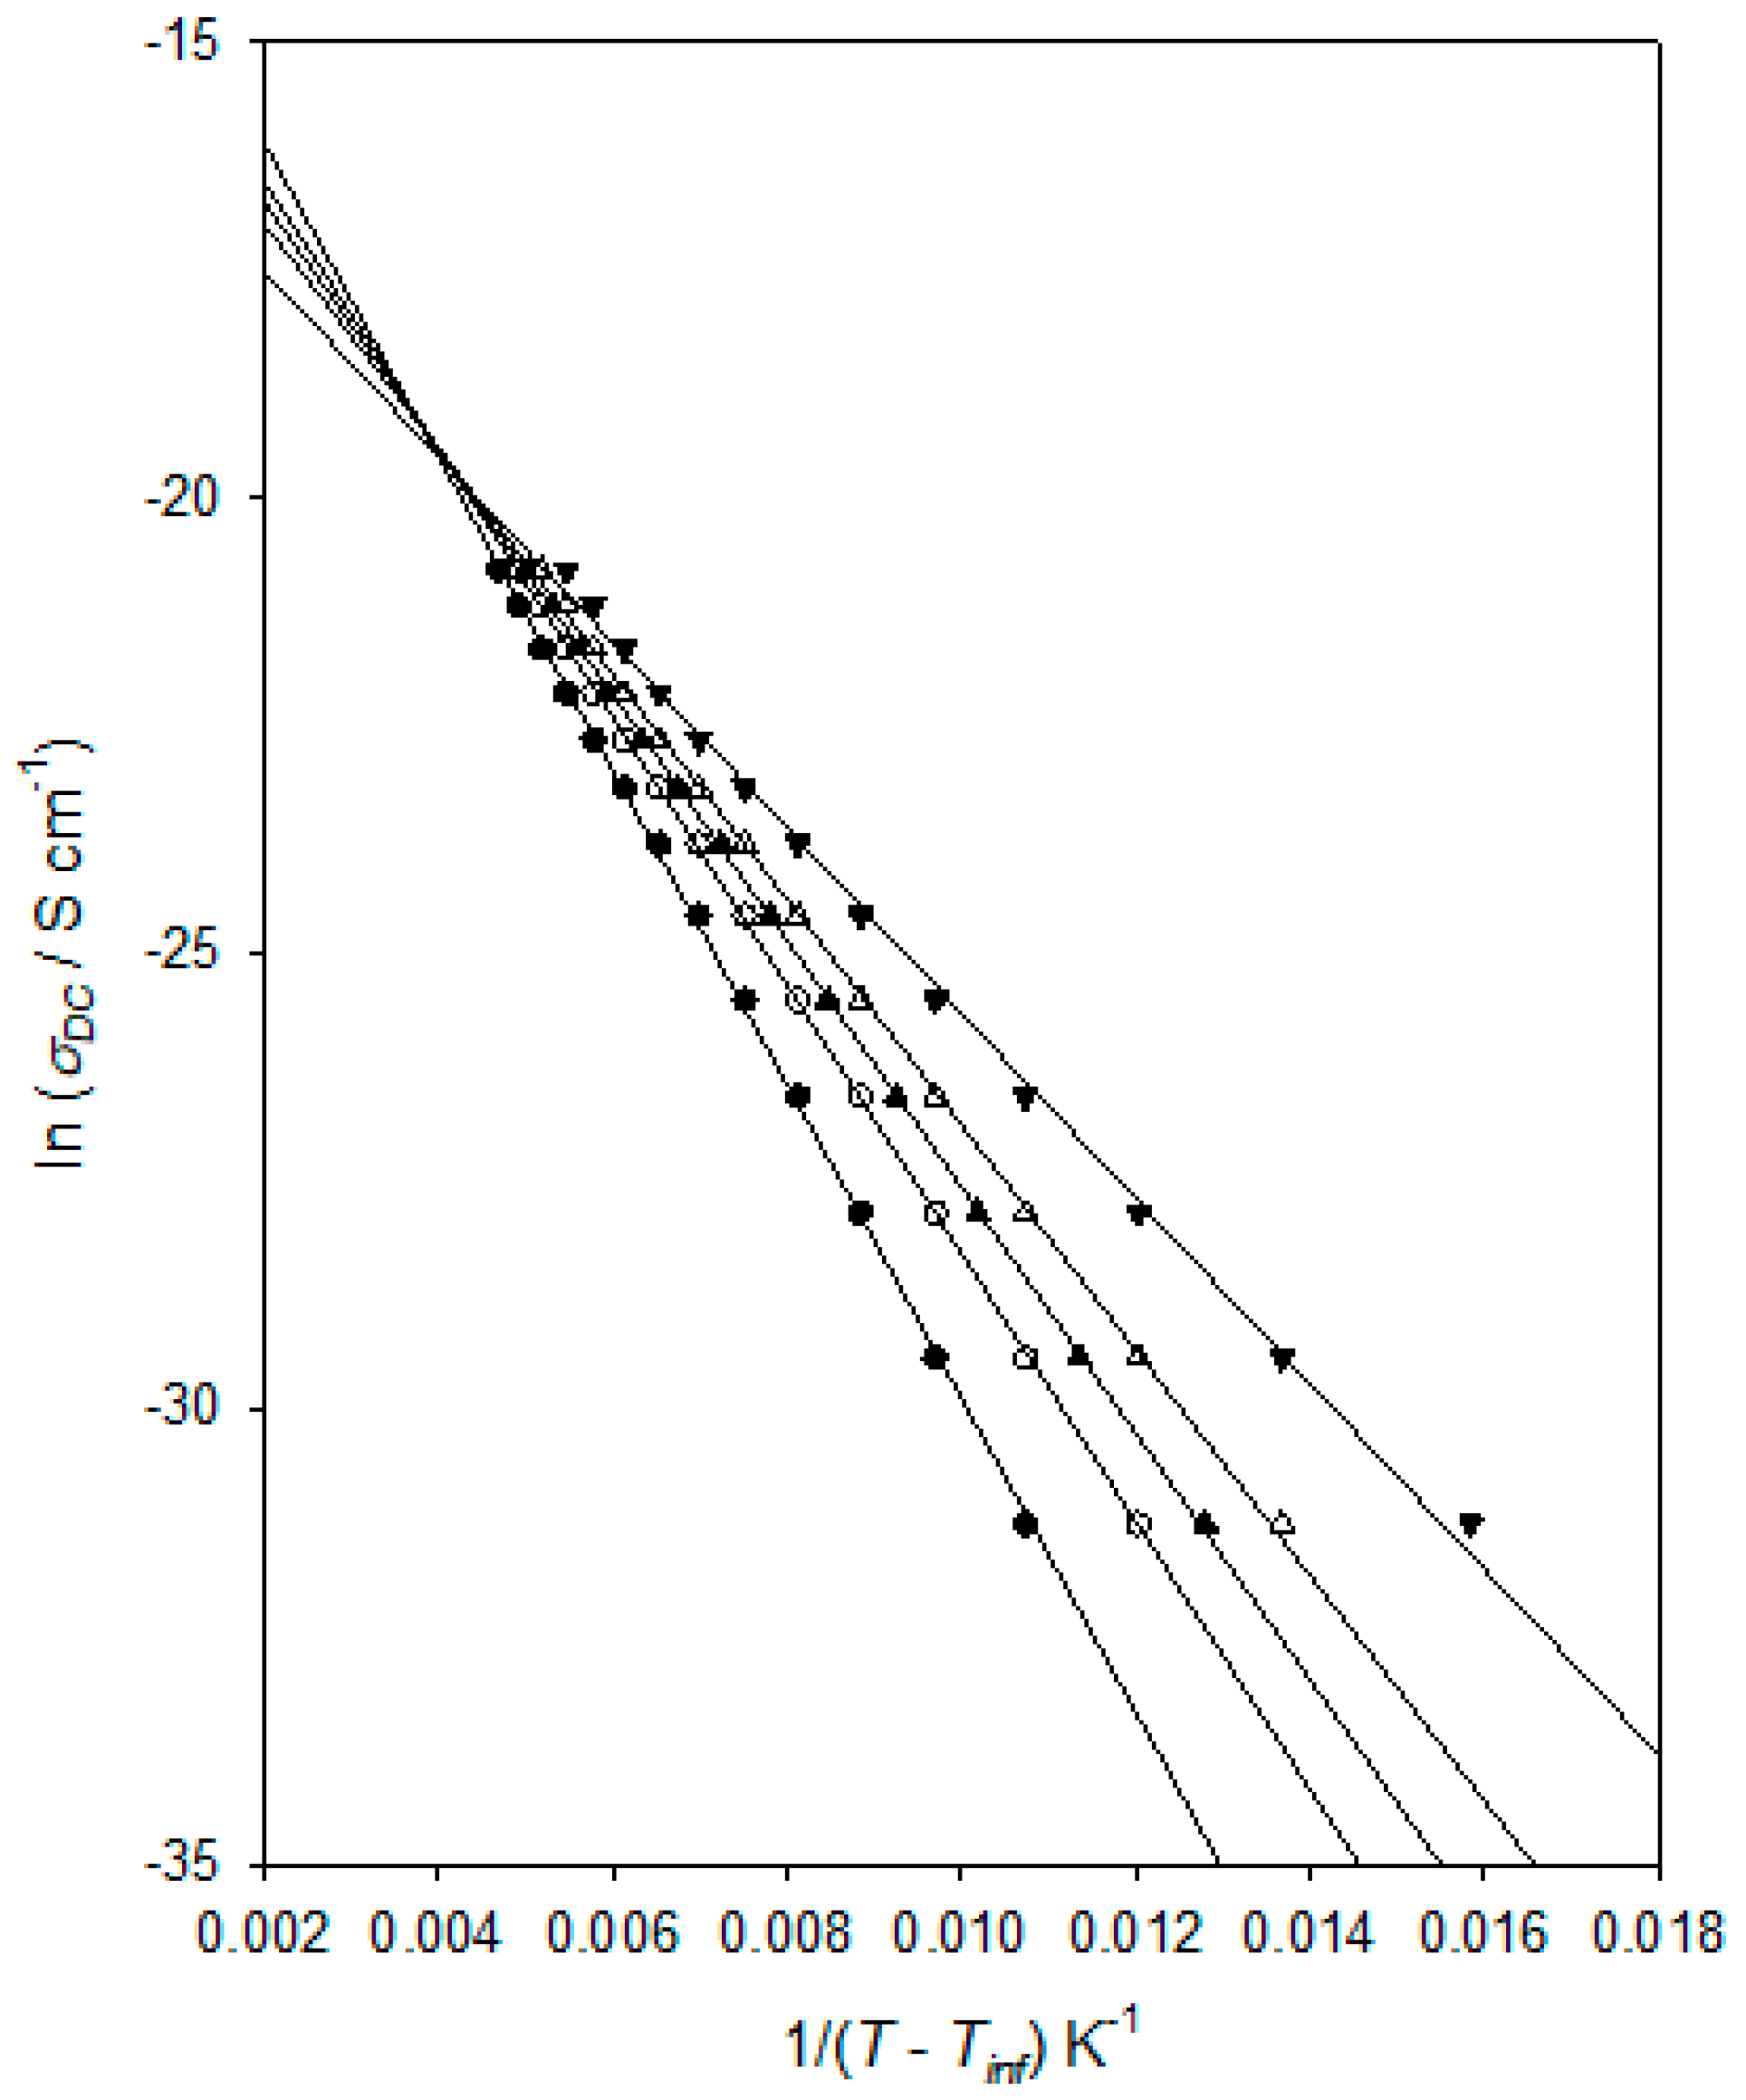
σDC for the DGEBA/D-4000 system, and the derived values are plotted in
Figure 9 in an equivalent way to that used in
Figure 7. That is, according to the following VFT equation:
where
AVFTσ,
Bσ, and
TVFTσ are empirical, material-dependent parameters relating to the process of DC conduction. As discussed above in connection with the dielectric αβ process, obtaining an optimum value for
TVFTσ can be problematical and, consequently,
Figure 9 again shows the effect of varying this parameter. As in the case of
Figure 7, all the linear plots shown correspond to good fits to the experimental data, with
R2 values varying from 0.9994 (
TVFTσ = 160 K) through 0.9998 (
TVFTσ = 170 K and 175 K) to 0.9975 (
TVFTσ = 190 K). Obtained values for
R2 continue to decrease outside the
TVFTσ range discussed explicitly above. Furthermore, as in the case of
Figure 7, when taking
TVFTσ = 190 K, the data points fall on a concave curve, while taking
TVFTσ = 160 K leads to the data points lying on a convex curve. This curvature becomes increasingly clear as
TVFTσ is varied outside the range shown. For this system, a value
TVFTσ = 173 ± 5 K is therefore determined, whereby the derived values for
TVFTα and
TVFTσ are statistically equivalent. A similar finding was previously reported by Huang et al. [
42] for a chemically rather different epoxy system.
The topic of charge transport in epoxy resins has been considered in numerous studies, using different approaches, and a range of possible mechanisms has been suggested. For example, Shimakawa et al. [
43] modelled space charge development and conduction in an epoxy resin using a bipolar charge transport model that considered charge trapping, de-trapping, and recombination where the positive charges included both holes and positive ions and the negative charges included both electrons and negative ions. Despite including a number of free parameters in their model, it was found not to be possible to simultaneously reproduce the experimental space charge and the external current data, a result that highlights the complexity of the processes involved. Other studies have similarly invoked a combination of electron, hole, and ionic transport in epoxy resins. For instance, Tian et al. [
44,
45] interpret their space charge and conductivity measurements in terms of electron and hole transport at temperatures below
Tg coupled—at higher temperatures—with the migration of ions. They suggested that above
Tg, it is ionic transport that dominates. An alternative mechanism was, however, suggested by Tian and Ohki [
46], who considered electrode polarisation and charge transport processes in a DGEBA-based epoxy at temperatures above
Tg. This work concluded that ionic transport is mediated by the molecular motion that occurs at temperatures above
Tg and that the resulting charge transport contributes to both the measured DC conductivity and, through partial blockage, electrode polarisation. However, the electronic contribution to the DC conductivity was deduced to be one to two orders of magnitude greater than that arising from ions. This study also suggested that the ions may originate from impurities remaining in the system after synthesis and from the ionisation of unreacted epoxy/hardener moieties. As such, the relative importance of electronic and ionic processes is likely to be critically dependent on the chosen reactants and stoichiometry. Indeed, it has also been proposed, in a rather different epoxy-based system, that charge transport above
Tg occurs through a bulk quasi–DC transport process involving ionic or electronic transfer between neutral clusters, “leading to an extended charge separation on a percolation structure” [
47]. In the system studied, absorbed water and protonic processes were thought to be of potential relevance, and segmental motion was considered to be of importance in mediating the transfer of charge between clusters. Elsewhere, Drakopoulos et al. [
48] observed ohmic conduction in their epoxy systems. While this mirrors the behaviour seen in
Figure 8 and
Figure 9, the assertion of Arrhenius behaviour is very different from the VFT temperature dependence reported in our work and elsewhere [
42,
49].
From the above discussion, it is apparent that the fundamental mechanism of charge transport in epoxy resins is poorly understood, with little consensus in the published literature. Indeed, it is not unreasonable that the relative importance of the different processes considered above may depend on material factors. As such, we do not believe that speculating on the interpretation of the behaviour seen in
Figure 8 and
Figure 9 is of significant value. Nevertheless, these results do indicate that the onset of the DC conduction process that dominates at higher temperatures (i.e., for
T >
Tg) is strongly coupled to the molecular motions associated with the dielectric αβ process. This conclusion is consistent with suggestions made elsewhere [
46,
47] for conventional epoxy resins at a temperature above the relevant
Tg.


 ,
, 


