
Evaluating Flexural Performance of Repaired Reinforced Concrete Beams under Static and Repeated Loading Using Non-Destructive Methods


Abstract
:1. Introduction
2. Materials and Methods
2.1. Materials
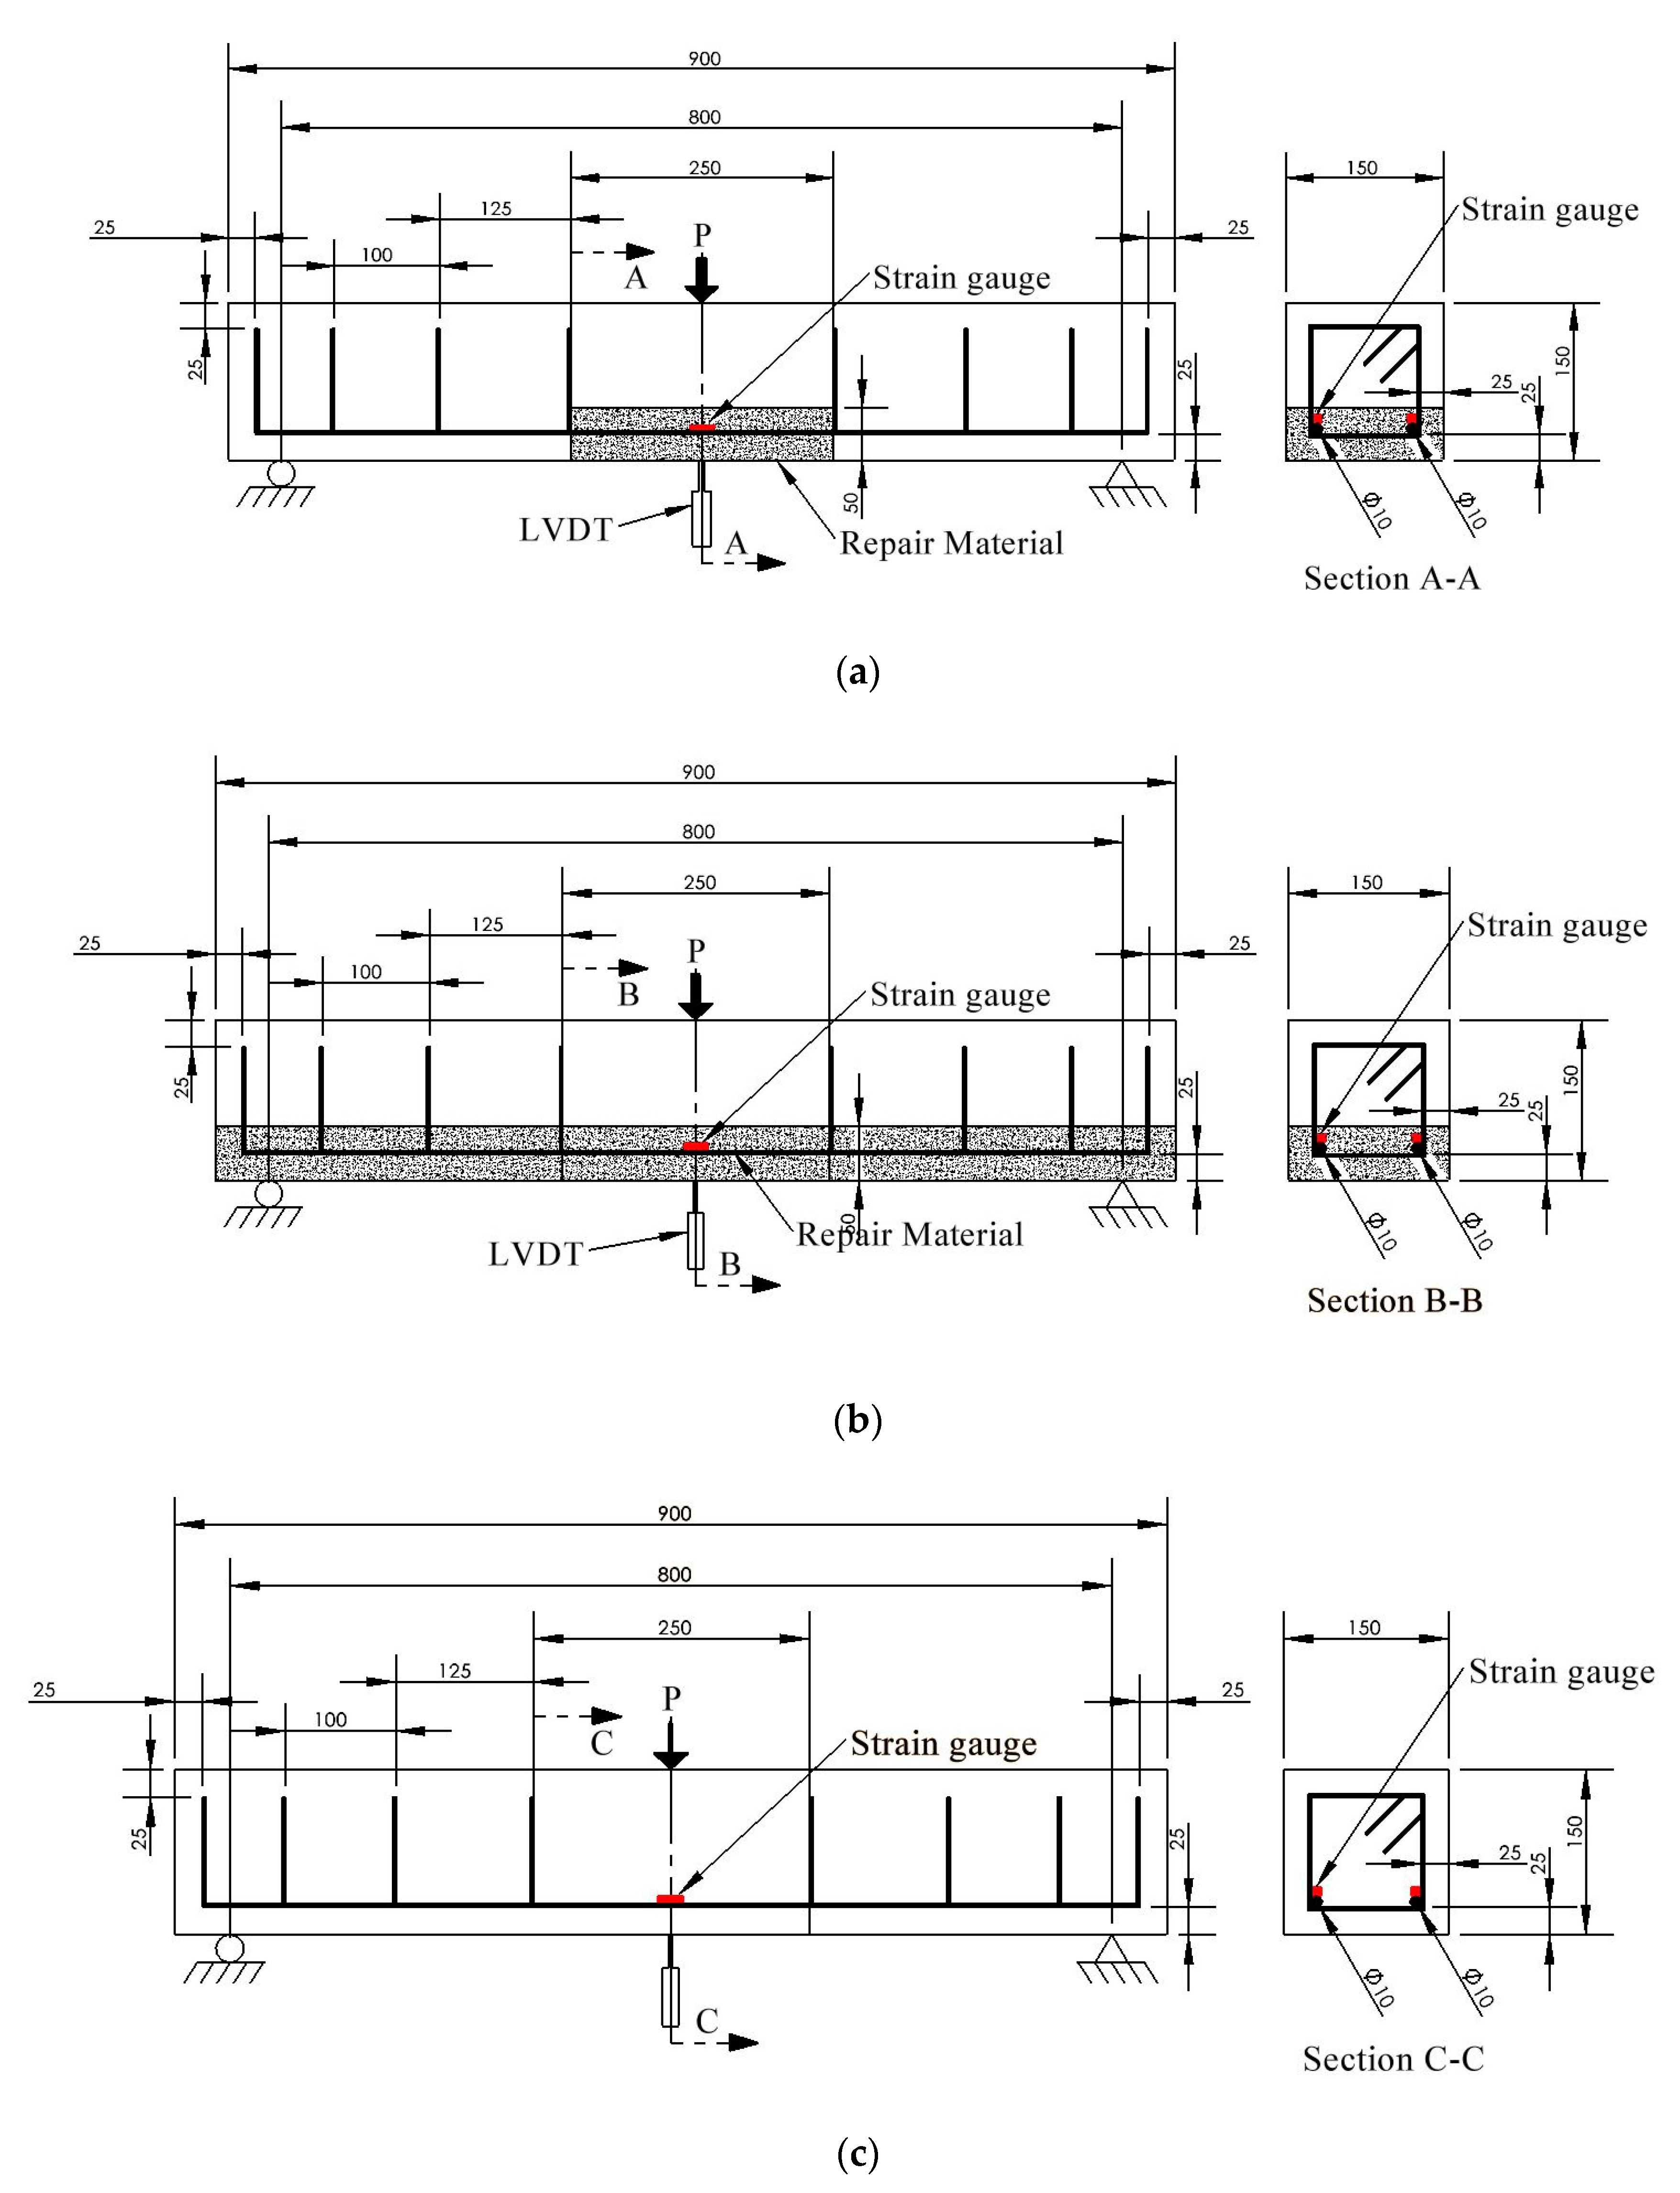
2.2. Test Specimens
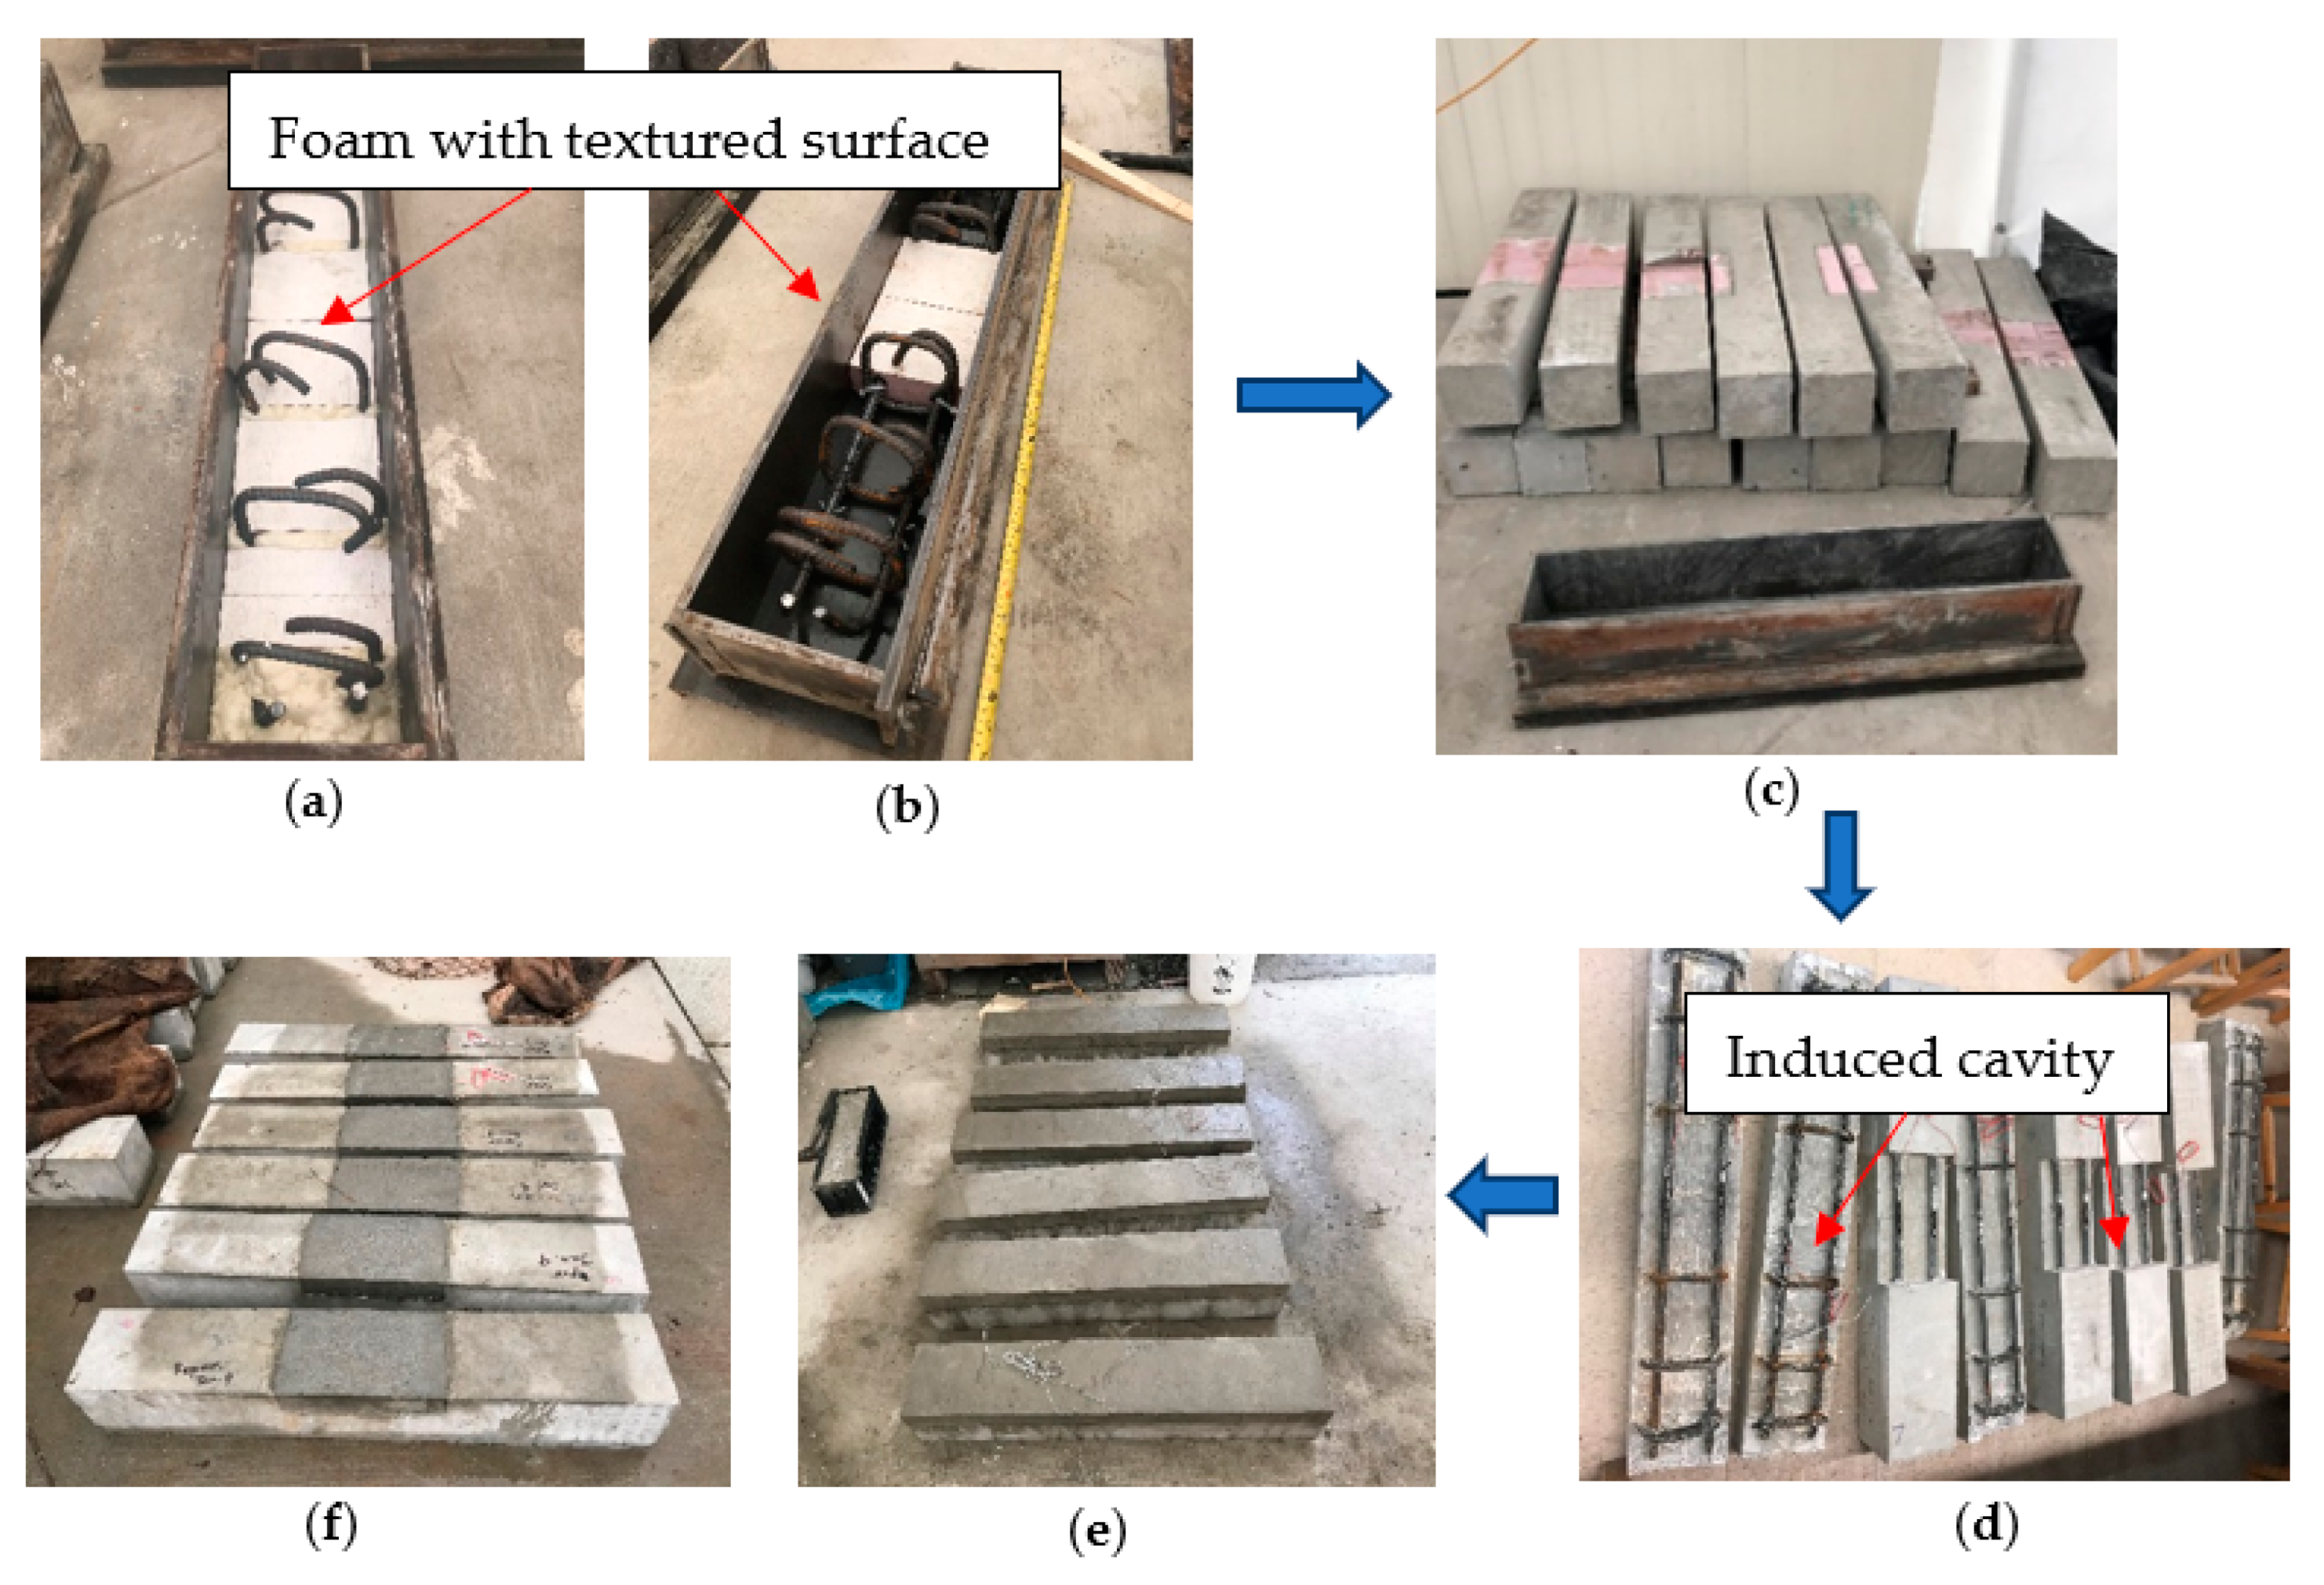
2.3. Specimen Preparation Procedure
2.4. Test Setup and Instrumentation
2.4.1. Strain Measurement
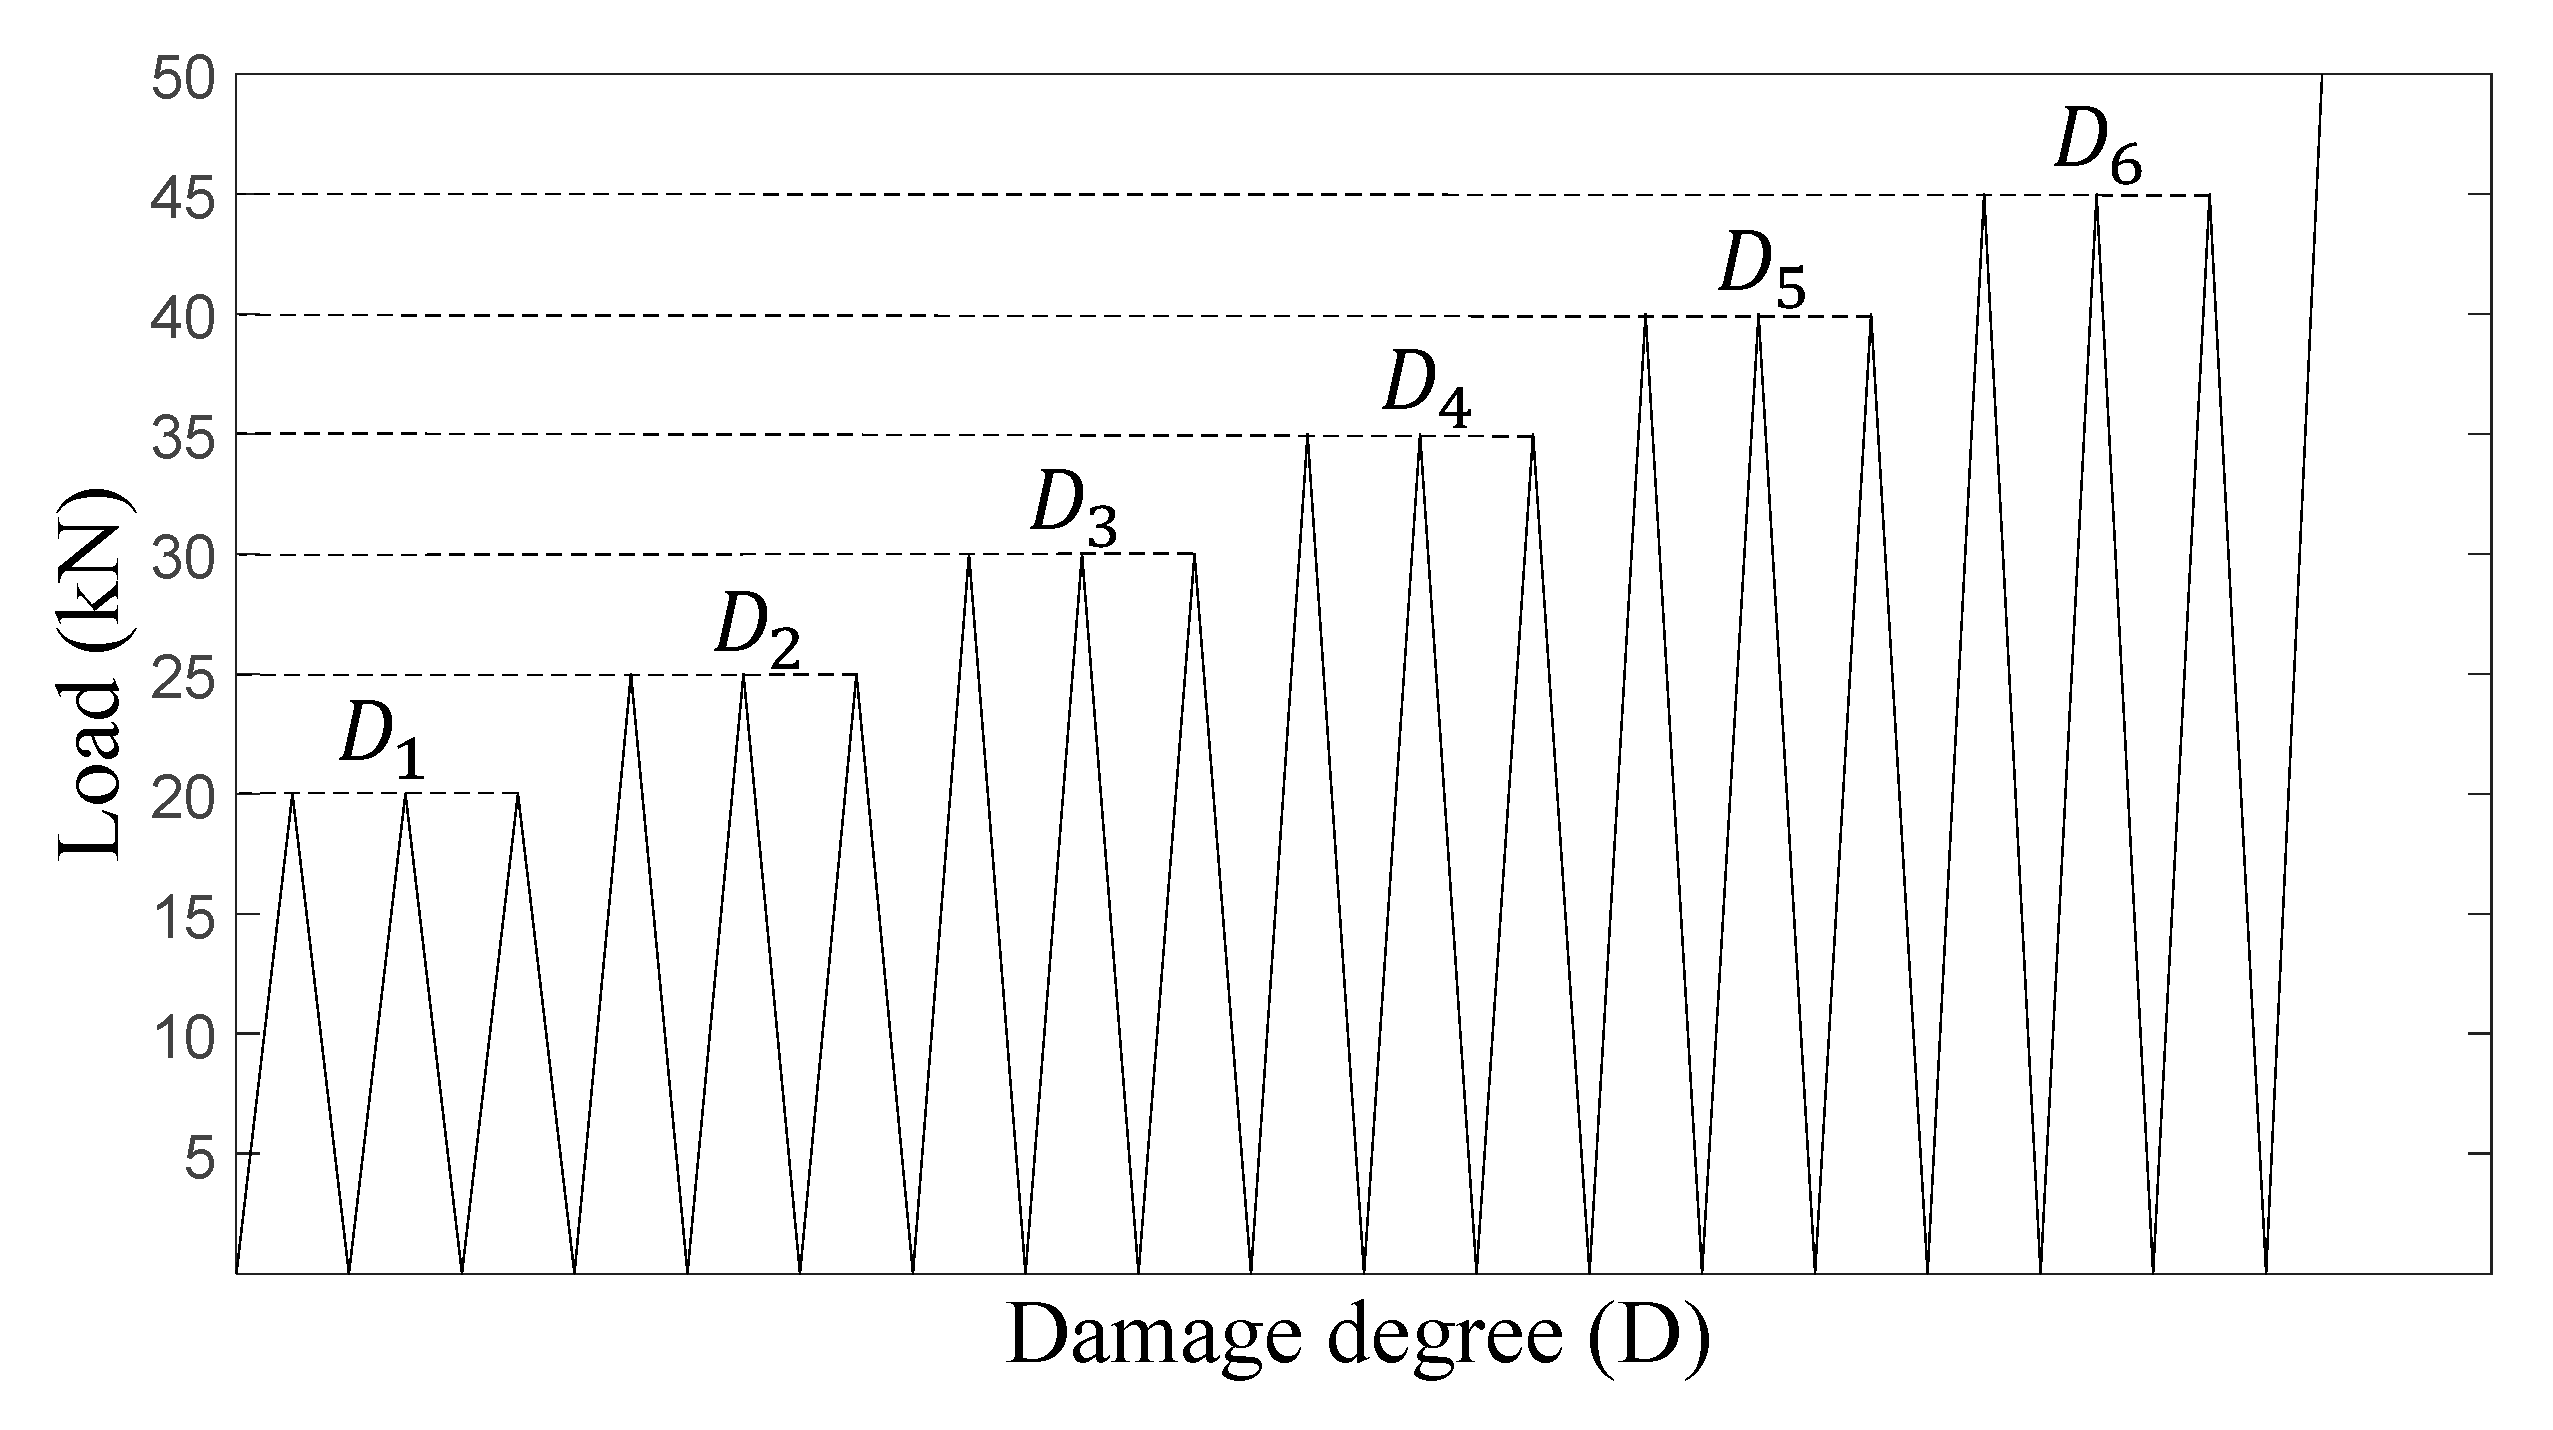
2.4.2. Loading Protocol
2.4.3. Non-Destructive (NDT) Methods
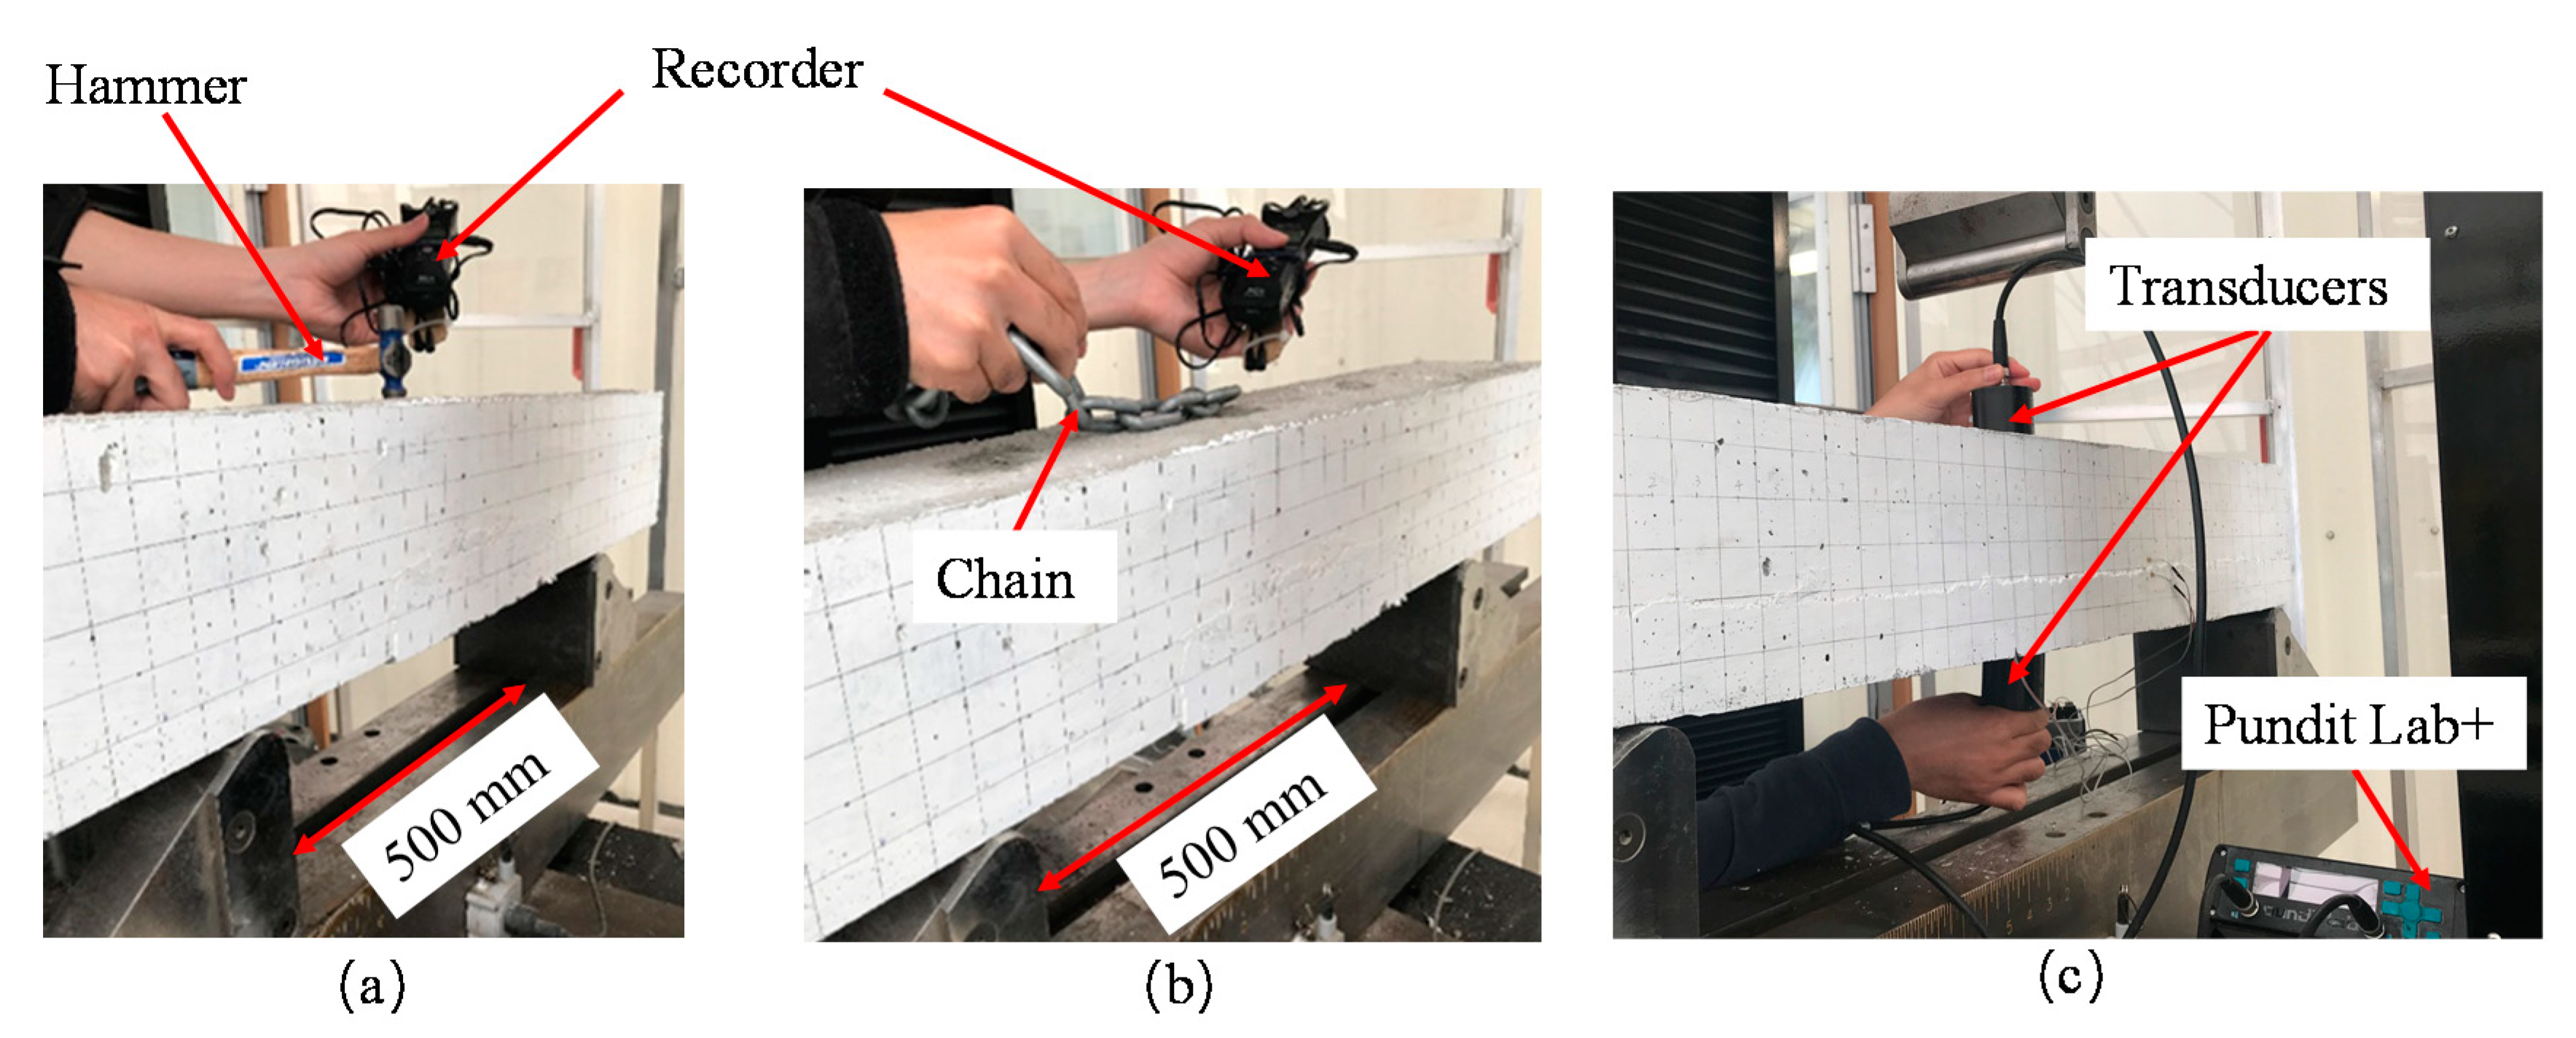
Hammer Percussion Method
Modified Chain Drag Test
Ultrasonic Pulse Velocity (UPV)
3. Results
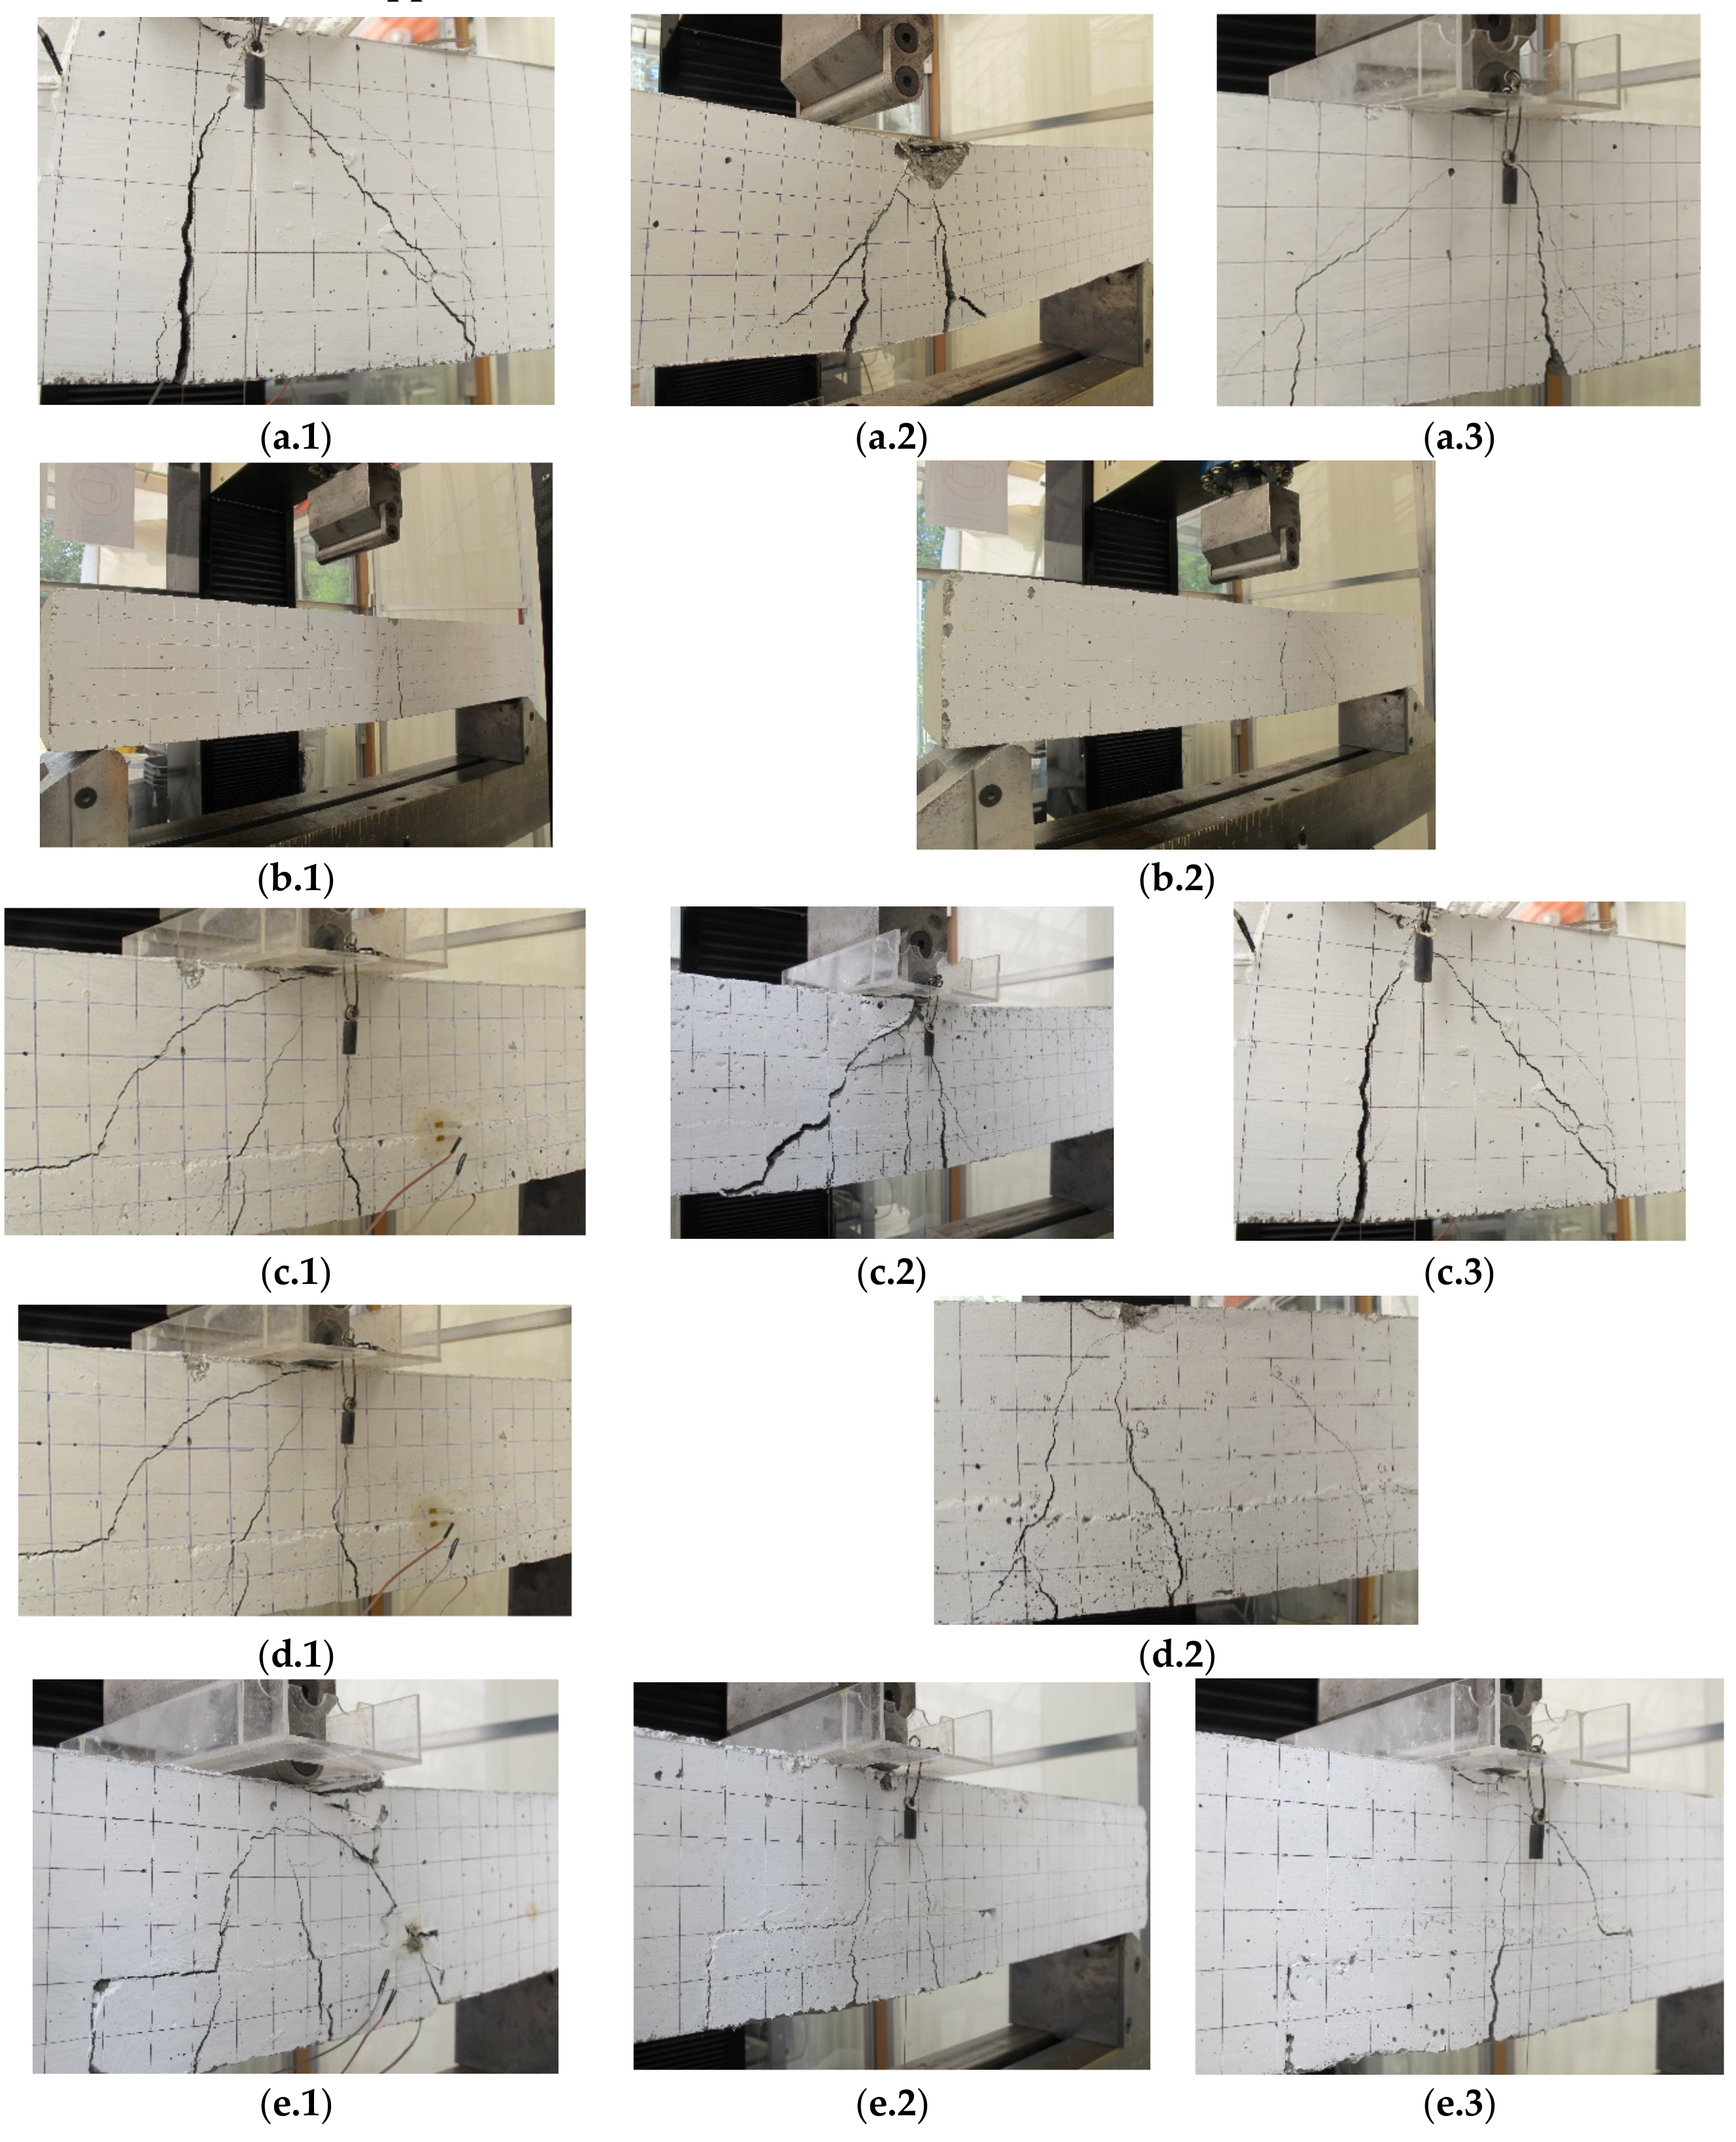
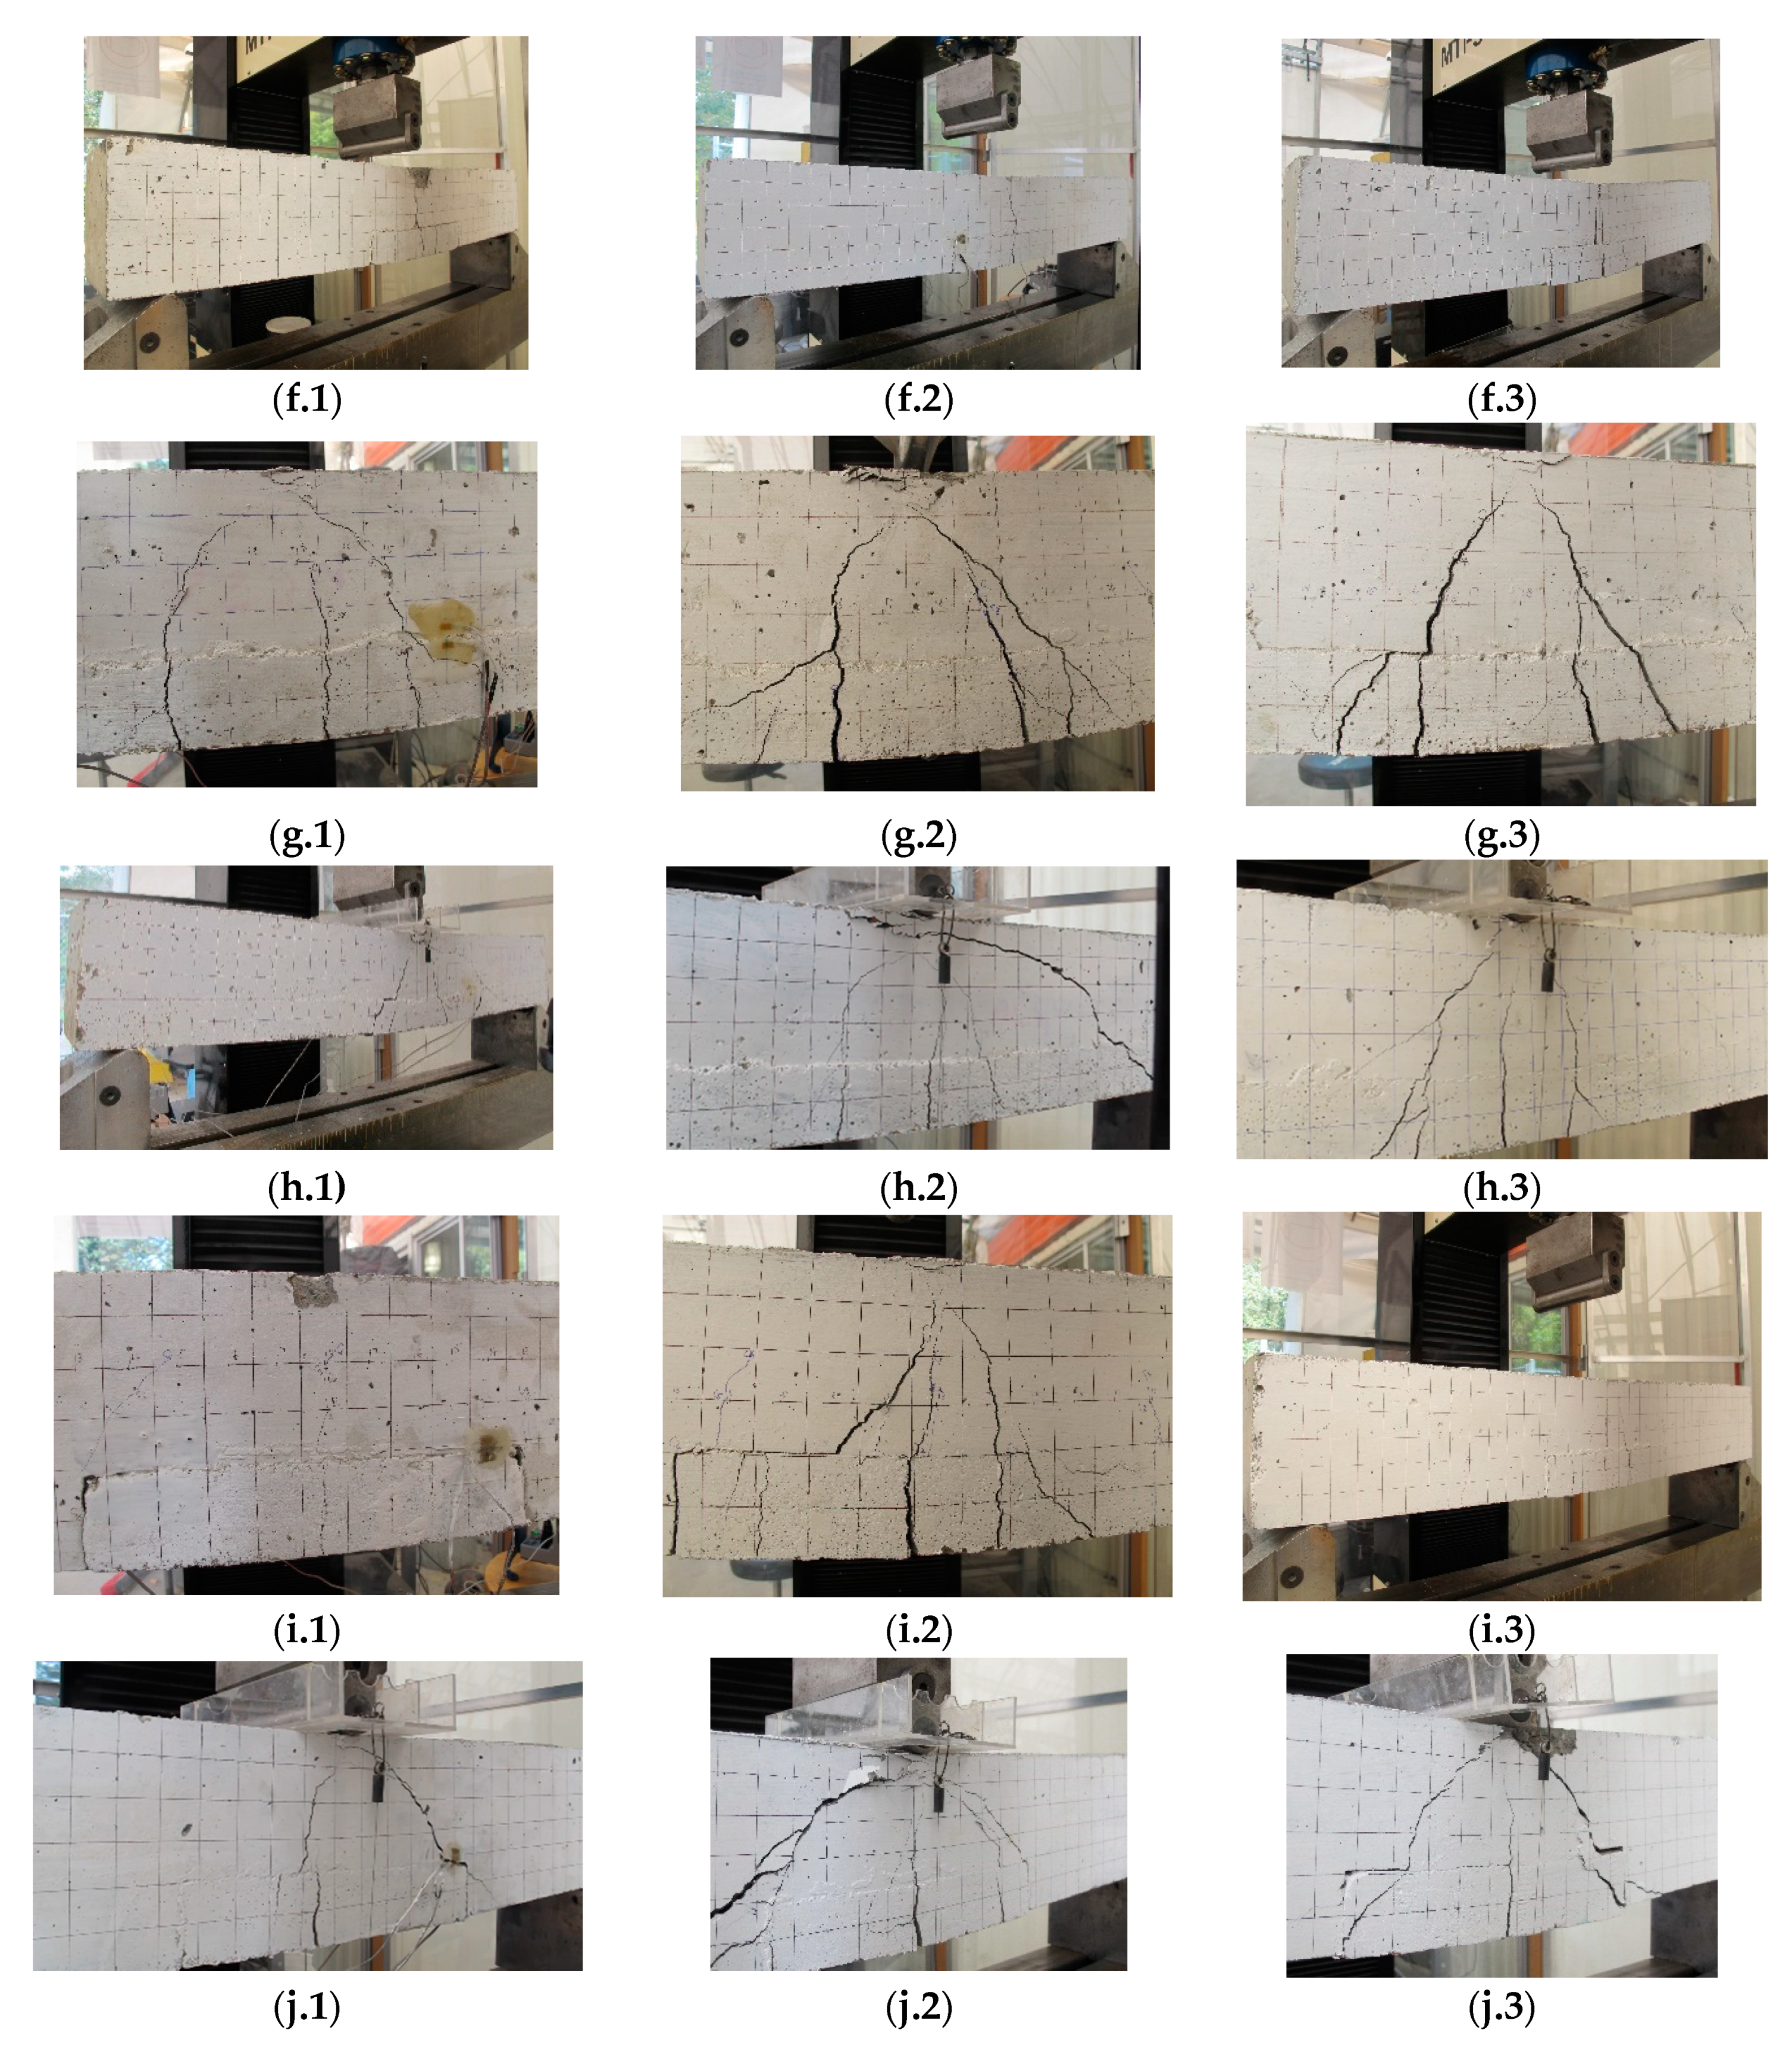
3.1. Failure Mode and Crack Pattern
3.2. Load-Deflection Behavior
3.2.1. RC Beams under Static Load
3.2.2. Beams under Repeated Loading
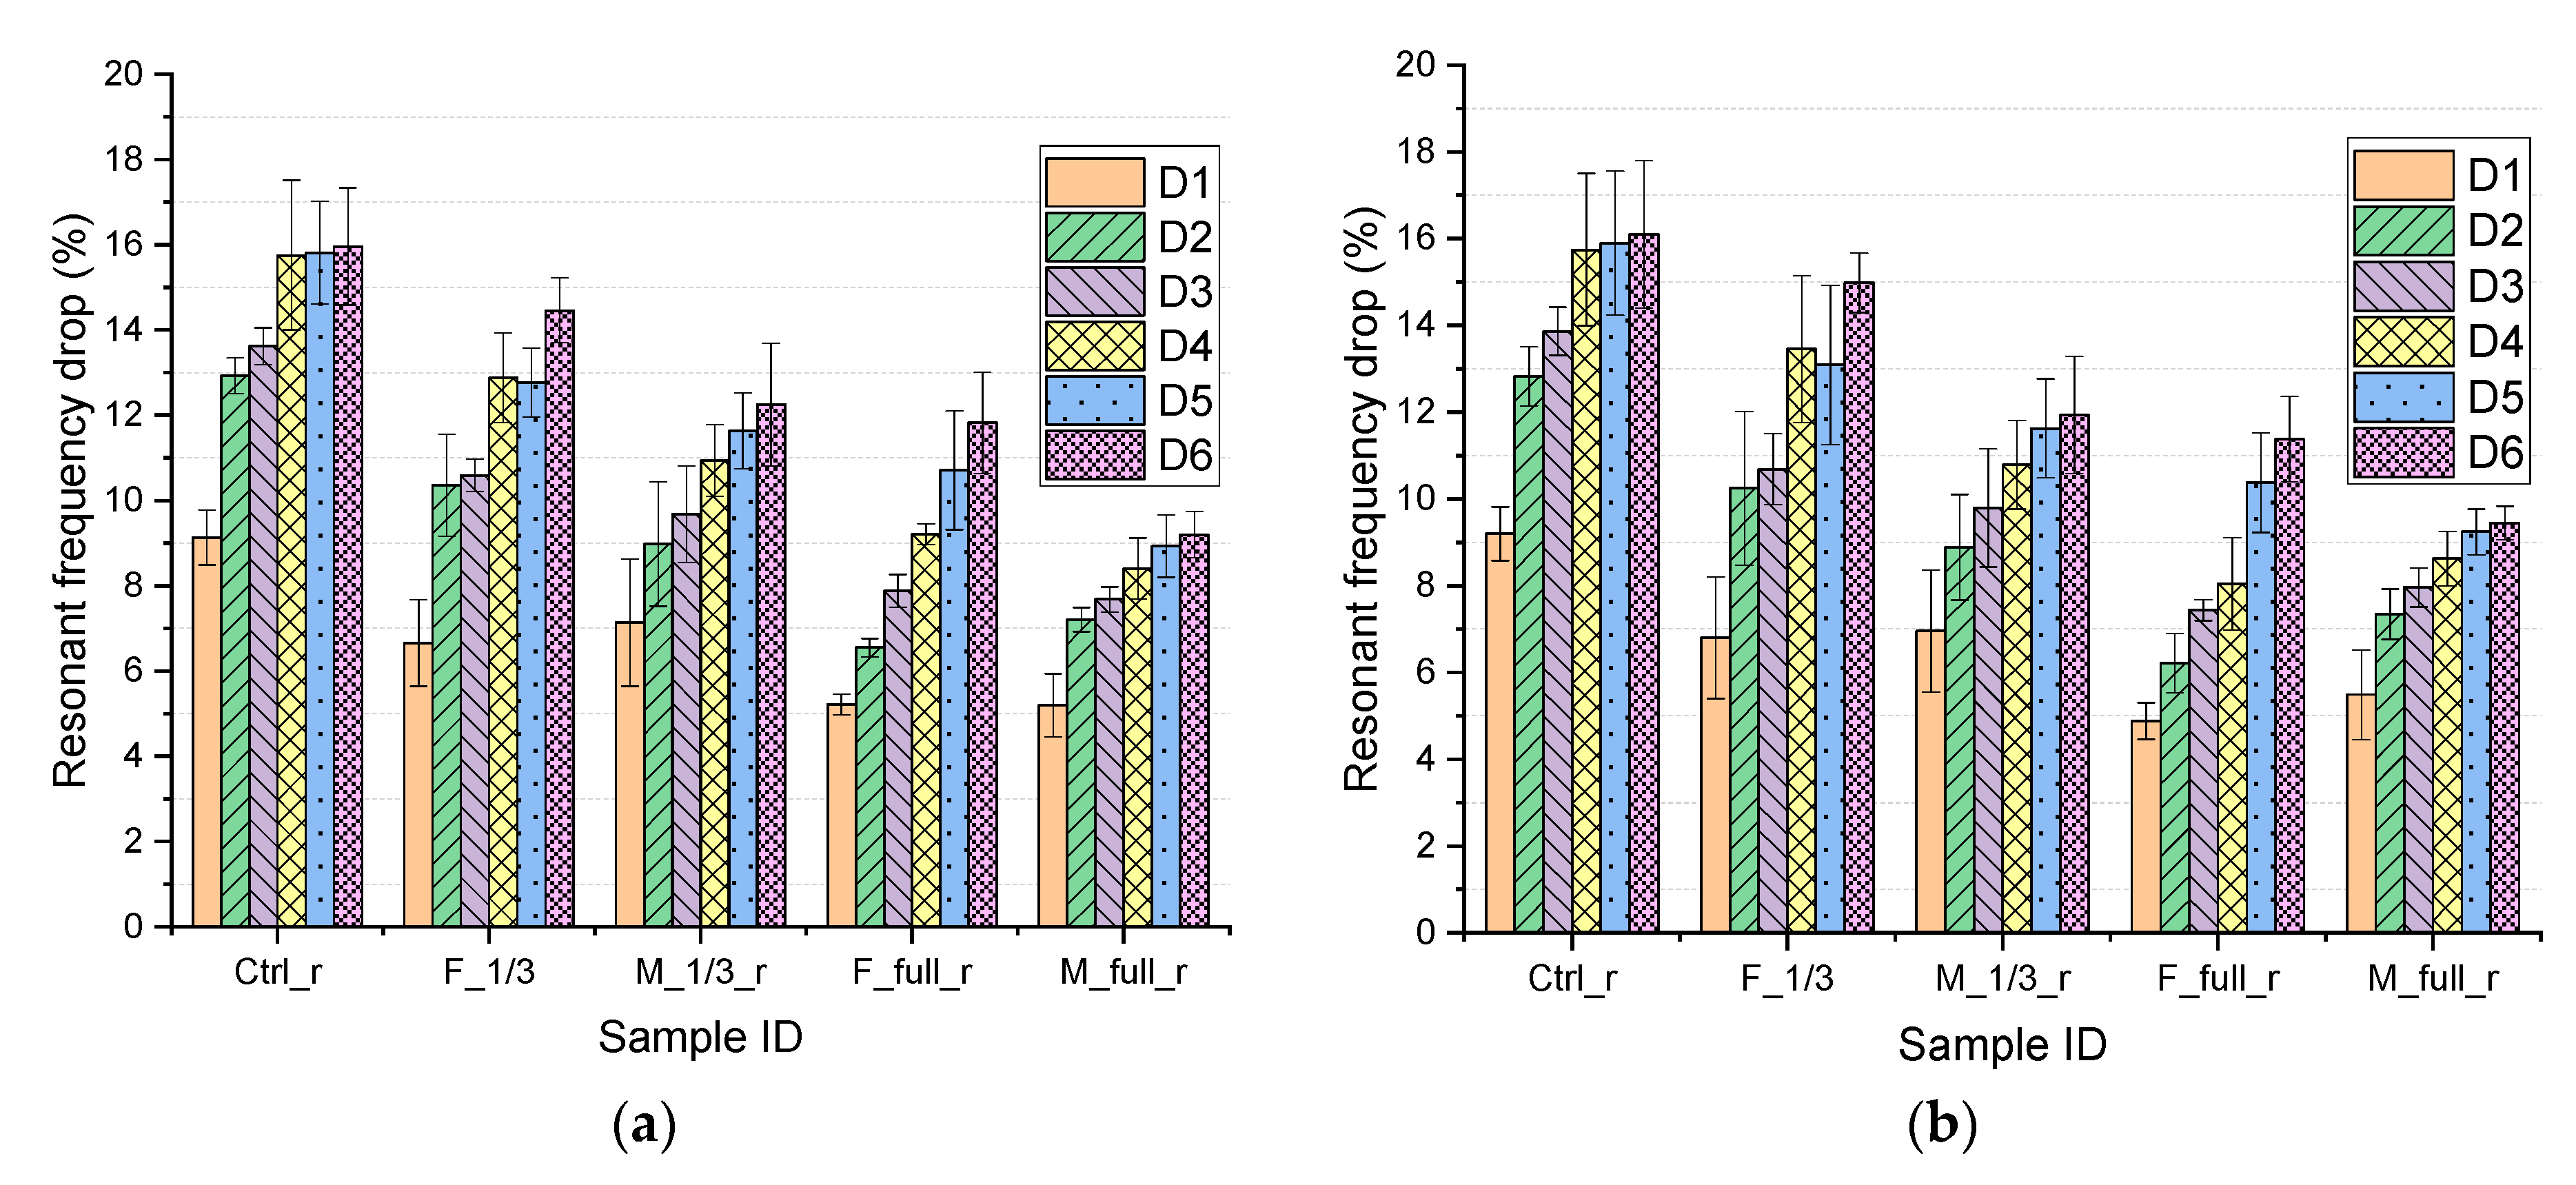
3.3. NDT Results
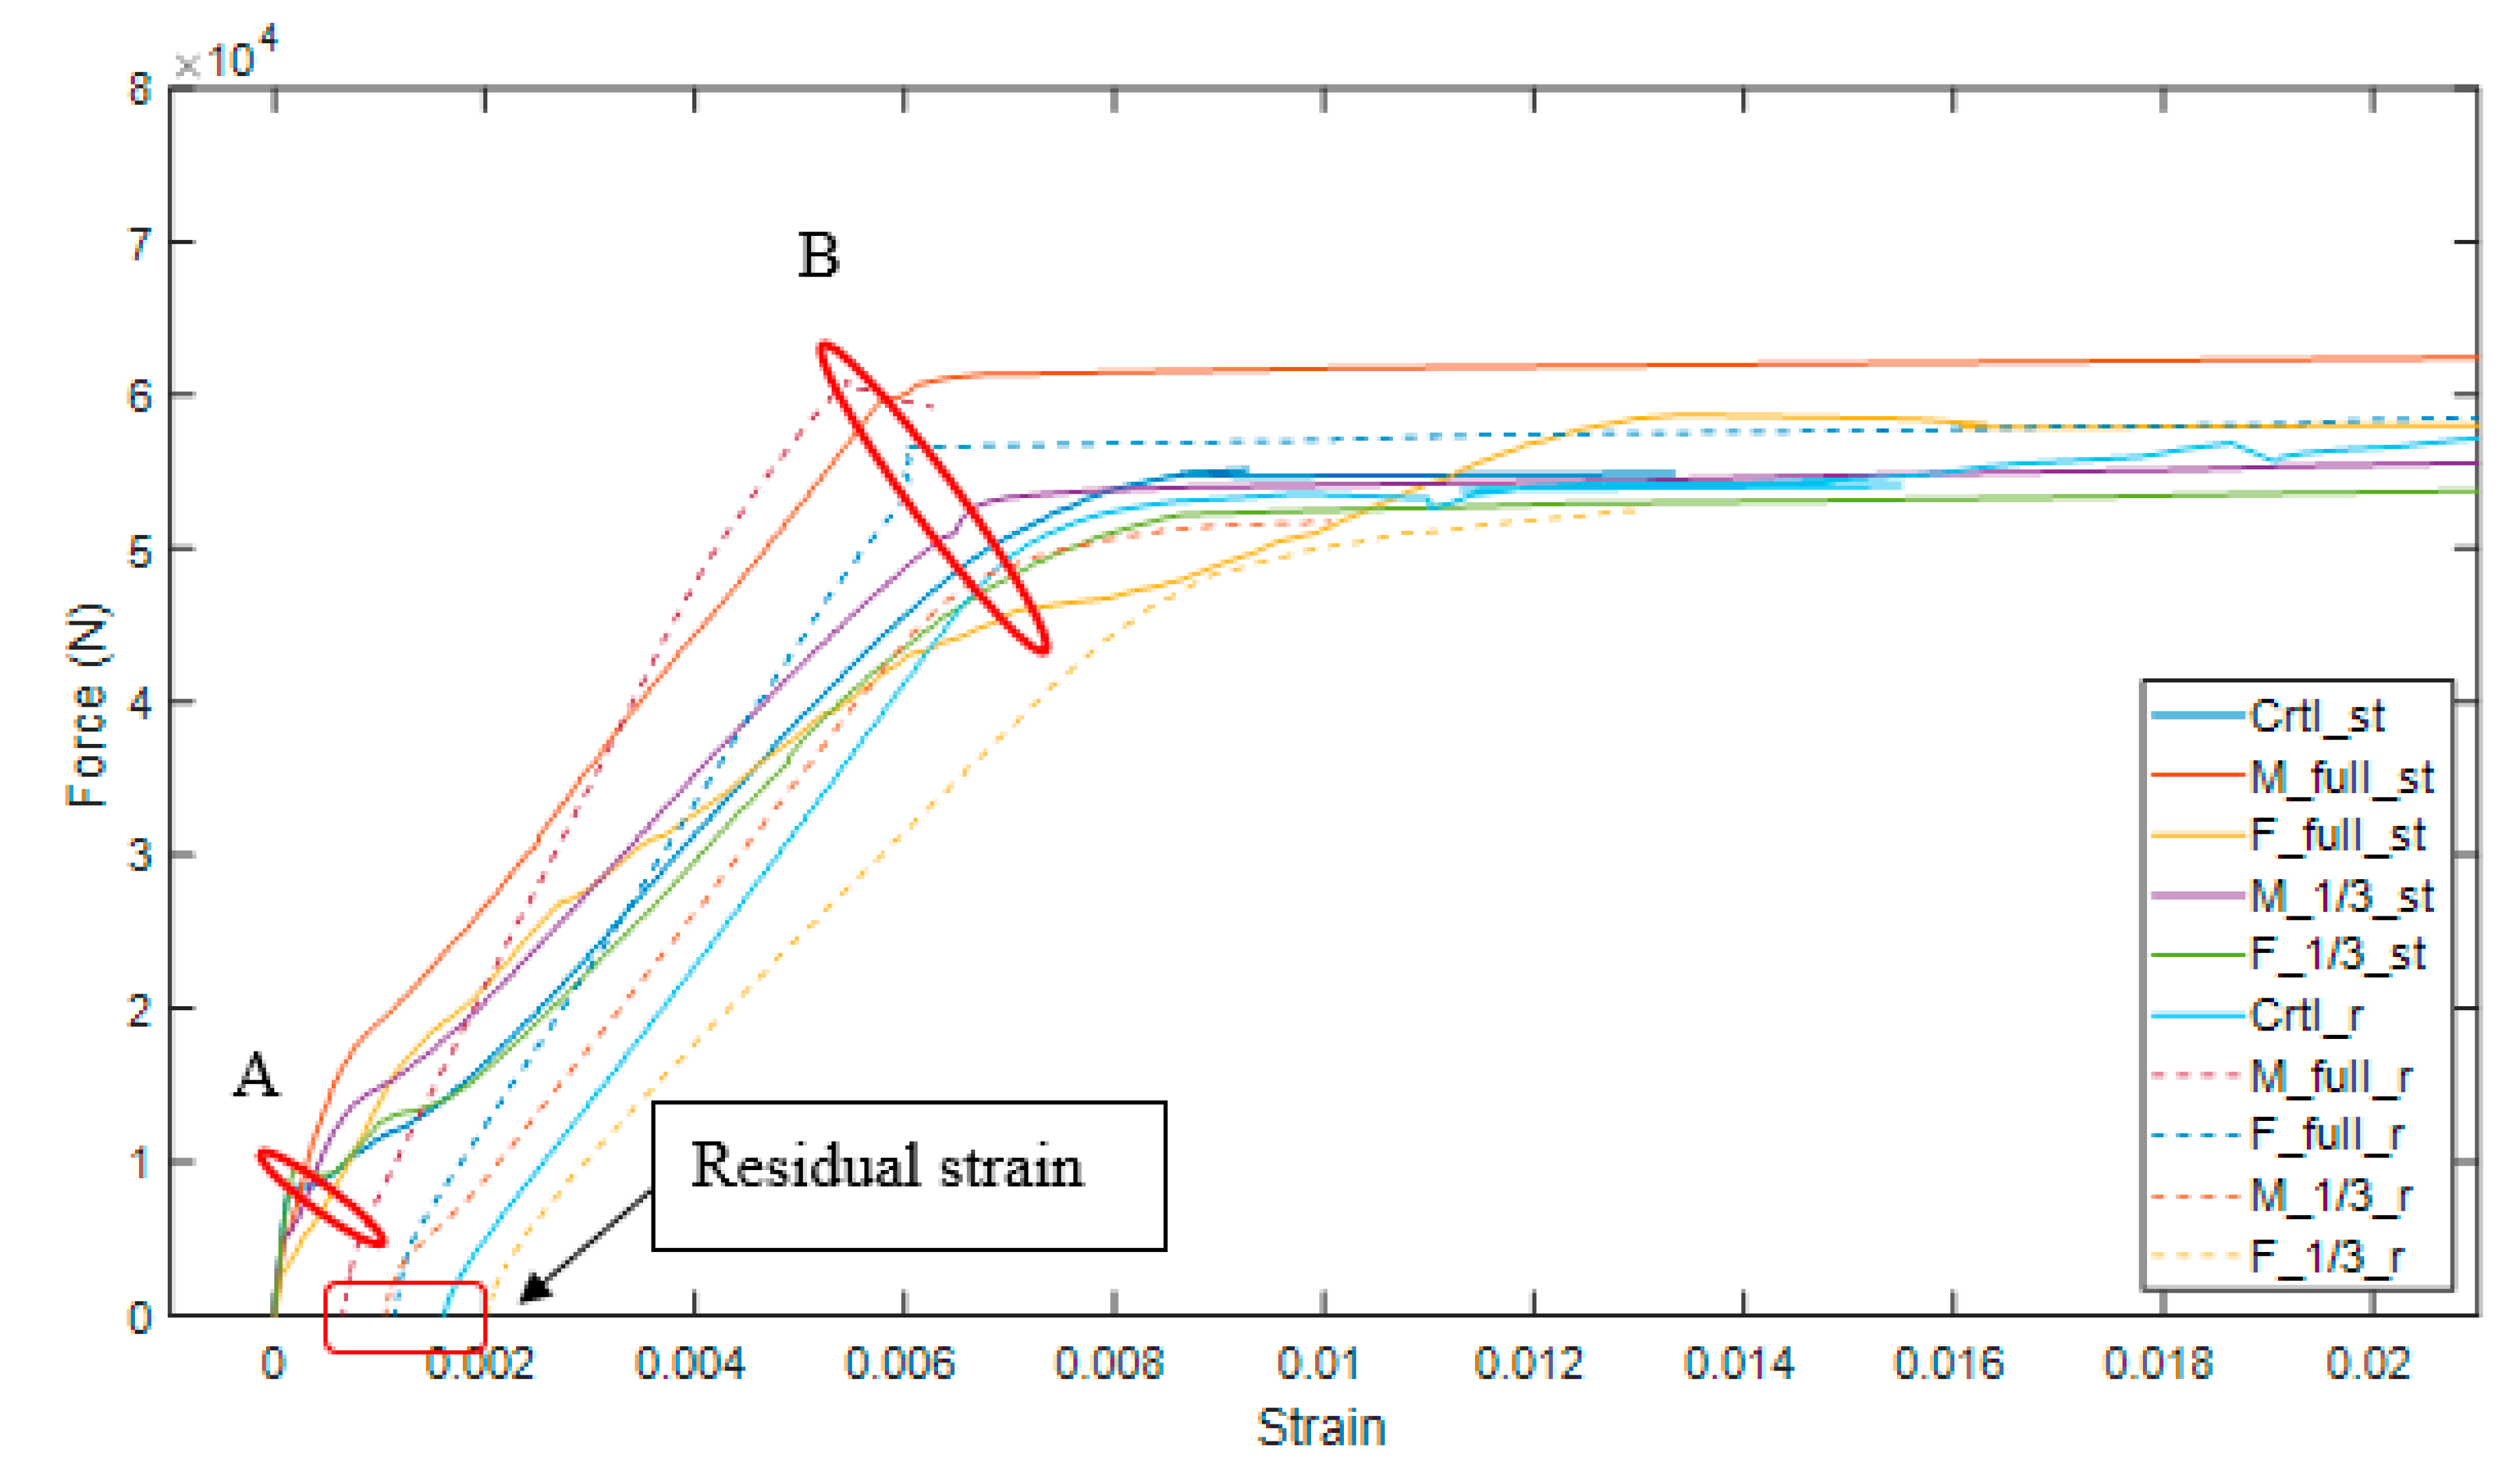
3.4. Load-Strain Relationship
4. Theoretical Analysis of Load-Bearing Capacity
5. Conclusions and Recommendations
- The length of the repair affects the yield strength of repaired RC beams. The beams without vertical concrete-repair interface showed higher yield strength compared to beams having the interfaces.
- The repair material that has higher bond strength and flexural strength is found to be beneficial to a more successful repair under static and repeated loading conditions.
- The hammer percussion and modified chain drag methods are useful methods to detect concrete cracking and accumulated damage by measuring the resonant frequency drop after repeated loading. The resonant frequency drops are well correlated with the destructive test results such as yield strength results.
- The formulas proposed by CSA 23.3 can effectively predict the moment resistance of both intact (control) and repaired RC beams for the geometry studied in this research. The ratio of experimental moment resistance values to its predictions ranges from 0.91 to 1.04. In addition, the formulas proposed by CSA 23.3 can predict cracking moment of control and Mix F-repaired RC beams well.
- This research presents a preliminary study that investigated the performance of repaired RC beams under static and repeated loading conditions. One limitation of the current study is that the sample size of the repaired RC beams is small compared to beams in real structures. Future study will involve repair work and NDT measurements on real structures to validate the results. Moreover, to have a more accurate prediction on structural behavior of repaired RC beams, numerical simulations using Finite Element Method need to be developed for future studies.
Author Contributions
Funding
Data Availability Statement
Acknowledgments
Conflicts of Interest
Appendix A
References
- Chemrouk, M. The Deteriorations of Reinforced Concrete and the Option of High Performances Reinforced Concrete. Procedia Eng. 2015, 125, 713–724. [Google Scholar] [CrossRef]
- Khan, M.I.; Abbass, W. Flexural behavior of high-strength concrete beams reinforced with a strain hardening cement-based composite layer. Constr. Build. Mater. 2016, 125, 927–935. [Google Scholar] [CrossRef]
- Kim, S.-W.; Yun, H.-D. Crack-damage mitigation and flexural behavior of flexure-dominant reinforced concrete beams repaired with strain-hardening cement-based composite. Compos. Part B Eng. 2011, 42, 645–656. [Google Scholar] [CrossRef]
- Hussein, M.; Kunieda, M.; Nakamura, H. Strength and ductility of RC beams strengthened with steel-reinforced strain hardening cementitious composites. Cem. Concr. Compos. 2012, 34, 1061–1066. [Google Scholar] [CrossRef]
- Pellegrino, C.; da Porto, F.; Modena, C. Rehabilitation of reinforced concrete axially loaded elements with polymer-modified cementicious mortar. Constr. Build. Mater. 2009, 23, 3129–3137. [Google Scholar] [CrossRef]
- Geraldo, R.H.; Teixeira, O.G.; Matos, S.R.C.; Silva, F.G.S.; Gonçalves, J.P.; Camarini, G. Study of alkali-activated mortar used as conventional repair in reinforced concrete. Constr. Build. Mater. 2018, 165, 914–919. [Google Scholar] [CrossRef]
- Hou, L.; Wang, J.; Huang, T.; Shen, C.; Aslani, F.; Chen, D. Flexural behaviour of corroded reinforced concrete beams repaired with ultra-high toughness cementitious composite. Constr. Build. Mater. 2019, 211, 1127–1137. [Google Scholar] [CrossRef]
- Ramachandra Murthy, A.; Karihaloo, B.L.; Vindhya Rani, P.; Shanmuga Priya, D. Fatigue behaviour of damaged RC beams strengthened with ultra high performance fibre reinforced concrete. Int. J. Fatigue 2018, 116, 659–668. [Google Scholar] [CrossRef]
- Yu, F.; Zhou, H.; Jiang, N.; Fang, Y.; Song, J.; Feng, C.; Guan, Y. Flexural experiment and capacity investigation of CFRP repaired RC beams under heavy pre-damaged level. Constr. Build. Mater. 2020, 230, 117030. [Google Scholar] [CrossRef]
- Hamrat, M.; Bouziadi, F.; Boulekbache, B.; Daouadji, T.H.; Chergui, S.; Labed, A.; Amziane, S. Experimental and numerical investigation on the deflection behavior of pre-cracked and repaired reinforced concrete beams with fiber-reinforced polymer. Constr. Build. Mater. 2020, 249, 118745. [Google Scholar] [CrossRef]
- Banjara, N.K.; Ramanjaneyulu, K. Investigations on behaviour of flexural deficient and CFRP strengthened reinforced concrete beams under static and fatigue loading. Constr. Build. Mater. 2019, 201, 746–762. [Google Scholar] [CrossRef]
- Qian, J.; You, C.; Wang, Q.; Wang, H.; Jia, X. A method for assessing bond performance of cement-based repair materials. Constr. Build. Mater. 2014, 68, 307–313. [Google Scholar] [CrossRef]
- Ganesh, P.; Ramachandra Murthy, A. Fatigue performance of damaged RC beams rehabilitated with GGBS based ultra high performance concrete. Int. J. Fatigue 2020, 138, 105707. [Google Scholar] [CrossRef]
- Morgan, D.R. Compatibility of concrete repair materials and systems. Constr. Build. Mater. 1996, 10, 57–67. [Google Scholar] [CrossRef]
- Moodi, F.; Kashi, A.; Ramezanianpour, A.A.; Pourebrahimi, M. Investigation on mechanical and durability properties of polymer and latex-modified concretes. Constr. Build. Mater. 2018, 191, 145–154. [Google Scholar] [CrossRef]
- Sadrmomtazi, A.; Khoshkbijari, R.K. Determination and Prediction of Bonding Strength of Polymer Modified Concrete (PMC) as the Repair Overlay on the Conventional Concrete Substrate. KSCE J. Civ. Eng. 2019, 23, 1141–1149. [Google Scholar] [CrossRef]
- Zheng, Y.; Zhou, Y.; Zhou, Y.; Pan, T.; Zhang, Q.; Liu, D. Cracking behavior of reinforced concrete beams strengthened with CFRP anchorage system under cyclic and monotonic loading. Eng. Struct. 2020, 207, 110222. [Google Scholar] [CrossRef]
- Guo, X.; Wang, Y.; Huang, P.; Shu, S. Fatigue behavior of RC beams strengthened with FRP considering the influence of FRP-concrete interface. Int. J. Fatigue 2021, 143, 105977. [Google Scholar] [CrossRef]
- Song, L.; Yu, Z. Fatigue performance of corroded reinforced concrete beams strengthened with CFRP sheets. Constr. Build. Mater. 2015, 90, 99–109. [Google Scholar] [CrossRef]
- Arslan, M.H.; Yazman, Ş.; Hamad, A.A.; Aksoylu, C.; Özkılıç, Y.O.; Gemi, L. Shear strengthening of reinforced concrete T-beams with anchored and non-anchored CFRP fabrics. In Structures; Elsevier: Amsterdam, The Netherlands, 2022; Volume 39, pp. 527–542. [Google Scholar]
- Li, X.; Wang, J.; Bao, Y.; Chen, G. Cyclic behavior of damaged reinforced concrete columns repaired with high-performance fiber-reinforced cementitious composite. Eng. Struct. 2017, 136, 26–35. [Google Scholar] [CrossRef]
- Von Fay, K.F. Guide to Concrete Repair; U.S. Department of the Interior, Bureau of Reclamation, Technical Service Center: Denver, CO, USA, 2015. [Google Scholar]
- Safdar, M.; Matsumoto, T.; Kakuma, K. Flexural behavior of reinforced concrete beams repaired with ultra-high performance fiber reinforced concrete (UHPFRC). Compos. Struct. 2016, 157, 448–460. [Google Scholar] [CrossRef]
- Teixeira, O.G.; Geraldo, R.H.; da Silva, F.G.; Gonçalves, J.P.; Camarini, G. Mortar type influence on mechanical performance of repaired reinforced concrete beams. Constr. Build. Mater. 2019, 217, 372–383. [Google Scholar] [CrossRef]
- Fan, W.; Qiao, P. Vibration-based Damage Identification Methods: A Review and Comparative Study. Struct. Health Monit. 2011, 10, 83–111. [Google Scholar] [CrossRef]
- Shariq, M.; Prasad, J.; Masood, A. Studies in ultrasonic pulse velocity of concrete containing GGBFS. Constr. Build. Mater. 2013, 40, 944–950. [Google Scholar] [CrossRef]
- Hou, R.; Xia, Y. Review on the new development of vibration-based damage identification for civil engineering structures: 2010–2019. J. Sound Vib. 2021, 491, 115741. [Google Scholar] [CrossRef]
- Capozucca, R. A reflection on the application of vibration tests for the assessment of cracking in PRC/RC beams. Eng. Struct. 2013, 48, 508–518. [Google Scholar] [CrossRef]
- Capozucca, R. Vibration analysis of damaged RC beams strengthened with GFRP. Compos. Struct. 2018, 200, 624–634. [Google Scholar] [CrossRef]
- Shah, S.G.; Ray, S.; Chandra Kishen, J.M. Fatigue crack propagation at concrete–concrete bi-material interfaces. Int. J. Fatigue 2014, 63, 118–126. [Google Scholar] [CrossRef]
- Wang, B.; Gupta, R. Performance of Repaired Concrete under Cyclic Flexural Loading. Materials 2021, 14, 1363. [Google Scholar] [CrossRef]
- Wang, B.; Gupta, R. Analyzing bond-deterioration during freeze-thaw exposure in cement-based repairs using non-destructive methods. Cem. Concr. Compos. 2021, 115, 103830. [Google Scholar] [CrossRef]
- ASTM C494/C494M-19; International. Standard Specification for Chemical Admixtures for Concrete. ASTM International: West Conshohocken, PA, USA, 2019. [CrossRef]
- ASTM C260/C260M-10a(2016); Standard Specification for Air-Entraining Admixtures for Concrete. ASTM International: West Conshohocken, PA, USA, 2016. [CrossRef]
- ASTM C231/C231M-17a; Standard Test Method for Air Content of Freshly Mixed Concrete by the Pressure Method. ASTM International: West Conshohocken, PA, USA, 2022. [CrossRef]
- ASTM C143/C143M-15a; Standard Test Method for Slump of Hydraulic-Cement Concrete. ASTM International: West Conshohocken, PA, USA, 2020. [CrossRef]
- ASTM C39/C39M-18; Standard Test Method for Compressive Strength of Cylindrical Concrete Specimens. ASTM International: West Conshohocken, PA, USA, 2020. [CrossRef]
- Wang, B.; Gupta, R. Correlation of Electrical Conductivity, Compressive Strength, and Permeability of Repair Materials. Mater. J. 2020, 117, 53–63. [Google Scholar] [CrossRef]
- Bajaj, R.; Wang, B.; Gupta, R. Characterization of Enhanced ITZ in Engineered Polypropylene Fibers for Bond Improvement. J. Compos. Sci. 2020, 4, 53. [Google Scholar] [CrossRef]
- Winkler, P. Selecting and Specifying Concrete Surface Preparation for Sealers, Coatings, Polymer Overlays, and Concrete Repair; Internation Concrete Repair Institute: St. Paul, MN, USA, 2013; Available online: https://store.icri.org/item/3102r2013-english-pdf-selecting-concrete-surface-preparation-sealers-coatings-polymer-overlays-concrete-repair-342521 (accessed on 20 August 2022).
- ASTM C31/C31M-21a; Standard Practice for Making and Curing Concrete Test Specimens in the Field. ASTM International: West Conshohocken, PA, USA, 2021. Available online: http://www.astm.org/cgi-bin/resolver.cgi?C31C31M-21a (accessed on 20 August 2022).
- ASTM D4580/D4580M-12(2018); Standard Practice for Measuring Delaminations in Concrete Bridge Decks by Sounding. ASTM International: West Conshohocken, PA, USA, 2018. [CrossRef]
- ASTM C597-16; Standard Test Method for Pulse Velocity Through Concrete. ASTM International: West Conshohocken, PA, USA, 2016. [CrossRef]
- Blaney, S.; Gupta, R. Sounding of subsurface concrete defects using frequency response of flexural vibration. Cem. Concr. Compos. 2018, 92, 155–164. [Google Scholar] [CrossRef] [Green Version]
- Capozucca, R.; Magagnini, E. RC beam models damaged and strengthened with GFRP strips under bending loading and free vibration. Compos. Struct. 2020, 253, 112730. [Google Scholar] [CrossRef]
- Lacidogna, G.; Piana, G.; Carpinteri, A. Damage monitoring of three-point bending concrete specimens by acoustic emission and resonant frequency analysis. Eng. Fract. Mech. 2019, 210, 203–211. [Google Scholar] [CrossRef]
- Zhang, Y.; Li, X.; Zhu, Y.; Shao, X. Experimental study on flexural behavior of damaged reinforced concrete (RC) beam strengthened by toughness-improved ultra-high performance concrete (UHPC) layer. Compos. Part B Eng. 2020, 186, 107834. [Google Scholar] [CrossRef]
- Canadian Standards Association (CSA). CSA A23.3-04: Design of Concrete Structures; Canadian Standards Association (CSA): Toronto, ON, USA, 2003. [Google Scholar]


| Mix ID | Cement | Sand | Gravel | Superplasticizer | AEA a | Water |
|---|---|---|---|---|---|---|
| Mix S | 450 | 762 | 1053 | 2.25 | 2.25 | 182.7 |
| Mix | Hardened | Air Content (%) | Setting Time (Min) | w/m Ratio | Slump (mm) | Slant Shear Bond (MPa) | Splitting Tensile Bond (MPa) | ||
|---|---|---|---|---|---|---|---|---|---|
| Mix S | 2300 | 3 | 90 | 0.08 | 60 | * | * | ||
| Mix M | 2325 | 5.0 | 75 | 0.09 | 70 | ||||
| Mix F | 2374 | 5.1 | * | 0.1 | 80 |
| Sample ID | Repair Materials | Repair Length | Loading Protocols | Number of RC Beams |
|---|---|---|---|---|
| Ctrl_st | None | Intact | Static/ | 3 |
| Ctrl_r | None | Intact | Repeated loading | 3 |
| F_1/3_st | Mix F | 1/3 span | Static | 3 |
| F_1/3_r | Mix F | 1/3 span | Repeated loading | 3 |
| F_full_st | Mix F | Full length | Static | 3 |
| F_full_r | Mix F | Full length | Repeated loading | 3 |
| M_1/3_st | Mix M | 1/3 span | Static | 3 |
| M_1/3_r | Mix M | 1/3 span | Repeated loading | 3 |
| M_full_st | Mix M | Full length | Static | 3 |
| M_full_r | Mix M | Full length | Repeated loading | 3 |
| Mix ID | Sample | Vertical Bond Failure Initiation Stage | Horizontal Bond Failure Initiation Stage |
|---|---|---|---|
| M_1/3_r | 1 | None | |
| 2 | None | ||
| 3 | None | ||
| F_full_r | 1 | Not applicable | |
| 2 | Not applicable | ||
| 3 | Not applicable | ||
| F_1/3_r | 1 | ||
| 2 | |||
| 3 | None | ||
| M_full_r | 1 | Not applicable | None |
| 2 | Not applicable | None | |
| 3 | Not applicable | None |
| Accumulative Crack Length in mm (Including Interfacial Cracks) | |||||||
|---|---|---|---|---|---|---|---|
| Mix ID | Sample | ||||||
| M_1/3_r | 1 | 80 | 105 | 116 | 301 | 407 | 452 |
| 2 | 0 | 50 | 85 | 236 | 354 | 420 | |
| 3 | 0 | 32 | 32 | 132 | 240 | 367 | |
| F_full_r | 1 | 29 | 86 | 229 | 360 | 460 | 485 |
| 2 | 0 | 85 | 199 | 310 | 486 | 556 | |
| 3 | 0 | 0 | 136 | 271 | 520 | 591 | |
| F_1/3_r | 1 | 53 | 140 | 226 | 292 | 344 | 470 |
| 2 | 92 | 203 | 235 | 346 | 462 | 519 | |
| 3 | 54 | 162 | 218 | 288 | 423 | 493 | |
| M_full_r | 1 | 29 | 102 | 201 | 226 | 252 | 350 |
| 2 | 0 | 40 | 80 | 116 | 158 | 249 | |
| 3 | 0 | 0 | 82 | 262 | 298 | 397 | |
| Ctrl_r | 1 | 187 | 200 | 290 | 370 | 423 | 538 |
| 2 | 205 | 267 | 319 | 462 | 586 | 610 | |
| 3 | 133 | 211 | 299 | 372 | 408 | 503 | |
| Yield Load (N) | Resonant Frequency (Hz) | UPV through Repair Sections | ||
|---|---|---|---|---|
| Hammer Percussion | Modified Chain Drag | |||
| Ctrl_st | ||||
| F_1/3_st | ||||
| F_full_st | ||||
| M_1/3_st | ||||
| M_full_st | ||||
| Yield Load (N) | |
|---|---|
| Ctrl_r | |
| F_1/3_r | |
| F_full_r | |
| M_1/3_r | |
| M_full_r |
| Sample ID | Moment Resistance | First Cracking Moment | ||||
|---|---|---|---|---|---|---|
| Ctrl_st | 11.1 | 11.4 | 0.98 | 2.4 | 2.7 | 0.89 |
| F_1/3_st | 10.6 | 11.4 | 0.93 | 2.7 | 2.8 | 0.96 |
| F_full_st | 11.5 | 11.4 | 1.01 | 2.7 | 2.8 | 0.96 |
| M_1/3_st | 10.4 | 11.4 | 0.91 | 2.8 | 3.9 | 0.72 |
| M_full_st | 11.9 | 11.4 | 1.04 | 3.1 | 3.9 | 0.79 |
Publisher’s Note: MDPI stays neutral with regard to jurisdictional claims in published maps and institutional affiliations. |
© 2022 by the authors. Licensee MDPI, Basel, Switzerland. This article is an open access article distributed under the terms and conditions of the Creative Commons Attribution (CC BY) license (https://creativecommons.org/licenses/by/4.0/).
Share and Cite
Wang, B.; Gupta, R. Evaluating Flexural Performance of Repaired Reinforced Concrete Beams under Static and Repeated Loading Using Non-Destructive Methods. Materials 2022, 15, 6276. https://doi.org/10.3390/ma15186276
Wang B, Gupta R. Evaluating Flexural Performance of Repaired Reinforced Concrete Beams under Static and Repeated Loading Using Non-Destructive Methods. Materials. 2022; 15(18):6276. https://doi.org/10.3390/ma15186276
Chicago/Turabian StyleWang, Boyu, and Rishi Gupta. 2022. "Evaluating Flexural Performance of Repaired Reinforced Concrete Beams under Static and Repeated Loading Using Non-Destructive Methods" Materials 15, no. 18: 6276. https://doi.org/10.3390/ma15186276
APA StyleWang, B., & Gupta, R. (2022). Evaluating Flexural Performance of Repaired Reinforced Concrete Beams under Static and Repeated Loading Using Non-Destructive Methods. Materials, 15(18), 6276. https://doi.org/10.3390/ma15186276