
Properties of Na0.5Bi0.5TiO3 Ceramics Modified with Fe and Mn

 , , , , , ,
Abstract
:1. Introduction
2. Materials and Methods
3. Results and Discussion
4. Conclusions
Author Contributions
Funding
Acknowledgments
Conflicts of Interest
References
- Park, S.E.; Shrout, T.R. Ultrahigh strain and piezoelectric behavior in relaxor based ferroelectric single crystals. J. Appl. Phys. 1997, 82, 1804–1811. [Google Scholar] [CrossRef]
- Sitko, R.; Zawisza, B.; Jurczyk, J.; Bochenek, D.; Płońska, M. Multielement XRF semimicroanalysis of Pb(Zr,Ti)O3 type ferroelectric ceramic materials doped with Pb(Nb,Mn)O3 and Bi2O3 by the thin layer method. Microchim. Acta 2004, 144, 9–15. [Google Scholar] [CrossRef]
- Skulski, R.; Wawrzała, P.; Ćwikiel, K.; Bochenek, D. Dielectric and electromechanical behaviors of PMN-PT ceramic samples. J. Intell. Mater. Syst. Struct. 2007, 18, 1049–1056. [Google Scholar] [CrossRef]
- Wang, C.; Xia, T.; Lou, X.; Tian, S. Giant strain response in 2 mol% Nb doped (Bi0.5Na0.4K0.1)TiO3 lead-free ceramics. J. Mat. Sci. 2017, 52, 11337–11342. [Google Scholar] [CrossRef]
- Suchanicz, J.; Mercurio, J.P.; Konieczny, K. Electric properties of (Na0.5Bi0.5)0.86Ba0.14TiO3 single crystal. Ferroelectrics 2002, 268, 357–362. [Google Scholar] [CrossRef]
- Kreisel, J.; Bouvier, P.; Dkhil, B.; Thomas, P.A.; Glazer, A.M.; Welburry, T.R.; Chaabane, B.; Mezour, M. High-pressure x-ray scattering of oxides with a nanoscale local structure: Application to Na0.5Bi0.5TiO3. Phys. Rev. 2003, B68, 014113. [Google Scholar] [CrossRef]
- Trolliard, G.; Dorcet, V. Reinvestigation of phase transitions in Na0.5Bi0.5TiO3 by TEM. Part II: Second order orthorhombic to tetragonal phase transition. Chem. Mater. 2008, 20, 5074–5082. [Google Scholar] [CrossRef]
- Suchanicz, J.; Kluczewska, K.; Czaja, P.; Handke, B.; Sokolowski, M.; Węgrzyn, A.; Stachowski, G. Influence of sintering conditions on structural, thermal, electric and ferroelectric properties of Na0.5Bi0.5TiO3 ceramics. Phase Transit. 2018, 91, 26–37. [Google Scholar] [CrossRef]
- Suchanicz, J.; Kluczewska, K.; Czaja, P.; Kania, A.; Konieczny, K.; Handke, B.; Sokolowski, M.; Trubitsyn, M.P.; Kruzina, T.V. The influence of electric poling on structural, thermal, dielectric and ferroelectric properties of Na0.5Bi0.5TiO3 ceramics. Ceram. Int. 2017, 43, 17194–17201. [Google Scholar] [CrossRef]
- Reshetnikova, E.A.; Lisnevskay, I.V.; Zalyubovskaya, E.A.; Butova, V.V.; Soldatov, A.V. The Effect of Hydrothermal Synthesis Parameters on the Formation of Sodium Bismuth Titanate. Comments Inorg. Chem. 2020, 40, 314–326. [Google Scholar] [CrossRef]
- Reshetnikova, E.A.; Lisnevskaya, I.V.; Terekhin, A.I. Hydrothermal Synthesis of Sodium Bismuth Titanate Ferroelectrics. Inorg. Mater. 2020, 56, 83–90. [Google Scholar] [CrossRef]
- Dong, N.; Gao, X.; Xia, F.; Liu, H.; Hao, H.; Zhang, S. Dielectric and Piezoelectric Properties of Textured Lead-Free Na0.5Bi0.5TiO3-Based Ceramics. Crystals 2019, 9, 206. [Google Scholar] [CrossRef]
- Zhang, H.; Wang, Y.; Wang, H.; Huo, D.; Tan, W. Room-temperature magnetoresistive and magnetocaloric effect in La1−xBaxMnO3 compounds: Role of Griffiths phase with ferromagnetic metal cluster above Curie temperature. J. Appl. Phys. 2022, 131, 043901. [Google Scholar] [CrossRef]
- Hiruma, Y.; Nagata, H.; Takenaka, T. Thermal depoling process and piezoelectric properties of bismuth sodium titanate ceramics. J. Appl. Phys. 2009, 105, 084112. [Google Scholar] [CrossRef]
- Goupil, F.L.; Alford, N.M.N. Upper limit of the electrocaloric peak in lead-free ferroelectric relaxor ceramics. APL Mater. 2016, 4, 064104. [Google Scholar] [CrossRef]
- Jo, W.; Schaab, S.; Sapper, E.; Schmitt, L.A.; Kleebe, H.-J.; Bell, A.J.; Rödel, J. On the phase identity and its thermal evolution of lead free (Bi1/2Na1/2)TiO3-6 mol% BaTiO3. J. Appl. Phys. 2011, 110, 074106. [Google Scholar] [CrossRef]
- Vakhrushev, S.B.; Isupov, V.A.; Kvyatkovsky, B.E.; Okuneva, N.M.; Pronin, I.P.; Smolensky, G.A.; Syrnikov, P.P. Phase transitions and soft modes in sodium bismuth titanate. Ferroelectrics 1985, 63, 153–160. [Google Scholar] [CrossRef]
- Suchanicz, J.; Roleder, K.; Kania, A.; Handerek, J. Elektrostrictive Strain and Pyroeffect in the Region of Phase Coexistence in Na0.5Bi0.5TiO3. Ferroelectrics 1988, 77, 107–110. [Google Scholar] [CrossRef]
- Ge, W.; Li, J.; Viehland, D.; Luo, H. Influence of Mn doping on the structure and properties of Na0.5Bi0.5TiO3 single crystals. J. Am. Ceram. Soc. 2010, 93, 1372–1377. [Google Scholar] [CrossRef]
- Aksel, E.; Erdem, E.; Jakes, P.; Jones, J.L.; Eichel, R.A. Defect structure and materials hardening in Fe2O3-doped Na0.5Bi0.5TiO3 ferroelectrics. Appl. Phys. Lett. 2010, 97, 012903. [Google Scholar] [CrossRef]
- Davies, M.; Aksel, E.; Jones, J.L. Enhanced high-temperature piezoelectric coefficients and thermal stability of Fe- and Mn-substituted Na0.5Bi0.5TiO3 ceramics. J. Am. Ceram. Soc. 2011, 94, 1314–1316. [Google Scholar] [CrossRef]
- Ruth, D.E.J.; Rahman, R.A.U.; Dhamodarn, M.; Lakshmanan, V.; Balasubramanian, S.; Schmid-Beurmann, P.; Zhou, P.; Srinivasan, G.; Ramaswamy, M. Room temperature magnetoelectric coupling in Fe-doped sodium bismuth titanate ceramics. J. Alloy Compd. 2020, 830, 154679. [Google Scholar] [CrossRef]
- Suchanicz, J.; Wąs, M.; Nowakowska-Malczyk, M.; Jelen, P.; Konieczny, K.; Czaja, P.; Kluczewska-Chmielarz, K.; Sitko, D.; Kruzina, T.V.; Sokolowski, M. Electric properties of Fe-doped Na0.5Bi0.5TiO3 ceramics in unpoled and poled state. Phase Transit. 2020, 93, 877–882. [Google Scholar] [CrossRef]
- Suchanicz, J.; Wąs, M.; Nowakowska-Malczyk, M.; Handke, B.; Bik, M.; Konieczny, K.; Czaja, P.; Kluczewska-Chmielarz, K.; Sitko, D.; Sokolowski, M. Electric properties of Mn-substituted Na0.5Bi0.5TiO3 ceramics in unpoled and poled state. Phase Transit. 2020, 93, 1114–1122. [Google Scholar] [CrossRef]
- Wang, Y.; Xu, G.; Yang, L.; Ren, Z.; Wei, X.; Weng, W.; Du, P.; Shen, G.; Han, G. Room-temperature ferromagnetism in Fe-doped Na0.5Bi0.5TiO3 crystals. Mater. Sci. 2009, 27, 471–476. Available online: https://www.materialsscience.pwr.wroc.pl/bi/vol27no2/articles/ms_12_12wang_2008_327.pdf (accessed on 5 September 2022).
- Feng, C.; Yang, C.H.; Sui, H.T.; Geng, F.J.; Han, Y.J. Effect of Fe doping on the crystallization and electrical properties of Na0.5Bi0.5TiO3 thin film. Ceram. Int. 2015, 41, 4214–4217. [Google Scholar] [CrossRef]
- Steiner, S.; Seo, I.-T.; Ren, P.; Li, M.; Keeble, D.J.; Frömling, T. The effect of Fe-acceptor doping on the electrical properties of Na1/2Bi1/2TiO3 and 0.94 (Na1/2Bi1/2)TiO3–0.06 BaTiO3. J. Am. Ceram. Soc. 2019, 102, 5295–5304. [Google Scholar] [CrossRef]
- Dung, D.D.; Doan, N.B.; Dung, N.Q.; Linh, N.H.; Bac, L.H.; Thanh, L.T.H.; Trung, N.N.; Duc, N.V.; Cuong, L.V.; Thiet, D.V.; et al. Tunable Magnetism of Na0.5Bi0.5TiO3 Materials via Fe, Defects. J. Supercond. Nov. Magn. 2019, 32, 3011–3018. [Google Scholar] [CrossRef]
- Thanh, L.T.H.; Doan, N.B.; Bac, L.H.; Thiet, D.V.; Cho, S.; Bao, P.Q.; Dung, D.D. Making room-temperature ferromagnetism in lead-free ferroelectric Bi0.5Na0.5TiO3 material. Mater. Lett. 2017, 186, 239–242. [Google Scholar] [CrossRef]
- Wiles, D.B.; Young, R.A. A new computer program for Rietveld analysis of X-ray powder diffraction patterns. J. Appl. Crystallogr. 1981, 14, 149–151. [Google Scholar] [CrossRef]
- Kania, A. Dielectric properties of Ag1-xAxNbO3 (A: K, Na and Li) and AgNb1-xTaxO3 solid solutions in the vicinity of diffuse phase transitions. J. Phys. D Appl. Phys. 2001, 34, 1447–1455. [Google Scholar] [CrossRef]
- He, C.; Zhang, Y.; Sun l Wang, J.; Wu, T.; Xu, F.; Du, C.; Zhu, K.; Liu, Y. Electrical and optical properties of Nd3+-doped Na0.5Bi0.5TiO3 ferroelectric single crystal. J. Phys. D Appl. Phys. 2013, 46, 245104. [Google Scholar] [CrossRef]
- Li, L.; Li, M.; Zhang, H.; Reaney, I.M.; Sinclair, D.C. Controlling mixed conductivity in Na1/2Bi1/2TiO3 using A-site non-stoichiometry and Nb-donor doping. J. Mater. Chem. C 2016, 4, 5779–5786. [Google Scholar] [CrossRef]
- Wu, Y.; Wang, X.; Zhong, C.; Li, L. Effect of Mn Doping on Microstructure and Electrical Properties of the (Na0.85K0.15)0.5Bi0.5TiO3 Thin Films Prepared by Sol–Gel Method. J. Am. Ceram. Soc. 2011, 94, 3877–3882. [Google Scholar] [CrossRef]
- Shannon, R.D. Revised Effective Ionic Radii and Systematic Studies of Interatomie Distances in Halides and Chaleogenides. Acta Cryst. 1976, A32, 751–777. [Google Scholar] [CrossRef]
- Hejazi, M.M.; Taghaddos, E.; Safari, A. Reduced leakage current and enhanced ferroelectric properties in Mn-doped in Na0.5Bi0.5TiO3 -based thin films. J. Mater. Sci. 2013, 48, 3511–3516. [Google Scholar] [CrossRef]
- Maikhur, N.; Panwar, A.; Jha, A.K. Investigation of A- and B-site Fe substituted BaTiO3 ceramics. J. Appl. Phys. 2013, 113, 17D915. [Google Scholar] [CrossRef]
- Craciun, F.; Dimitriu, E.; Grigoras, M.; Lupu, N. Multiferroic perovskite (Pb0.845Sm0.08Fe0.035)(Ti0.98Mn0.02)O3 with ferroelectric and weak ferromagnetic properties. Appl. Phys. Lett. 2013, 102, 242903. [Google Scholar] [CrossRef]
- Hennings, D.; Pomplum, H. Evaluation of Lattice Site and Valence of Mn and Fe in Polycrystal-line PbTiO3 by Electron Spin Resonance and Thermogravimetry. J. Am. Ceram. Soc. 1974, 57, 527–530. [Google Scholar] [CrossRef]
- Li, C.; Junmin, X.; Wang, J. Effects of Ni doping on B-site ordering and magnetic behaviors of double perovskite Sr2FeMoO6. J. Electroceram. 2006, 16, 351–355. [Google Scholar] [CrossRef]
- Hung, N.T.; Bac, L.H.; Trung, N.N.; Hoang, N.T.; Vinh, P.V.; Dung, D.D. Room-temperature ferromagnetism in Fe-based perovskite solid solution in lead-free ferroelectric Bi0.5Na0.5TiO3 materials. J. Magn. Magn. Mater. 2018, 451, 183–186. [Google Scholar] [CrossRef]
- Petzelt, J.; Kamba, S.; Fabry, J.; Noujni, D.; Porokhonsky, V.; Pashkin, A.; Franke, I.; Roleder, K.; Suchanicz, J.; Klein, R.; et al. Infrared, Raman and high-frequency dielectric spectroscopy and the phase transitions in Na0.5Bi0.5TiO3. J. Phys. Condens. Matter 2004, 16, 2719–2731. [Google Scholar] [CrossRef]
- Zhu, J.J.; Zhang, J.Z.; Jiang, K.; Zhang, H.W.; Hu, Z.G.; Luo, H.S.; Chu, J.H. Coexistence of ferroelectric phases and phonon dynamics in relaxor ferroelectric Na0.5Bi0.5TiO3 based single crystals. J. Am. Ceram. Soc. 2016, 99, 2408–2414. [Google Scholar] [CrossRef]
- Rohrbeck, A.; de la Flor, G.; Aroyo, M.; Gospodinov, M.; Bismayer, U.; Mihailova, B. The effect of chemical variations on the structural polarity of relaxor ferroelectrics studied by resonance Raman spectroscopy. J. Phys. Condens. Matter 2016, 28, 475902. [Google Scholar] [CrossRef] [PubMed]


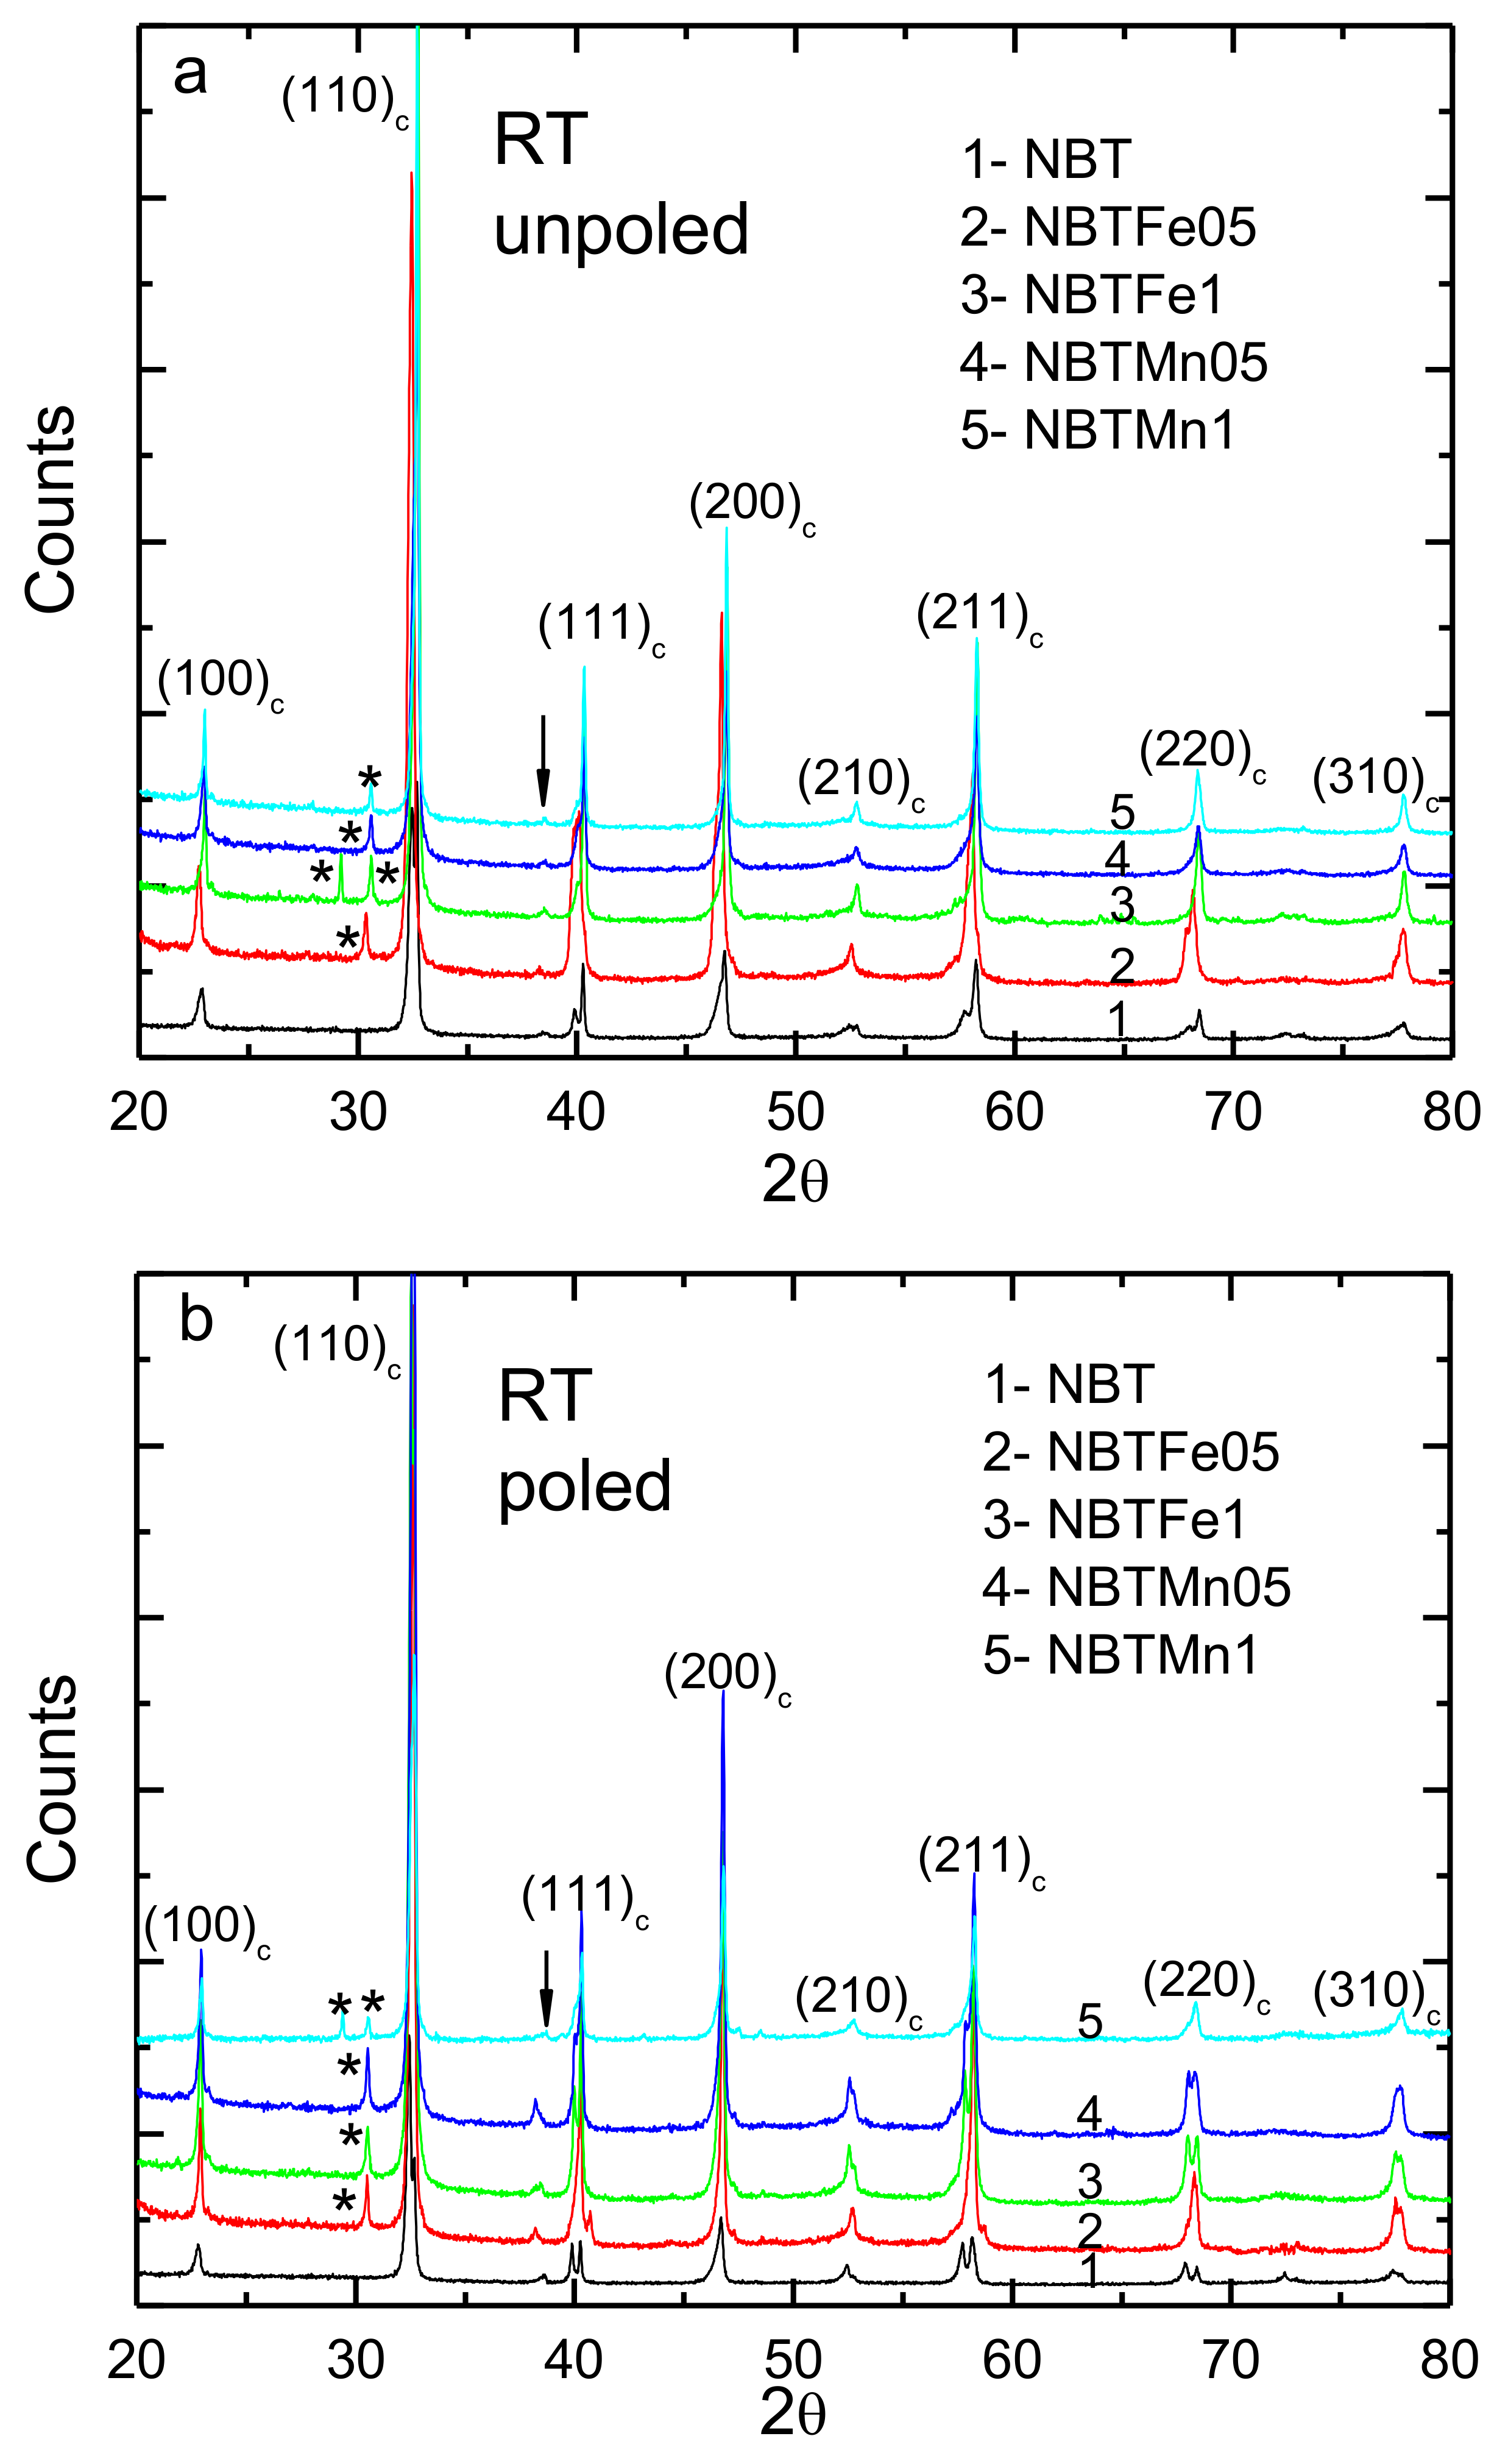
| Sample | Phase Composition | V/106 pm3 | R |
|---|---|---|---|
| NBT | |||
| unpoled | R3C | 353.07260 | 8.15% |
| poled | R3C | 353.72130 | 7.93% |
| NBT05Fe | |||
| unpoled | R3C 79.2% | 351.98740 | 10.70% |
| P4bm 16.1% | 119.00890 | 10.91% | |
| Bi5Ti3FeO15 4.7% | 1202.07200 | 9.80% | |
| poled | R3C 78.3% | 351.72870 | 7.34% |
| P4bm 18.4% | 119.24740 | 7.74% | |
| Bi5Ti3FeO15 3.3% | 1208.56100 | 7.11% | |
| NBT1Fe | |||
| unpoled | R3C 74.2% | 352.14380 | 7.34% |
| P4bm 25.0% | 120.00790 | 7.24% | |
| Bi5Ti3FeO15 0.8% | 1217.23200 | 8.86% | |
| poled | R3C 81.3% | 352.87970 | 3.79% |
| P4bm 13.9% | 120.12210 | 5.04% | |
| Bi5Ti3FeO15 4.8% | 1210.36900 | 6.51% | |
| NBT05Mn | |||
| unpoled | R3C 47.1% | 351.92630 | 3.98% |
| P4bm 52.0% | 119.33060 | 3.32% | |
| Bi5Ti3FeO15 0.9% | 1204.94400 | 7.39% | |
| poled | R3C 46.6% | 352.17970 | 6.32% |
| P4bm 52.3% | 118.94330 | 7.87% | |
| Bi5Ti3FeO15 1.1% | 1205.90500 | 9.98% | |
| NBT1Mn | |||
| unpoled | R3C 69.4% | 351.74620 | 7.33% |
| P4bm 30.1% | 119.00110 | 7.80% | |
| poled | Bi5Ti3FeO15 0.5% | 1203.90000 | 10.47% |
| R3C 45.6% | 351.91730 | 4.01% | |
| P4bm 53.4% | 118.99880 | 4.90% | |
| Bi5Ti3FeO15 1.0% | 1212.02800 | 6.72% |
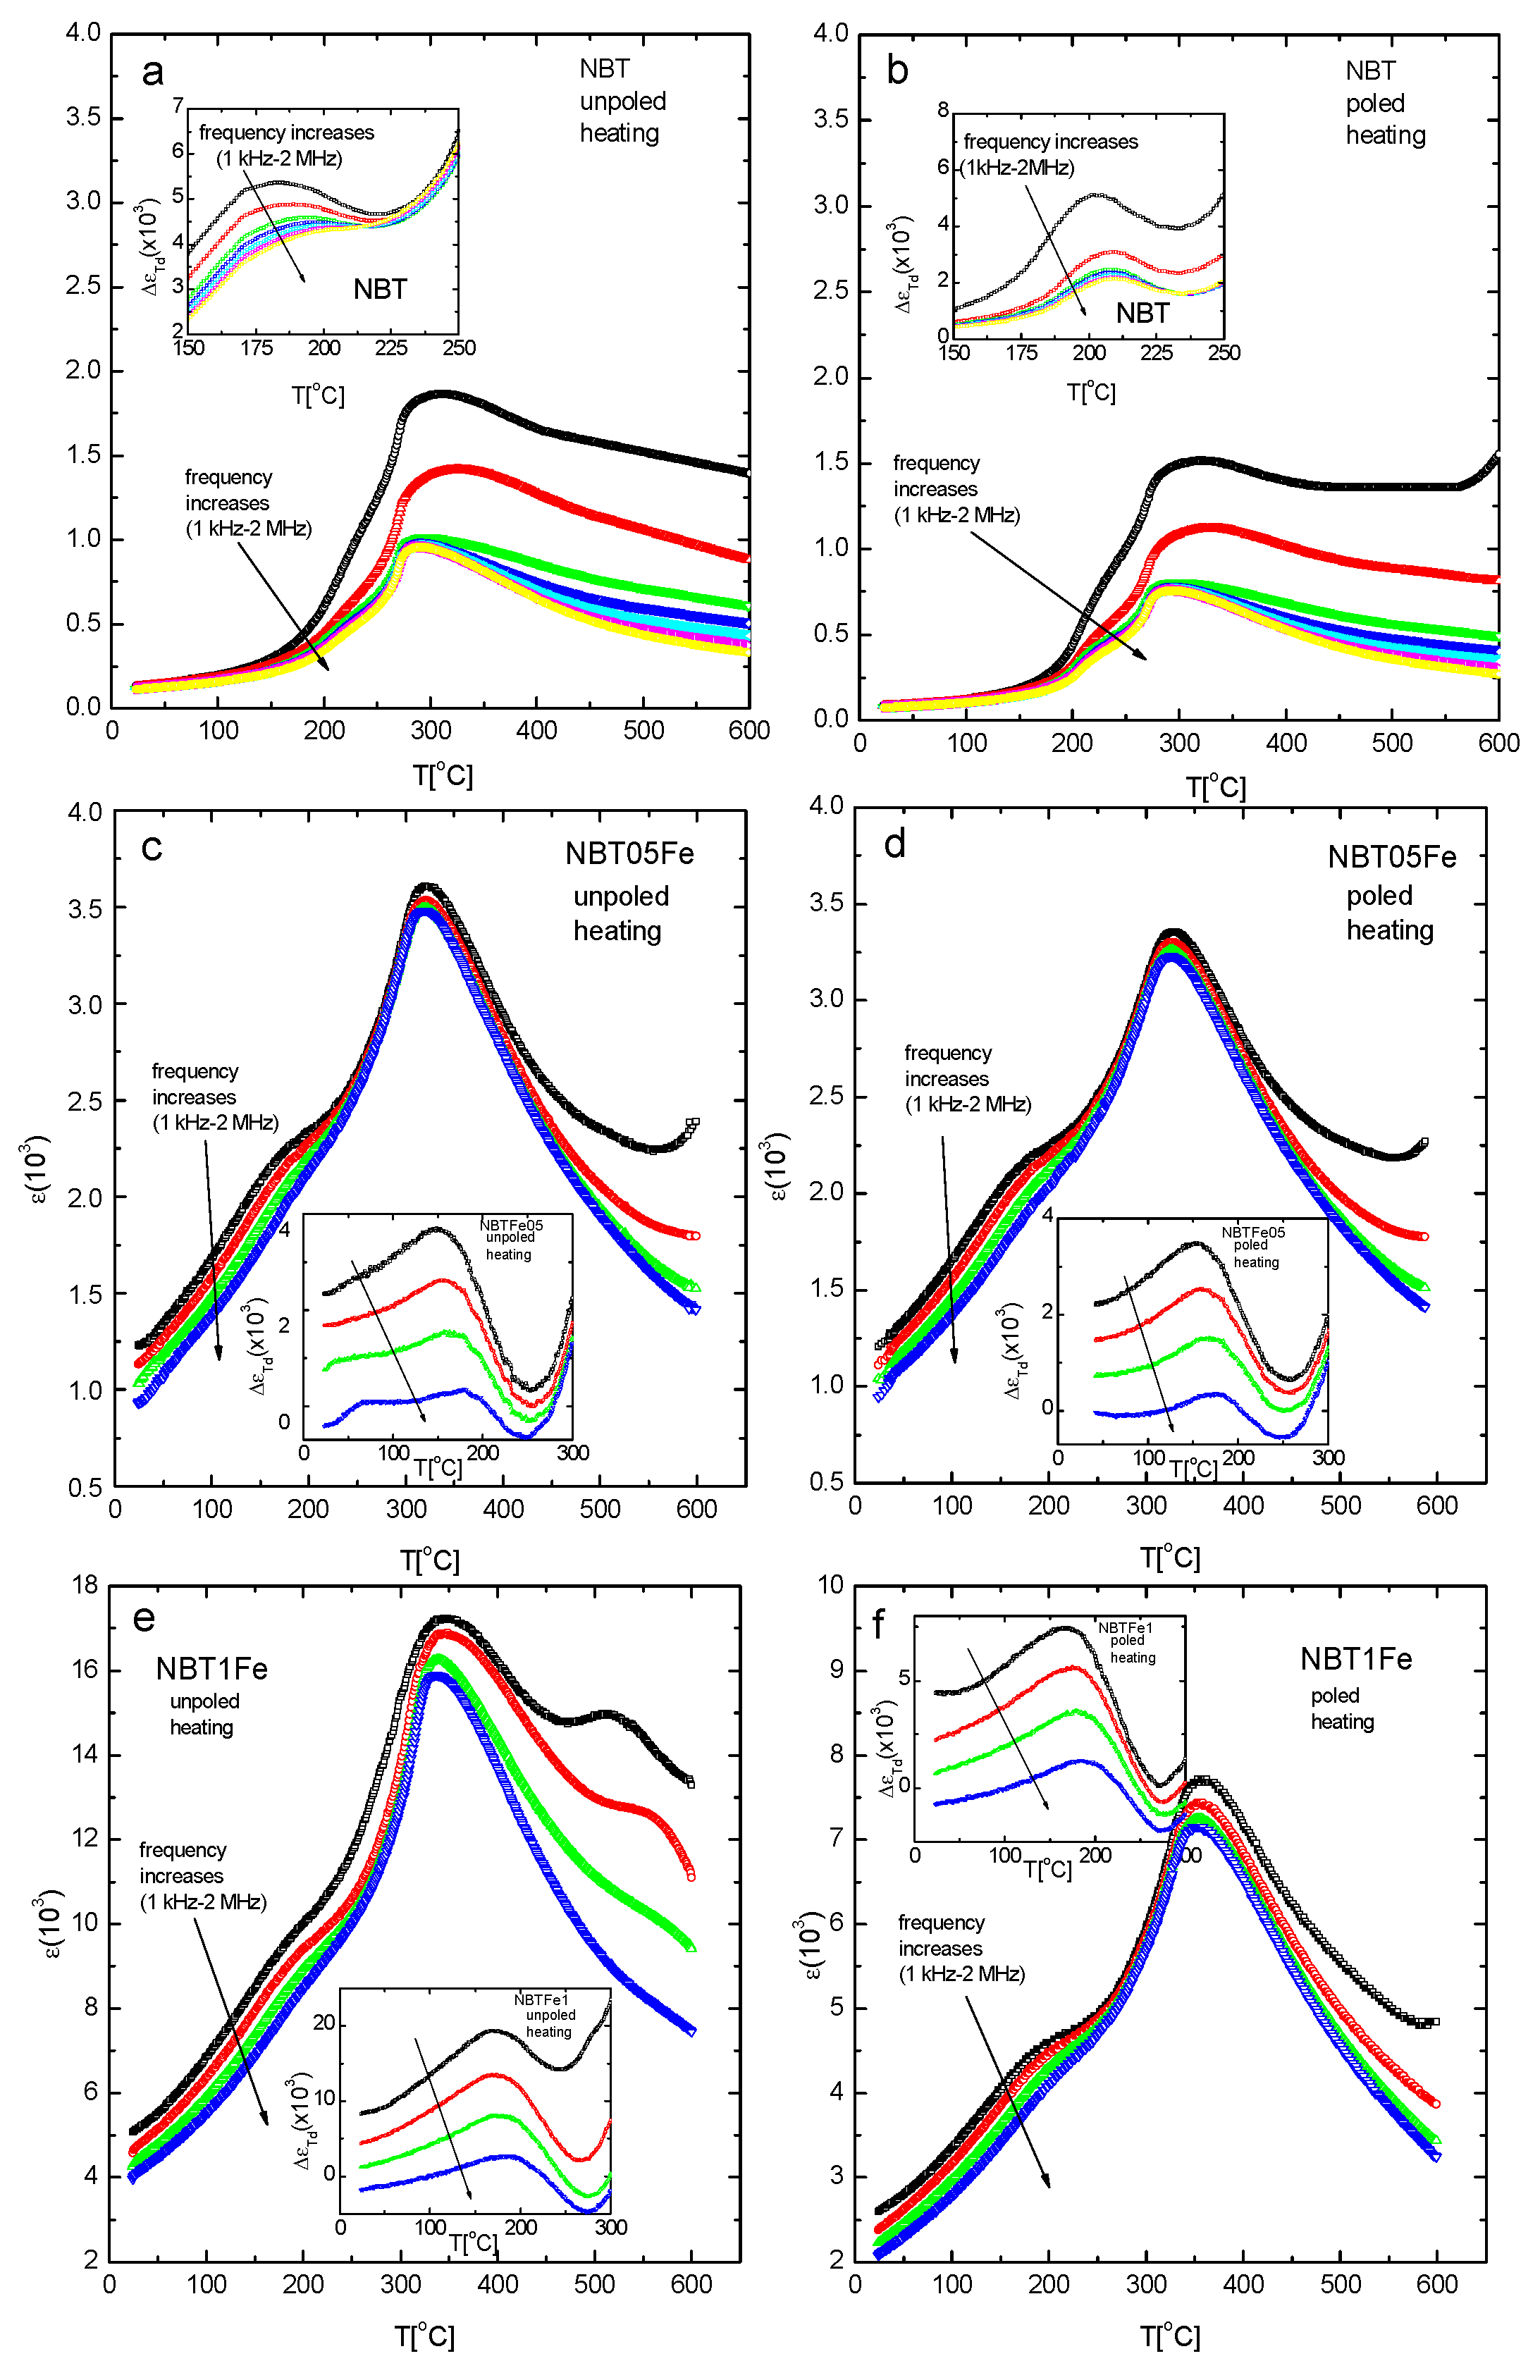
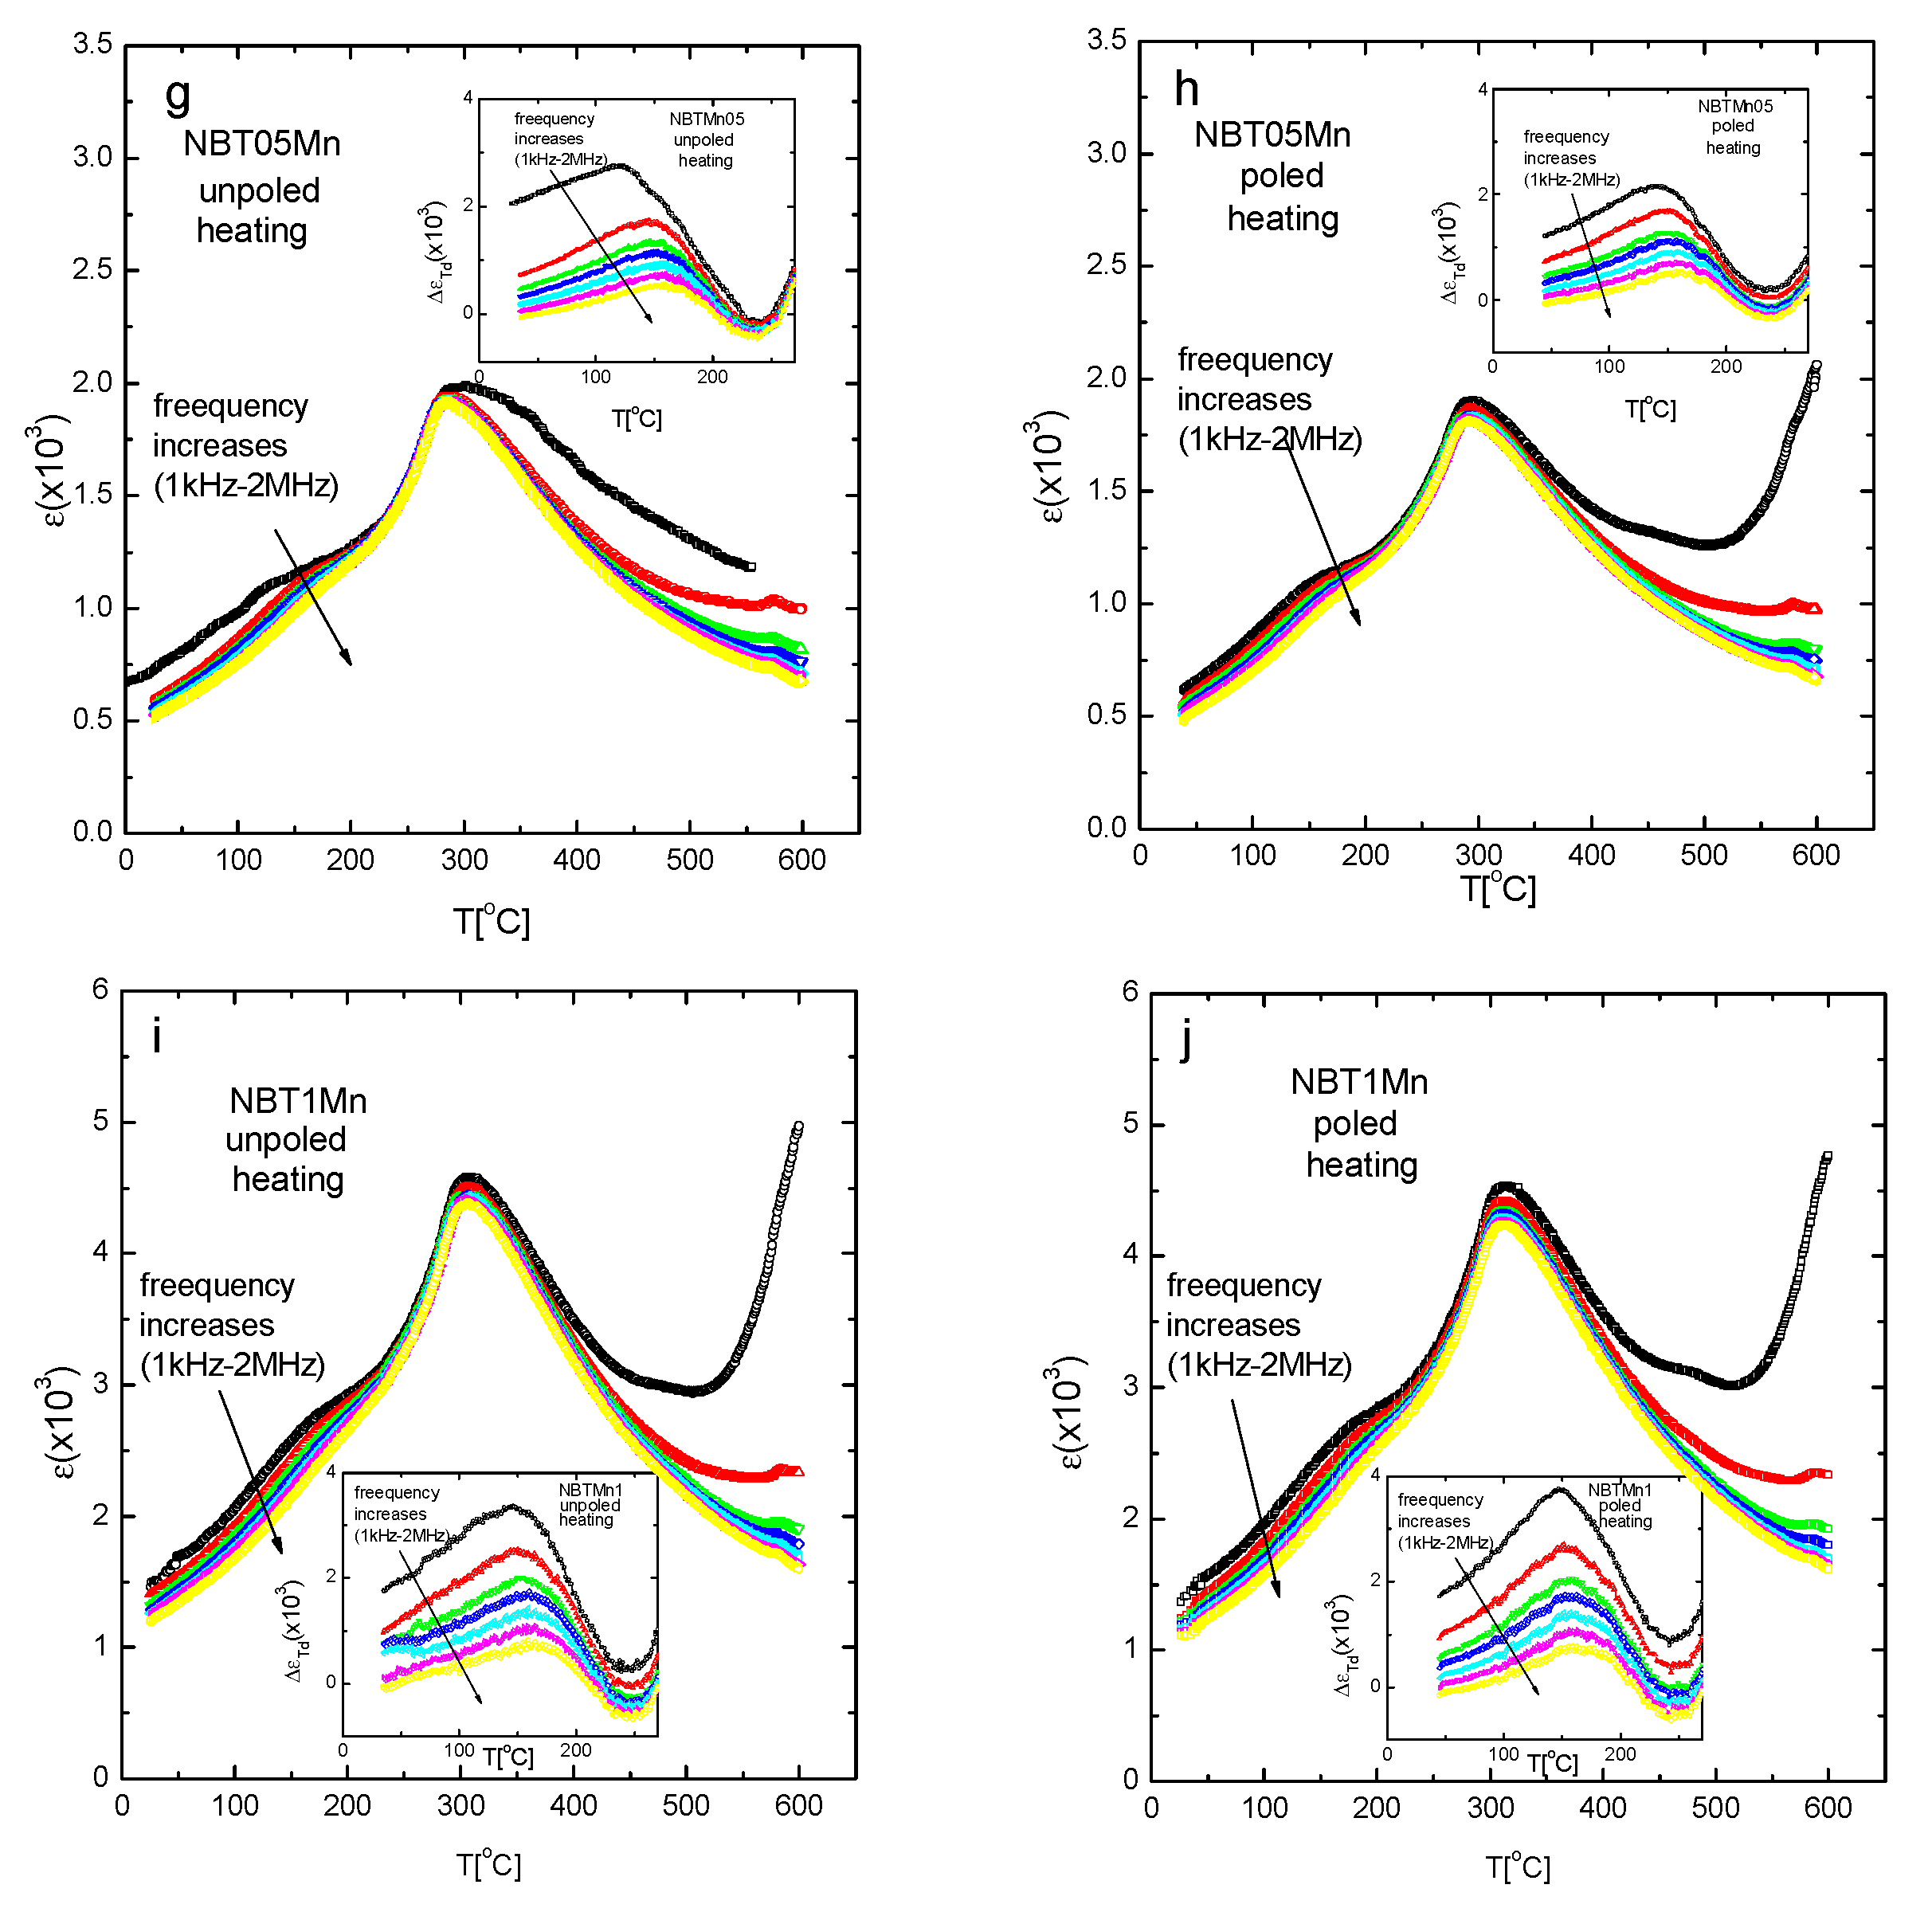
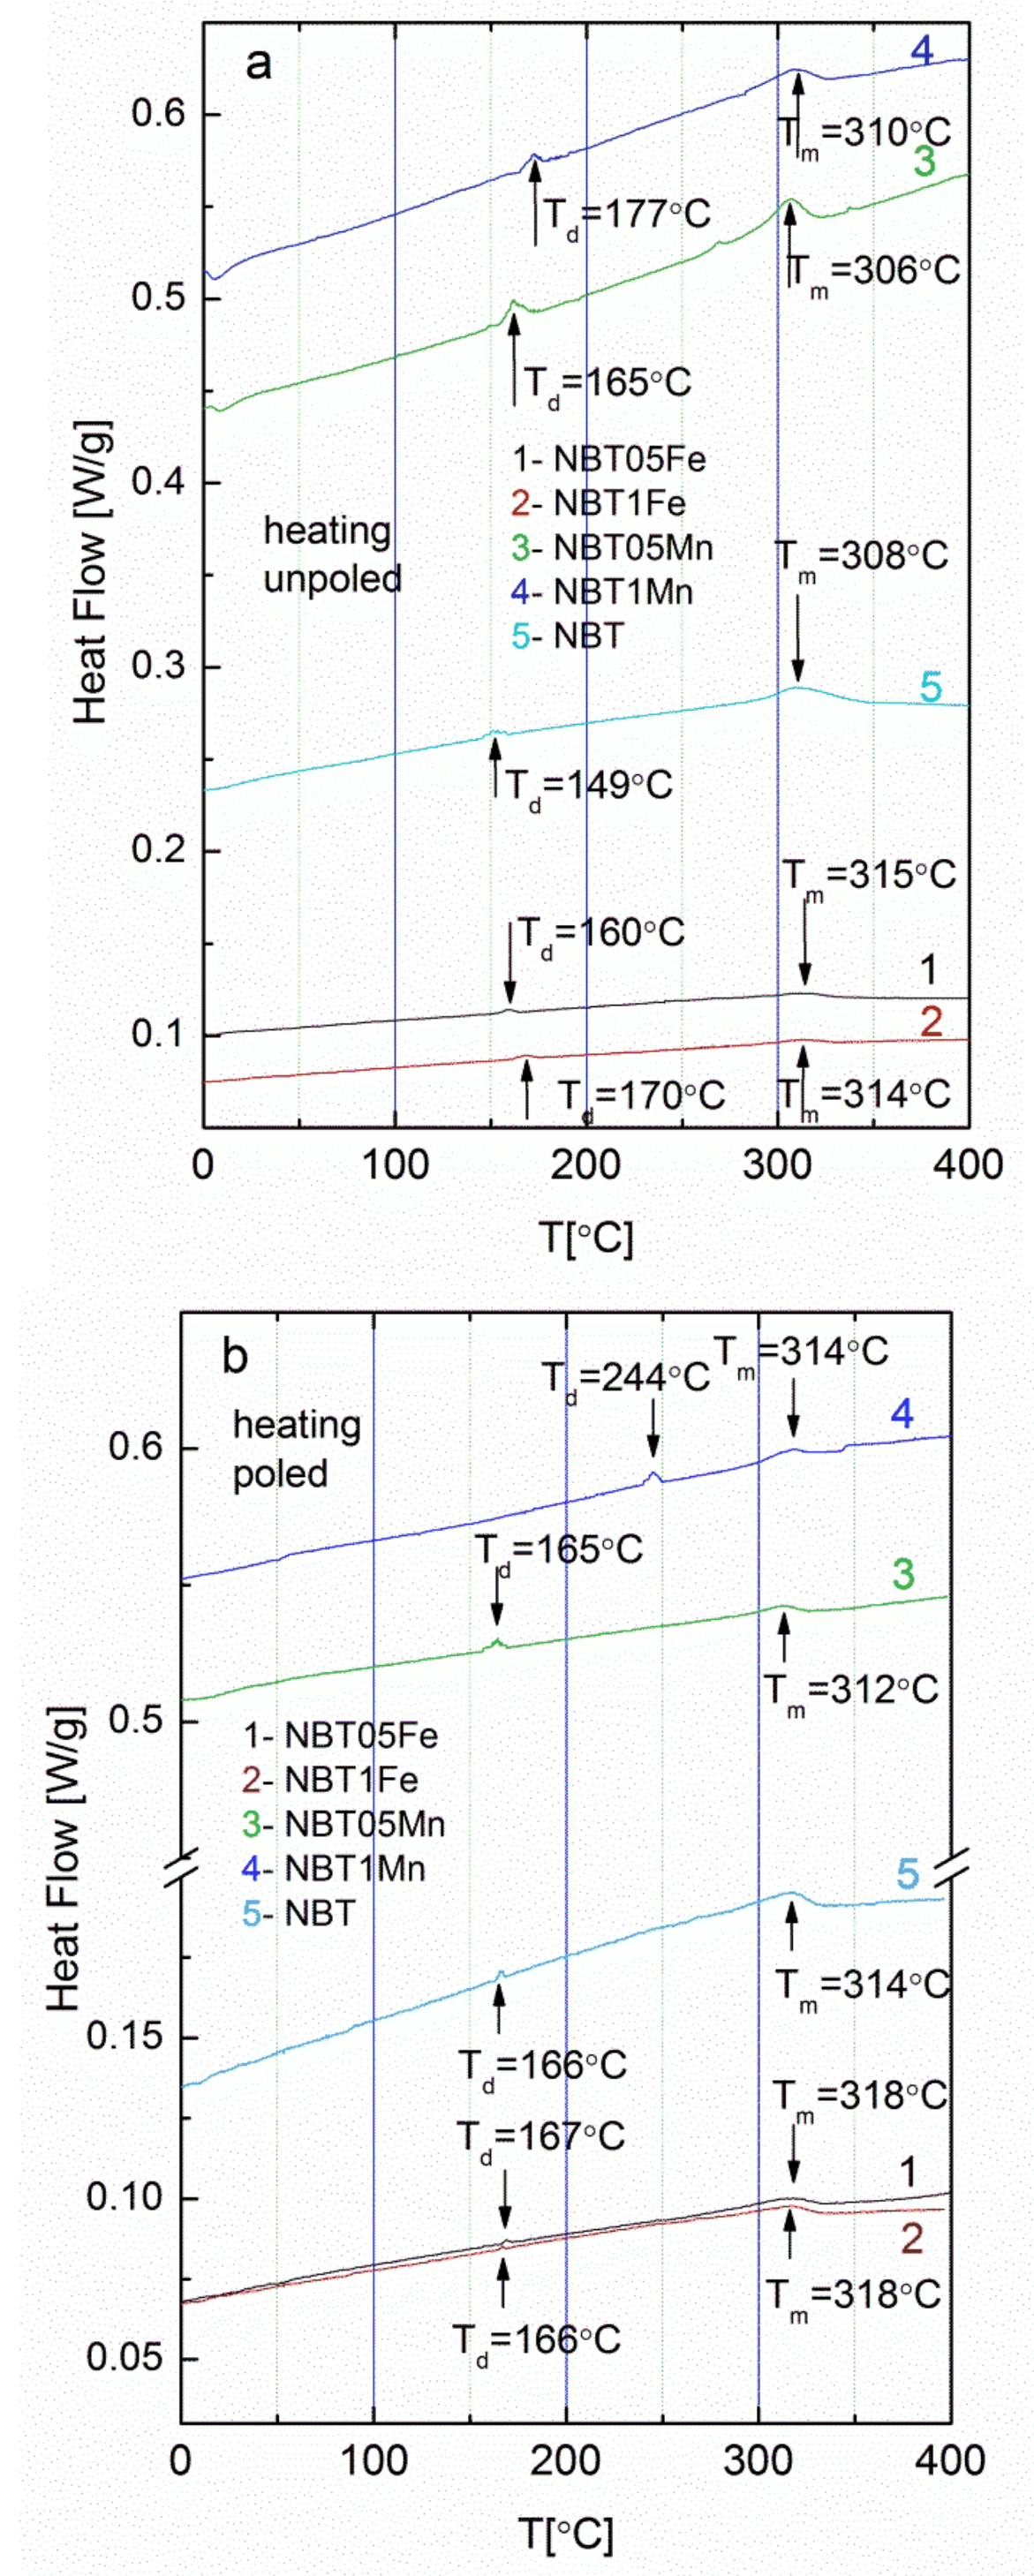
| Sample | Td [°C] | Tm [°C] |
|---|---|---|
| NBT | ||
| unpoled | 190 | 316 |
| poled | 196 | 317 |
| NBT05Fe | ||
| unpoled | 160 | 318 |
| poled | 168 | 322 |
| NBT1Fe | ||
| unpoled | 165 | 338 |
| poled | 170 | 351 |
| NBT05Mn | ||
| unpoled | 165 | 290 |
| poled | 195 | 293 |
| NBT1Mn | ||
| unpoled | 177 | 306 |
| poled | 244 | 312 |
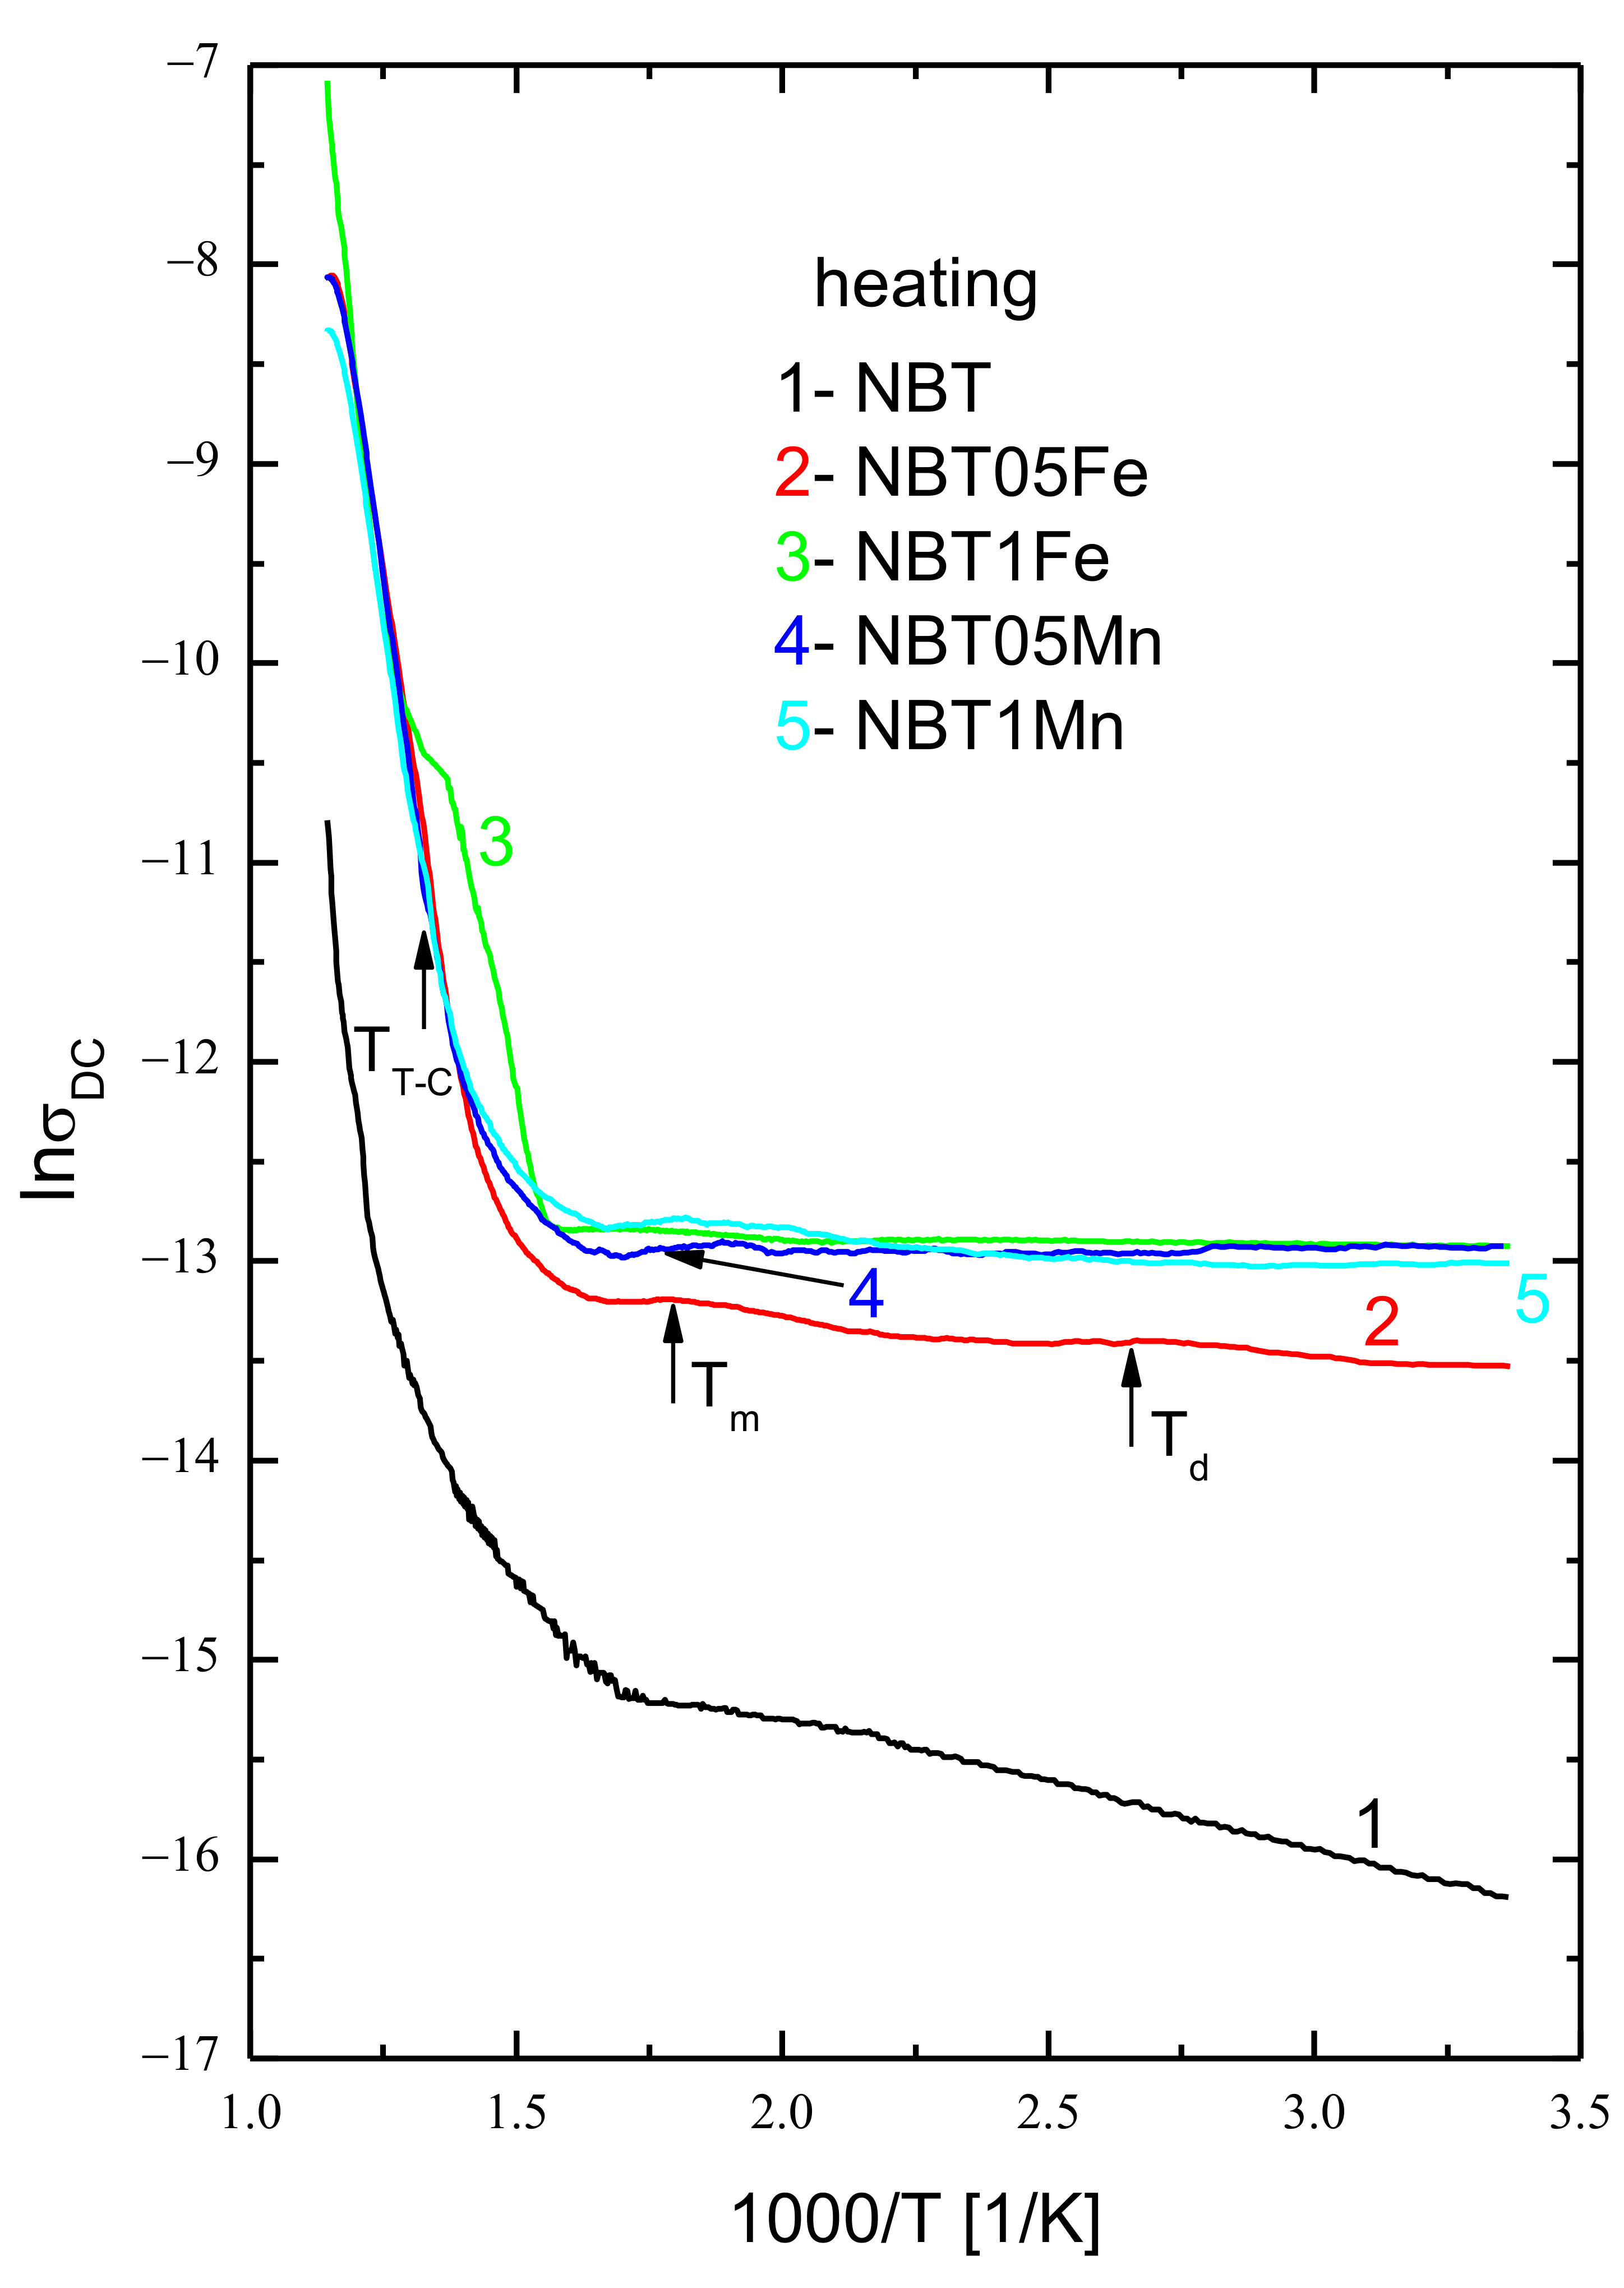
| Temperature Range | RT-190 °C | 190–320 °C | 320–450 °C | 450–540 °C | 540–600 °C |
|---|---|---|---|---|---|
| Activation Energy | |||||
| Ea[eV] | Ea[eV] | Ea[eV] | Ea[eV] | Ea[eV] | |
| NBT | 0.057 | 0.049 | 0.290 | 0.690 | 1.951 |
| NBT05Fe | 0.041 | 0.031 | 0.240 | 0.630 | 1.765 |
| NBT1Fe | 0.039 | 0.041 | 0.280 | 0.670 | 1.692 |
| NBT05Mn | 0.045 | 0.036 | 0.270 | 0.630 | 1.633 |
| NBT1Mn | 0.039 | 0.027 | 0.261 | 0.610 | 1.722 |
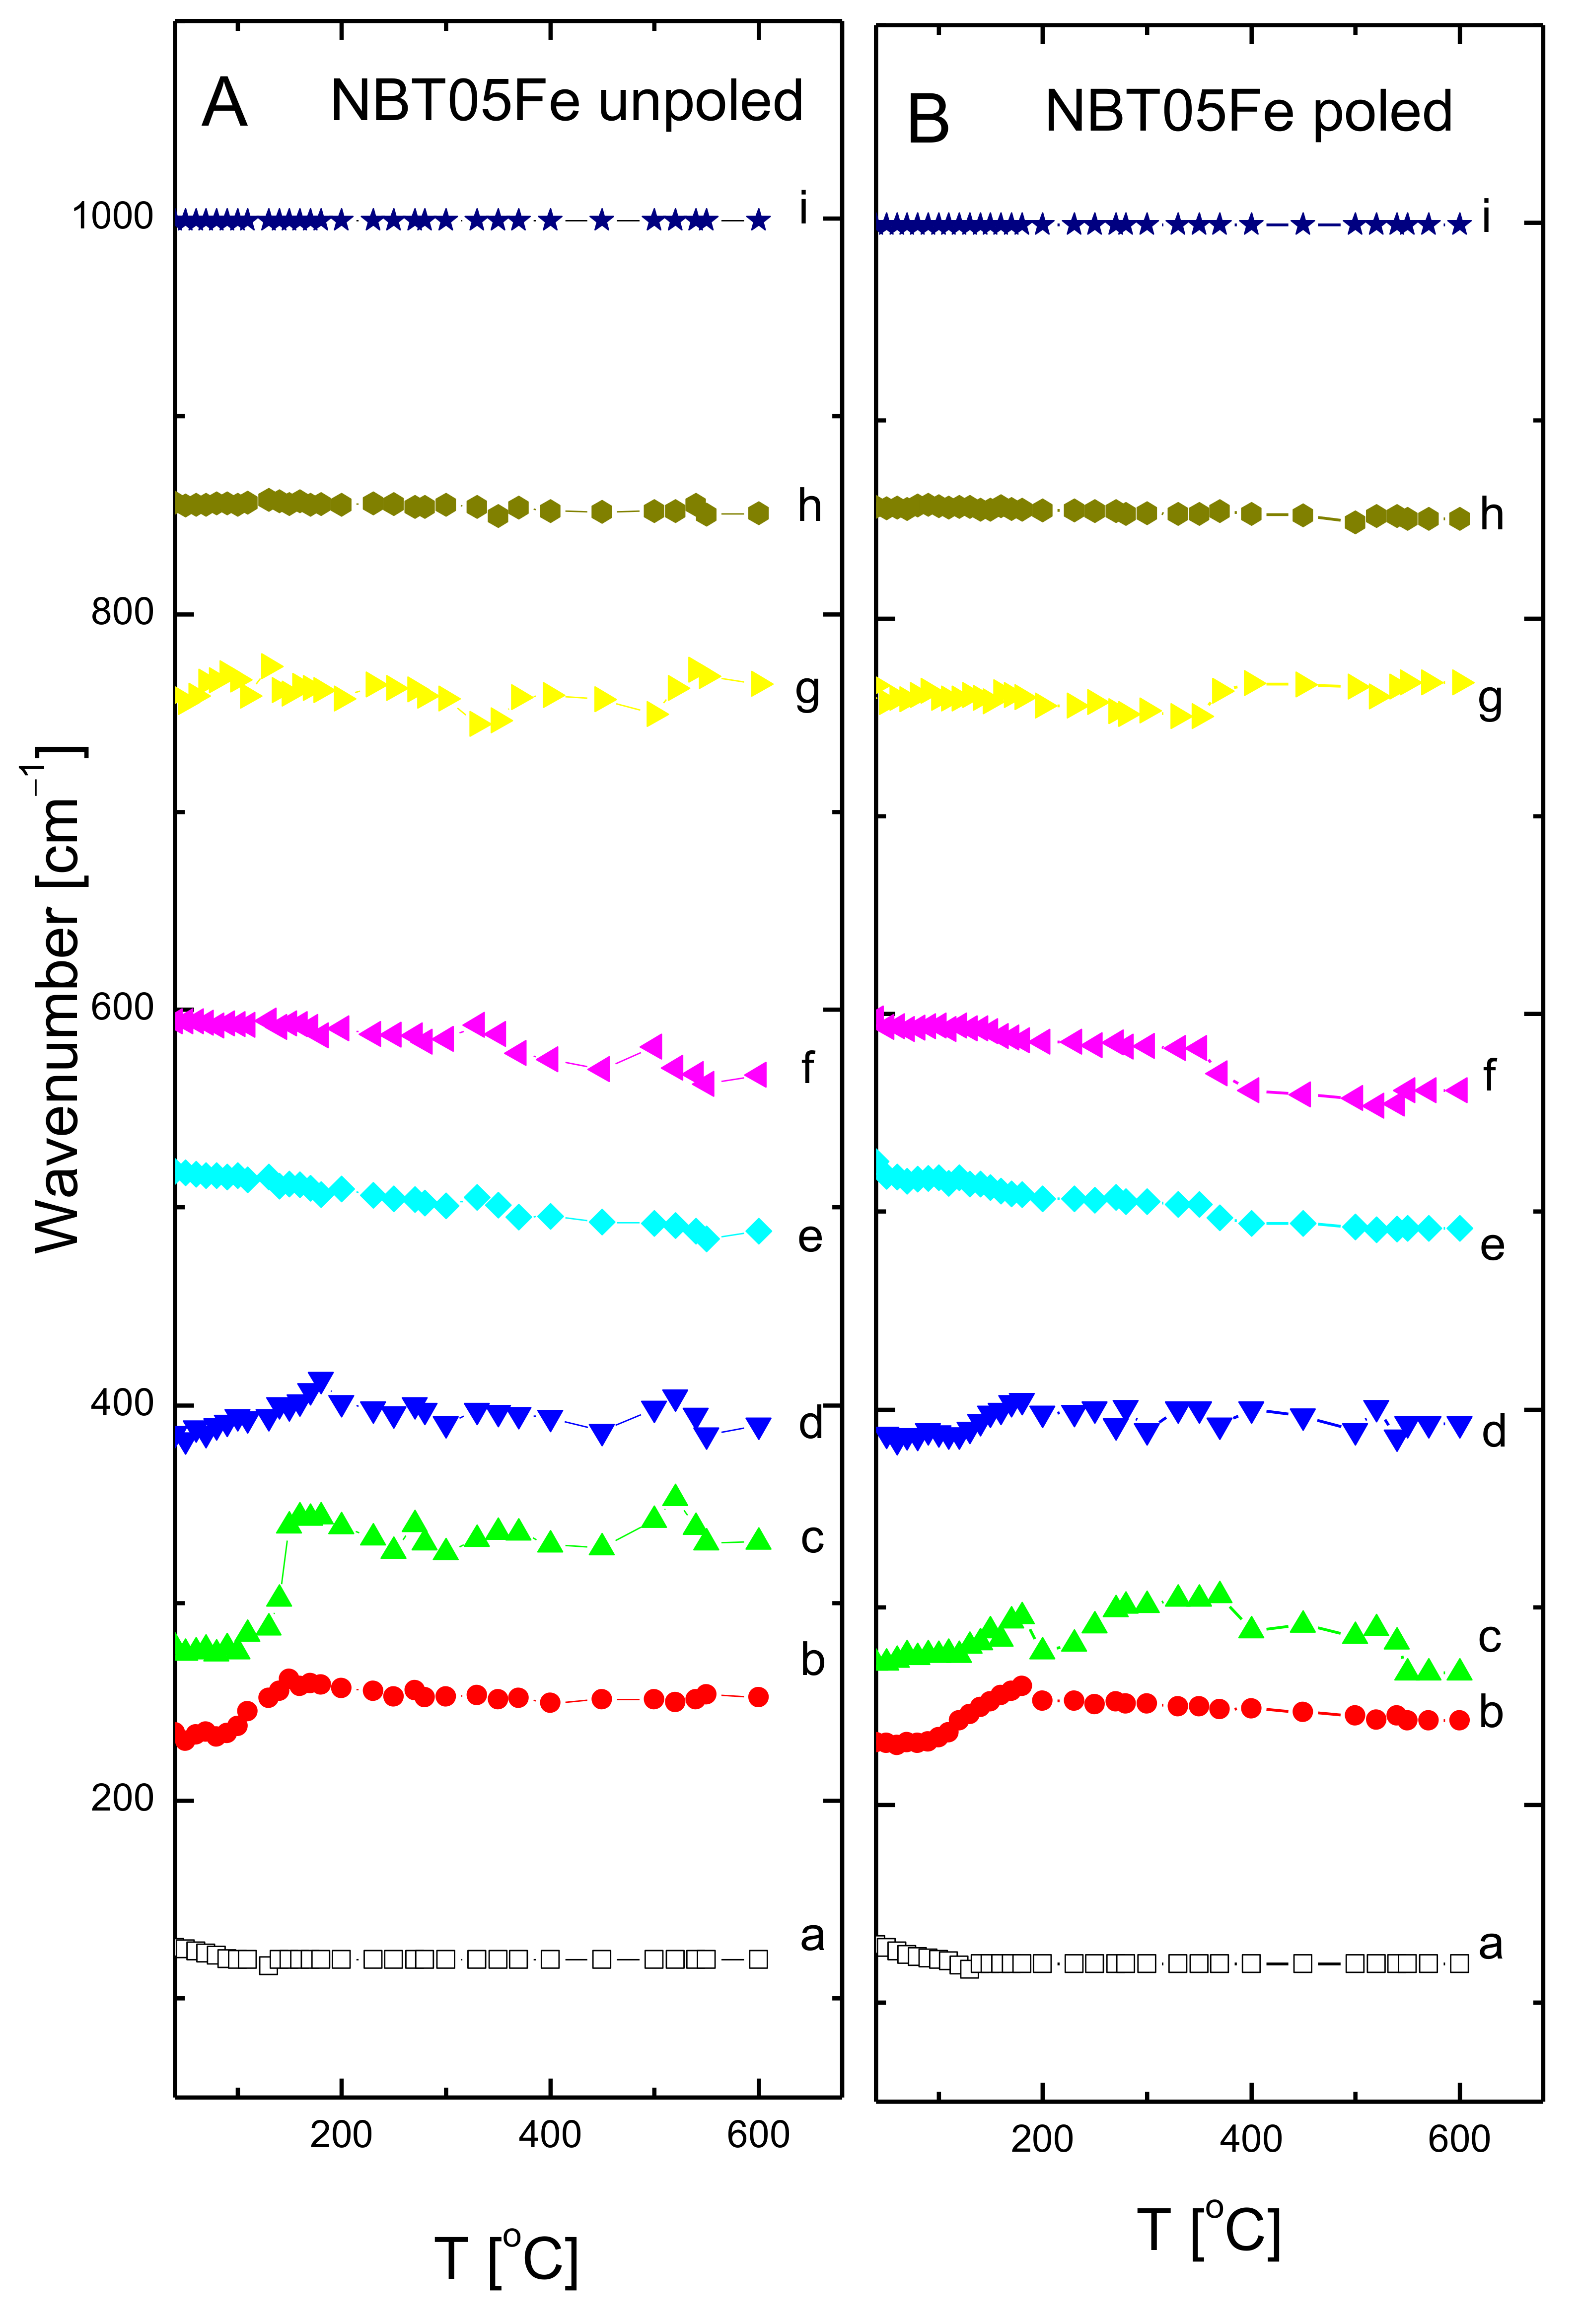
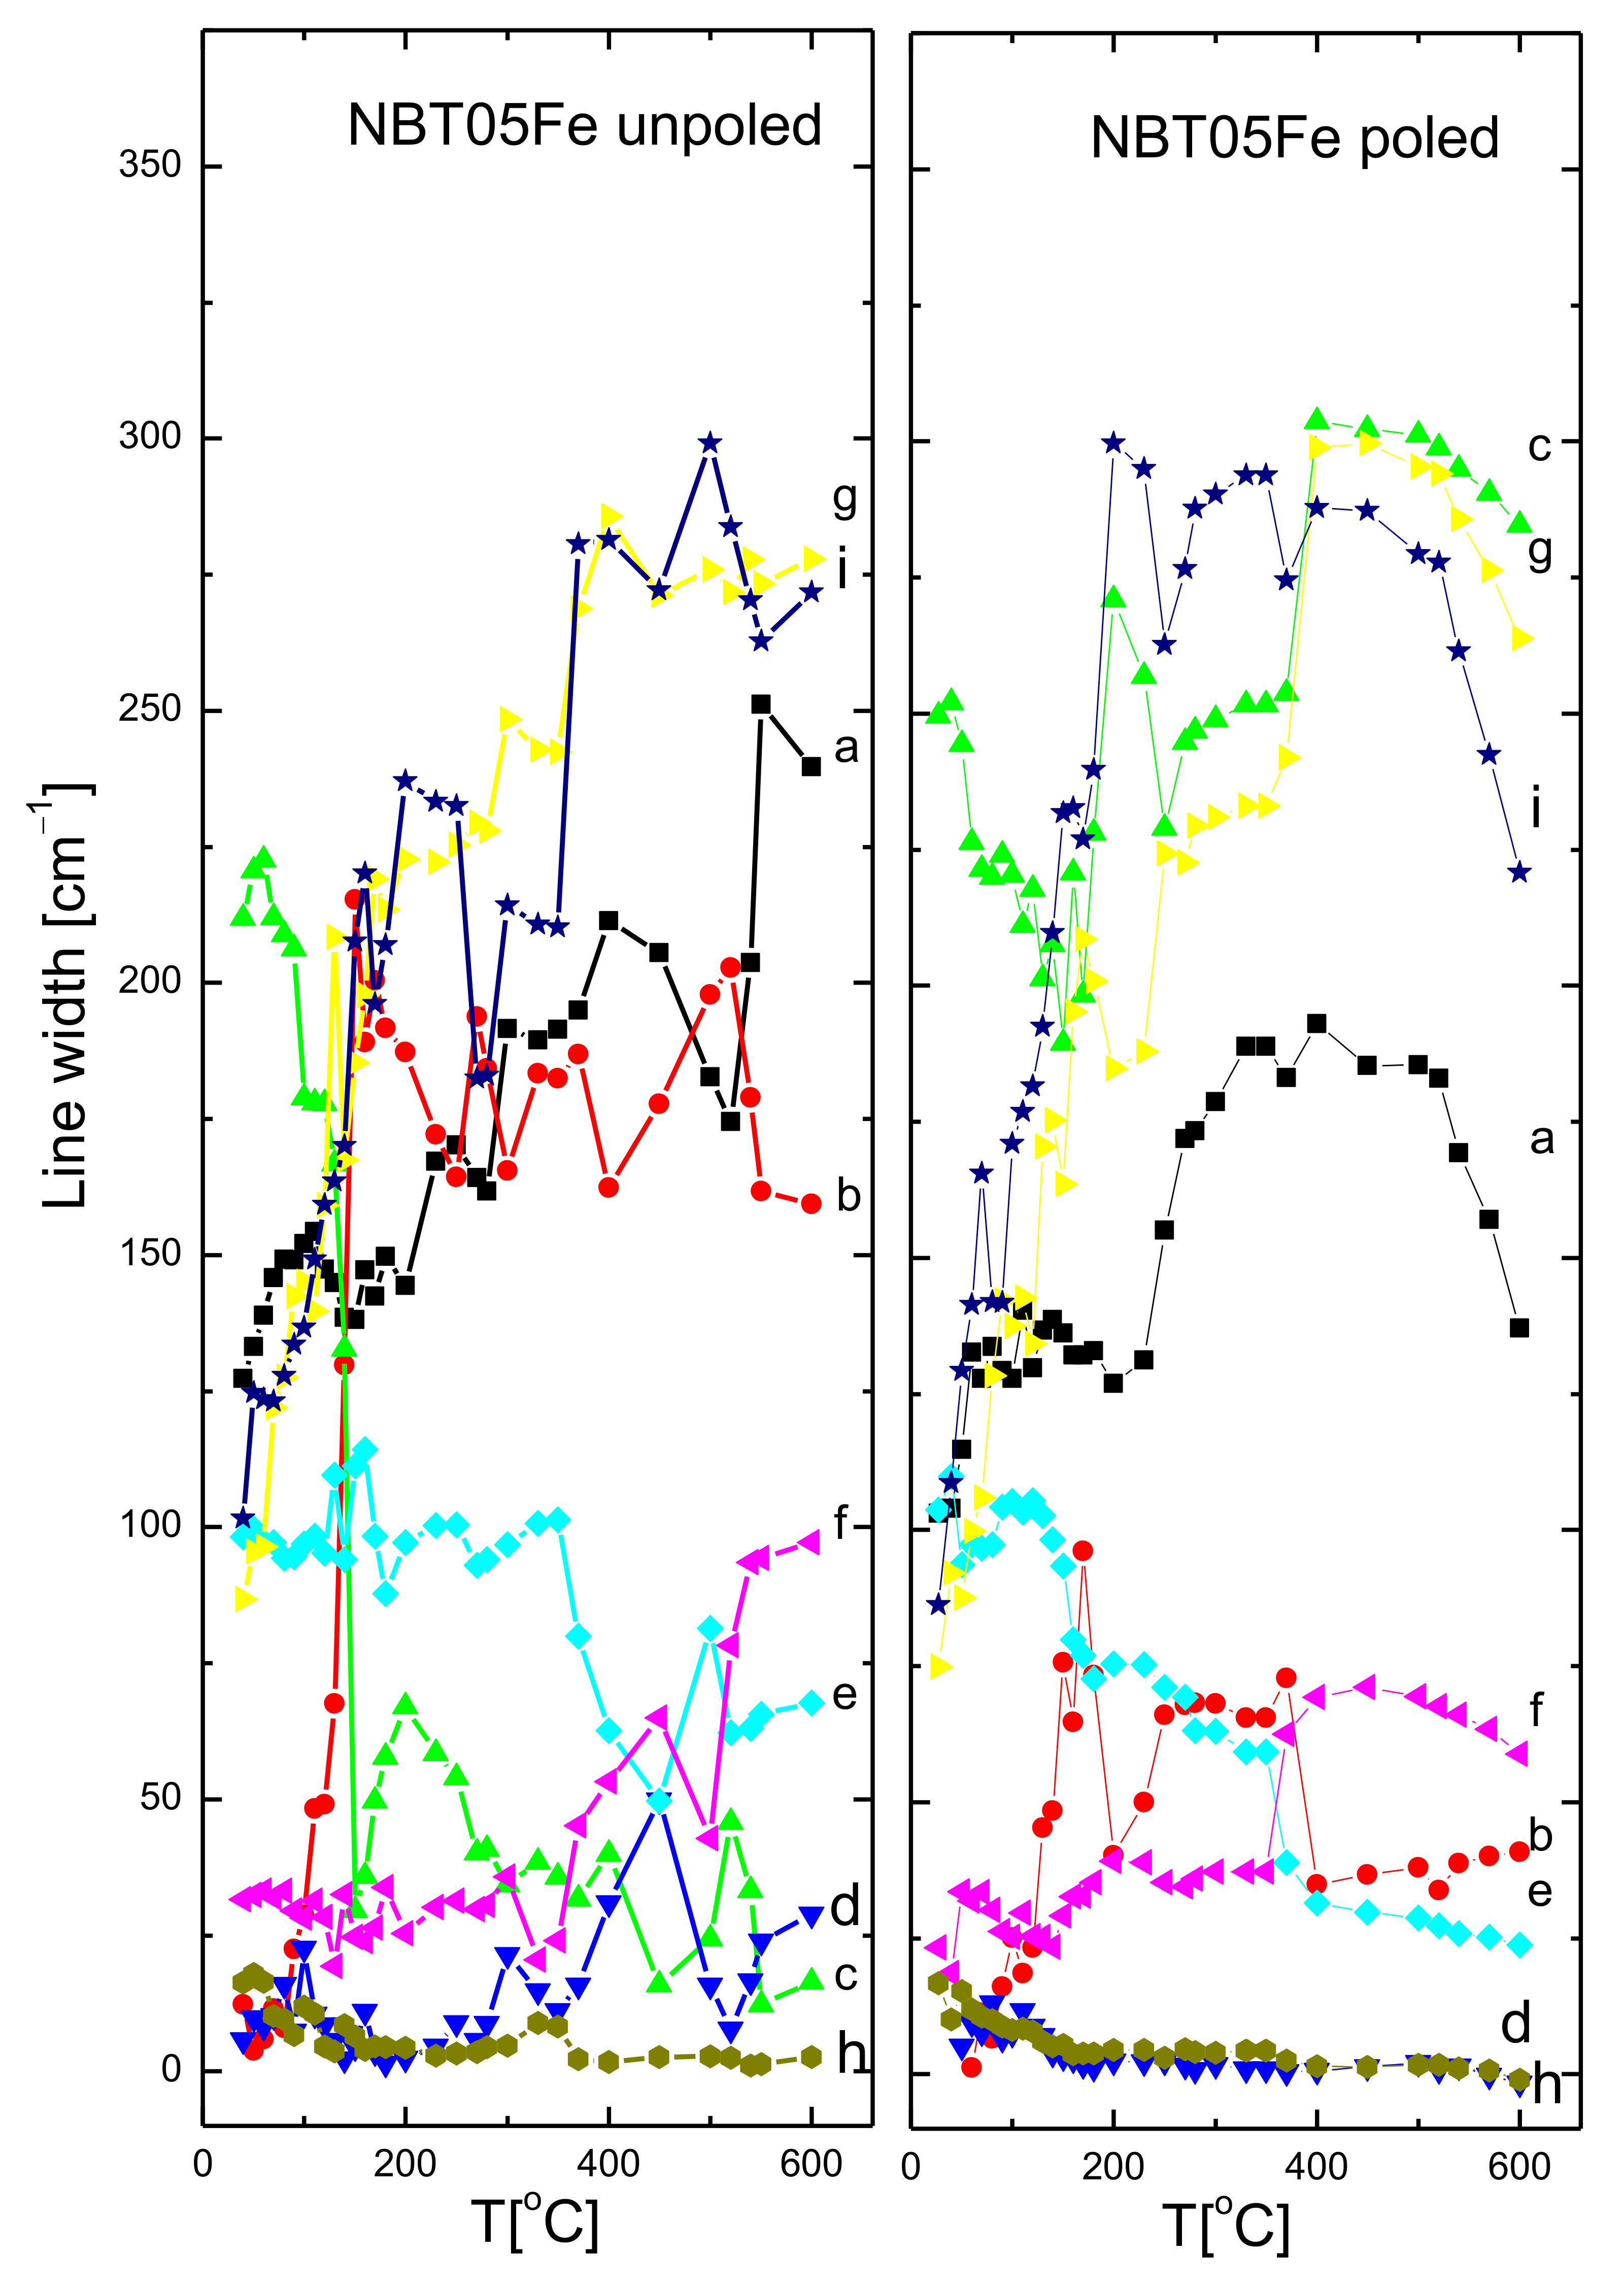
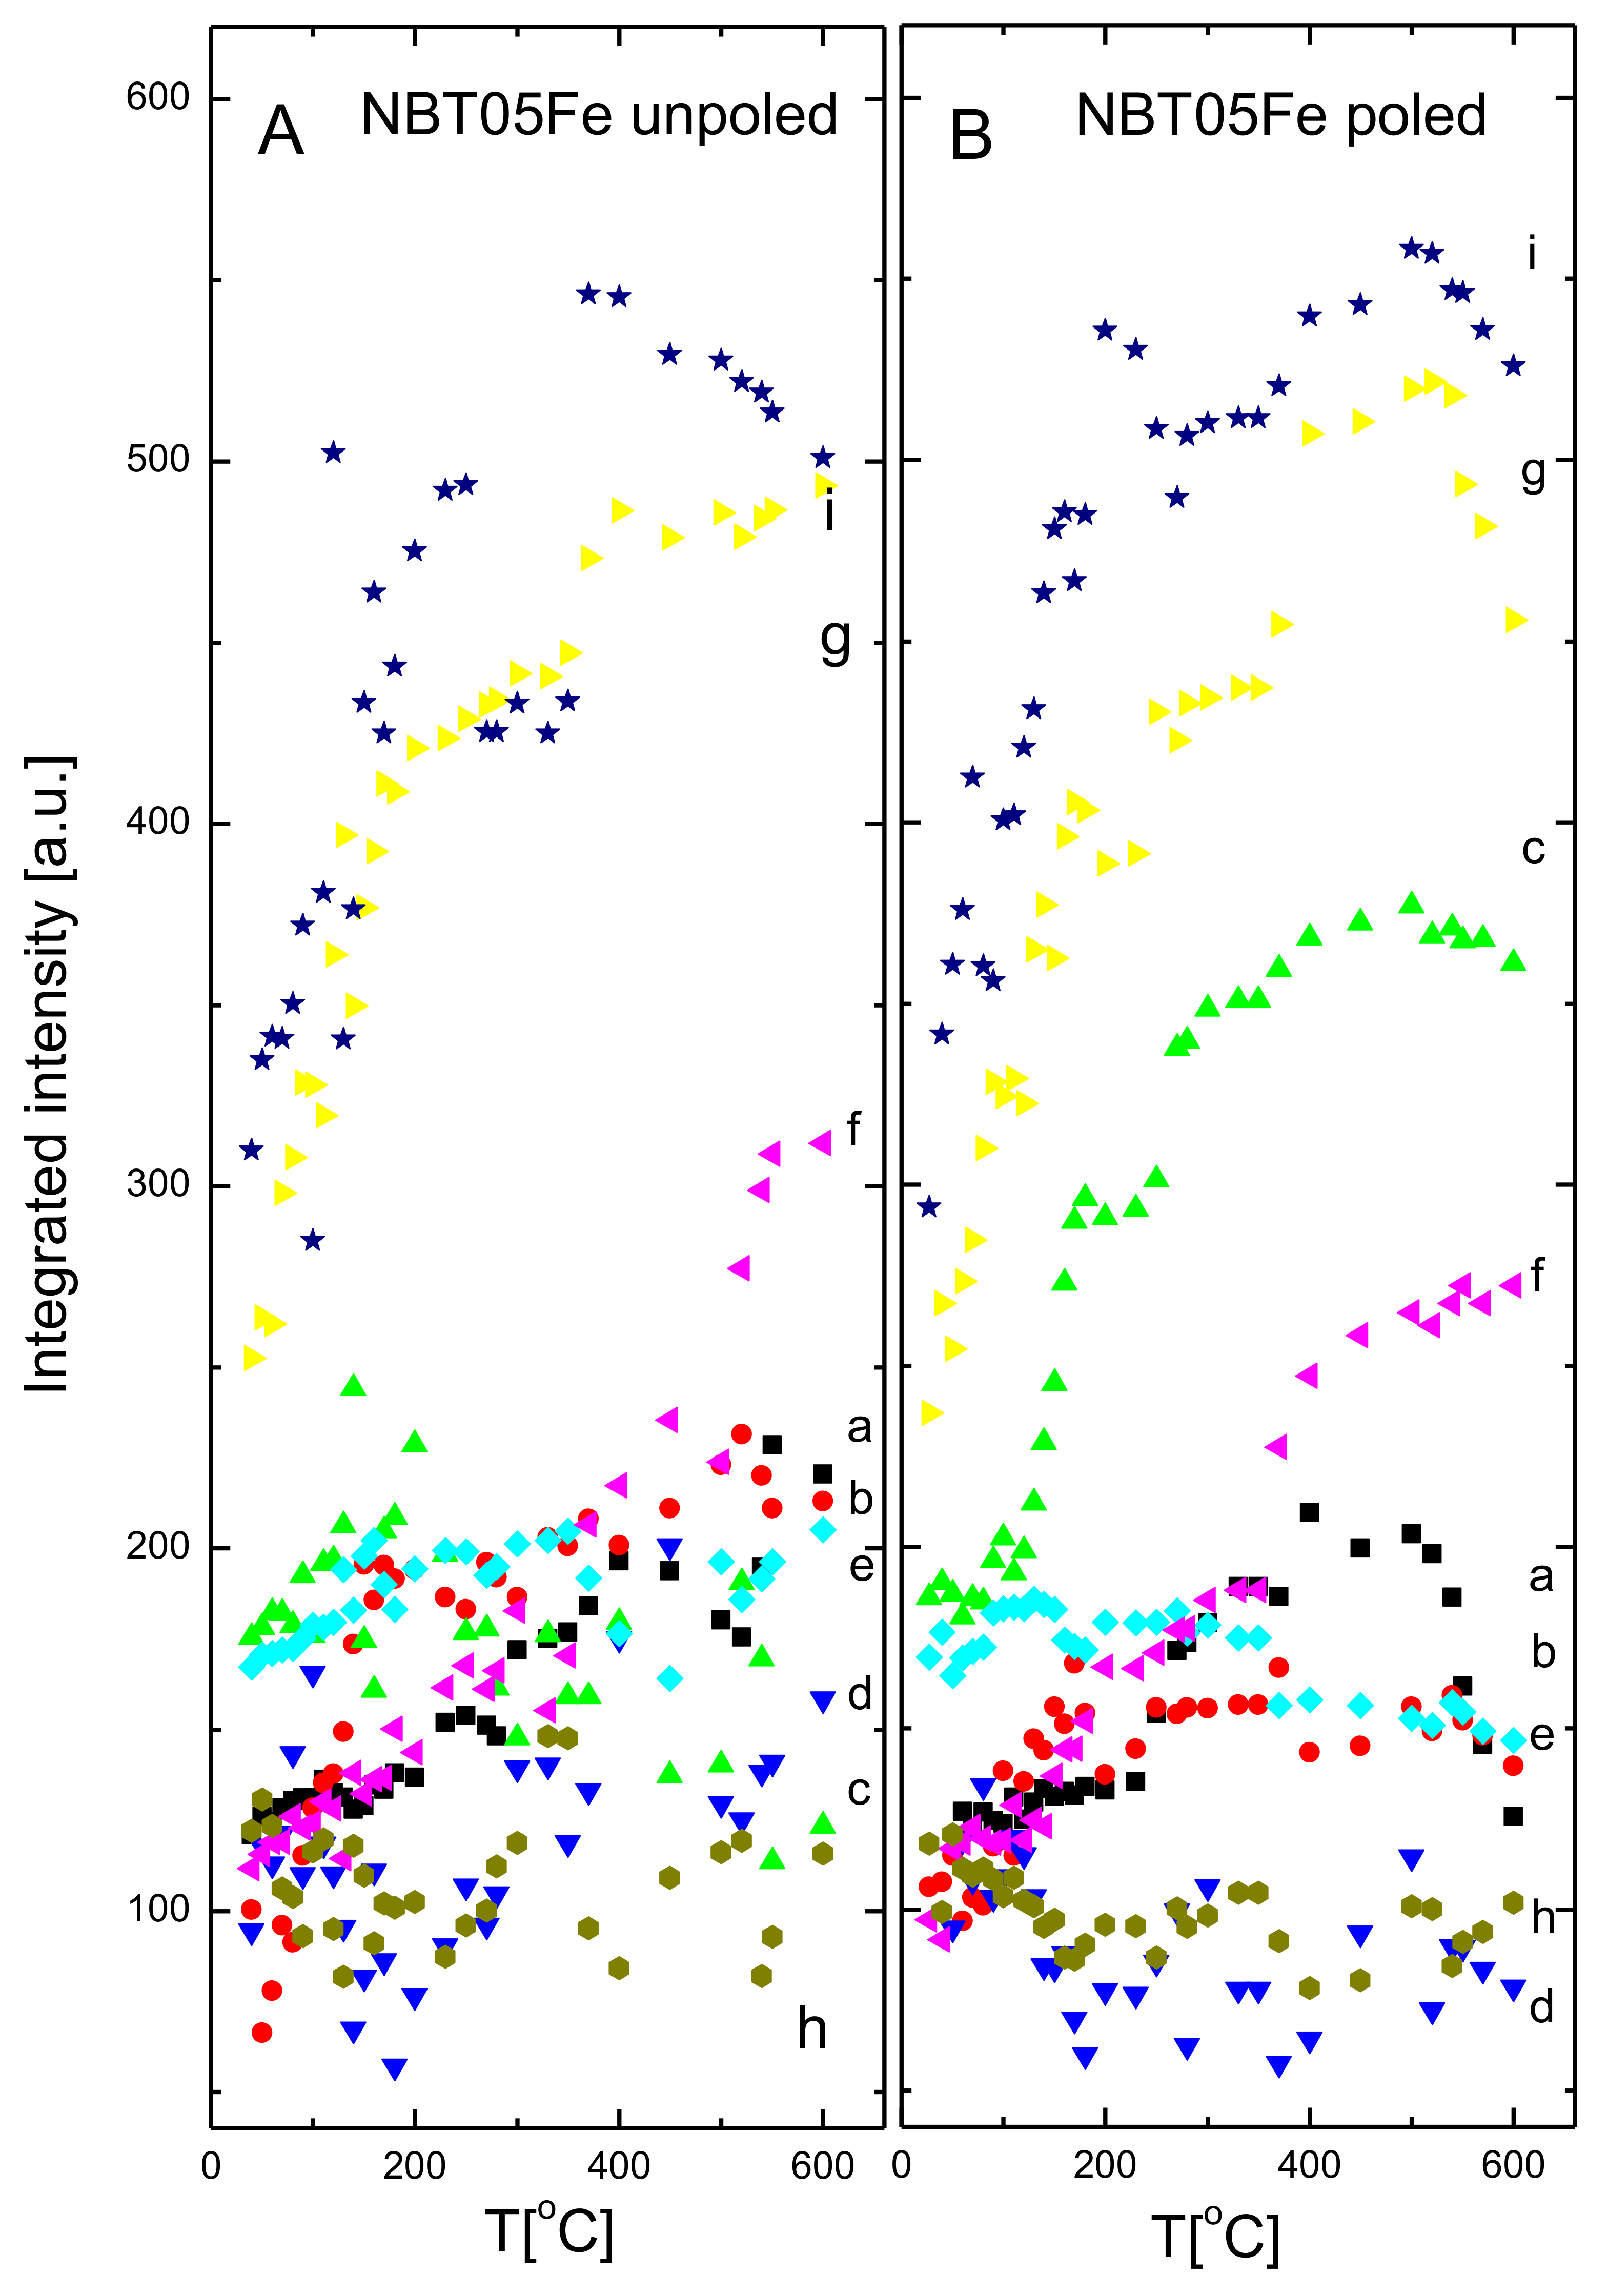
| Mode Name | Frequency (cm−1) | FWHM (cm−1) |
|---|---|---|
| a | 126 | 120 |
| b | 234 | 100 |
| c | 278 | 176 |
| d | 386 | 94 |
| e | 518 | 167 |
| f | 594 | 112 |
| g | 759 | 253 |
| h | 856 | 122 |
| i | 999 | 310 |
Publisher’s Note: MDPI stays neutral with regard to jurisdictional claims in published maps and institutional affiliations. |
© 2022 by the authors. Licensee MDPI, Basel, Switzerland. This article is an open access article distributed under the terms and conditions of the Creative Commons Attribution (CC BY) license (https://creativecommons.org/licenses/by/4.0/).
Share and Cite
Suchanicz, J.; Wąs, M.; Nowakowska-Malczyk, M.; Sitko, D.; Kluczewska-Chmielarz, K.; Konieczny, K.; Jagło, G.; Czaja, P.; Handke, B.; Kucia, Z.; et al. Properties of Na0.5Bi0.5TiO3 Ceramics Modified with Fe and Mn. Materials 2022, 15, 6204. https://doi.org/10.3390/ma15186204
Suchanicz J, Wąs M, Nowakowska-Malczyk M, Sitko D, Kluczewska-Chmielarz K, Konieczny K, Jagło G, Czaja P, Handke B, Kucia Z, et al. Properties of Na0.5Bi0.5TiO3 Ceramics Modified with Fe and Mn. Materials. 2022; 15(18):6204. https://doi.org/10.3390/ma15186204
Chicago/Turabian StyleSuchanicz, Jan, Marcin Wąs, Michalina Nowakowska-Malczyk, Dorota Sitko, Kamila Kluczewska-Chmielarz, Krzysztof Konieczny, Grzegorz Jagło, Piotr Czaja, Bartosz Handke, Zofia Kucia, and et al. 2022. "Properties of Na0.5Bi0.5TiO3 Ceramics Modified with Fe and Mn" Materials 15, no. 18: 6204. https://doi.org/10.3390/ma15186204
APA StyleSuchanicz, J., Wąs, M., Nowakowska-Malczyk, M., Sitko, D., Kluczewska-Chmielarz, K., Konieczny, K., Jagło, G., Czaja, P., Handke, B., Kucia, Z., Zając, P., & Łyszczarz, K. (2022). Properties of Na0.5Bi0.5TiO3 Ceramics Modified with Fe and Mn. Materials, 15(18), 6204. https://doi.org/10.3390/ma15186204