Experimental Research on Mechanical and Shrinkage Properties of Alkali Activated Low-Carbon Green Concrete

Abstract
:1. Introduction
2. Experiment Materials and Methods
2.1. Materials
2.2. Specimen Preparation and Testing
3. Results and Discussion
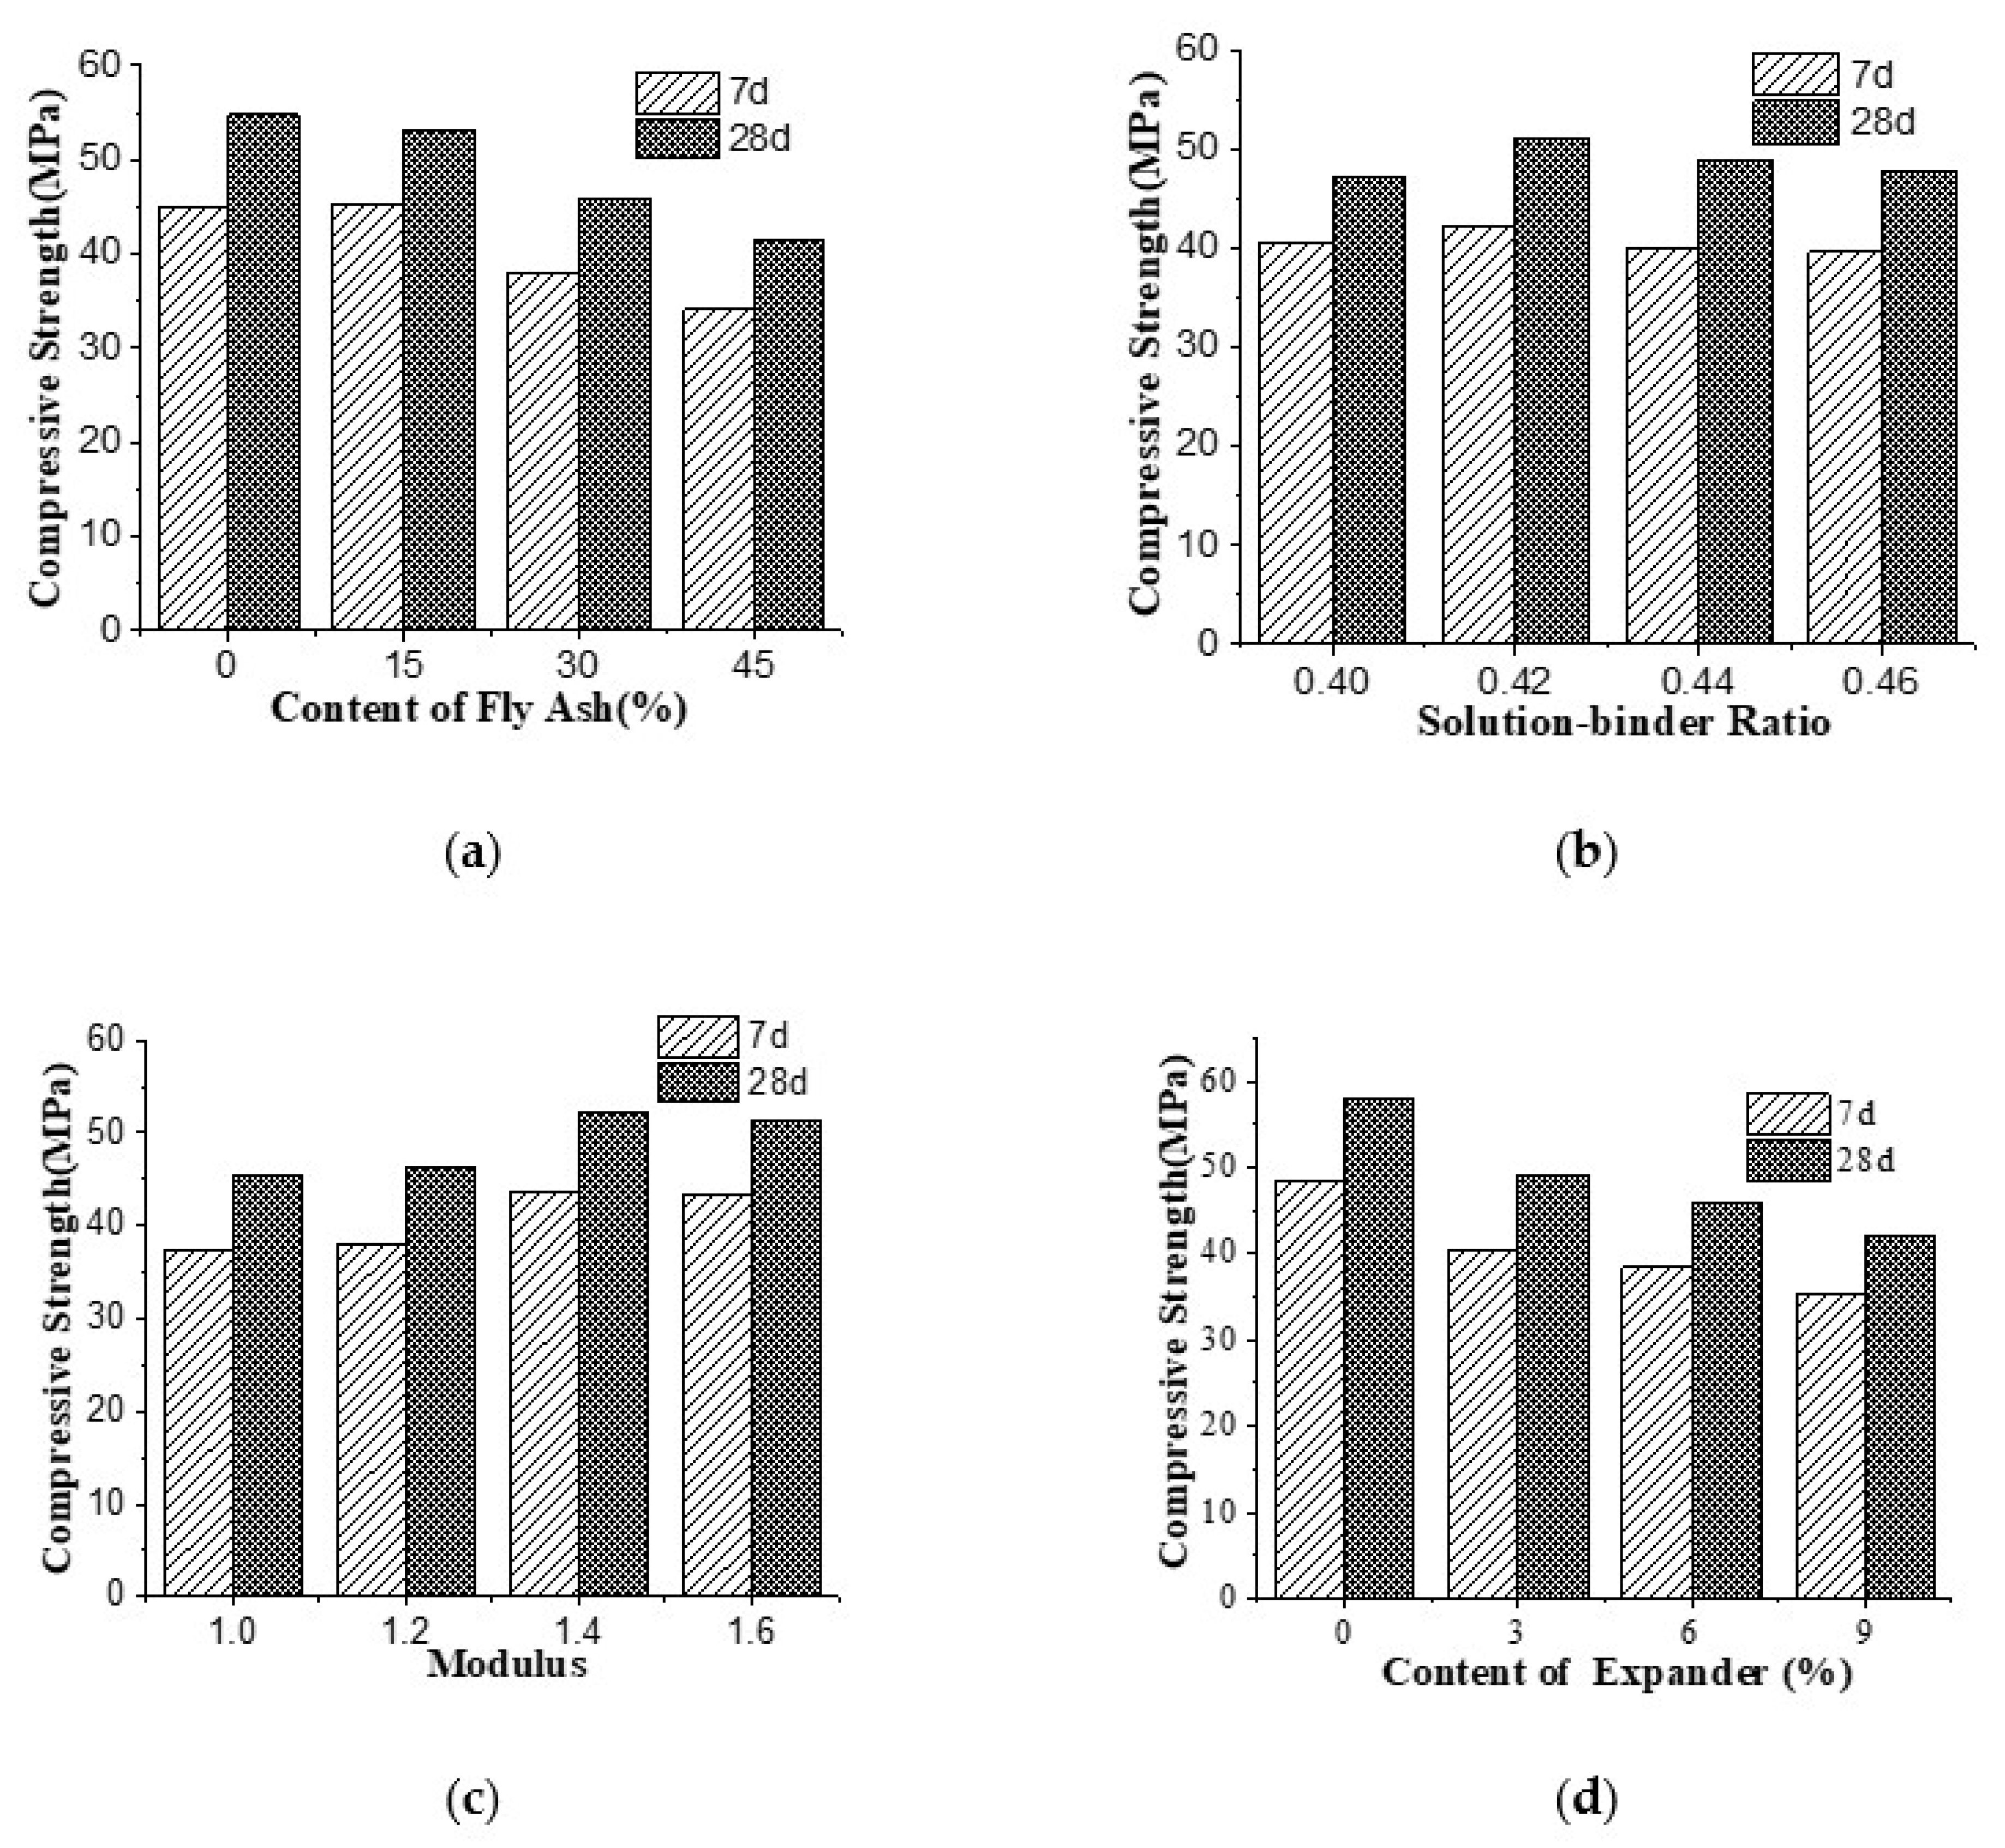
3.1. Compressive Strength
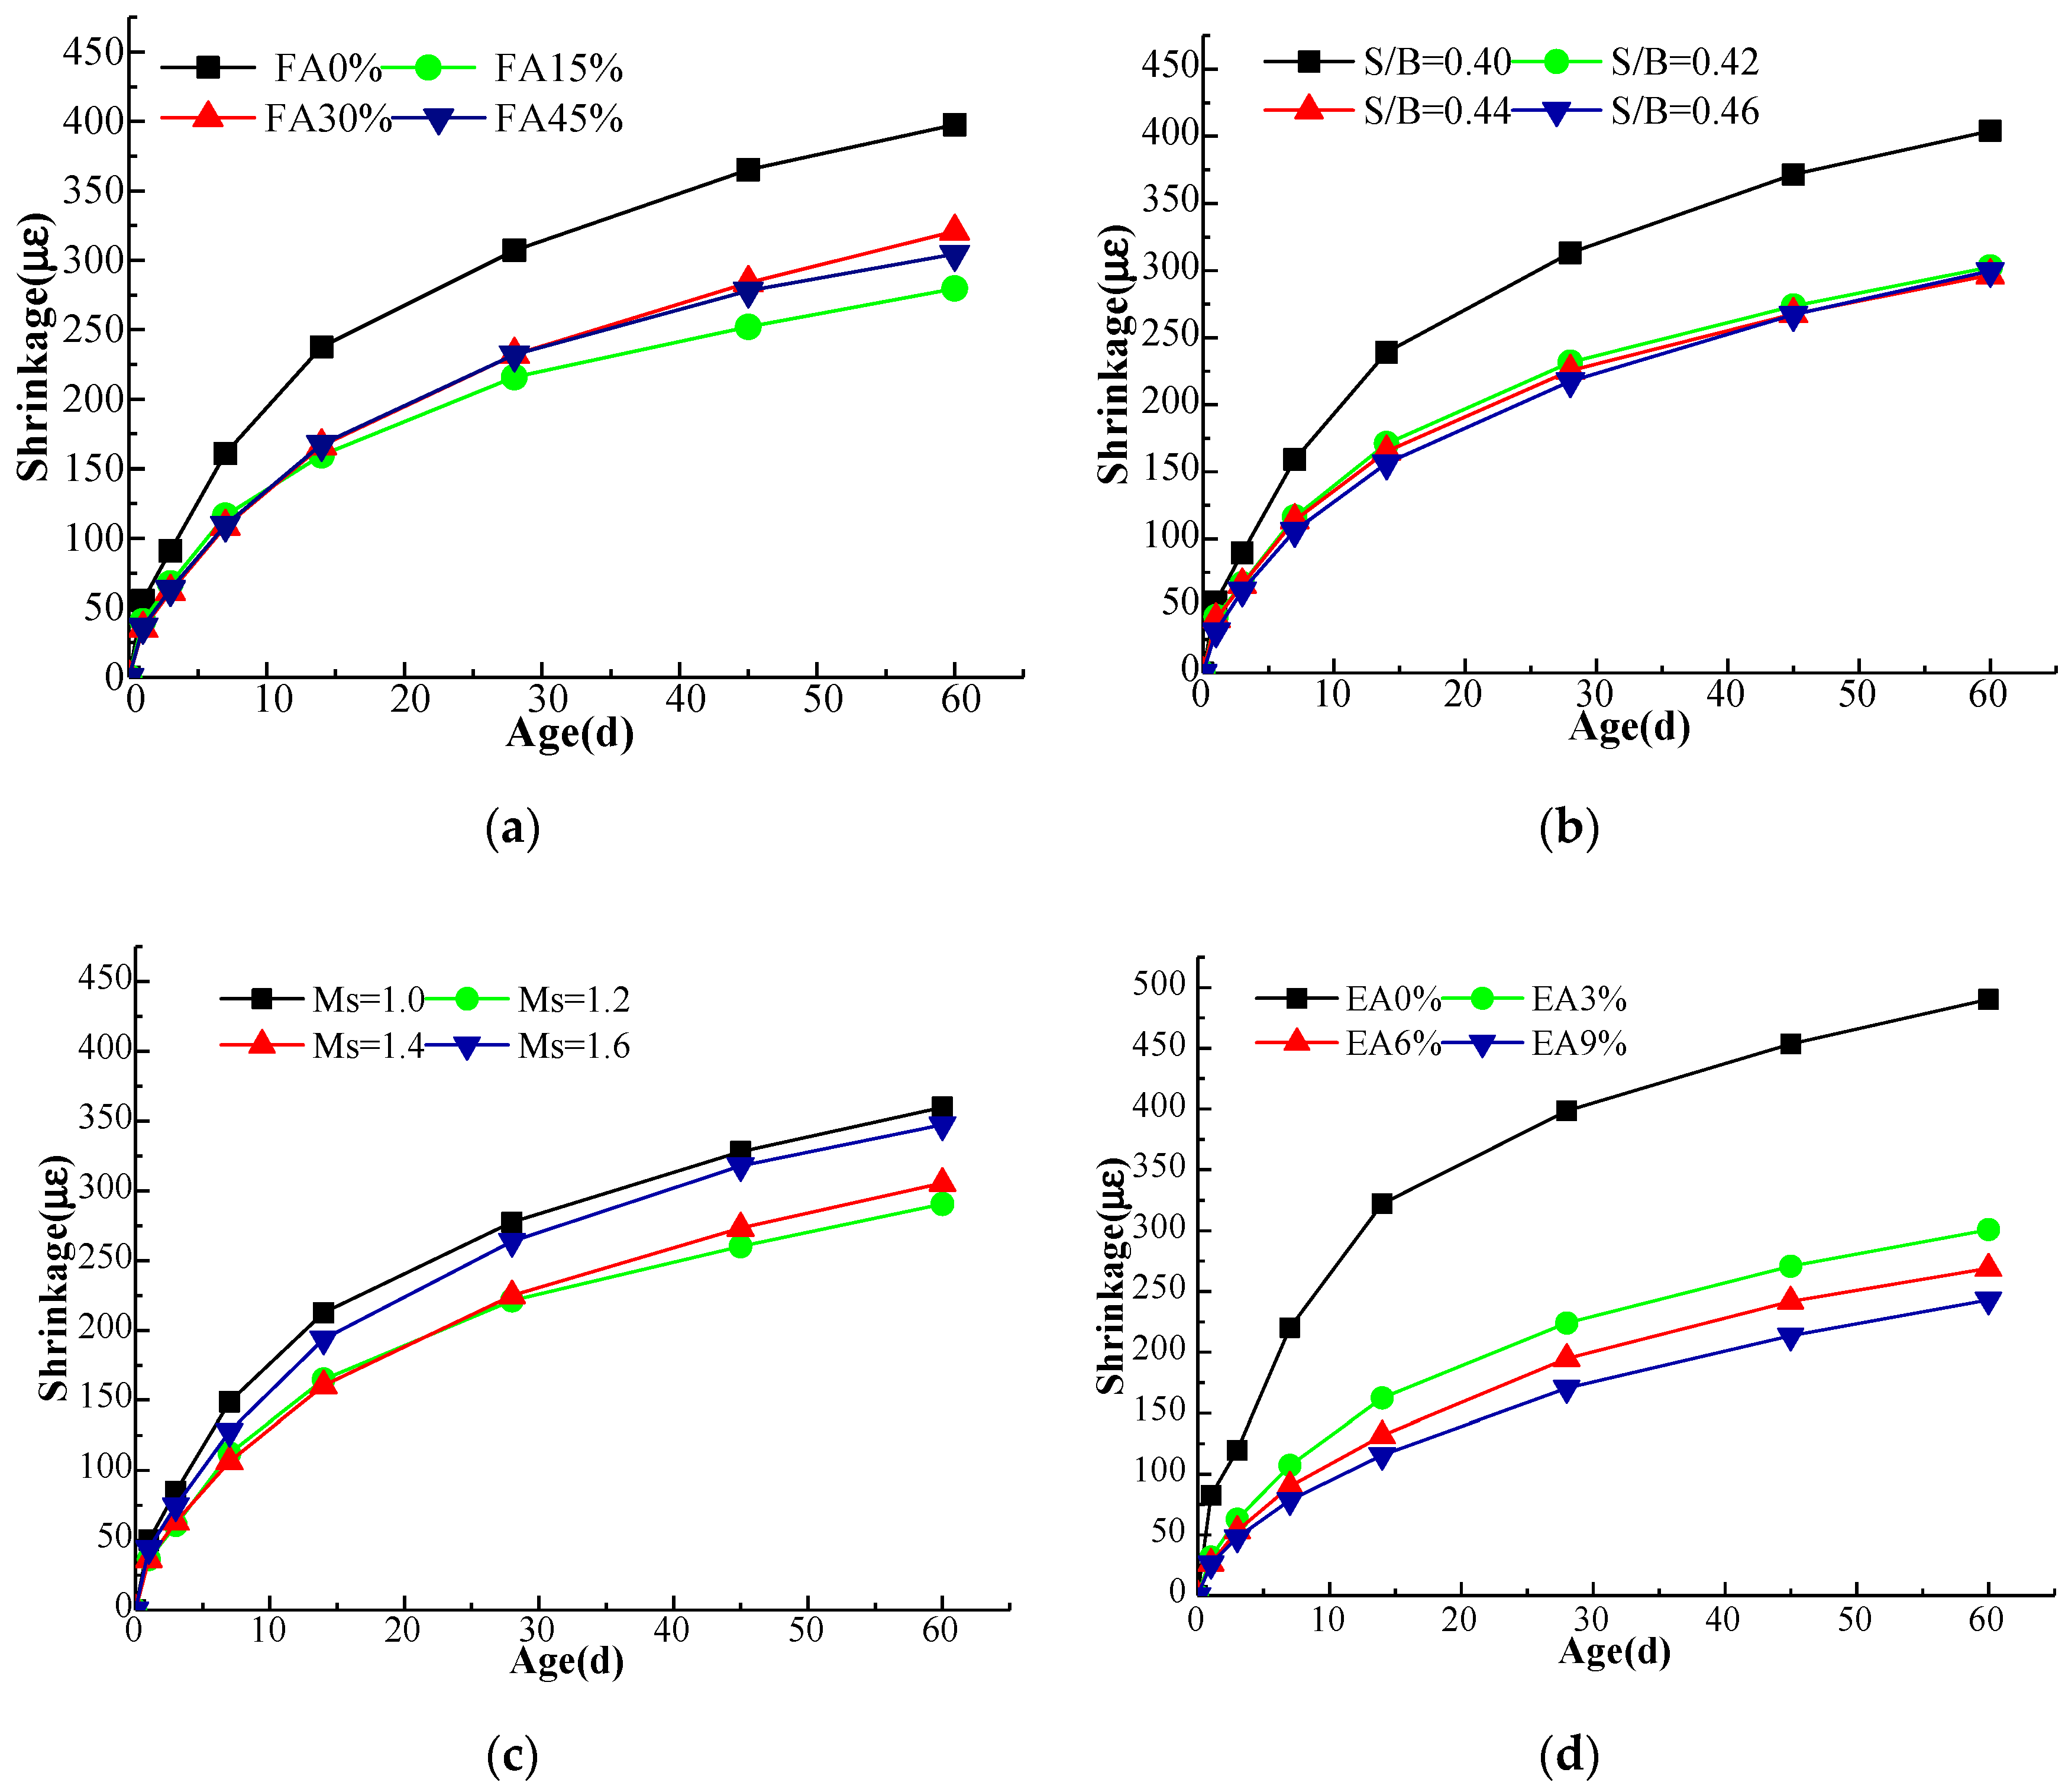
3.2. Drying Shrinkage
3.3. Microscopic Analysis of Alkali-Activated Green Concrete
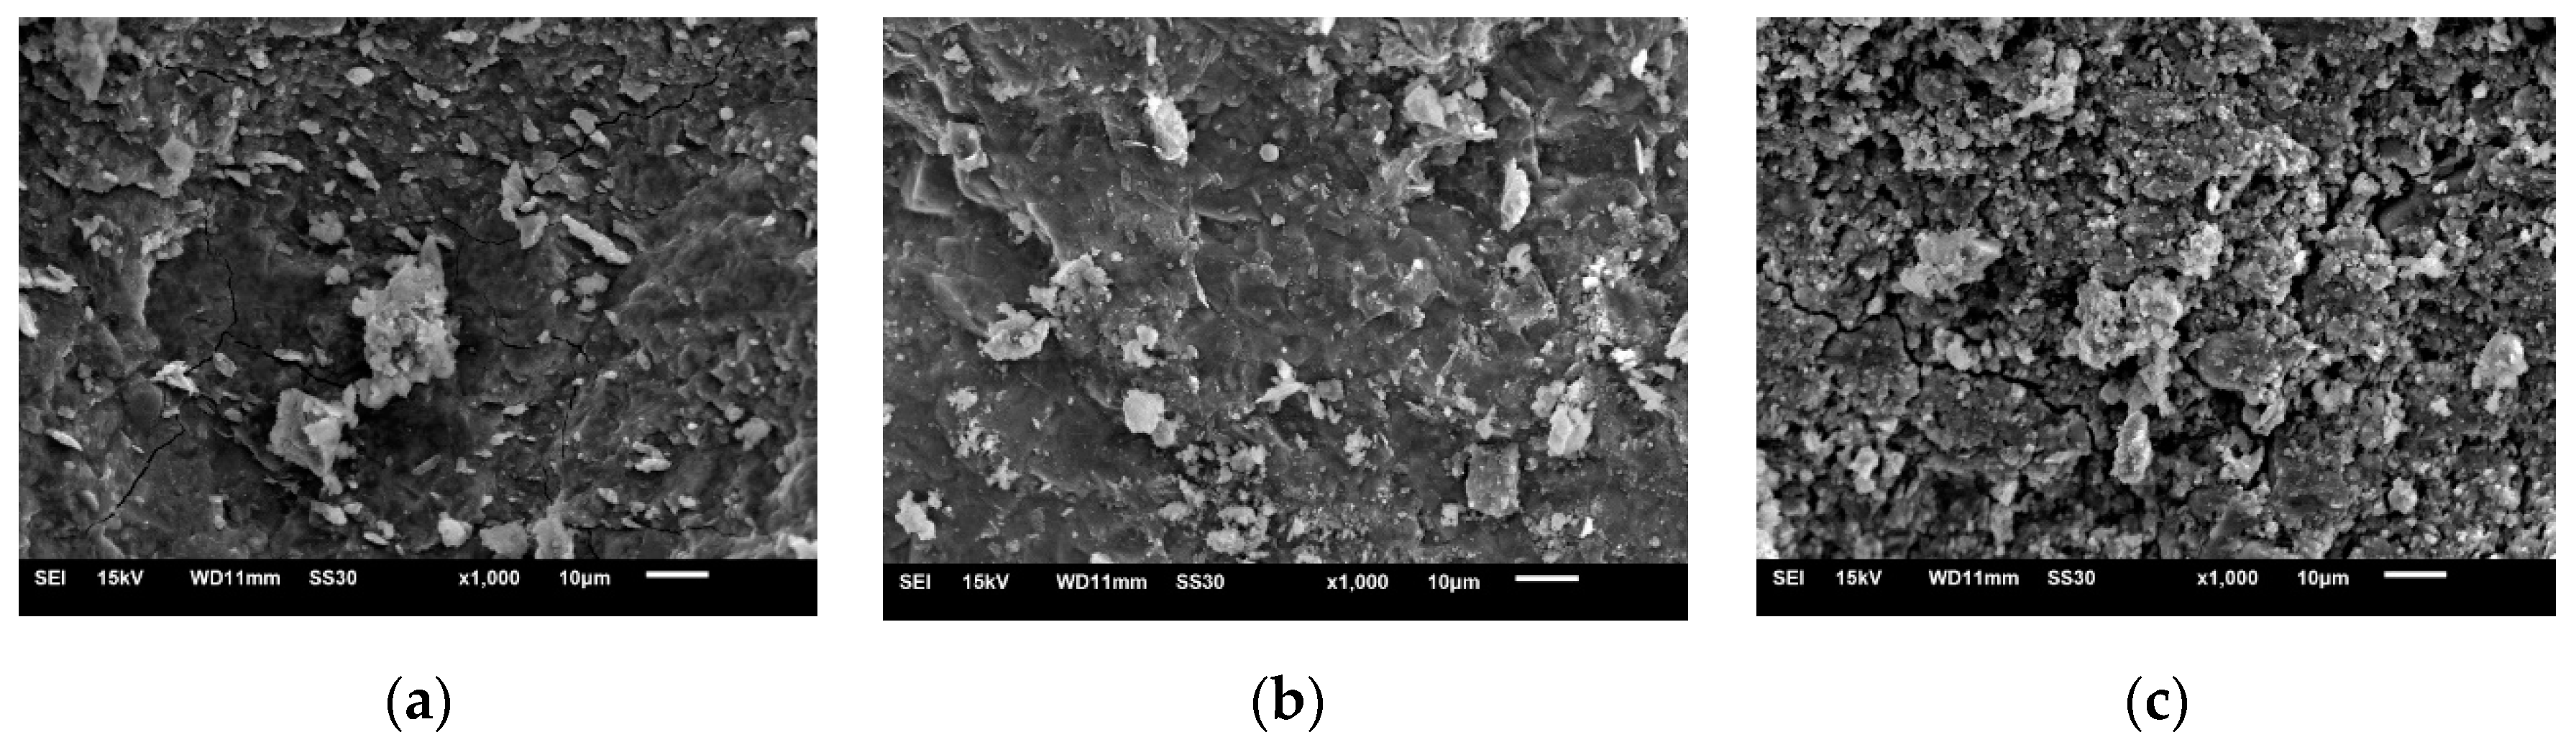
3.3.1. SEM Analysis
3.3.2. XRD Analysis
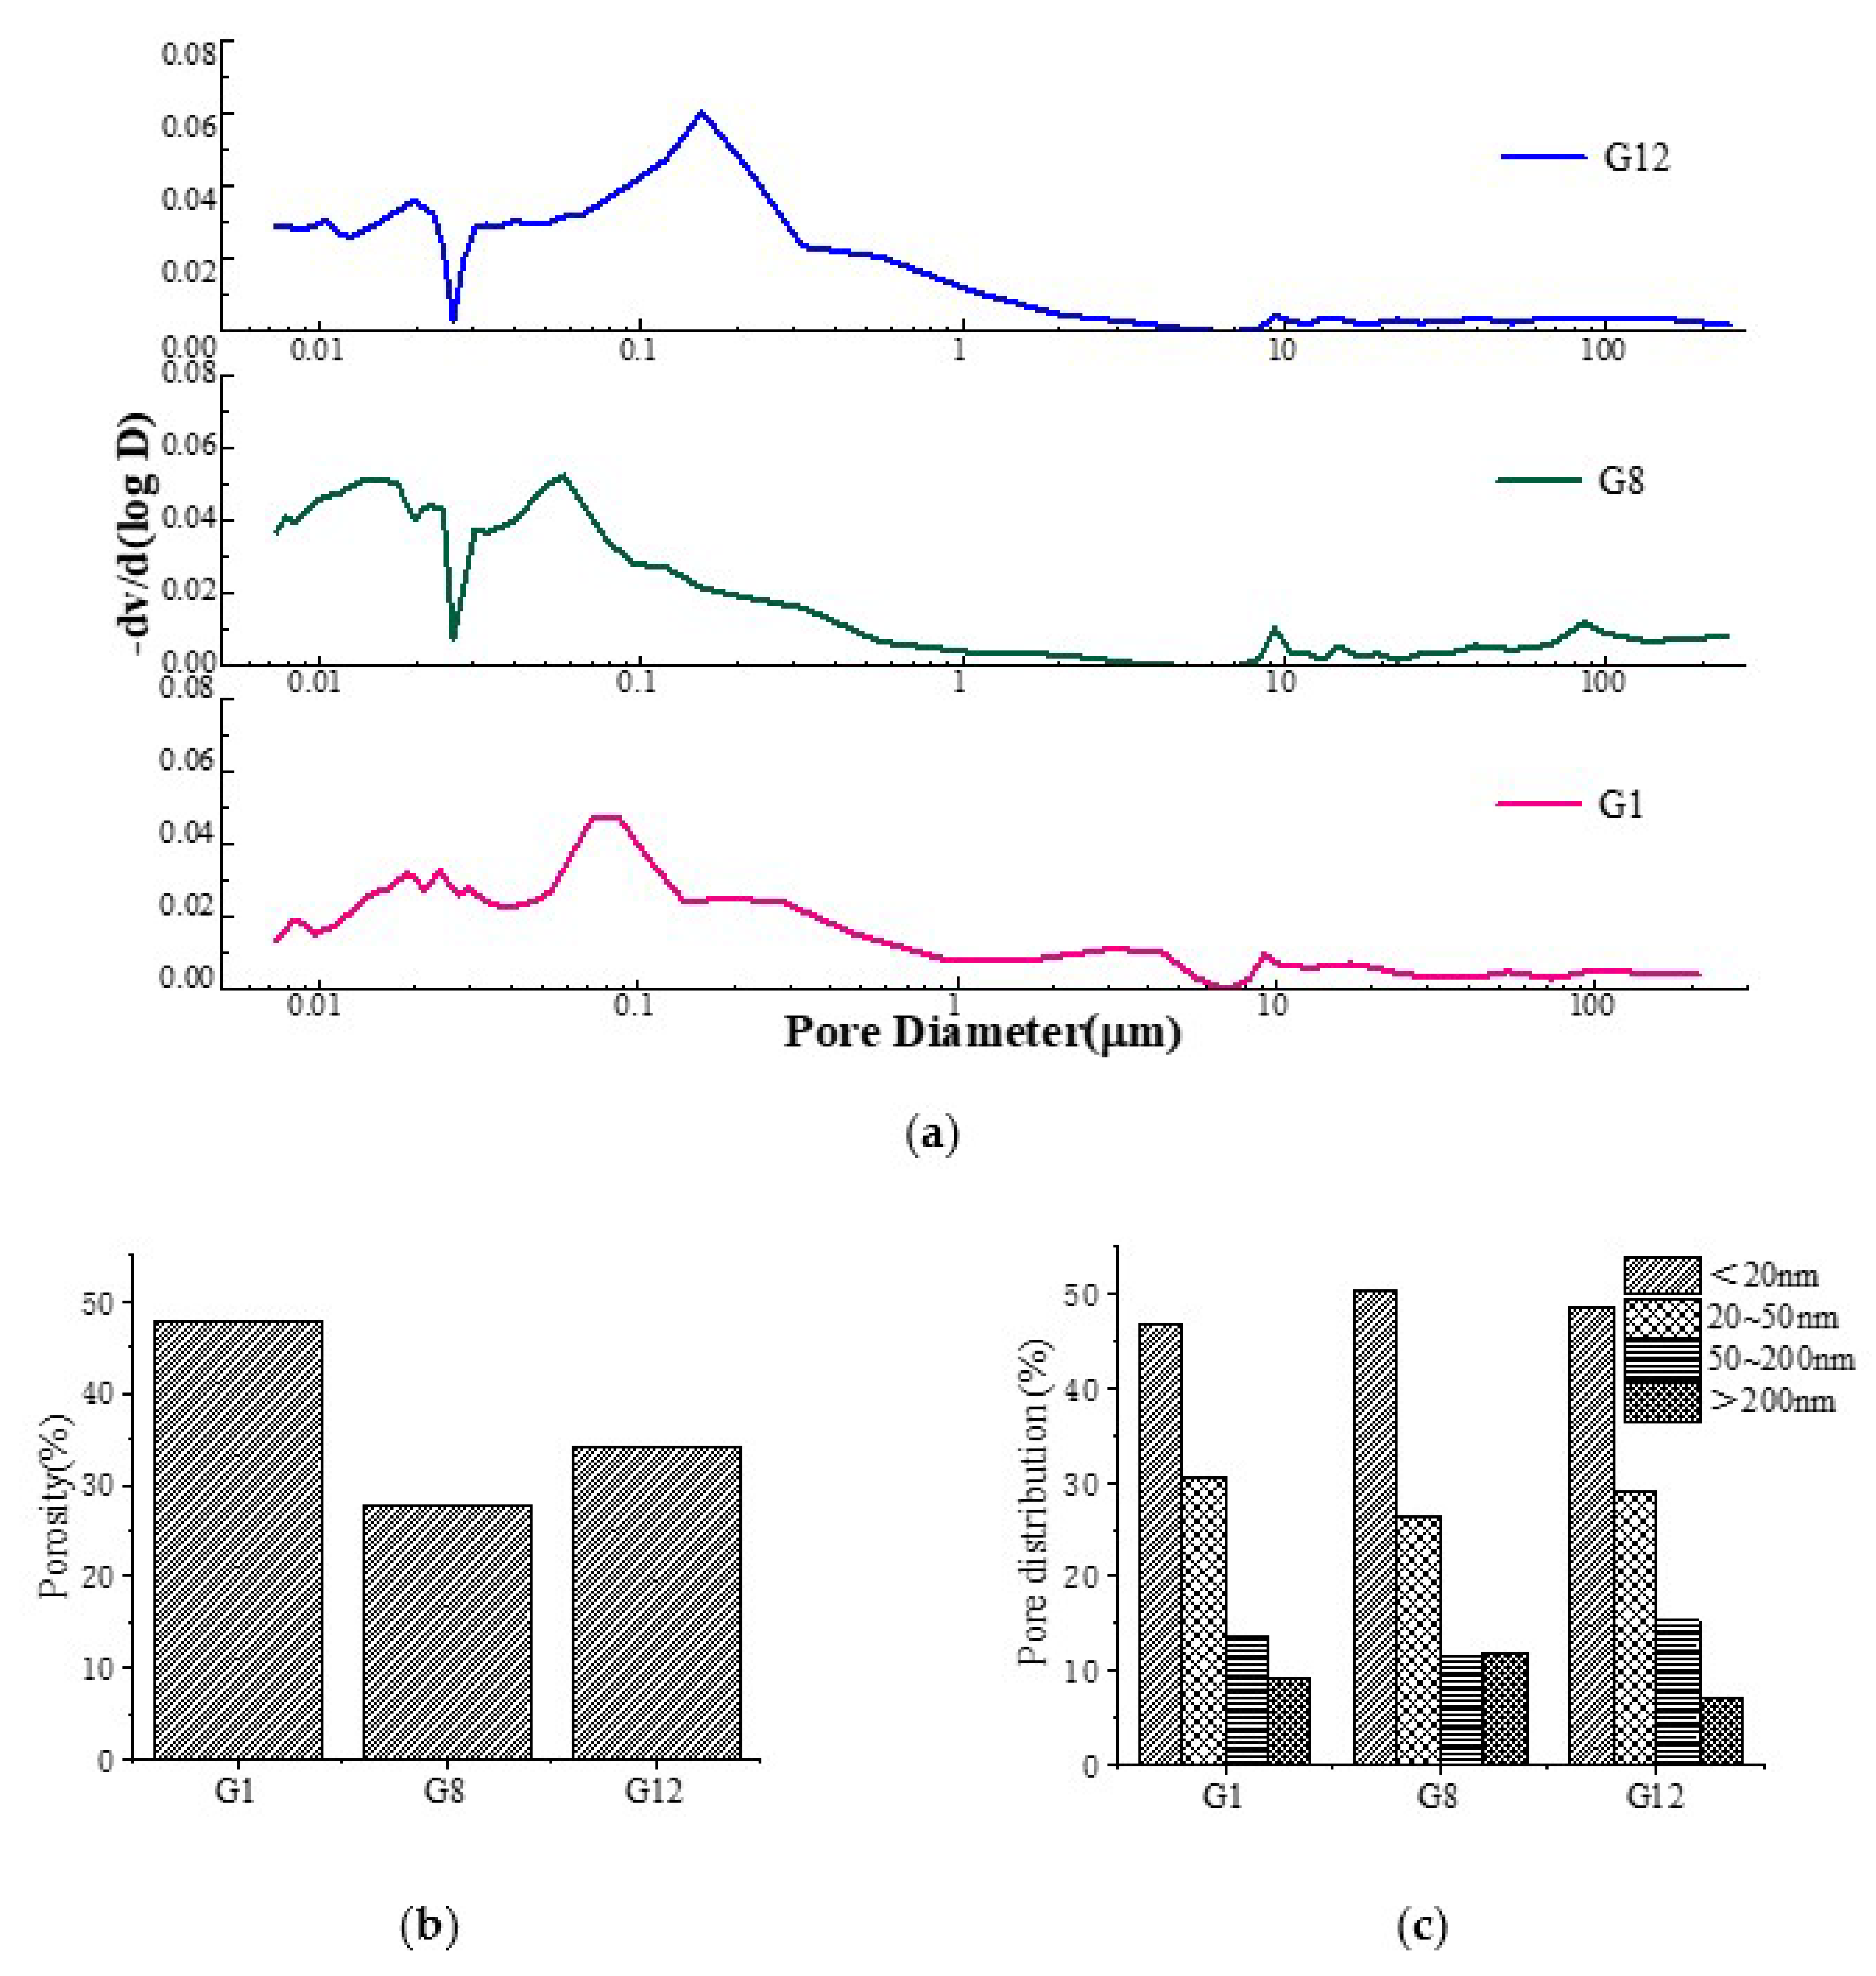
3.3.3. MIP Analysis
4. Conclusions
- (1)
- With an increase of fly ash content, the compressive strength of AAGC gradually decreased. The decline in compressive strength at 28 d was smaller than that at 7 d. As the content of fly ash increased from 0 to 45%, the compressive strength of the AAGC at 7 d and 28 d decreased from 48.3 to 35.3 MPa and from 58.0 to 42.1 MPa, respectively. With an increase of sol ratio, the compressive strength increased and then decreased at both 7 d and 28 d. When the sol ratio was 0.42, the compressive strength reached the maximum at 28 d; the same was true for compressive strength at 7 d. When the Ms increased, the compressive strength first increased and then decreased at 7 d and 28 d. When the Ms was 1.4, the compressive strength reached the maximum at 28 d. Finally, the compressive strength of AAGC decreased with an increase of expander content at 7 d and 28 d.
- (2)
- As the content of fly ash increased, the shrinkage strain of AAGC increased gradually at 28 d. The shrinkage strain showed no obvious change when the content was more than 30%. The shrinkage strain could be reduced with an increase of sol ratio at 28 d. When the sol ratio was 0.46, the shrinkage strain reached the minimum at 28 d. With an increase of Ms, the shrinkage strain of AAGC first decreased and then increased at 28 d. When Ms was 1.2, the shrinkage strain reached the minimum at 28 d. Finally, as the content of expander increased, the shrinkage strain decreased gradually at 28 d.
- (3)
- When a small amount of fly ash and expander were added to AAGC, there were more hydration products, and the extent internal micro-cracks was significantly reduced. The AAGC only mixed with fly ash contained many unhydrated particles, and the structure was loose. The main hydration product of AAGC was found to be C-S-H gel. There were some carbonation reactions in AAGC without fly ash, and crystallization decreased with an increase of fly ash content. The addition of fly ash greatly reduced the porosity, as did the addition of expander. In addition, the proportion of small hole volume increased, while that of large hole volume decreased.
Author Contributions
Funding
Institutional Review Board Statement
Informed Consent Statement
Conflicts of Interest
References
- Duxson, P.; Provis, J.L.; Lukey, G.C.; Van Deventer, J.S. The role of inorganic polymer technology in the development of green concrete. Cem. Concr. Res. 2007, 37, 1590–1597. [Google Scholar] [CrossRef]
- Van Deventer, J.S.; Provis, J.L.; Duxson, P. Technical and commercial progress in the adoption of geopolymer cement. Miner. Eng. 2012, 29, 89–104. [Google Scholar] [CrossRef]
- Davidovits, J. Geopolymers and geopolymeric materials. J. Therm. Anal. Calorim. 1989, 35, 429–441. [Google Scholar] [CrossRef]
- Vasconcelos, E.; Fernandes, S.; De Aguiar, J.B.; Pacheco-Torgal, F. Concrete retrofitting using metakaolin geopolymer mortars and CFRP. Constr. Build. Mater. 2011, 25, 3213–3221. [Google Scholar] [CrossRef]
- Flowerday, A.C.J.; Wright, P.N.H.; Ledger, R.O.; Gibson, A.G. Investigation into the use of geopolymers for fire resistant marine composites. In RINA, Royal Institution of Naval Architects International Conference-Advanced Marine Materials and Coatings; Newcastle University: Newcastle upon Tyne, UK, 2006. [Google Scholar]
- Kumar, B.S.C.; Ramesh, K. An experimental study on metakaolin and GGBS based geopolymer concrete. Int. J. Eng. Technol. 2017, 9, 544–557. [Google Scholar]
- Fan, F.; Liu, Z.; Xu, G.; Peng, H.; Cai, C.S. Mechanical and thermal properties of fly ash based geopolymers. Constr. Build. Mater. 2018, 160, 66–81. [Google Scholar] [CrossRef]
- Sofi, M.; Van Deventer, J.S.J.; Mendis, P.A.; Lukey, G.C. Engineering properties of inorganic polymer concretes (IPCs). Cem. Concr. Res. 2006, 37, 251–257. [Google Scholar] [CrossRef]
- Zhou, S.; Ma, C.; Long, G.; Xie, Y. A novel non-Portland cementitious material: Mechanical properties, durability and characterization. Constr. Build. Mater. 2020, 238, 117671. [Google Scholar] [CrossRef]
- Yang, T.; Zhu, H.; Zhang, Z. Influence of fly ash on the pore structure and shrinkage characteristics of metakaolin-based geopolymer pastes and mortars. Constr. Build. Mater. 2017, 153, 284–293. [Google Scholar] [CrossRef]
- Hardjito, D.; Wallah, S.E.; Sumajouw, D.M.; Rangan, B.V. On the development of fly ash-based geopolymer concrete. ACI Mater. J. 2004, 101, 467–472. [Google Scholar]
- Chi, M. Effects of dosage of alkali-activated solution and curing conditions on the properties and durability of alkali-activated slag concrete. Constr. Build. Mater. 2012, 35, 240–245. [Google Scholar] [CrossRef]
- Lee, N.K.; Jang, J.G.; Lee, H.K. Shrinkage characteristics of alkali-activated fly ash/slag paste and mortar at early ages. Cem. Concr. Res. 2014, 53, 239–248. [Google Scholar] [CrossRef]
- Jia, Z.; Yang, Y.; Yang, L.; Zhang, Y.; Sun, Z. Hydration products, internal relative humidity and drying shrinkage of alkali activated slag mortar with expansion agents. Constr. Build. Mater. 2018, 158, 198–207. [Google Scholar] [CrossRef]
- Zhu, X.; Tang, D.; Yang, K.; Zhang, Z.; Li, Q.; Pan, Q.; Yang, C. Effect of Ca(OH)2 on shrinkage characteristics and microstructures of alkali-activated slag concrete. Constr. Build. Mater. 2018, 175, 467–482. [Google Scholar] [CrossRef]
- Deb, P.S.; Nath, P.; Sarker, P.K. Drying Shrinkage of Slag Blended Fly Ash Geopolymer Concrete Cured at Room Temperature. Procedia Eng. 2015, 125, 594–600. [Google Scholar] [CrossRef]
- Un, C.H.; Sanjayan, J.G.; San Nicolas, R.; Van Deventer, J.S.J. Predictions of long-term deflection of geopolymer concrete beams. Constr. Build. Mater. 2015, 94, 10–19. [Google Scholar] [CrossRef]
- Mastali, M.; Kinnunen, P.; Dalvand, A.; Firouz, R.M.; Illikainen, M. Drying shrinkage in alkali-activated blinders-a critical review. Constr. Build. Mater. 2018, 190, 533–550. [Google Scholar] [CrossRef]
- Gao, X.; Yu, Q.L.; Brouwers, H.J.H. Assessing the porosity and shrinkage of alkali activated slag-fly ash composites designed applying a packing model. Constr. Build. Mater. 2016, 119, 175–184. [Google Scholar] [CrossRef]
- Yuan, B.; Yu, Q.L.; Dainese, E.; Brouwers, H.J.H. Autogenous and drying shrinkage of sodium carbonate active slag altered by limestone power incorporation. Constr. Build. Mater. 2017, 153, 459–468. [Google Scholar] [CrossRef]
- Ma, Y.; Ye, G. The shrinkage of alkali activated fly ash. Cem. Concr. Res. 2015, 68, 75–82. [Google Scholar] [CrossRef]
- Yuan, X.H.; Chen, W.; Lu, Z.A.; Chen, H. Shrinkage compensation of alkali-activated slag concrete and microstructural analysis. Constr. Build. Mater. 2014, 66, 422–428. [Google Scholar] [CrossRef]
- Kuenzel, C.; Vandeperre, L.J.; Donatello, S.; Boccaccini, A.R.; Cheeseman, C. Ambient Temperature Drying Shrinkage and Cracking in Metakaolin-Based Geopolymers. J. Am. Ceram. Soc. 2012, 95, 3270–3277. [Google Scholar] [CrossRef] [Green Version]
- Lloyd, N.; Rangan, B. Geopolymer concrete with fly ash. In Proceedings of the Second International Conference on Sustainable Construction Materials and Technologies 2010, Ancone, Italy, 28–30 June 2010; pp. 1493–1504. [Google Scholar]
- Auqui, N.U.; Baykara, H.; Rigail, A.; Cornejo, M.H.; Villalba, J.L. An investigation of the effect of migratory type corrosion inhibitor on mechanical properties of zeolite-based novel geopolymers. J. Mol. Struct. 2017, 1146, 814–820. [Google Scholar] [CrossRef]
- Vidal, L.; Joussein, E.; Colas, M.; Absi, J.; Rossignol, S. Effect of the addition of ammonium molybdate on metakaolin-based geopolymer formation: Shrinkage and crystallization. Powder Technol. 2015, 275, 211–219. [Google Scholar] [CrossRef]
- Yip, C.K.; Provis, J.L.; Lukey, G.C.; van Deventer, J.S. Carbonate mineral addition to metakaolin-based geopolymers. Cem. Concr. Compos. 2008, 30, 979–985. [Google Scholar] [CrossRef]
- Gevaudan, J.P.; Campbell, K.M.; Kane, T.J.; Shoemaker, R.K.; Srubar, W.V., III. Mineralization dynamics of metakaolin-based alkali-activated cements. Cem. Concr. Res. 2017, 94, 1–12. [Google Scholar] [CrossRef]
- Parthiban, K.; Saravana Raja Mohan, K. Influence of recycled concrete aggregates on the engineering and durability properties of alkali activated slag concrete. Constr. Build. Mater. 2017, 133, 65–72. [Google Scholar] [CrossRef]
- Albitar, M.; Ali, M.M.; Visintin, P.; Drechsler, M. Durability evaluation of geopolymer and conventional concretes. Constr. Build. Mater. 2017, 136, 374–385. [Google Scholar] [CrossRef]
- Ban, C.C.; Ken, P.W.; Ramli, M. Mechanical and Durability Performance of Novel Self-activating Geopolymer Mortars. Procedia Eng. 2017, 171, 564–571. [Google Scholar] [CrossRef]
- Luhar, S.; Cheng, T.W.; Nicolaides, D.; Luhar, I.; Panias, D.; Sakkas, K. Valorisation of glass wastes for the development of geopolymer composites—Durability, thermal and microstructural properties: A review. Constr. Build. Mater. 2019, 222, 673–687. [Google Scholar] [CrossRef]


| Materials | CaO | SiO2 | Al2O3 | MgO | SO3 | TiO2 | Fe2O3 | MnO | Others |
|---|---|---|---|---|---|---|---|---|---|
| Slag | 43.26 | 29.32 | 16.78 | 7.04 | 1.71 | 0.88 | 0.55 | 0.46 | - |
| Fly ash | 5.65 | 53.21 | 32.36 | 1.58 | 2.23 | - | 2.87 | - | 2.1 |
| Target | Modulus | Baume Degree | Density | SiO2 (%) | Na2O (%) | Insoluble (%) | Iron Content (%) |
|---|---|---|---|---|---|---|---|
| Value | 3.1–3.4 | 39.2–40.2 | 1.368–1.394 | ≥26 | ≥8.2 | ≤0.2 | ≤0.02 |
| Component (%) | Setting Time (min) | |||||
|---|---|---|---|---|---|---|
| CaO | Sieving Residue | Humidity | Alkali Content | Cl− | Initial Set | Iinal Set |
| ≥98 | ≤0.50 | ≤0.40 | ≤0.20 | ≤0.03 | 165 | 350 |
| NO. | Fly Ash Content (FA%) | Sol Ratio (S/C) | Modulus (Ms) | Expander (EA%) |
|---|---|---|---|---|
| 1 | 0 | 0.40 | 1.0 | 0 |
| 2 | 15 | 0.42 | 1.2 | 3 |
| 3 | 30 | 0.44 | 1.4 | 6 |
| 4 | 45 | 0.46 | 1.6 | 9 |
| NO. | Fly Ash (kg/m3) | Slag (kg/m3) | Alkali Solution (kg/m3) | Modulus (Ms) | Expander (kg/m3) | Sand (kg/m3) | Gravel (kg/m3) |
|---|---|---|---|---|---|---|---|
| G1 | 0 | 400 | 160 | 1.0 | 0 | 716 | 1074 |
| G2 | 0 | 400 | 168 | 1.2 | 12 | 716 | 1074 |
| G3 | 0 | 400 | 176 | 1.4 | 24 | 716 | 1074 |
| G4 | 0 | 400 | 184 | 1.6 | 36 | 716 | 1074 |
| G5 | 60 | 340 | 160 | 1.4 | 24 | 716 | 1074 |
| G6 | 60 | 340 | 168 | 1.6 | 36 | 716 | 1074 |
| G7 | 60 | 340 | 176 | 1.0 | 0 | 716 | 1074 |
| G8 | 60 | 340 | 184 | 1.2 | 12 | 716 | 1074 |
| G9 | 120 | 280 | 160 | 1.6 | 36 | 716 | 1074 |
| G10 | 120 | 280 | 168 | 1.4 | 24 | 716 | 1074 |
| G11 | 120 | 280 | 176 | 1.2 | 12 | 716 | 1074 |
| G12 | 120 | 280 | 184 | 1.0 | 0 | 716 | 1074 |
| G13 | 180 | 220 | 160 | 1.2 | 12 | 716 | 1074 |
| G14 | 180 | 220 | 168 | 1.0 | 0 | 716 | 1074 |
| G15 | 180 | 220 | 176 | 1.6 | 36 | 716 | 1074 |
| G16 | 180 | 220 | 184 | 1.4 | 24 | 716 | 1074 |
Publisher’s Note: MDPI stays neutral with regard to jurisdictional claims in published maps and institutional affiliations. |
© 2022 by the authors. Licensee MDPI, Basel, Switzerland. This article is an open access article distributed under the terms and conditions of the Creative Commons Attribution (CC BY) license (https://creativecommons.org/licenses/by/4.0/).
Share and Cite
Xu, S.; Gao, P.; Huang, L.; Tang, L.; Gu, X.; Wang, L. Experimental Research on Mechanical and Shrinkage Properties of Alkali Activated Low-Carbon Green Concrete. Materials 2022, 15, 5984. https://doi.org/10.3390/ma15175984
Xu S, Gao P, Huang L, Tang L, Gu X, Wang L. Experimental Research on Mechanical and Shrinkage Properties of Alkali Activated Low-Carbon Green Concrete. Materials. 2022; 15(17):5984. https://doi.org/10.3390/ma15175984
Chicago/Turabian StyleXu, Shaoyun, Peiwei Gao, Lingling Huang, Longlong Tang, Xingqing Gu, and Limin Wang. 2022. "Experimental Research on Mechanical and Shrinkage Properties of Alkali Activated Low-Carbon Green Concrete" Materials 15, no. 17: 5984. https://doi.org/10.3390/ma15175984
APA StyleXu, S., Gao, P., Huang, L., Tang, L., Gu, X., & Wang, L. (2022). Experimental Research on Mechanical and Shrinkage Properties of Alkali Activated Low-Carbon Green Concrete. Materials, 15(17), 5984. https://doi.org/10.3390/ma15175984