
Activated Biocarbons Obtained from Plant Biomass as Adsorbents of Heavy Metal Ions

 ,
,  ,
, 
Abstract
:1. Introduction
2. Materials and Methods
2.1. Materials
2.2. Adsorption Experiments
2.3. Analytical Procedures
2.4. Electrokinetic Measurements
3. Results
3.1. Elemental Composition of the Precursors and Activated Biocarbons Prepared
3.2. Acidic-Basic Properties of the Activated Biocarbons Prepared from Waste Biomass
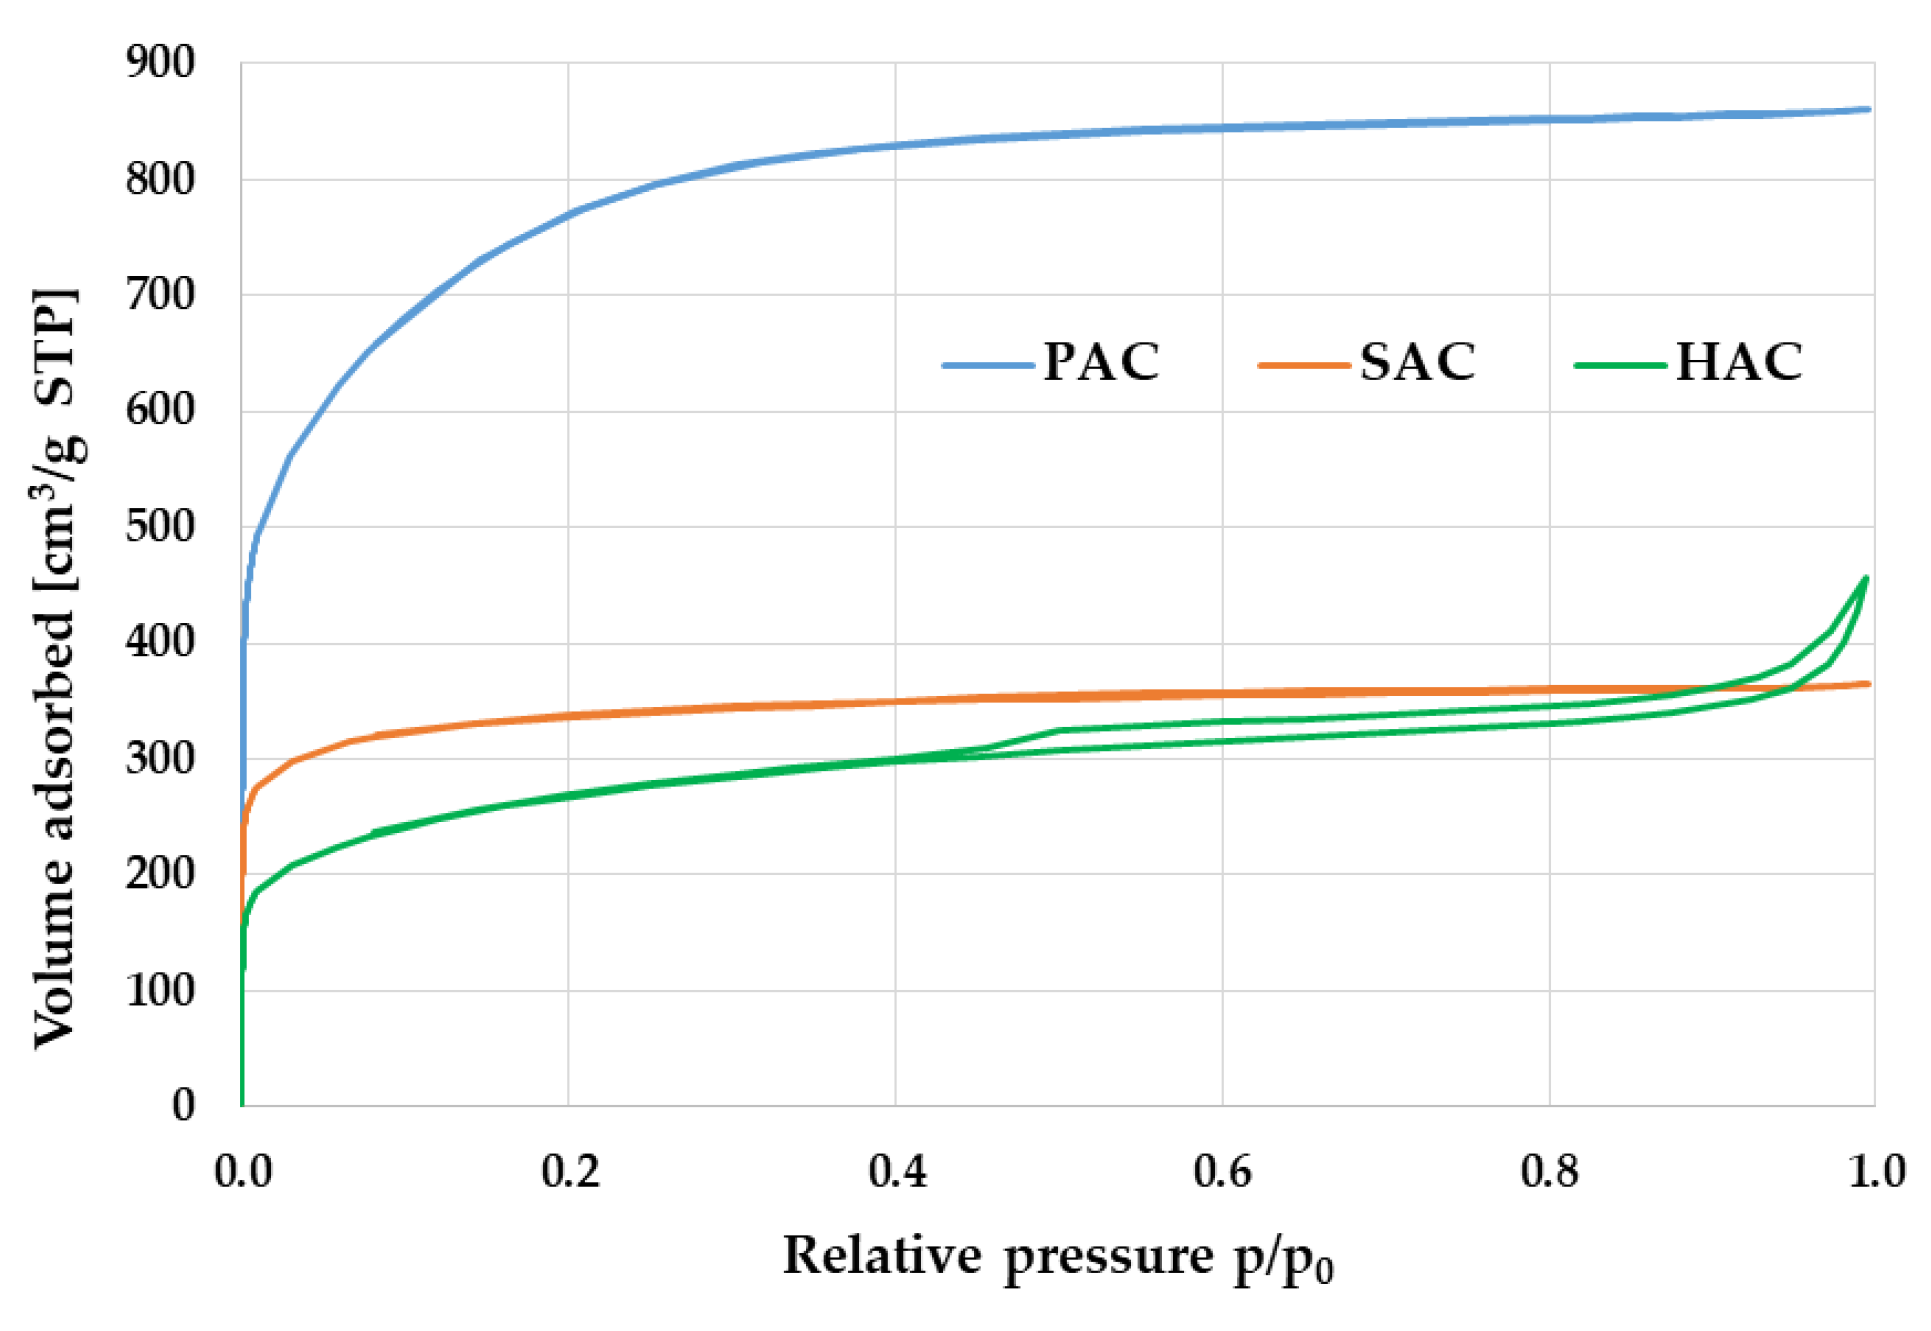
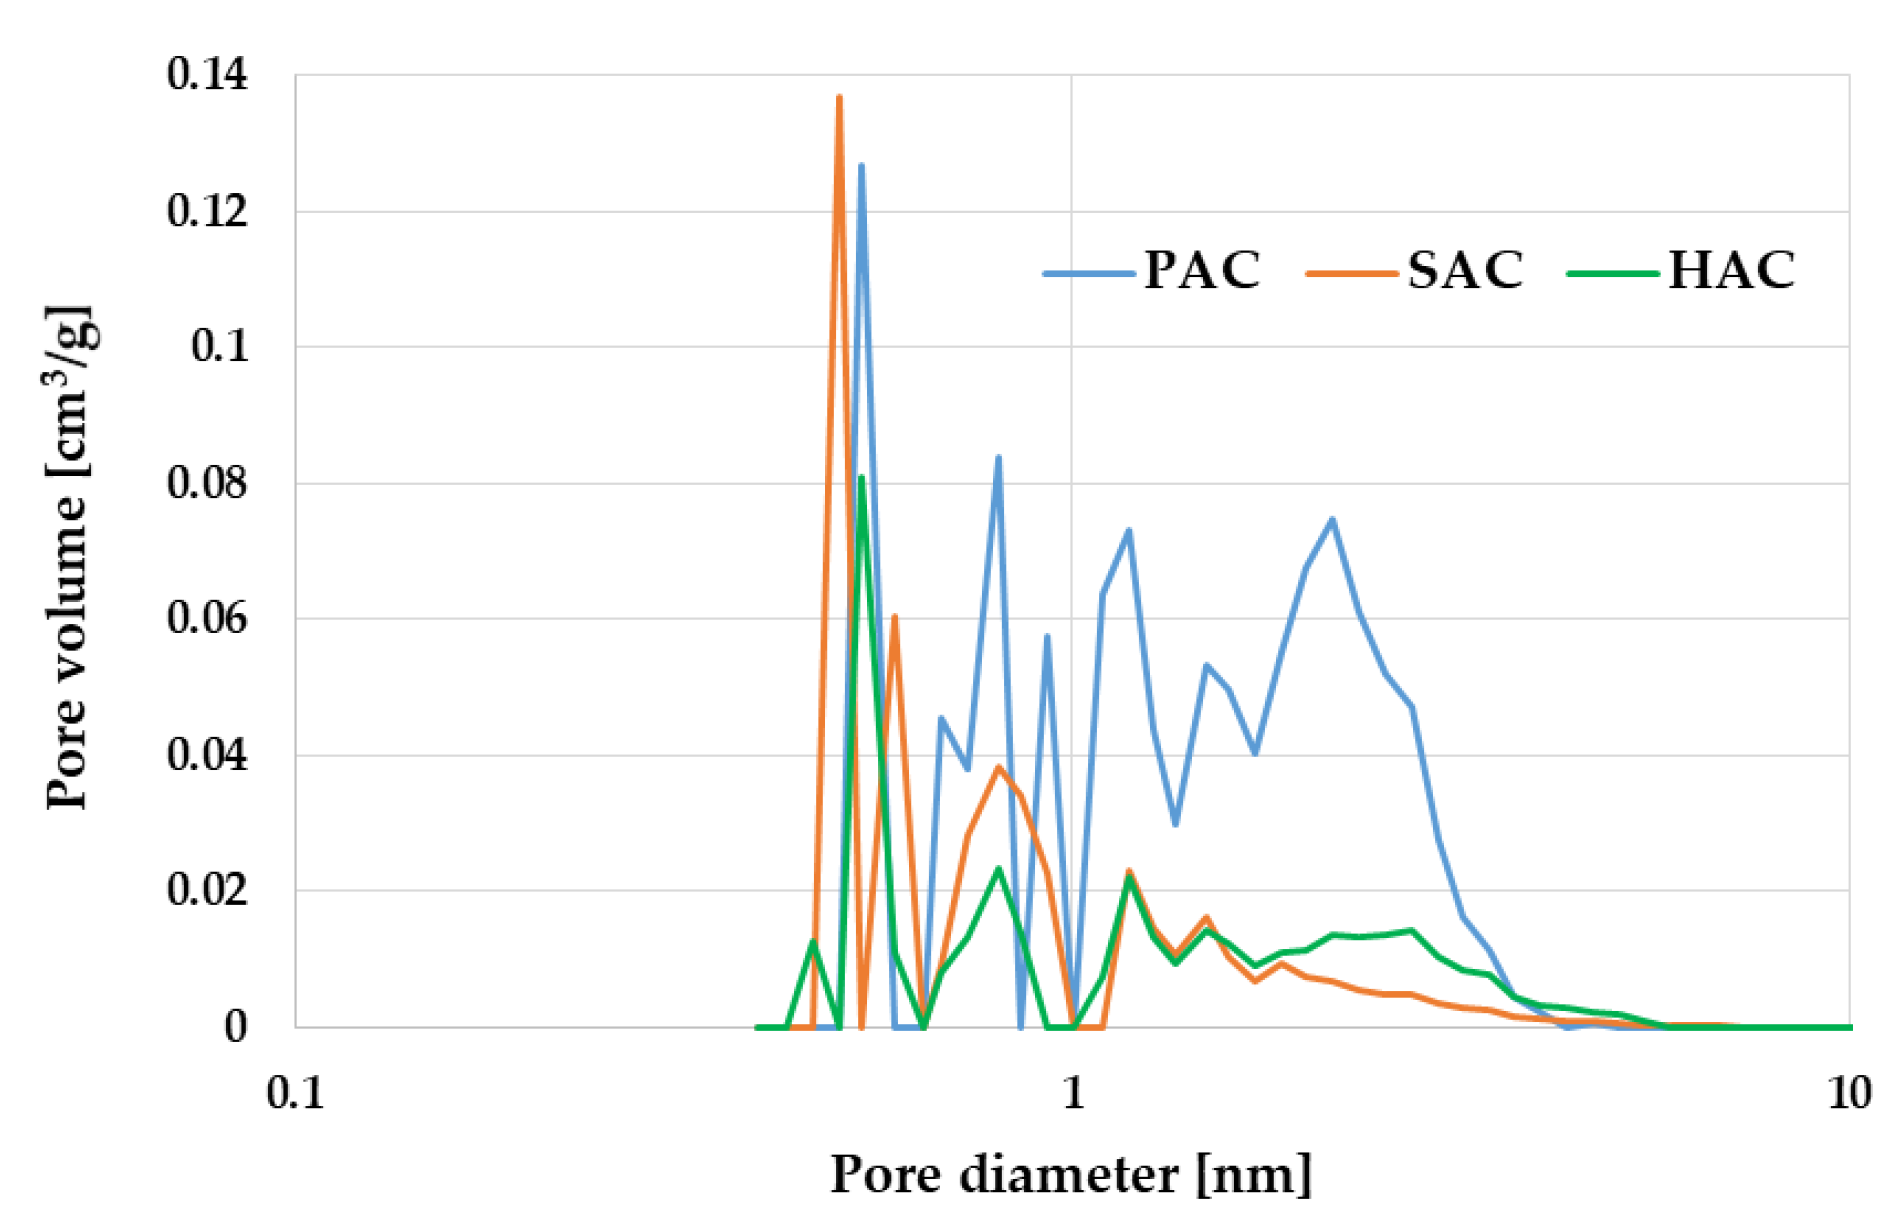
3.3. Textural Parameters and Morphology of the Activated Biocarbons Prepared from Waste Biomass
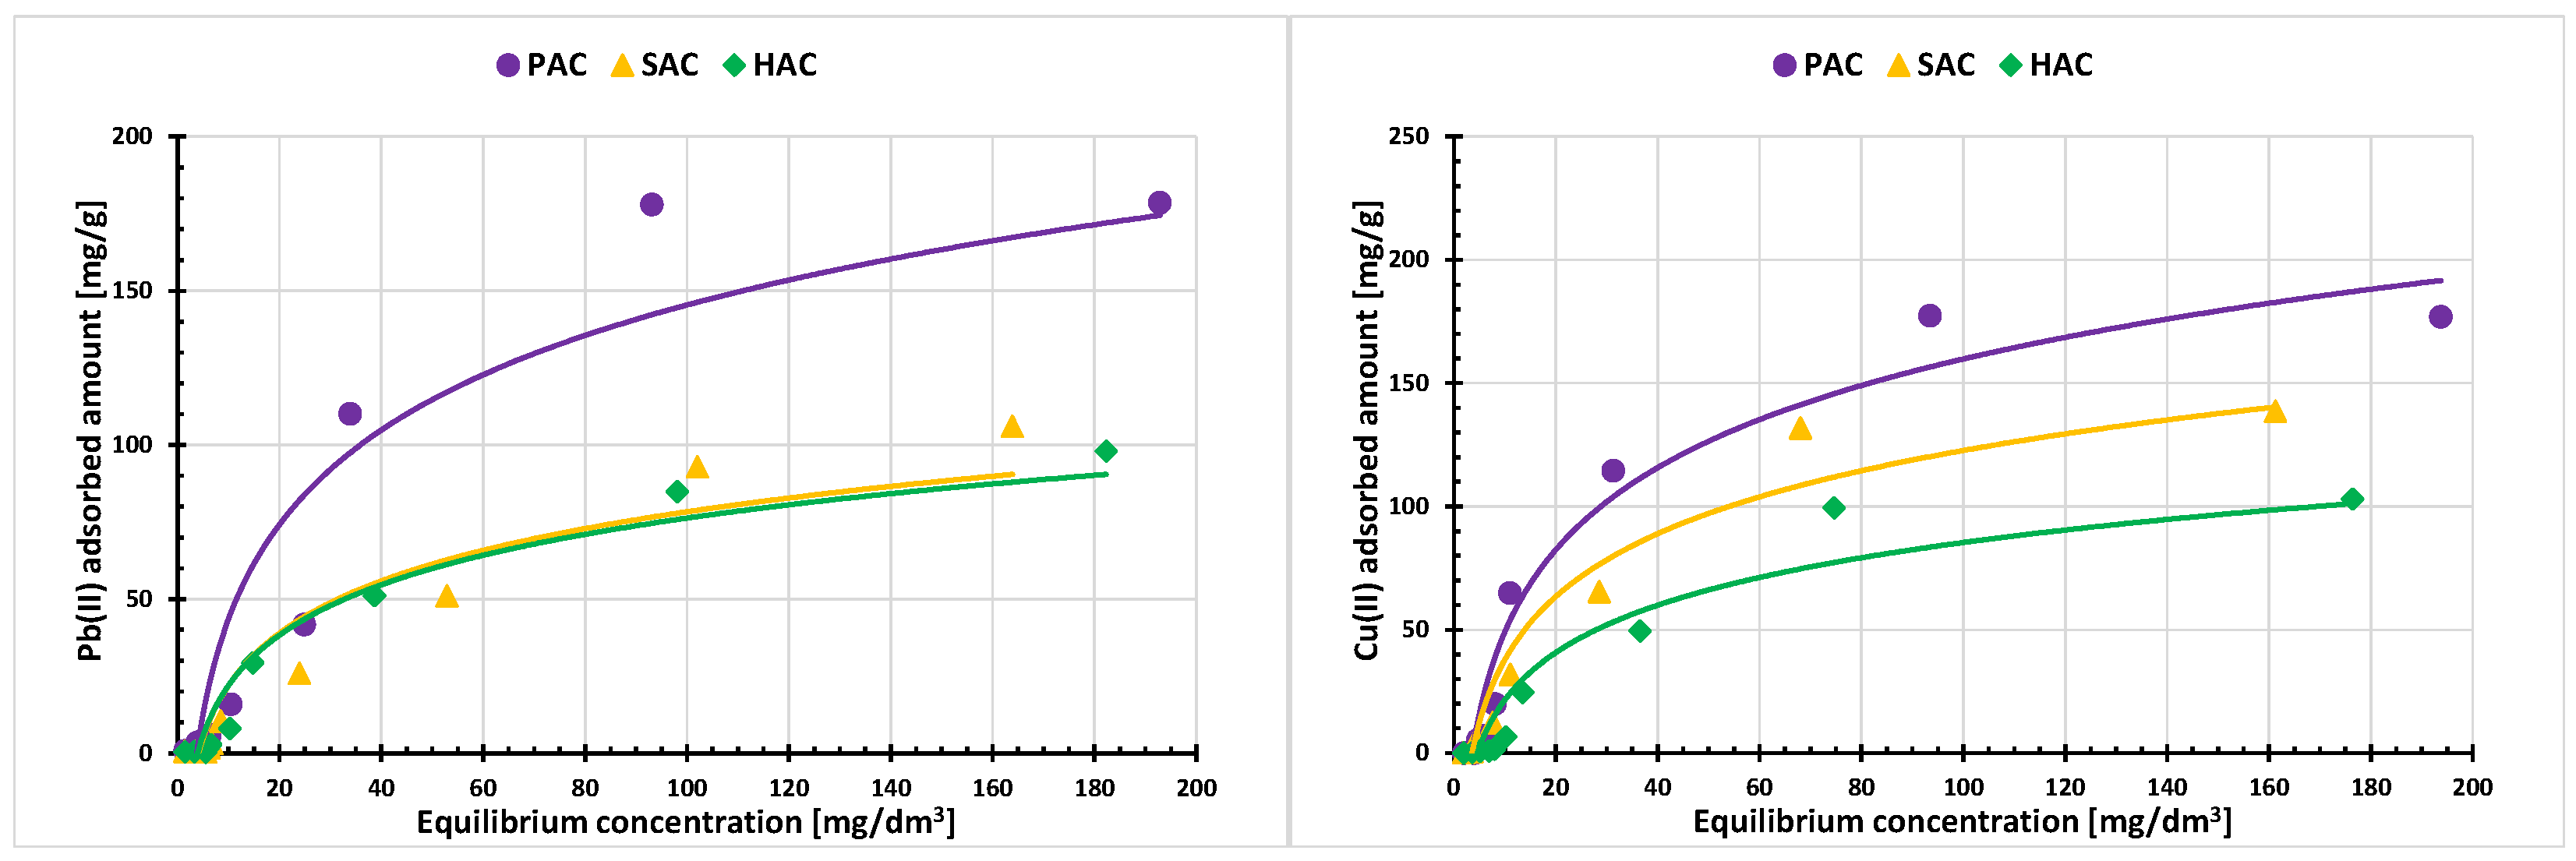
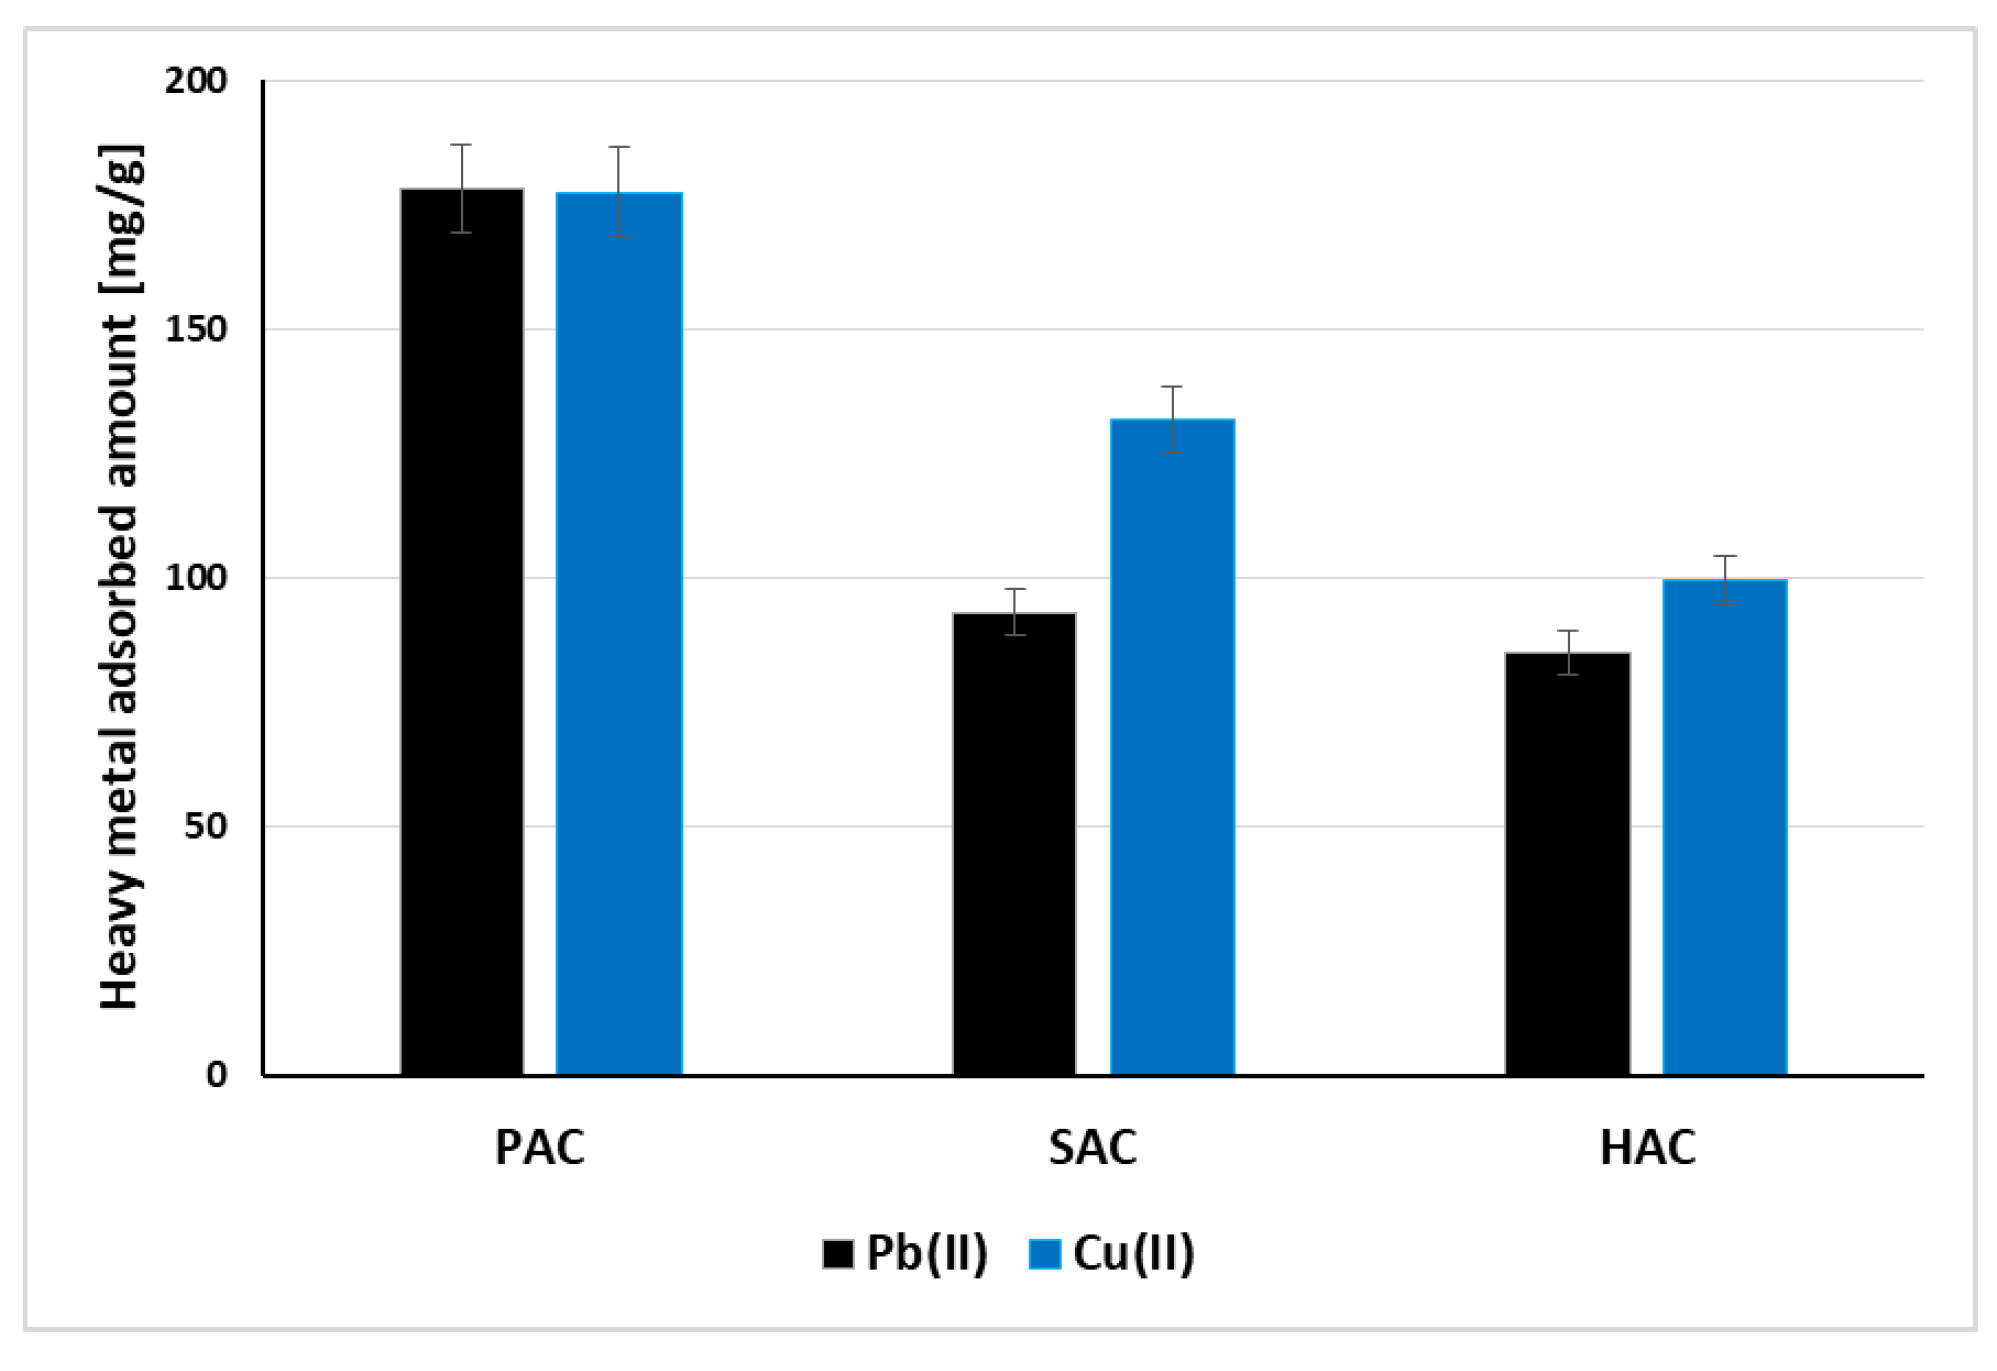
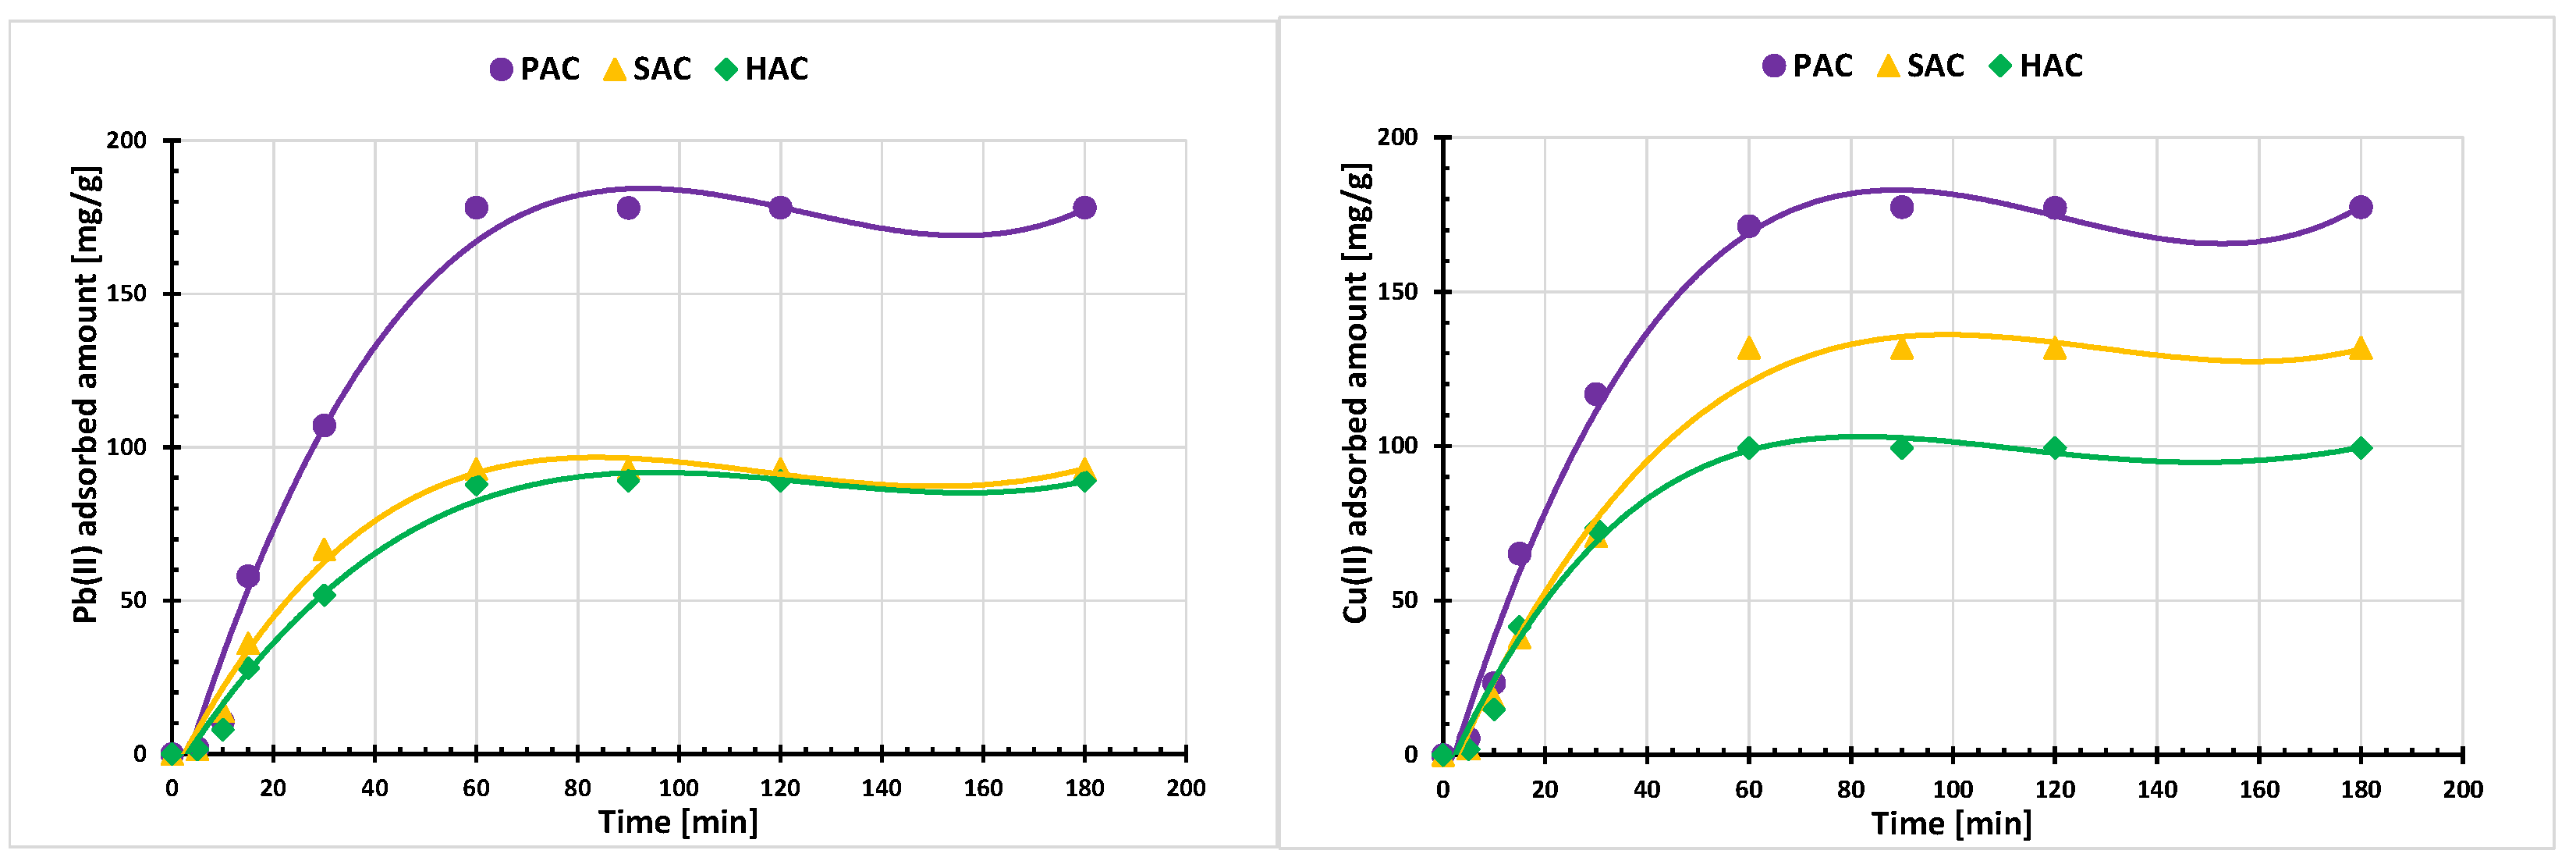
3.4. Adsorption of Cu(II) and Pb(II) Ions on the Activated Biocarbons Surface
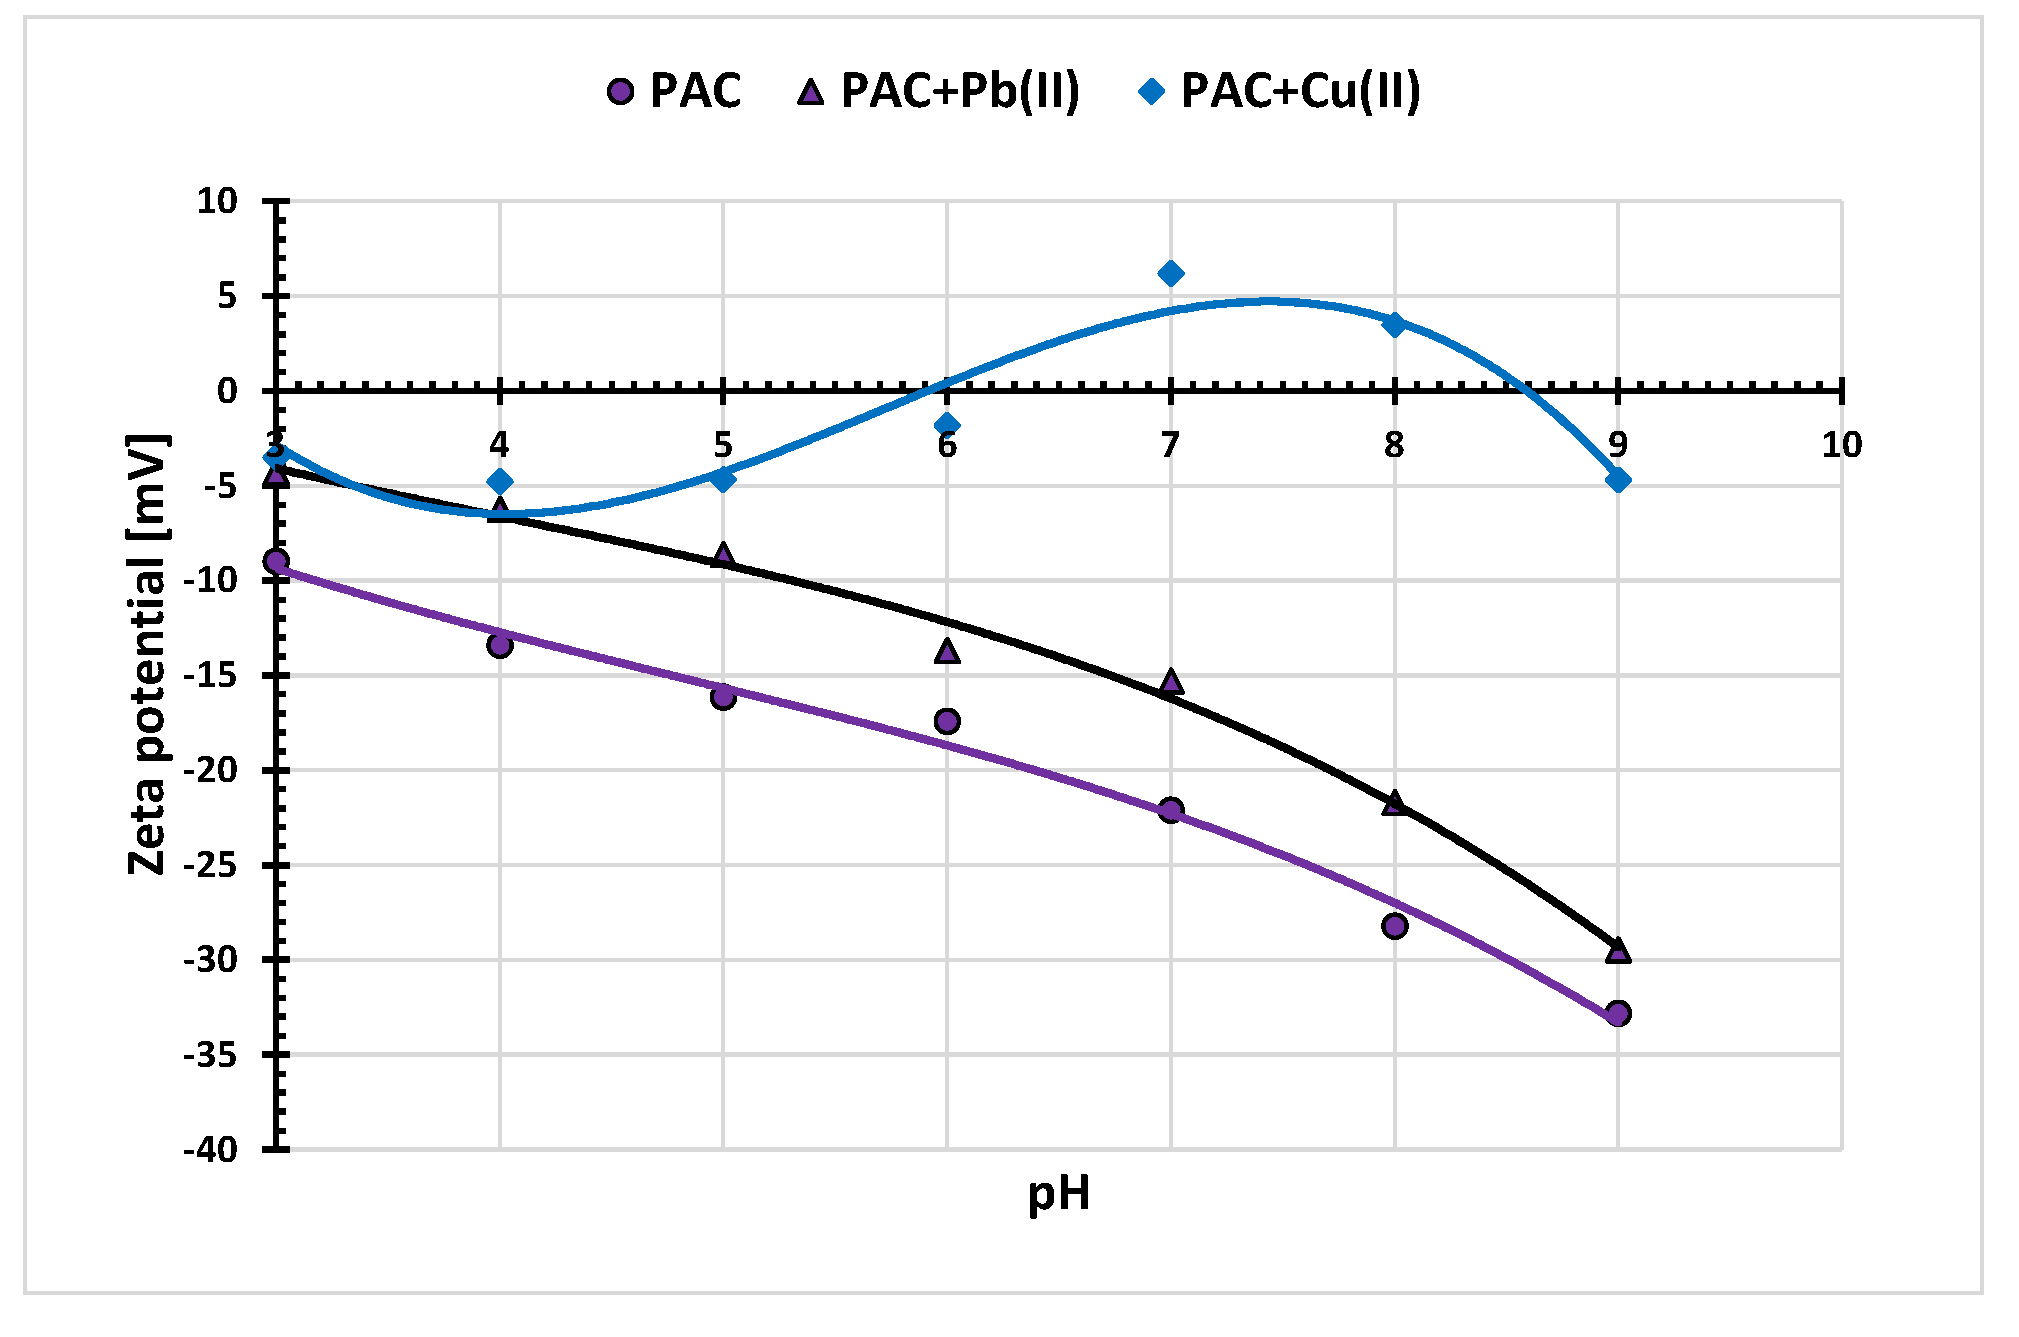
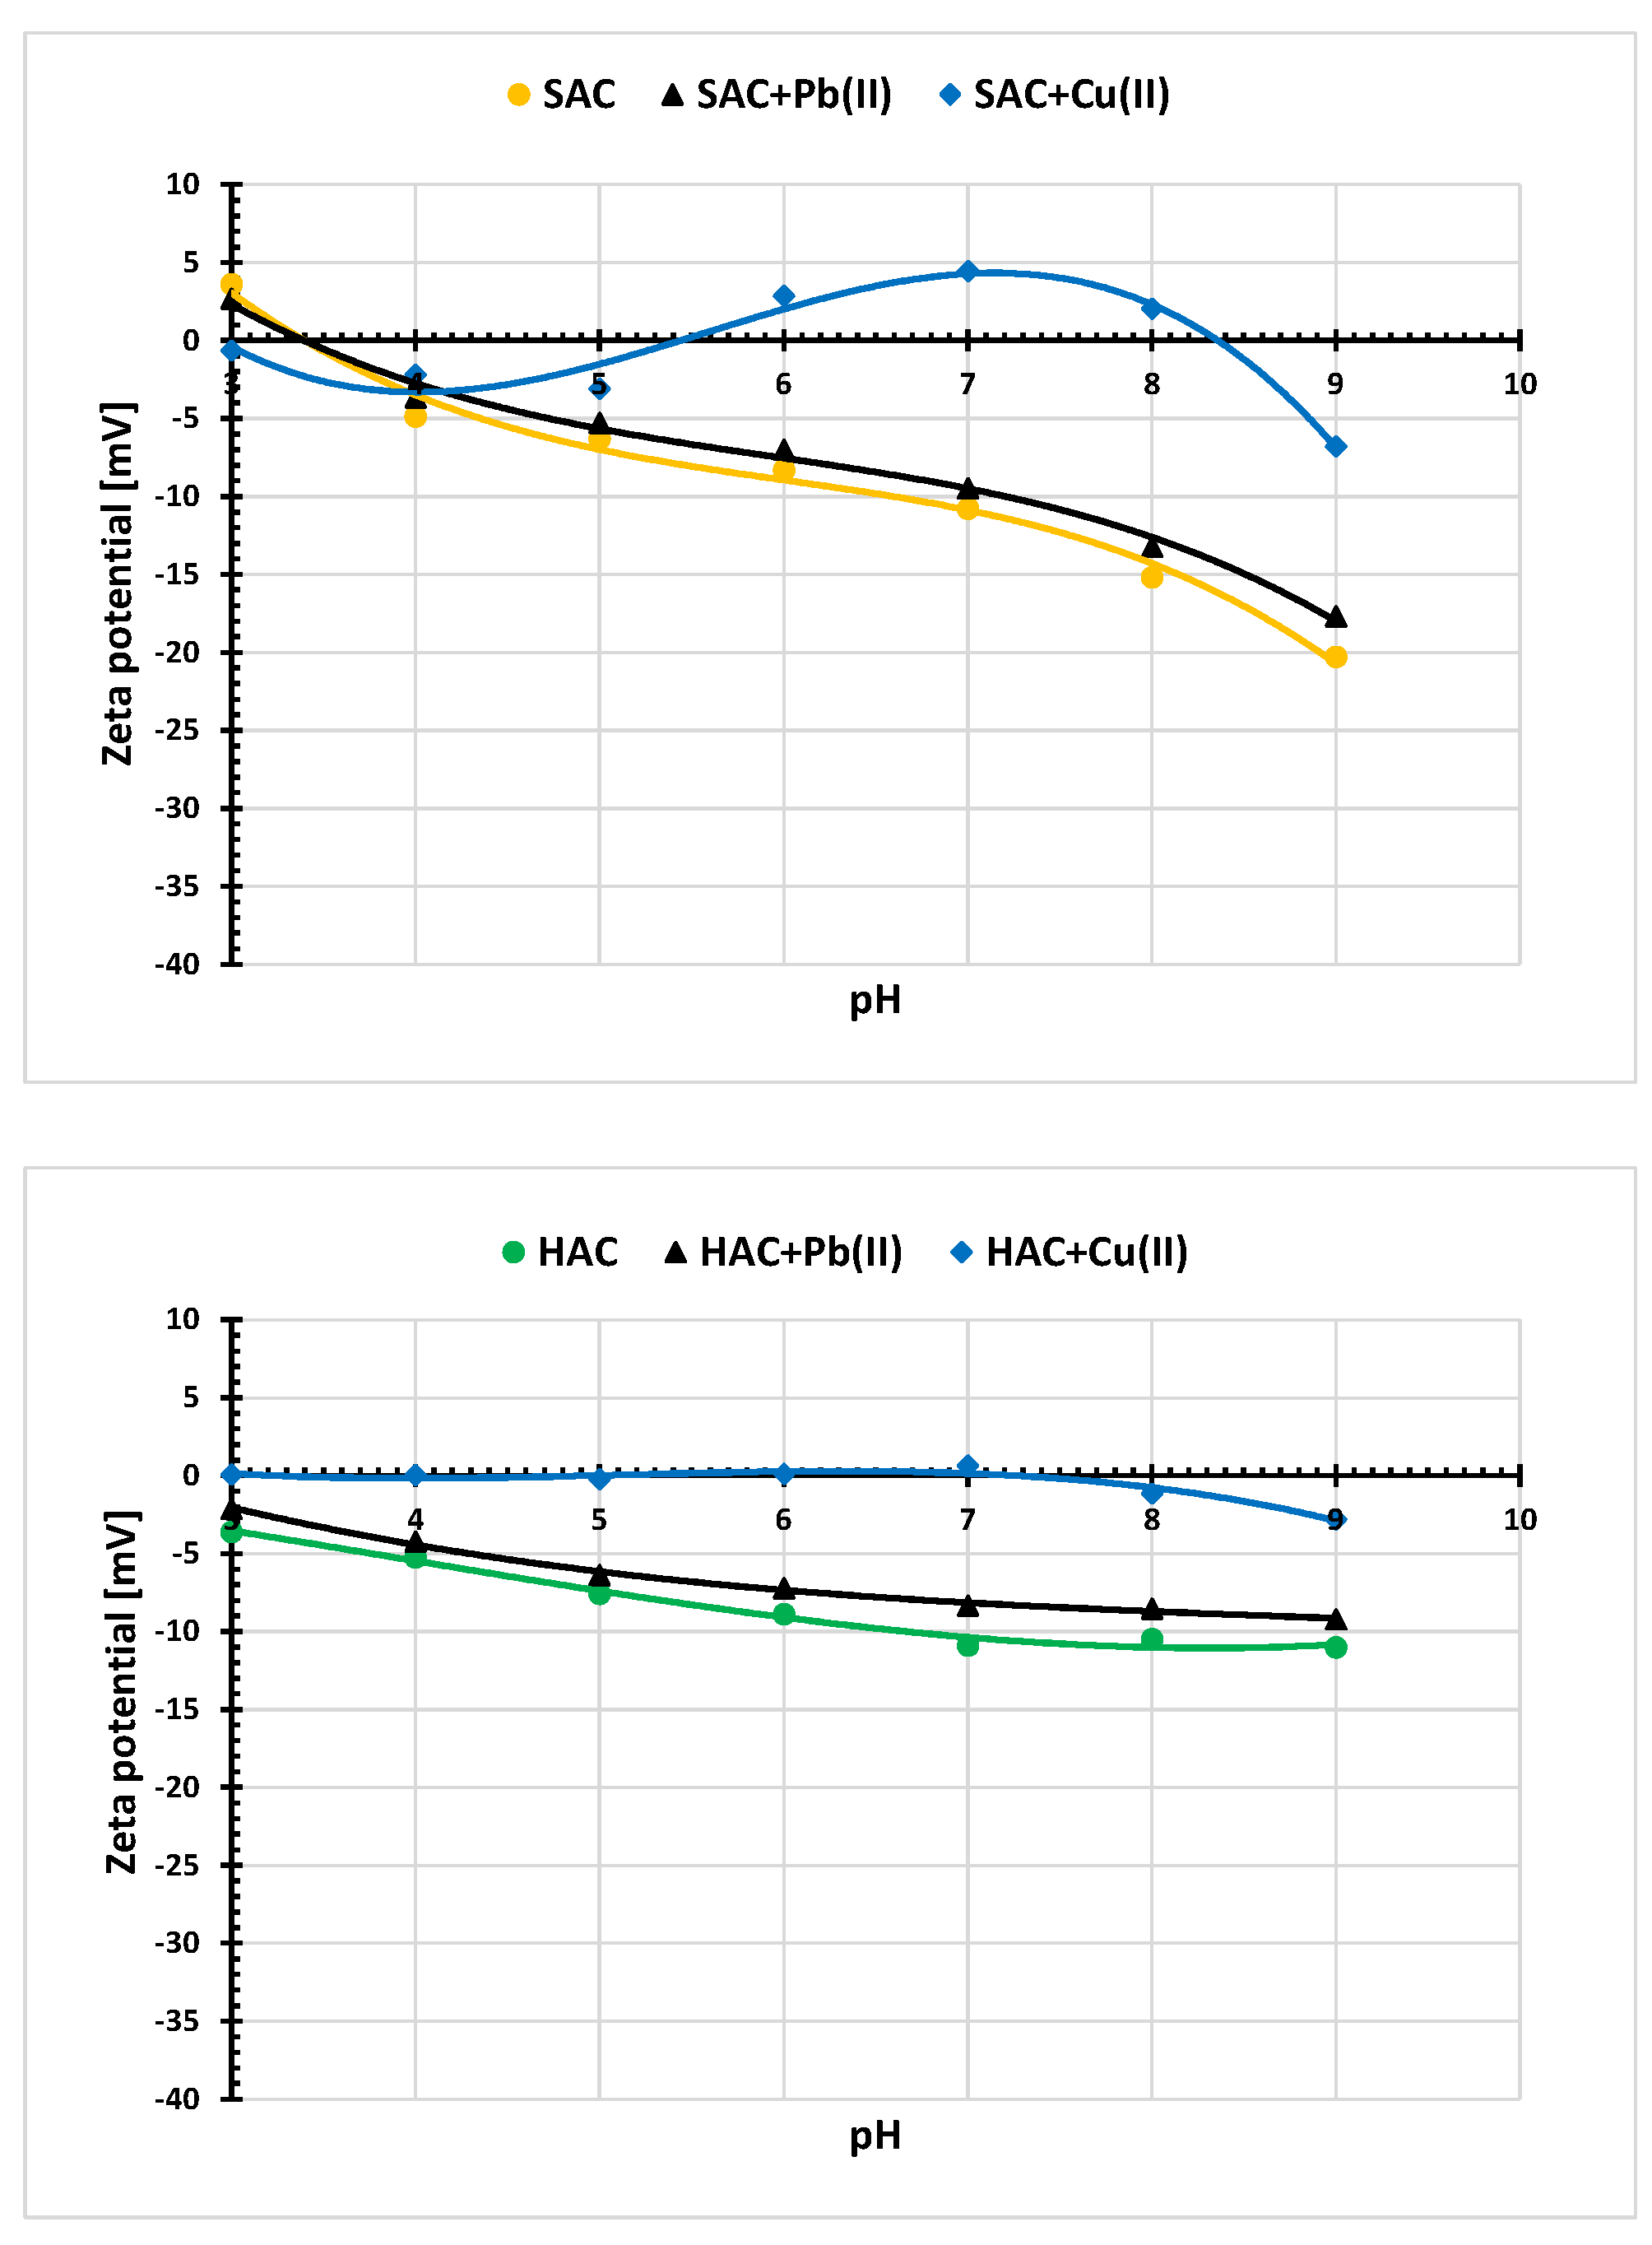
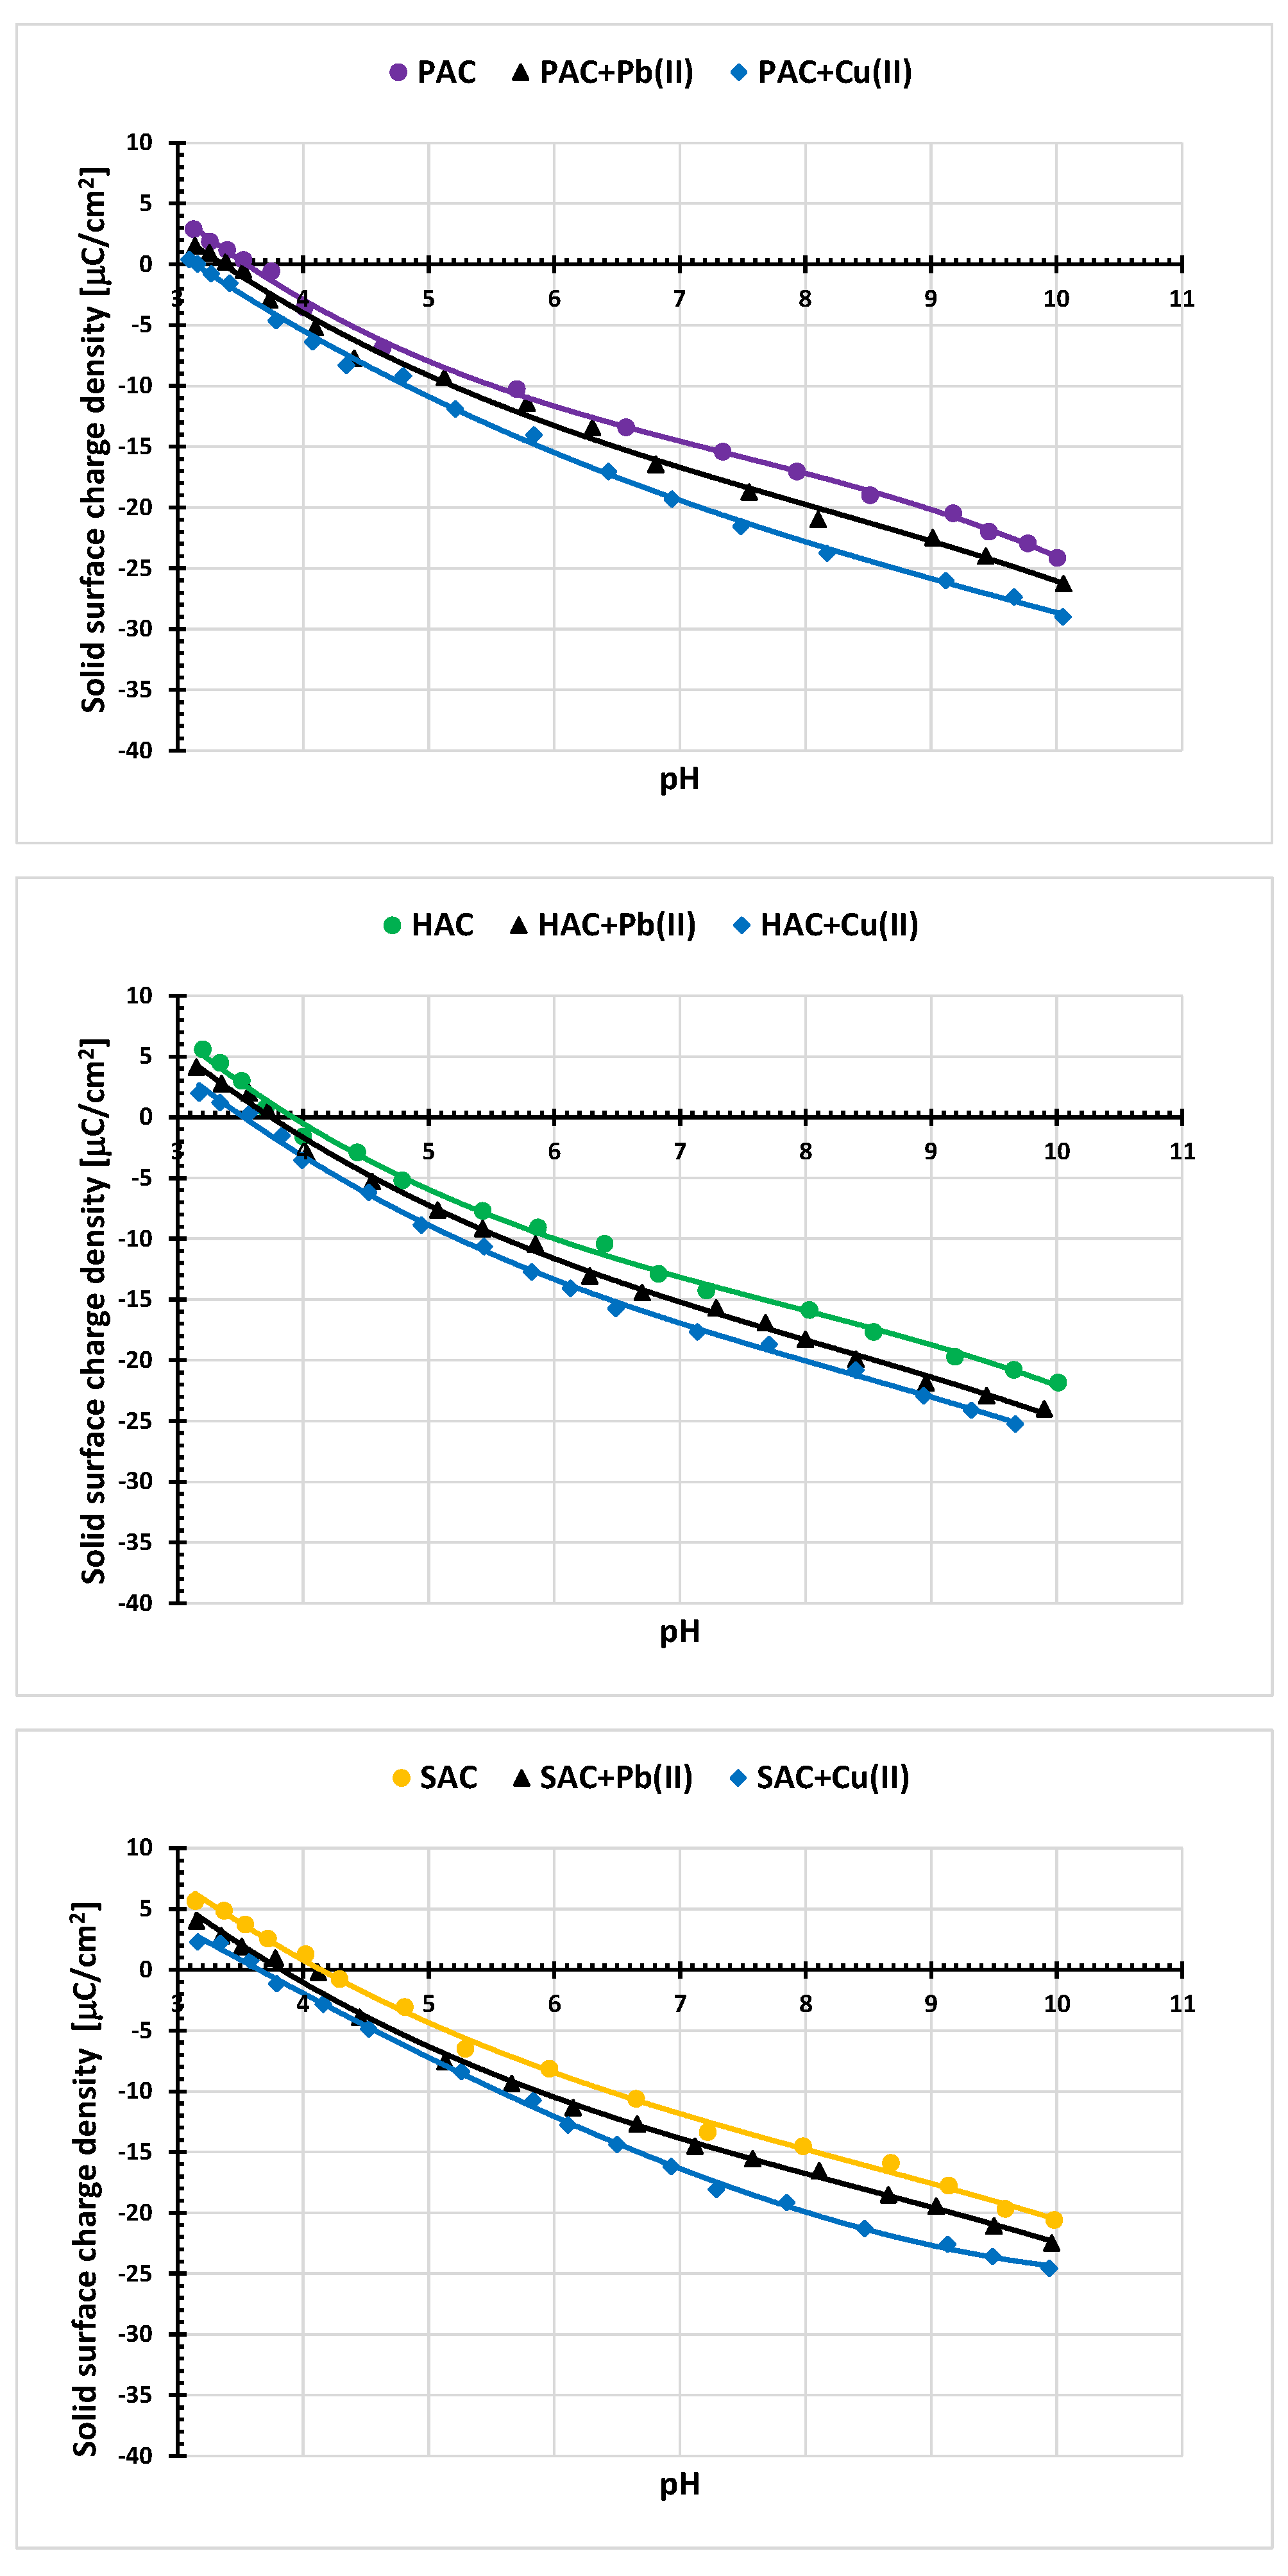
3.5. Electrokinetic Properties of the Activated Biocarbons
4. Conclusions
Author Contributions
Funding
Institutional Review Board Statement
Informed Consent Statement
Data Availability Statement
Conflicts of Interest
References
- Kan, T.; Strezov, V.; Evans, T.J. Lignocellulosic biomass pyrolysis: A review of product properties and effects of pyrolysis parameters. Renew. Sustain. Energy Rev. 2016, 57, 1126–1140. [Google Scholar] [CrossRef]
- Chen, D.; Chen, X.; Sun, J.; Zheng, Z.; Fu, K. Pyrolysis polygeneration of pine nut shell: Quality of pyrolysis products and study on the preparation of activated carbon from biochar. Bioresour. Technol. 2016, 216, 629–636. [Google Scholar] [CrossRef] [PubMed]
- Wu, W.; Yang, M.; Feng, Q.; McGrouther, K.; Wang, H.; Lu, H.; Chen, Y. Chemical characterization of rice straw-derived biochar for soil amendment. Biomass Bioenergy 2012, 47, 268–276. [Google Scholar] [CrossRef]
- Wu, Q.; Dong, S.; Wang, L.; Li, X. Single and Competitive Adsorption Behaviors of Cu2+, Pb2+ and Zn2+ on the Biochar and Magnetic Biochar of Pomelo Peel in Aqueous Solution. Water 2021, 13, 868. [Google Scholar] [CrossRef]
- Peng, H.; Gao, P.; Chu, G.; Pan, B.; Peng, J.; Xing, B. Enhanced adsorption of Cu(II) and Cd(II) by phosphoric acid-modified biochars. Environ. Pollut. 2017, 229, 846–853. [Google Scholar] [CrossRef]
- Xu, R.-K.; Zhao, A.-Z. Effect of biochars on adsorption of Cu(II), Pb(II) and Cd(II) by three variable charge soils from southern China. Environ. Sci. Pollut. Res. 2013, 20, 8491–8501. [Google Scholar] [CrossRef]
- Su, L.; Zhang, H.; Oh, K.; Liu, N.; Luo, Y.; Cheng, H.; Zhang, G.; He, X. Activated biochar derived from spent Auricularia auricula substrate for the efficient adsorption of cationic azo dyes from single and binary adsorptive systems. Water Sci. Technol. 2021, 84, 101–121. [Google Scholar] [CrossRef] [PubMed]
- Maged, A.; Dissanayake, P.D.; Yang, X.; Pathirannahalage, C.; Bhatnagar, A.; Ok, Y.S. New mechanistic insight into rapid adsorption of pharmaceuticals from water utilizing activated biochar. Environ. Res. 2021, 202, 111693. [Google Scholar] [CrossRef]
- Baig, S.A.; Zhu, J.; Muhammad, N.; Sheng, T.; Xu, X. Effect of synthesis methods on magnetic Kans grass biochar for enhanced As(III, V) adsorption from aqueous solutions. Biomass Bioenergy 2014, 71, 299–310. [Google Scholar] [CrossRef]
- Zhu, K.; Fu, H.; Zhang, J.; Lv, X.; Tang, J.; Xu, X. Studies on removal of NH4+-N from aqueous solution by using the activated carbons derived from rice husk. Biomass Bioenergy 2012, 43, 18–25. [Google Scholar] [CrossRef]
- Lou, Z.; Sun, Y.; Bian, S.; Baig, S.A.; Hu, B.; Xu, X. Nutrient conservation during spent mushroom compost application using spent mushroom substrate derived biochar. Chemosphere 2017, 169, 23–31. [Google Scholar] [CrossRef] [PubMed]
- El-Hakam, S.A.; Ibrahim, A.A.; Elatwy, L.A.; El-Yazeed, W.S.A.; Salama, R.S.; El-Reash, Y.G.A.; Ahmed, A.I. Greener route for the removal of toxic heavy metals and synthesis of 14-aryl-14H dibenzo[a,j] xanthene using a novel and efficient Ag-Mg bimetallic MOF as a recyclable heterogeneous nanocatalyst. J. Taiwan Inst. Chem. Eng. 2021, 122, 176–189. [Google Scholar] [CrossRef]
- Bakry, A.M.; Alamier, W.M.; Salama, R.S.; El-Shall, M.S.; Awad, F.S. Remediation of water containing phosphate using ceria nanoparticles decorated partially reduced graphene oxide (CeO2-PRGO) composite. Surfaces Interfaces 2022, 31, 102006. [Google Scholar] [CrossRef]
- Flora, S.J.S.; Flora, G.; Saxena, G. Environmental occurrence, health effects and management of lead poisoning. In Lead; José, S.C., José, S., Eds.; Elsevier: Amsterdam, The Netherlands, 2008; pp. 158–228. [Google Scholar]
- Mikyskova, E.; Dousova, B.; Mikysek, P.; Lhotka, M.; Kolousek, D. Equilibrium, kinetic and thermodynamic study of Pb2+ removal from aqueous solution by waste brick dust. Colloids Surfaces A 2022, 634, 127939. [Google Scholar] [CrossRef]
- Zhou, Y.; Liu, X.; Xiang, Y.; Wang, P.; Zhang, J.; Zhang, F.; Wei, J.; Luo, L.; Lei, M.; Tang, L. Modification of biochar derived from sawdust and its application in removal of tetracycline and copper from aqueous solution: Adsorption mechanism and modelling. Bioresour. Technol. 2017, 245, 266–273. [Google Scholar] [CrossRef] [PubMed]
- Regmi, P.; Moscoso, J.L.G.; Kumar, S.; Cao, X.; Mao, J.; Schafran, G. Removal of copper and cadmium from aqueous solution using switchgrass biochar produced via hydrothermal carbonization process. J. Environ. Manag. 2012, 109, 61–69. [Google Scholar] [CrossRef]
- Ippolito, J.A.; Strawn, D.G.; Scheckel, K.G.; Novak, J.M.; Ahmedna, M.; Niandou, M.A.S. Macroscopic and Molecular Investigations of Copper Sorption by a Steam-Activated Biochar. J. Environ. Qual. 2012, 41, 1150–1156. [Google Scholar] [CrossRef]
- Dagnall, R.M.; West, T.S.; Young, P. Determination of lead with 4-(2-pyridylazo)-resorcinol-II: Application to steel, brass and bronze. Talanta 1965, 12, 583–588. [Google Scholar] [CrossRef]
- Mehlig, J. Colorimetric Determination of Copper with Ammonia. Ind. Eng. Chem. Anal. Ed. 1941, 13, 533–535. [Google Scholar] [CrossRef]
- Foo, K.Y.; Hameed, B.H. Insights into the modeling of adsorption isotherm systems. Chem. Eng. J. 2010, 156, 2–10. [Google Scholar] [CrossRef]
- Marković, D.D.; Lekić, B.M.; Rajaković-Ognjanović, V.N.; Onjia, A.; Rajaković, L.V. A New Approach in Regression Analysis for Modeling Adsorption Isotherms. Sci. World J. 2014, 2014, 930879. [Google Scholar] [CrossRef] [PubMed]
- Ho, Y.; McKay, G. Application of Kinetic Models to the Sorption of Copper(II) on to Peat. Adsorpt. Sci. Technol. 2002, 20, 797–815. [Google Scholar] [CrossRef]
- Bazan-Wozniak, A.; Nowicki, P.; Pietrzak, R. The effect of demineralization on the physicochemical and sorption properties of activated bio-carbons. Adsorption 2019, 25, 337–343. [Google Scholar] [CrossRef]
- Janusz, W. Electrical double layer at the metal oxide–electrolyte interface. In Interfacial Forces and Fields: Theory and Applications; Dekker, M., Ed.; CRC Press: New York, NY, USA, 1999; Volume 85, Chapter 4. [Google Scholar]
- Ohshima, H. A Simple Expression for Henry’s Function for the Retardation Effect in Electrophoresis of Spherical Colloidal Particles. J. Colloid Interface Sci. 1994, 168, 269–271. [Google Scholar] [CrossRef]
- Oliveira, W.E.; Franca, A.S.; Oliveira, L.S.; Rocha, S.D. Untreated coffee husks as biosorbents for the removal of heavy metals from aqueous solutions. J. Hazard. Mater. 2008, 152, 1073–1081. [Google Scholar] [CrossRef]
- Zhang, Z.; Xia, S.; Wang, X.; Yang, A.; Xu, B.; Chen, L.; Zhu, Z.; Zhao, J.; Jaffrezic-Renault, N.; Leonard, D. A novel biosorbent for dye removal: Extracellular polymeric substance (EPS) of Proteus mirabilis TJ-1. J. Hazard. Mater. 2009, 163, 279–284. [Google Scholar] [CrossRef]
- Kazmierczak-Razna, J.; Zioła-Frankowska, A.; Nowicki, P.; Frankowski, M.; Wolski, R.; Pietrzak, R. Removal of Heavy Metal Ions from One- and Two-Component Solutions via Adsorption on N-Doped Activated Carbon. Materials 2021, 14, 7045. [Google Scholar] [CrossRef]
- Kongsuwan, A.; Patnukao, P.; Pavasant, P. Binary component sorption of Cu(II) and Pb(II) with activated carbon from Eucalyptus camaldulensis Dehn bark. J. Ind. Eng. Chem. 2009, 15, 465–470. [Google Scholar] [CrossRef]
- Machida, M.; Aikawa, M.; Tatsumoto, H. Prediction of simultaneous adsorption of Cu(II) and Pb(II) onto activated carbon by conventional Langmuir type equations. J. Hazard. Mater. 2005, 120, 271–275. [Google Scholar] [CrossRef]
- Qin, F.; Wen, B.; Shan, X.-Q.; Xie, Y.-N.; Liu, T.; Zhang, S.-Z.; Khan, S.U. Mechanisms of competitive adsorption of Pb, Cu, and Cd on peat. Environ. Pollut. 2006, 144, 669–680. [Google Scholar] [CrossRef]
- Deng, J.; Liu, Y.; Liu, S.; Zeng, G.; Tan, X.; Huang, B.; Tang, X.; Wang, S.; Hua, Q.; Yan, Z. Competitive adsorption of Pb(II), Cd(II) and Cu(II) onto chitosan-pyromellitic dianhydride modified biochar. J. Colloid Interface Sci. 2017, 506, 355–364. [Google Scholar] [CrossRef] [PubMed]
- Mahdi, Z.; Yu, Q.J.; El Hanandeh, A. Competitive adsorption of heavy metal ions (Pb2+, Cu2+, and Ni2+) onto date seed biochar: Batch and fixed bed experiments. Sep. Sci. Technol. 2018, 54, 888–901. [Google Scholar] [CrossRef]
- Park, J.-H.; Cho, J.-S.; Ok, Y.S.; Kim, S.-H.; Heo, J.-S.; Delaune, R.D.; Seo, D.-C. Comparison of single and competitive metal adsorption by pepper stem biochar. Arch. Agron. Soil Sci. 2015, 62, 617–632. [Google Scholar] [CrossRef]
- Panek, R.; Medykowska, M.; Szewczuk-Karpisz, K.; Wiśniewska, M. Comparison of Physicochemical Properties of Fly Ash Precursor, Na-P1(C) Zeolite–Carbon Composite and Na-P1 Zeolite—Adsorption Affinity to Divalent Pb and Zn Cations. Materials 2021, 14, 3018. [Google Scholar] [CrossRef]
- Panek, R.; Medykowska, M.; Wiśniewska, M.; Szewczuk-Karpisz, K.; Jędruchniewicz, K.; Franus, M. Simultaneous Removal of Pb2+ and Zn2+ Heavy Metals Using Fly Ash Na-X Zeolite and Its Carbon Na-X(C) Composite. Materials 2021, 14, 2832. [Google Scholar] [CrossRef]


| Sample | Ash | Cdaf 1 | Hdaf | Ndaf | Sdaf | Odiff 2 | Yield |
|---|---|---|---|---|---|---|---|
| P | 0.5 | 46.1 | 5.4 | 0.1 | 0.1 | 48.3 | - |
| S | 0.6 | 46.6 | 7.0 | 1.3 | 1.0 | 44.1 | - |
| H | 6.8 | 44.9 | 5.6 | 3.0 | 1.5 | 45.0 | - |
| PAC | 1.2 | 92.3 | 0.7 | 0.1 | 0.0 | 6.9 | 57 |
| SAC | 2.3 | 93.0 | 1.0 | 0.8 | 0.3 | 4.9 | 49 |
| HAC | 8.7 | 90.5 | 2.1 | 1.4 | 0.0 | 6.0 | 41 |
| Sample | pH | Basic Groups Content [mmol/g] | Acidic Groups Content [mmol/g] | Total Content of Surface Groups [mmol/g] |
|---|---|---|---|---|
| PAC | 6.52 | 0.65 | 1.29 | 1.94 |
| SAC | 6.88 | 0.67 | 0.46 | 1.13 |
| HAC | 7.66 | 0.54 | 1.01 | 1.55 |
| Sample | Surface Area [m2/g] | Total Pore Volume [cm3/g] | Micropore Contribution [%] | Average Pore Diameter [nm] |
|---|---|---|---|---|
| PAC | 2759 | 1.332 | 84 | 1.931 |
| SAC | 1266 | 0.565 | 82 | 1.787 |
| HAC | 955 | 0.705 | 61 | 2.954 |
| Adsorbed Ions | Kinetic Parameters of Pseudo-First Order Model | ||||||||
|---|---|---|---|---|---|---|---|---|---|
| qe [mg/g] | k1 [1/Min] | R2 | |||||||
| PAC | SAC | HAC | PAC | SAC | HAC | PAC | SAC | HAC | |
| Pb(II) | 96.60 | 44.60 | 5.58 | 0.1199 | 0.1068 | 0.0308 | 0.7136 | 0.707 | 0.1664 |
| Cu(II) | 156.05 | 76.24 | 46.17 | 0.1128 | 0.1202 | 0.1107 | 0.7300 | 0.7292 | 0.7067 |
| Adsorbed Ions | Kinetic Parameters of Pseudo-Second Order Model | ||||||||
| qe [mg/g] | k2 [g/(mg∙min)] | R2 | |||||||
| PAC | SAC | HAC | PAC | SAC | HAC | PAC | SAC | HAC | |
| Pb(II) | 166.66 | 105.26 | 100.00 | 0.00045 | 0.00053 | 0.00014 | 0.9877 | 0.9847 | 0.9807 |
| Cu(II) | 181.81 | 144.92 | 111.11 | 0.00235 | 0.00035 | 0.00058 | 0.9999 | 0.9857 | 0.9883 |
| Adsorbed Ions | Adsorption Parameters of Langmuir Model | ||||||||
|---|---|---|---|---|---|---|---|---|---|
| qm [mg/g] | KL [dm3/mg] | R2 | |||||||
| PAC | SAC | HAC | PAC | SAC | HAC | PAC | SAC | HAC | |
| Pb(II) | 235.77 | 231.25 | 174.65 | 0.01996 | 0.00123 | 0.00123 | 0.991 | 0.970 | 0.997 |
| Cu(II) | 198.83 | 183.91 | 160.94 | 0.00033 | 0.00114 | 0.00115 | 0.994 | 0.965 | 0.993 |
| Adsorbed Ions | Adsorption Parameters of Freundlich Model | ||||||||
| n | KF [mg/g·(mg/dm3)1/n] | R2 | |||||||
| PAC | SAC | HAC | PAC | SAC | HAC | PAC | SAC | HAC | |
| Pb(II) | 0.678 | 0.669 | 0.606 | 0.00309 | 0.00713 | 0.00529 | 0.904 | 0.836 | 0.821 |
| Cu(II) | 0.553 | 0.617 | 0.518 | 0.00177 | 0.00221 | 0.00275 | 0.643 | 0.829 | 0.880 |
| Sample | C | N | O | S | Si | Cu | Pb |
|---|---|---|---|---|---|---|---|
| PAC + Cu(II) | 90.4 | 0.0 | 7.2 | 1.2 | 0.7 | 0.5 | - |
| SAC + Cu(II) | 89.1 | 1.5 | 8.1 | 0.4 | 0.6 | 0.3 | - |
| HAC + Cu(II) | 80.5 | 1.6 | 12.6 | 1.3 | 3.5 | 0.5 | - |
| PAC + Pb(II) | 91.8 | 0.4 | 7.2 | 0.0 | 0.0 | - | 0.6 |
| SAC + Pb(II) | 92.6 | 0.9 | 5.5 | 0.2 | 0.3 | - | 0.5 |
| HAC + Pb(II) | 85.0 | 1.3 | 10.3 | 0.0 | 2.8 | - | 0.6 |
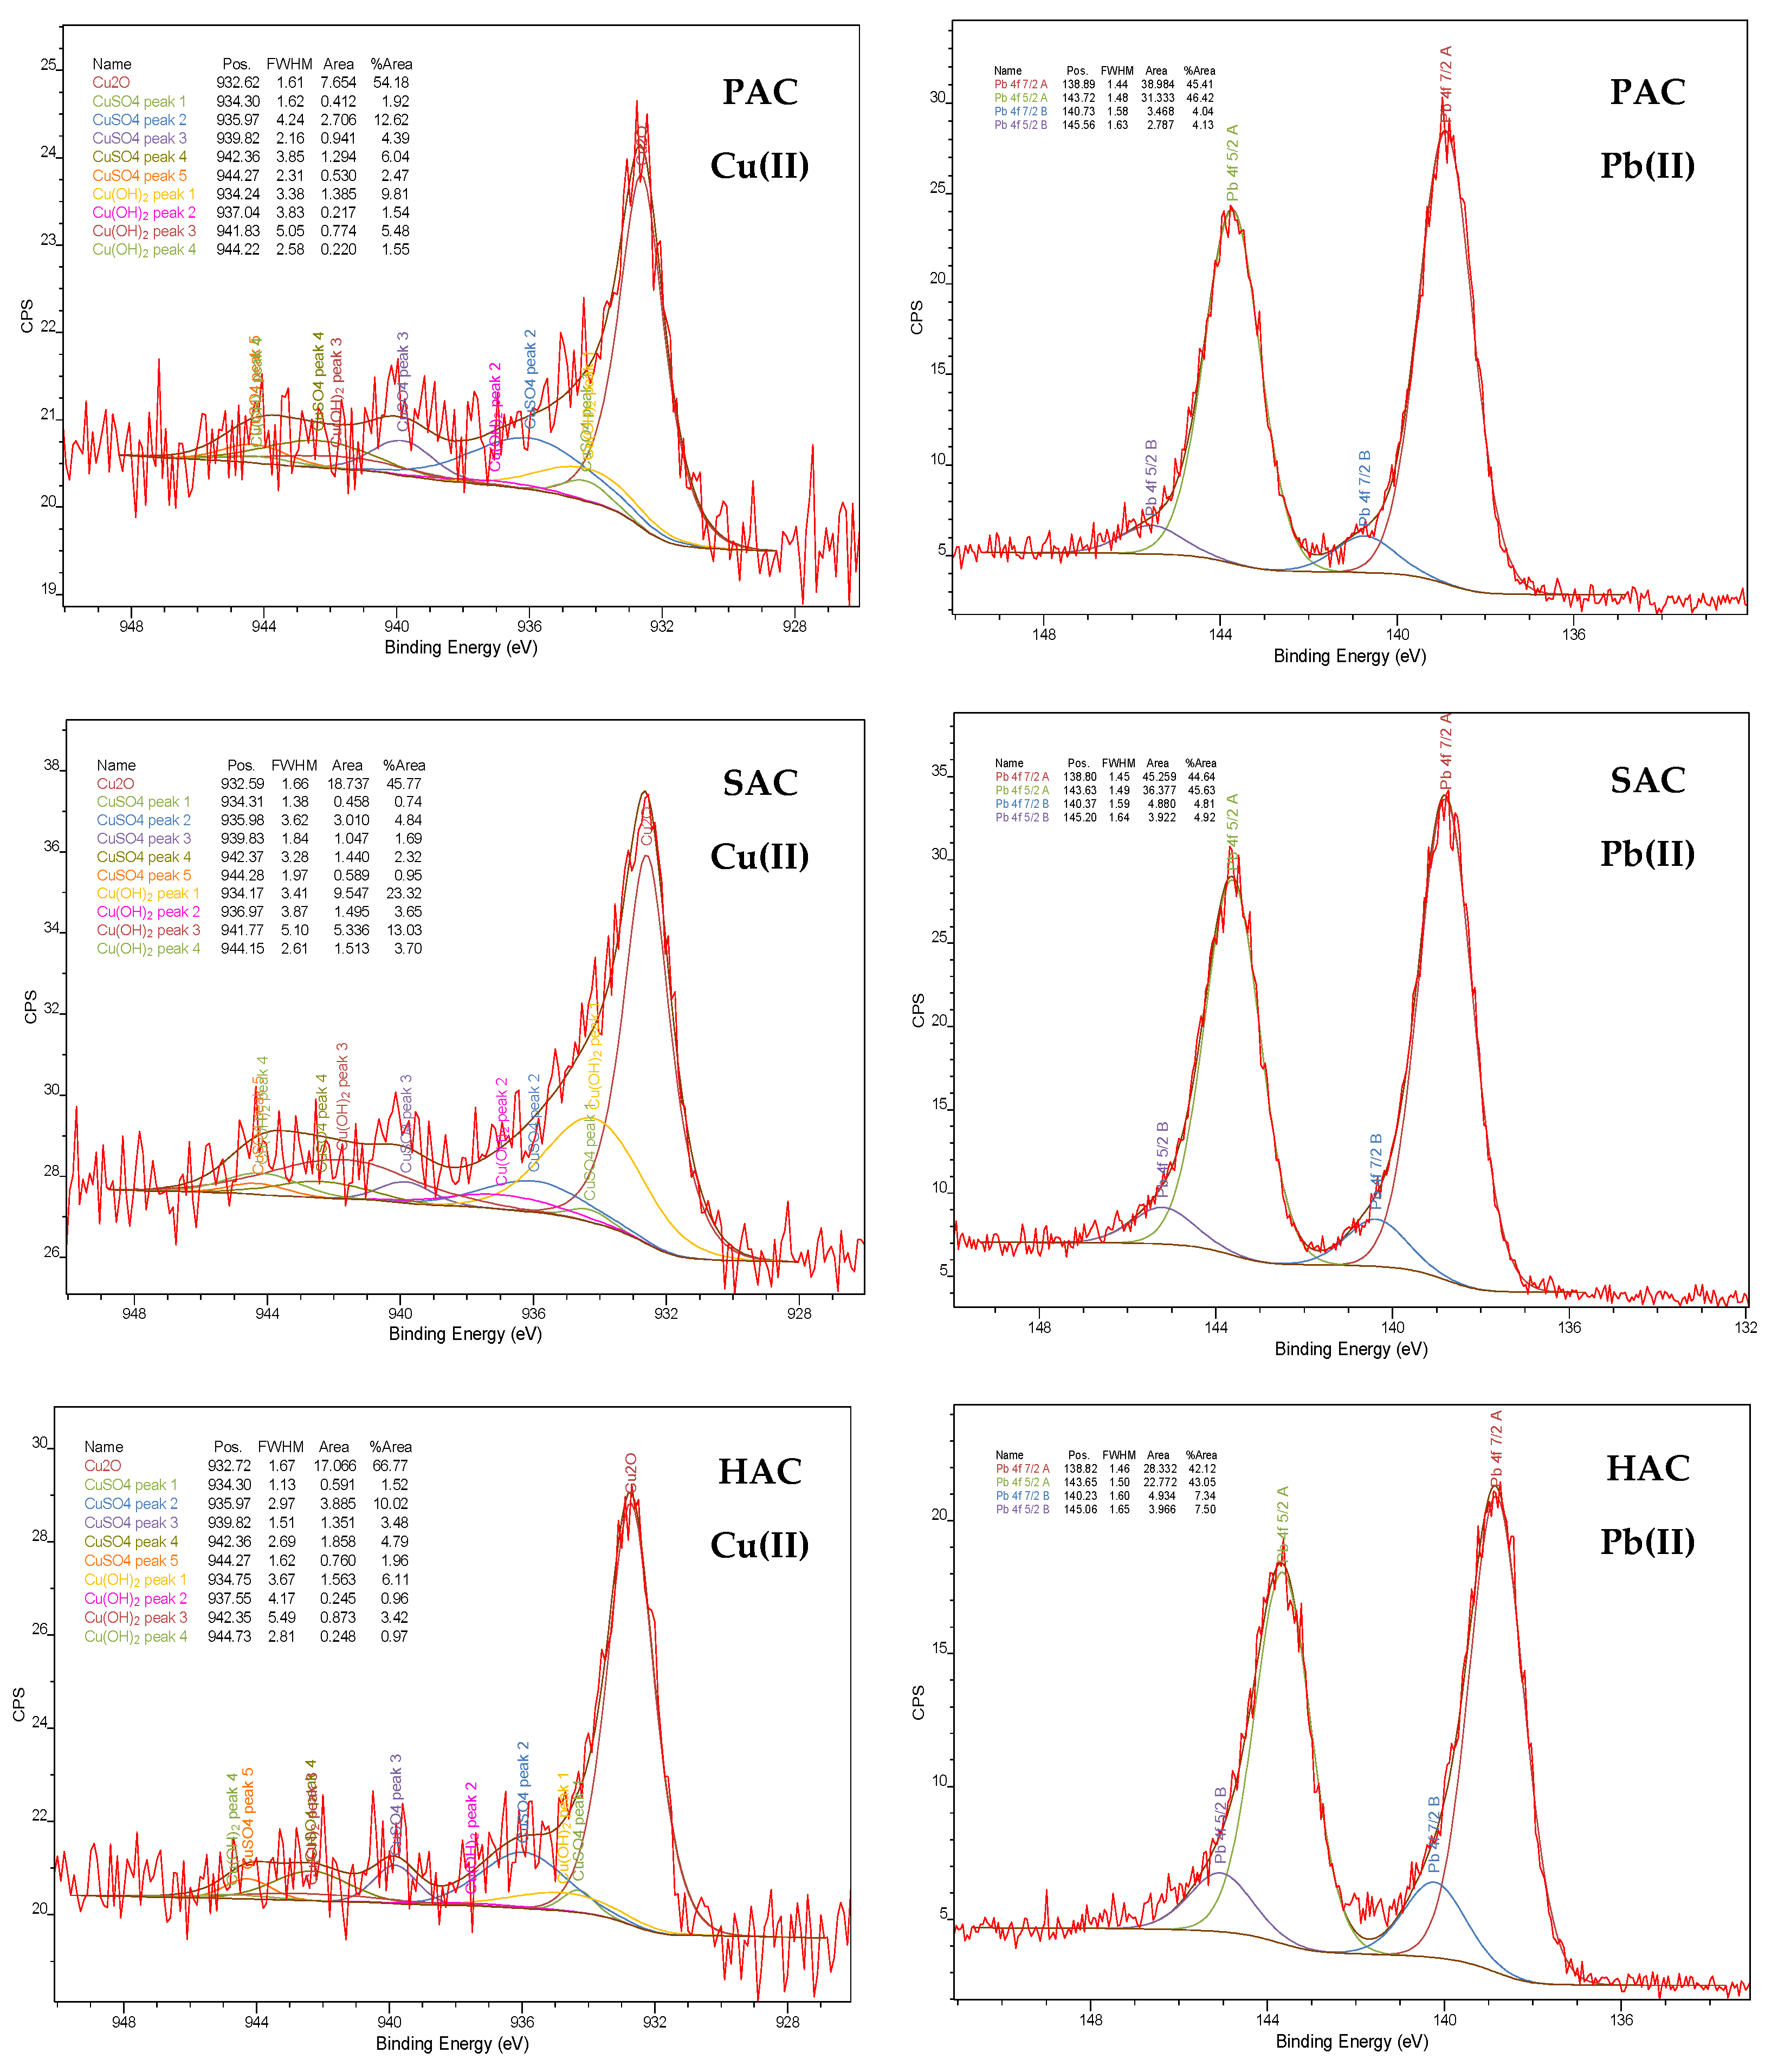
| Sample | Species | Binding Energy [eV] | Relative Content [%] |
|---|---|---|---|
| PAC | Cu2O | 932.72 | 66.8 |
| CuSO4 | 935.97 | 10.0 | |
| CuO or Cu(OH)2 | 934.75 | 6.1 | |
| SAC | Cu2O | 932.62 | 54.2 |
| CuSO4 | 935.97 | 12.6 | |
| CuO or Cu(OH)2 | 934.24 | 9.8 | |
| HAC | Cu2O | 932.59 | 45.8 |
| CuSO4 | 935.98 | 4.8 | |
| CuO or Cu(OH)2 | 934.17 | 23.3 |
| Sample | Species | Binding Energy [eV] | Relative Content [%] |
|---|---|---|---|
| PAC | PbO or Pb3O4 | 138.89 | 42.1 |
| Pb(OH)2 | 143.72 | 43.1 | |
| PbSO4 | 140.73 | 7.3 | |
| Pb(NO3)2 | 145.56 | 7.5 | |
| SAC | PbO or Pb3O4 | 138.82 | 42.1 |
| Pb(OH)2 | 143.65 | 43.1 | |
| PbSO4 | 140.23 | 7.3 | |
| Pb(NO3)2 | 145.06 | 7.5 | |
| HAC | PbO or Pb3O4 | 138.80 | 44.6 |
| Pb(OH)2 | 143.63 | 45.6 | |
| PbSO4 | 140.37 | 4.8 | |
| Pb(NO3)2 | 145.20 | 4.9 |
| Adsorbent | Maximum Adsorbed Amount [mg/g] | Reference |
|---|---|---|
| PAC | Pb(II) 178.1 mg/g Cu(II) 177.5 mg/g | [this study] |
| Activated carbon obtained from Eucalyptus camaldulensis Dehn bark | Pb(II) 110.6 mg/g Cu(II) 28.9 mg/g | [30] |
| Granular activated carbon derived from coconut shells | Pb(II) 10.8 mg/g Cu(II) 3.6 mg/g | [31] |
| Peat | Pb(II) 118.7 mg/g Cu(II) 34.0 mg/g | [32] |
| Chitosan-pyromellitic dianhydride modified rice straw biochar | Pb(II) 13.9 mg/g Cu(II) 96.1 mg/g | [33] |
| Date seed biochar | Pb(II) 148.8 mg/g Cu(II) 26.7 mg/g | [34] |
| Pepper stem biochar | Pb(II)~120 mg/g Cu(II)~45 mg/g | [35] |
Publisher’s Note: MDPI stays neutral with regard to jurisdictional claims in published maps and institutional affiliations. |
© 2022 by the authors. Licensee MDPI, Basel, Switzerland. This article is an open access article distributed under the terms and conditions of the Creative Commons Attribution (CC BY) license (https://creativecommons.org/licenses/by/4.0/).
Share and Cite
Wiśniewska, M.; Marciniak, M.; Gęca, M.; Herda, K.; Pietrzak, R.; Nowicki, P. Activated Biocarbons Obtained from Plant Biomass as Adsorbents of Heavy Metal Ions. Materials 2022, 15, 5856. https://doi.org/10.3390/ma15175856
Wiśniewska M, Marciniak M, Gęca M, Herda K, Pietrzak R, Nowicki P. Activated Biocarbons Obtained from Plant Biomass as Adsorbents of Heavy Metal Ions. Materials. 2022; 15(17):5856. https://doi.org/10.3390/ma15175856
Chicago/Turabian StyleWiśniewska, Małgorzata, Magdalena Marciniak, Marlena Gęca, Karolina Herda, Robert Pietrzak, and Piotr Nowicki. 2022. "Activated Biocarbons Obtained from Plant Biomass as Adsorbents of Heavy Metal Ions" Materials 15, no. 17: 5856. https://doi.org/10.3390/ma15175856
APA StyleWiśniewska, M., Marciniak, M., Gęca, M., Herda, K., Pietrzak, R., & Nowicki, P. (2022). Activated Biocarbons Obtained from Plant Biomass as Adsorbents of Heavy Metal Ions. Materials, 15(17), 5856. https://doi.org/10.3390/ma15175856