
Study of Strain Capacity for High-Strain Marine Pipe


Abstract
:1. Introduction
2. Pipe Material and Welding Procedure
3. Experimental Research
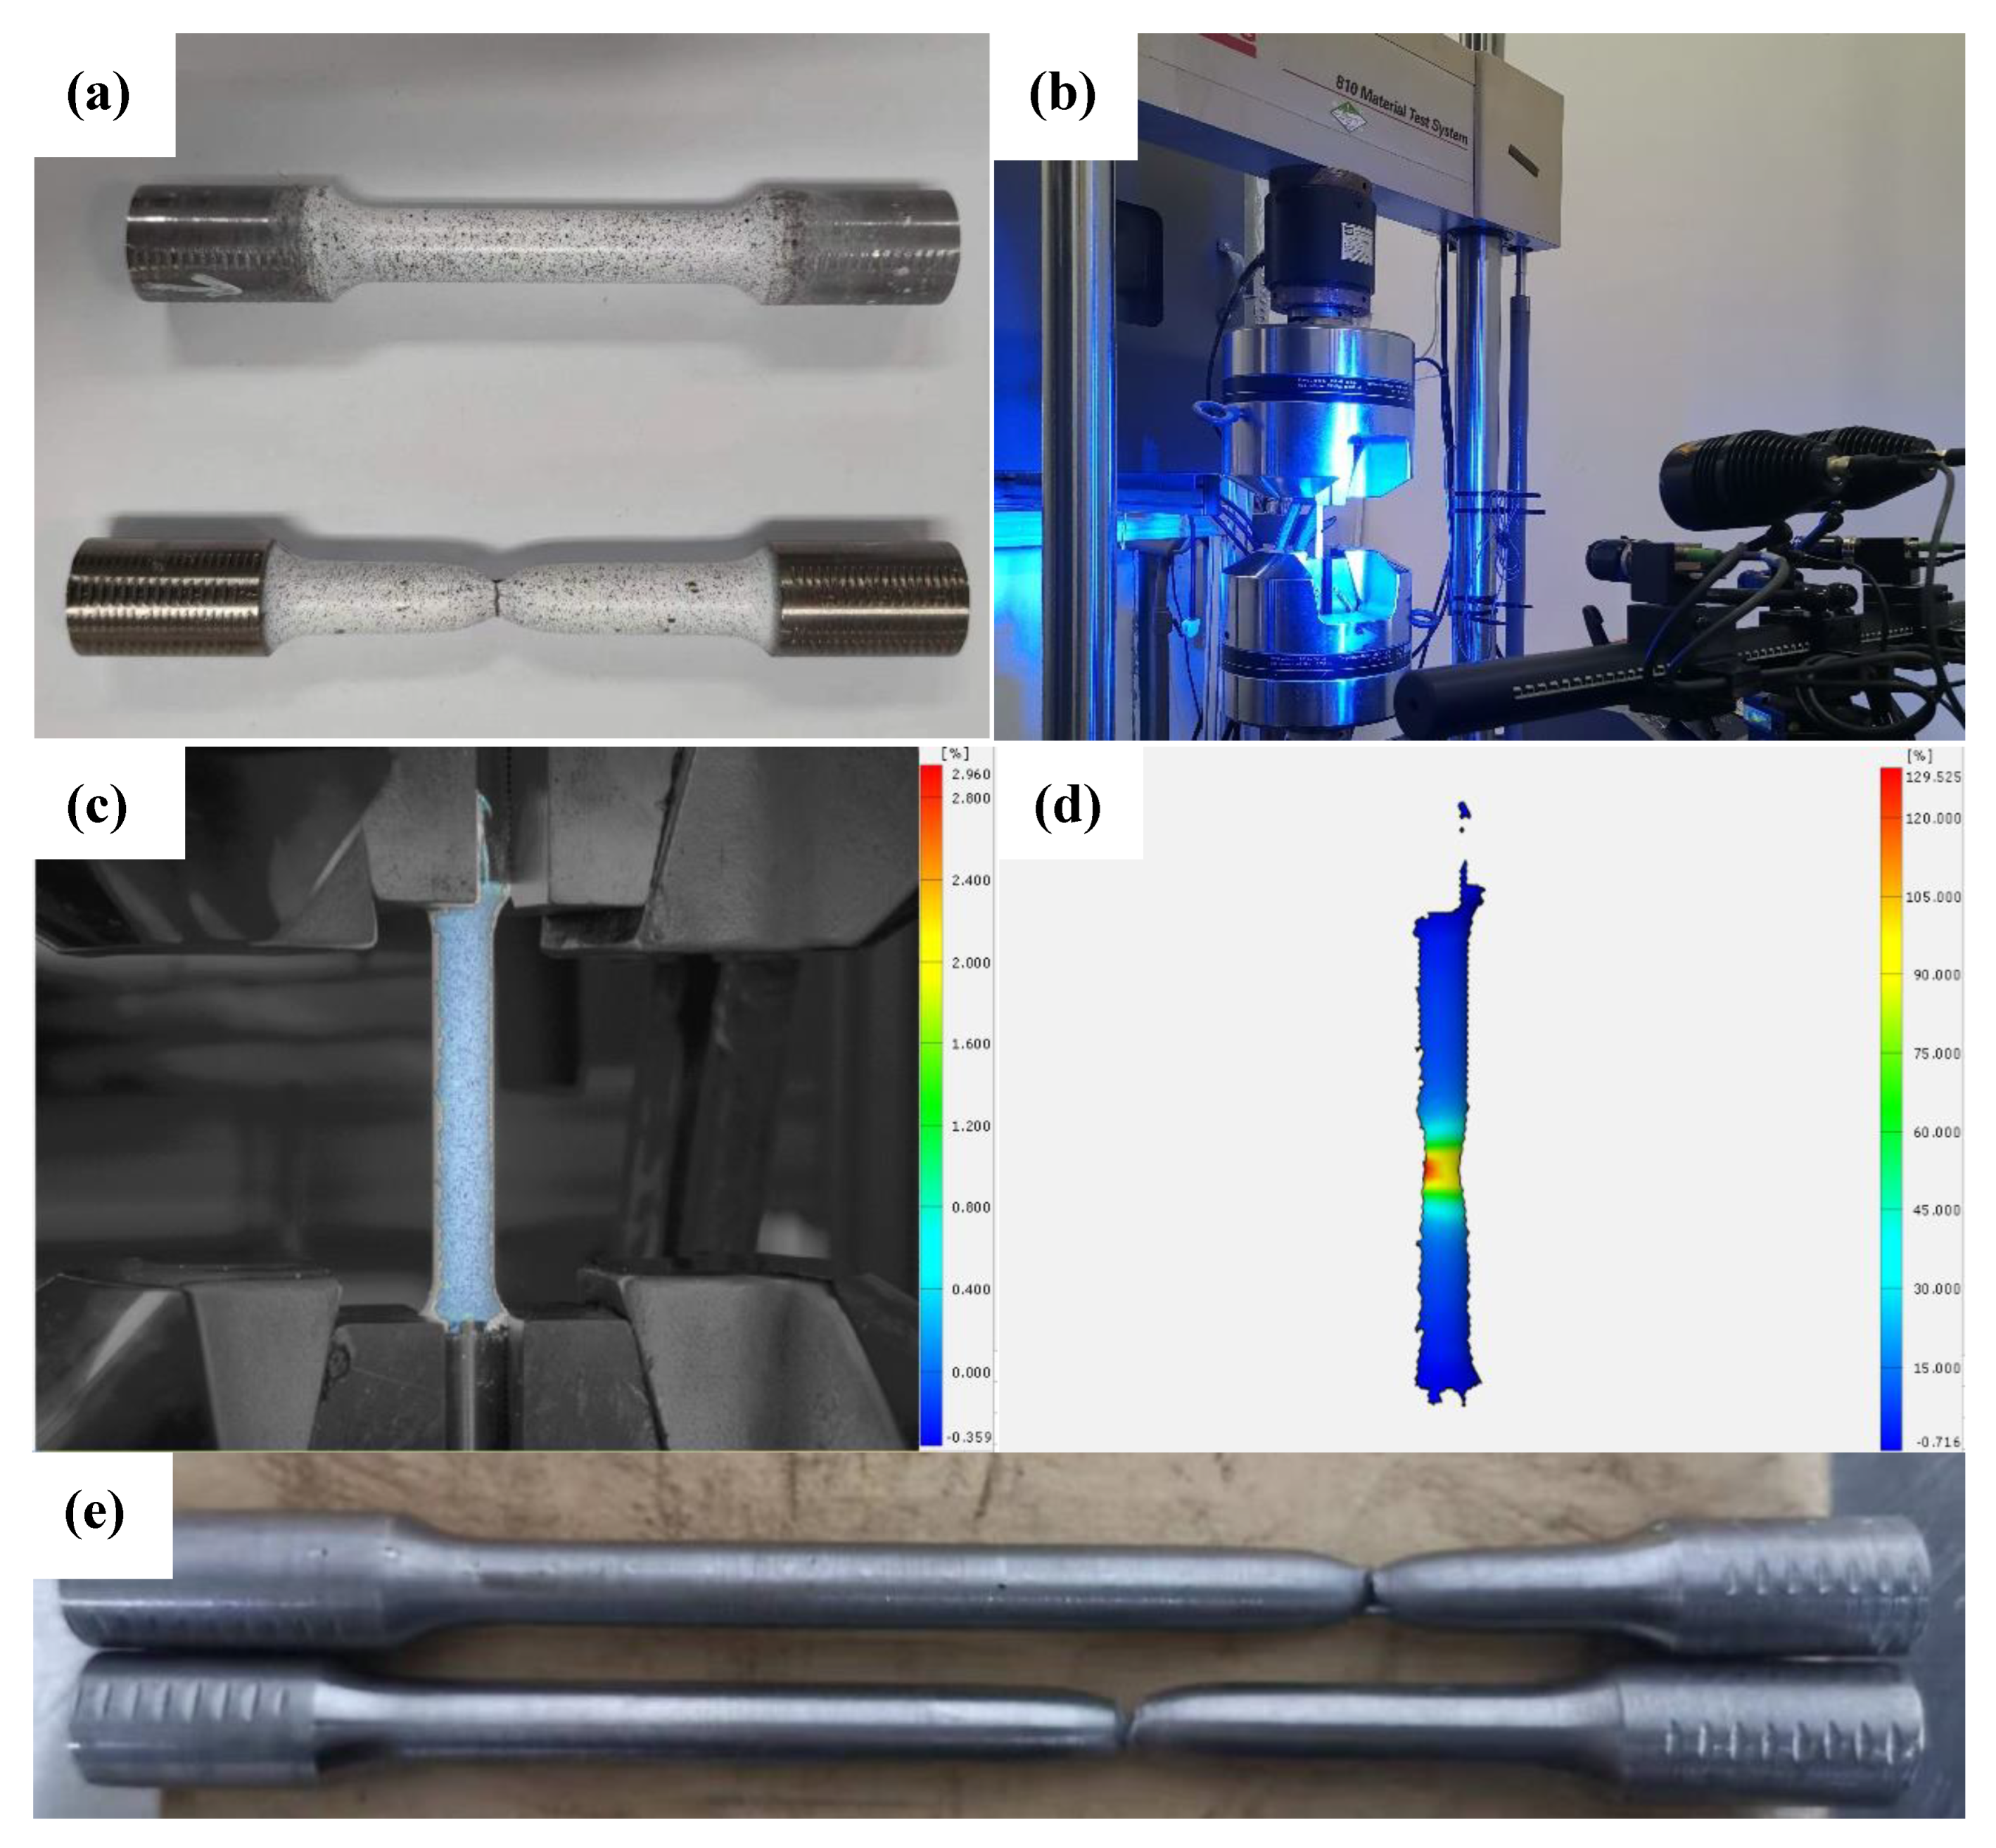
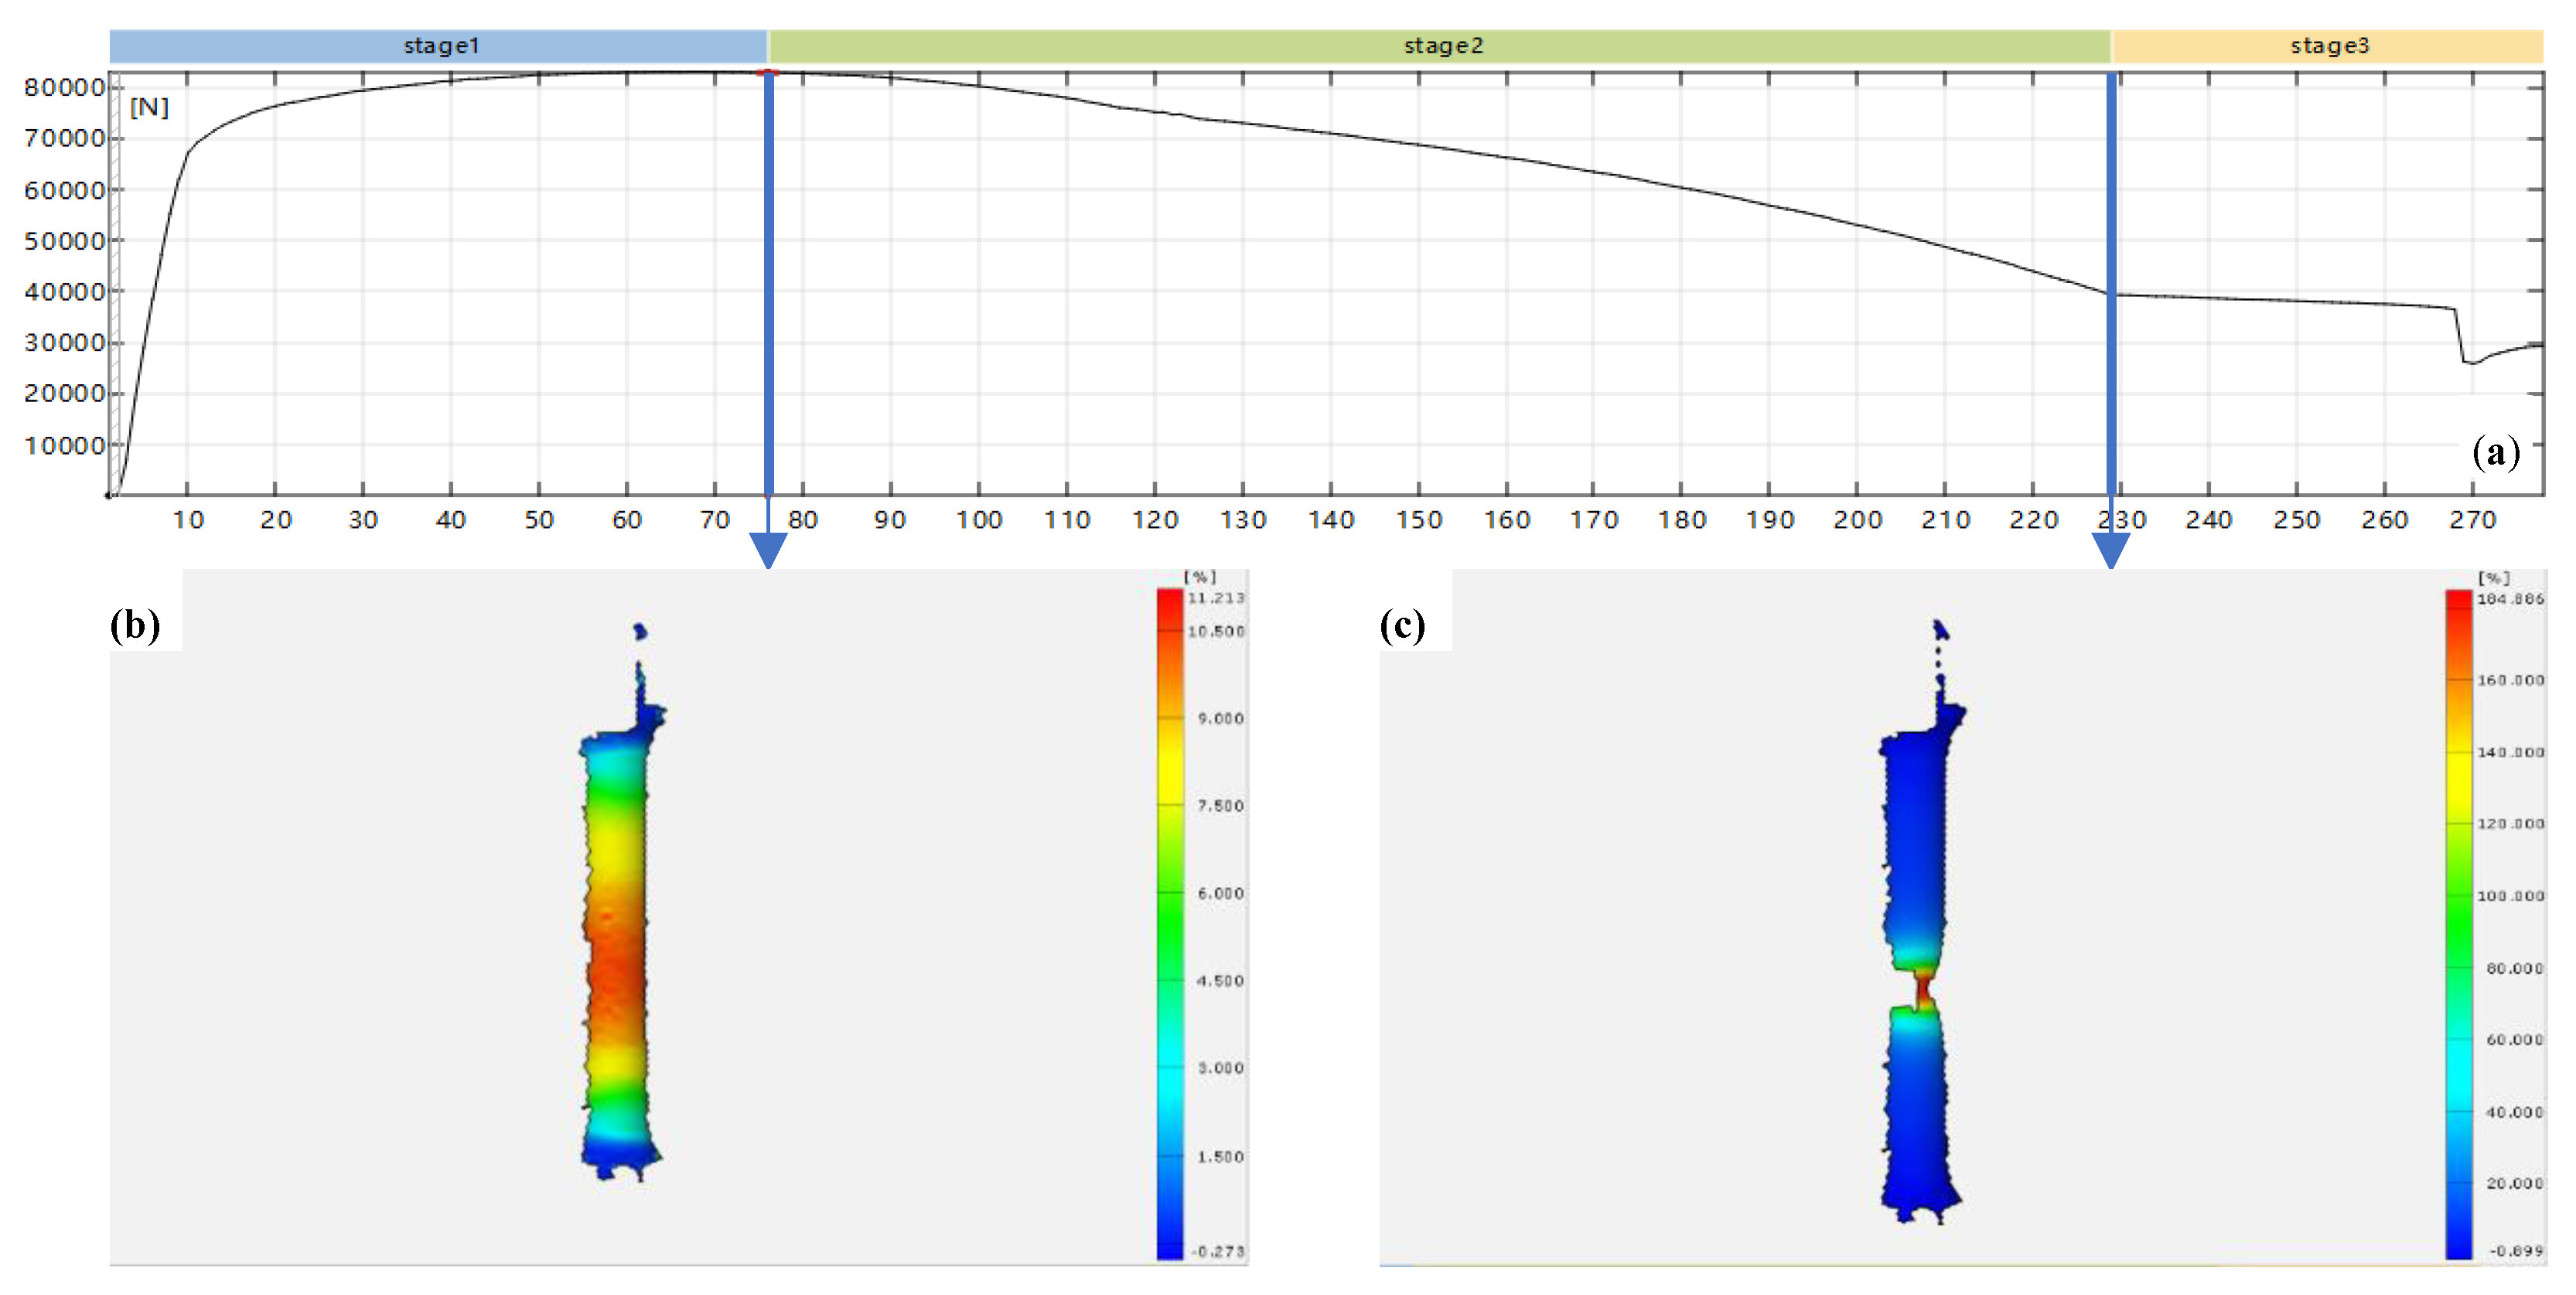
3.1. Tensile Test
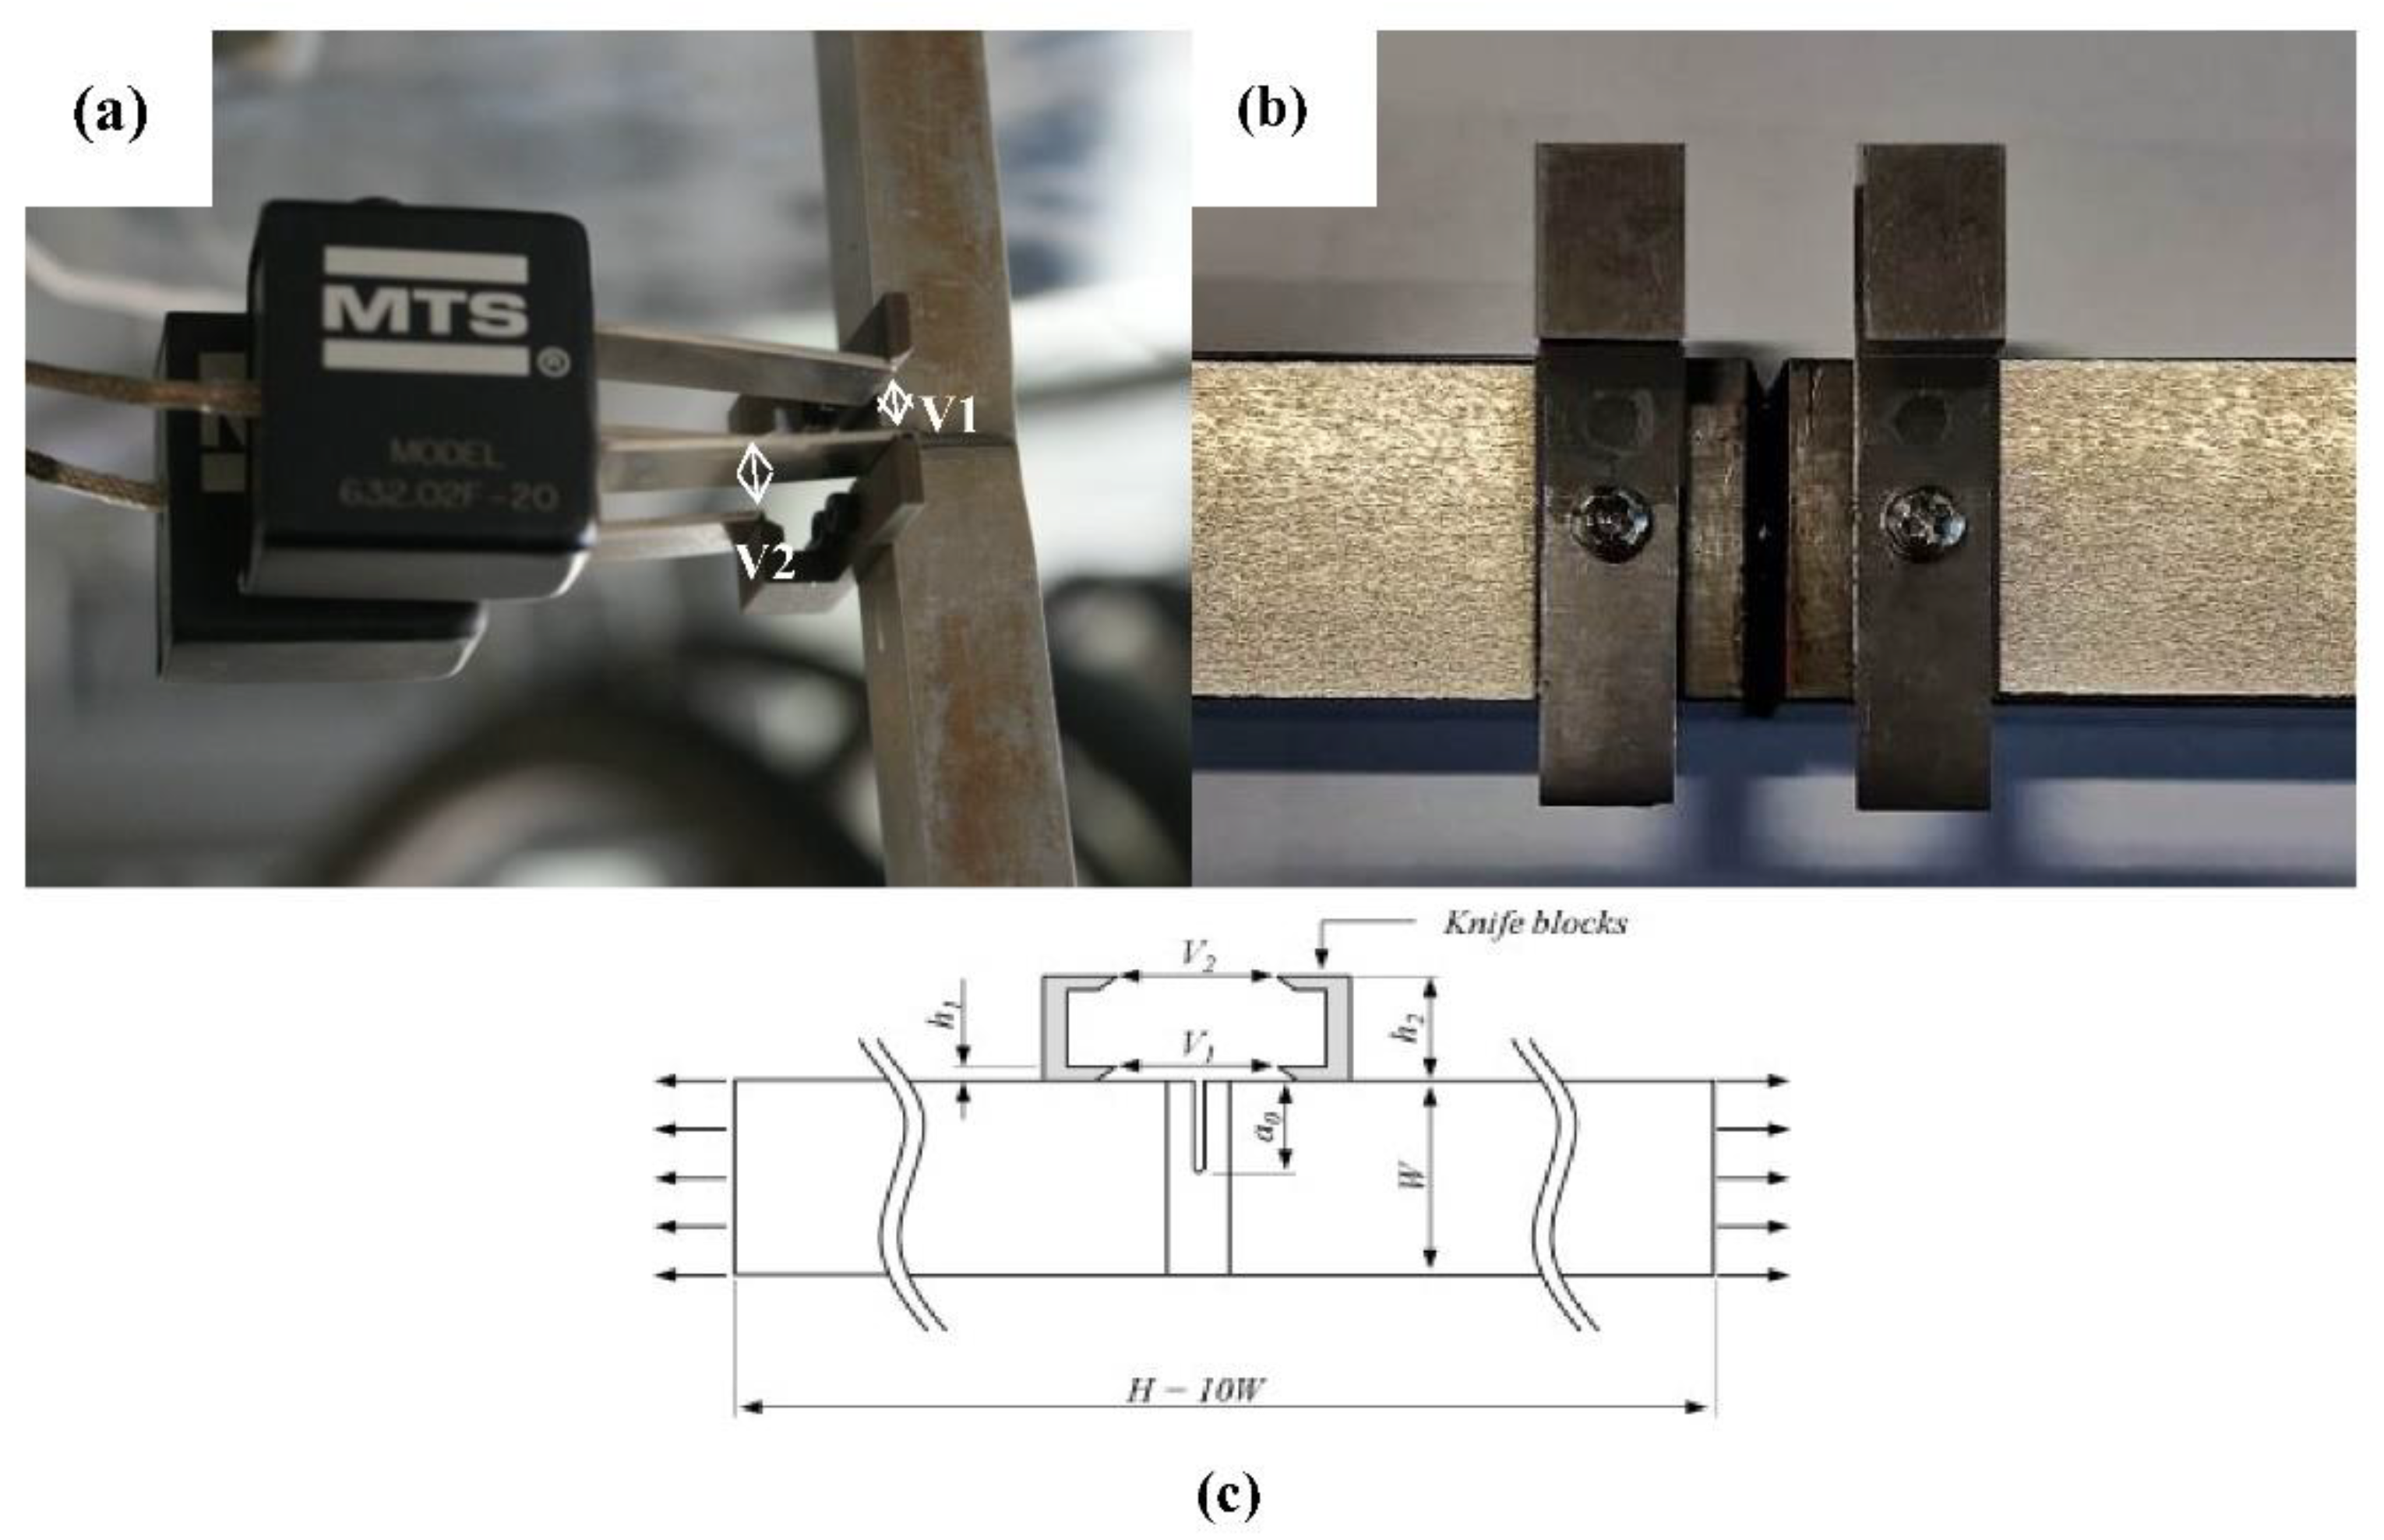
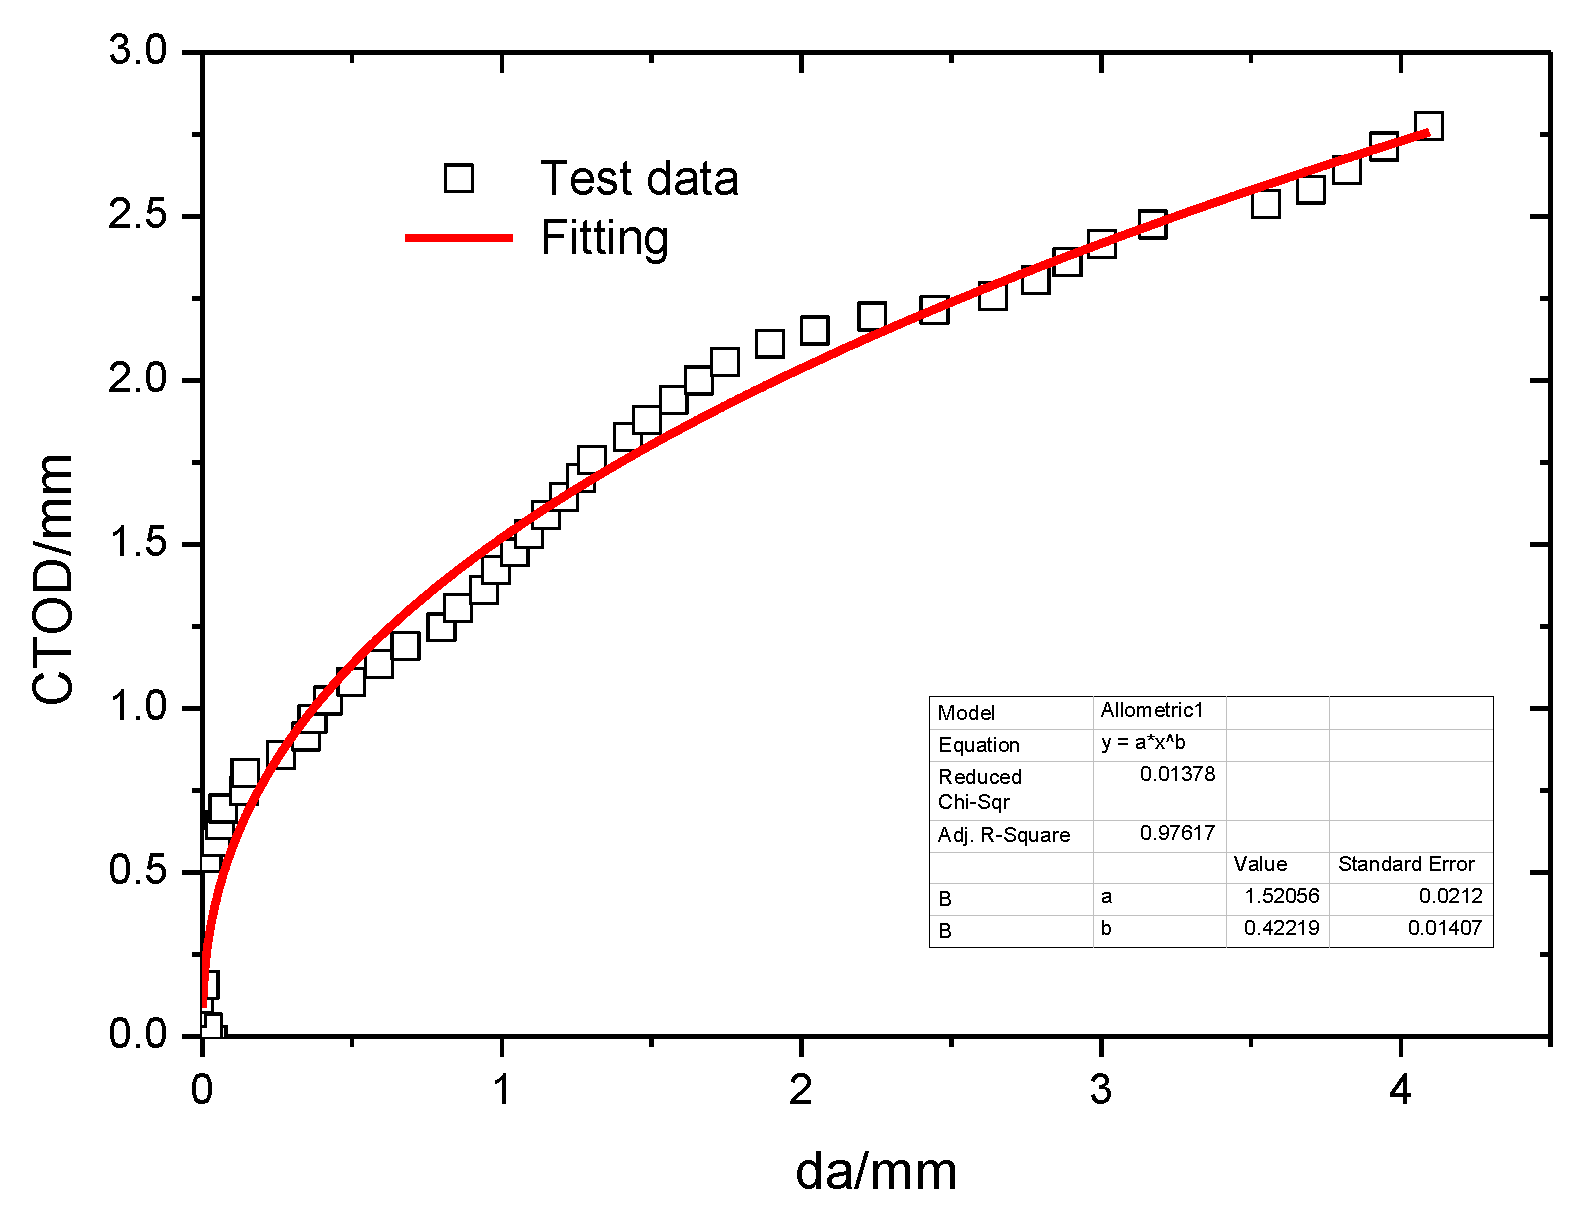
3.2. SENT Test
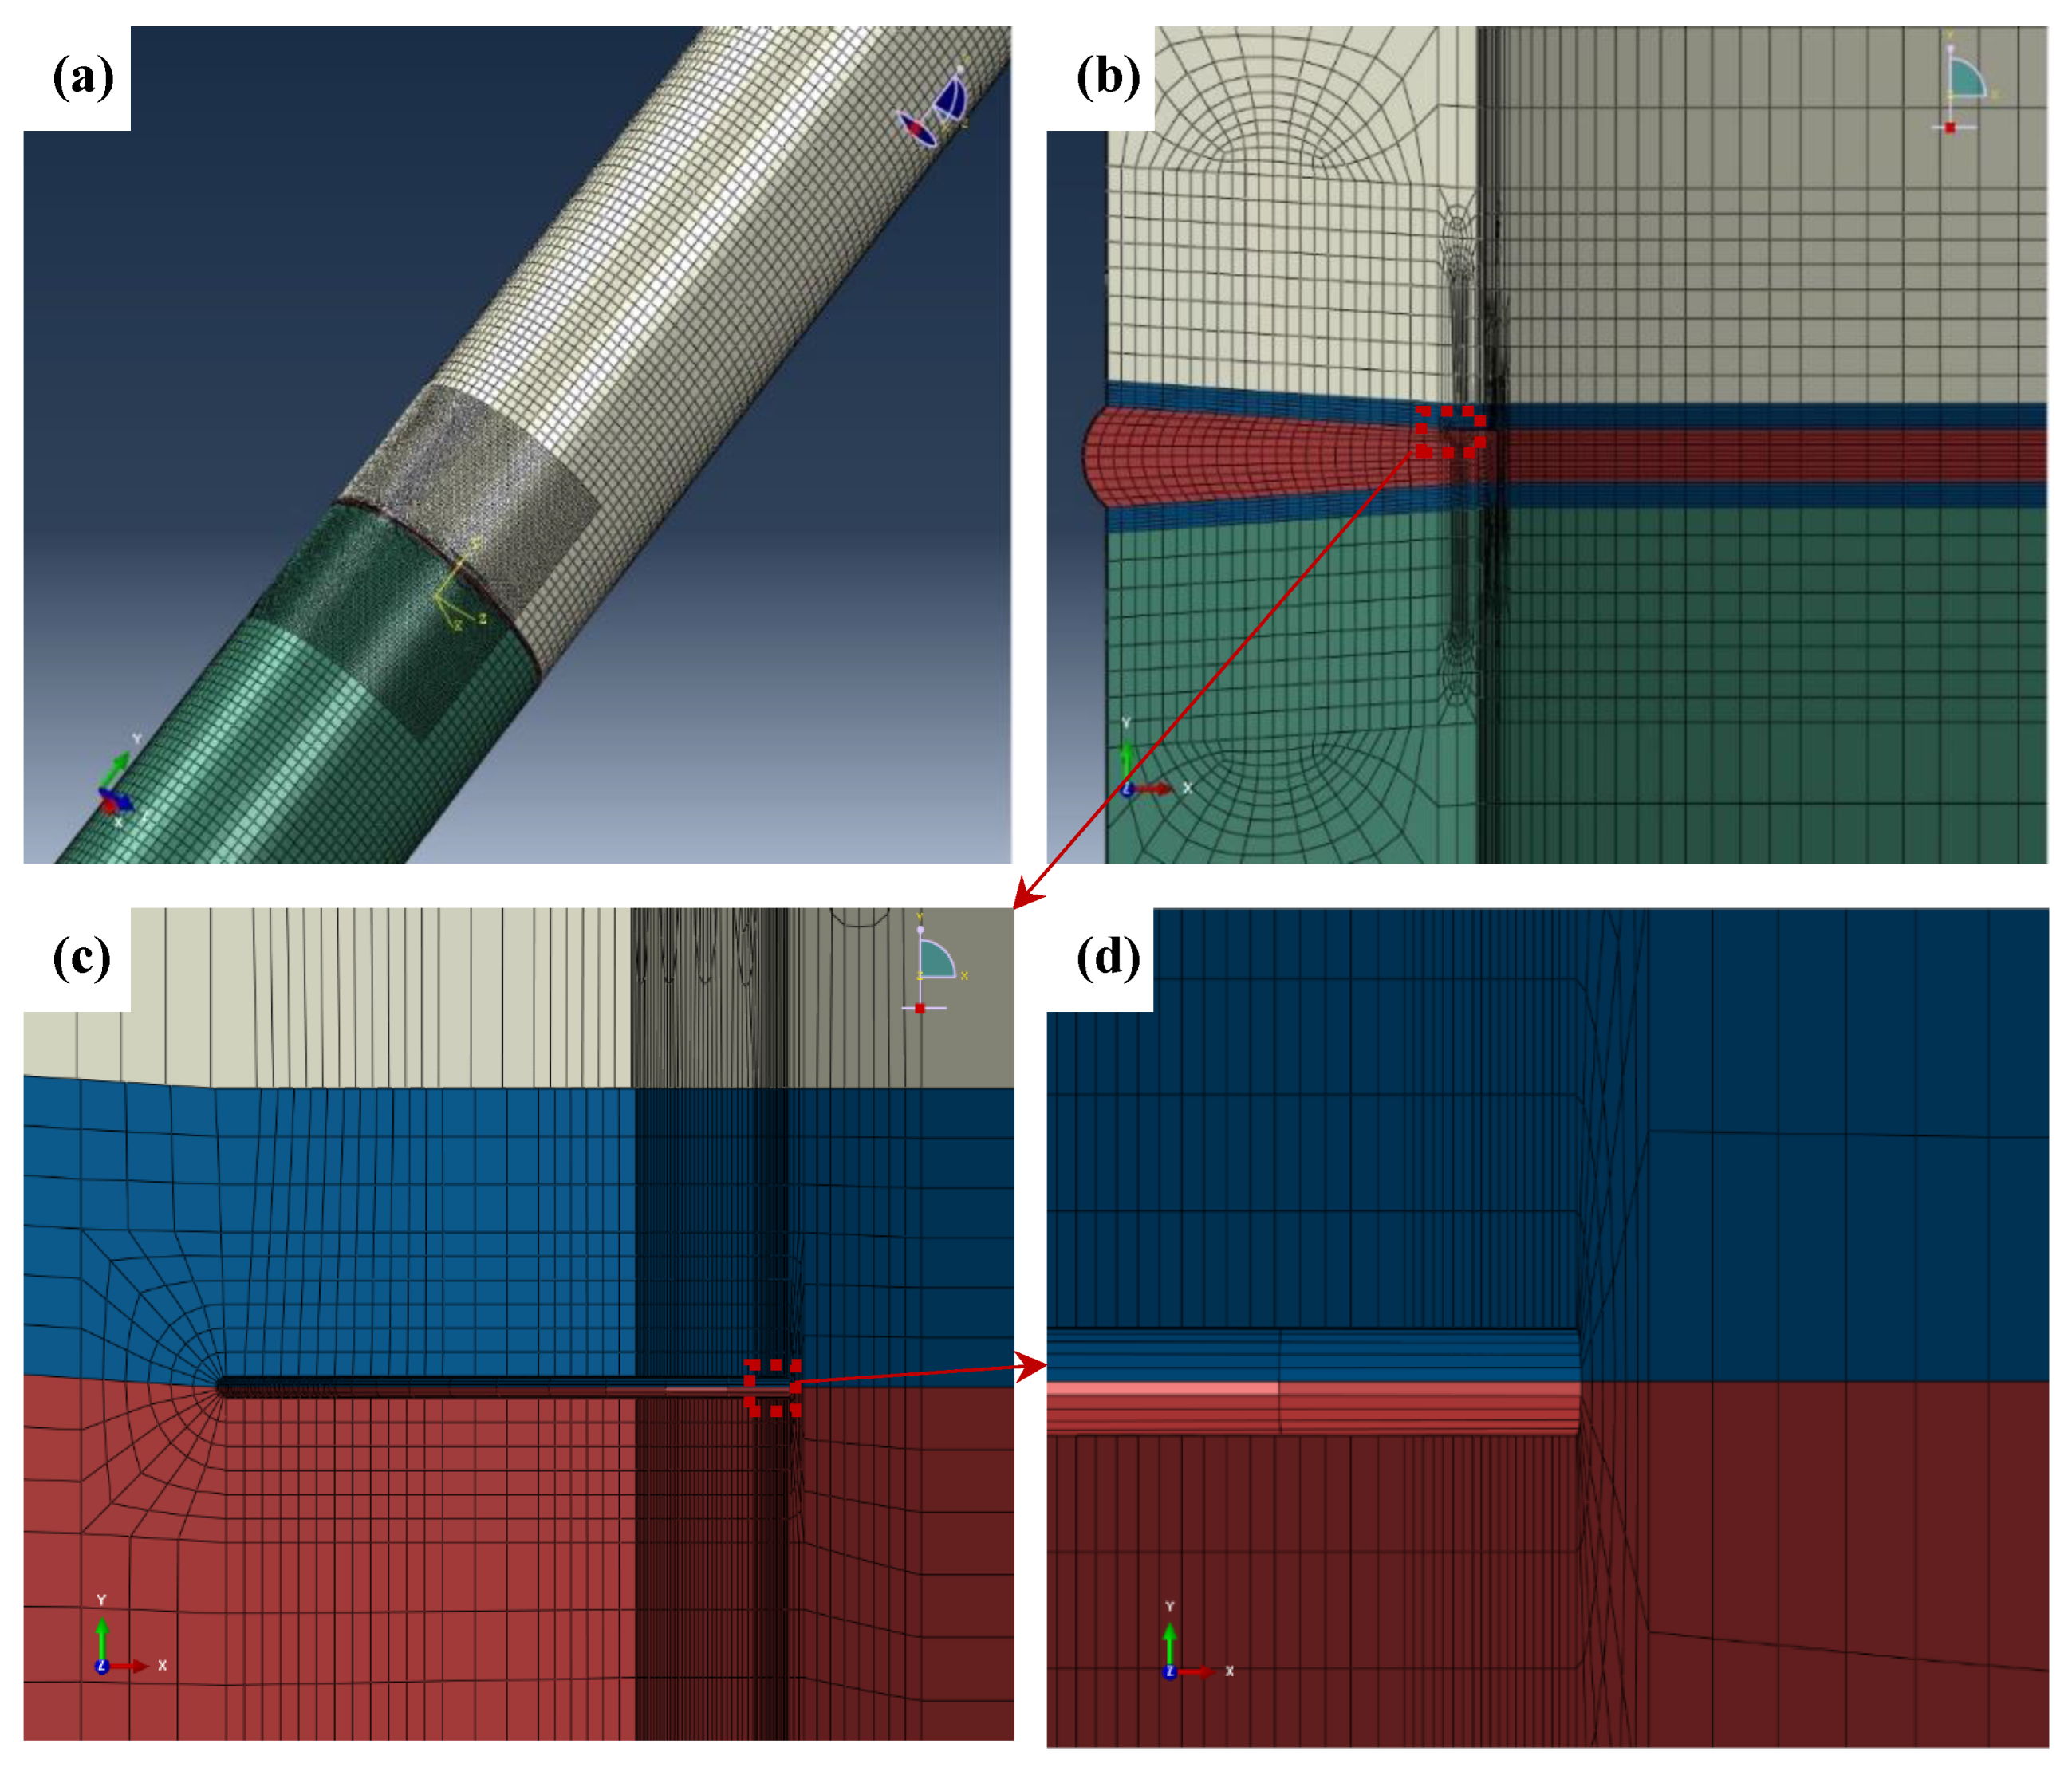
4. FEA Process
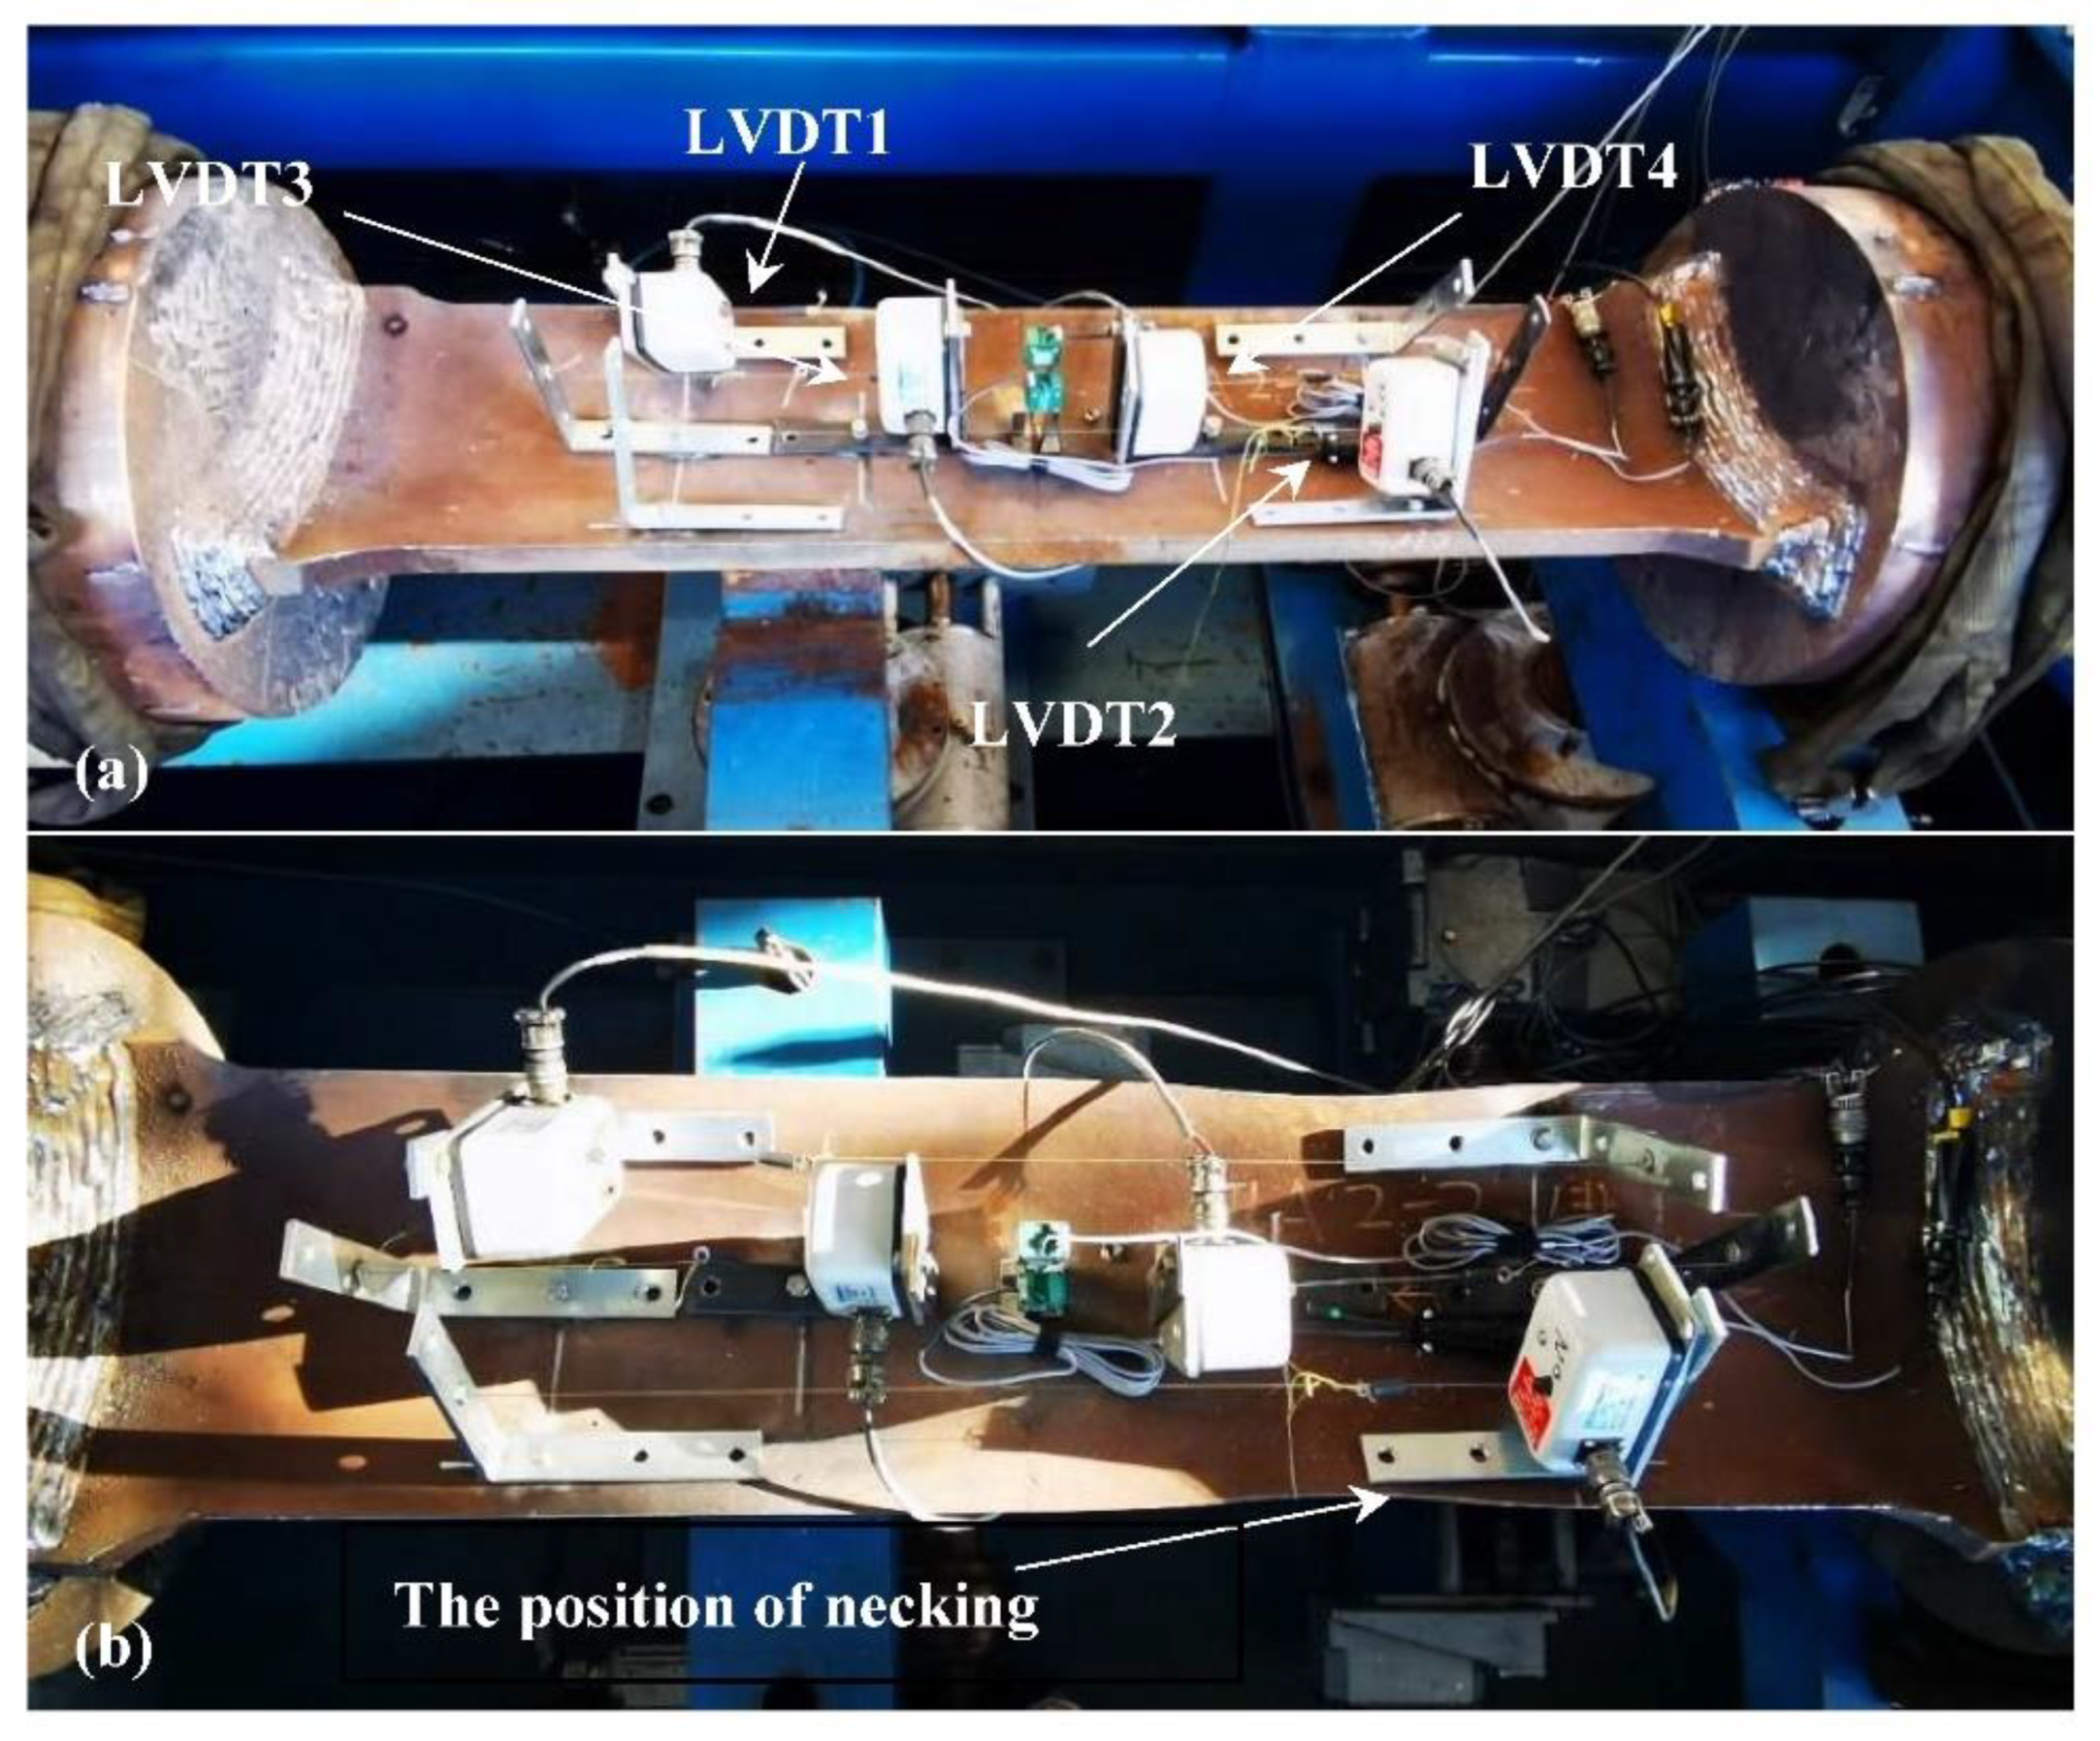
5. Curved Wide Plate and Full-Size Bending Test
6. Conclusions
- -
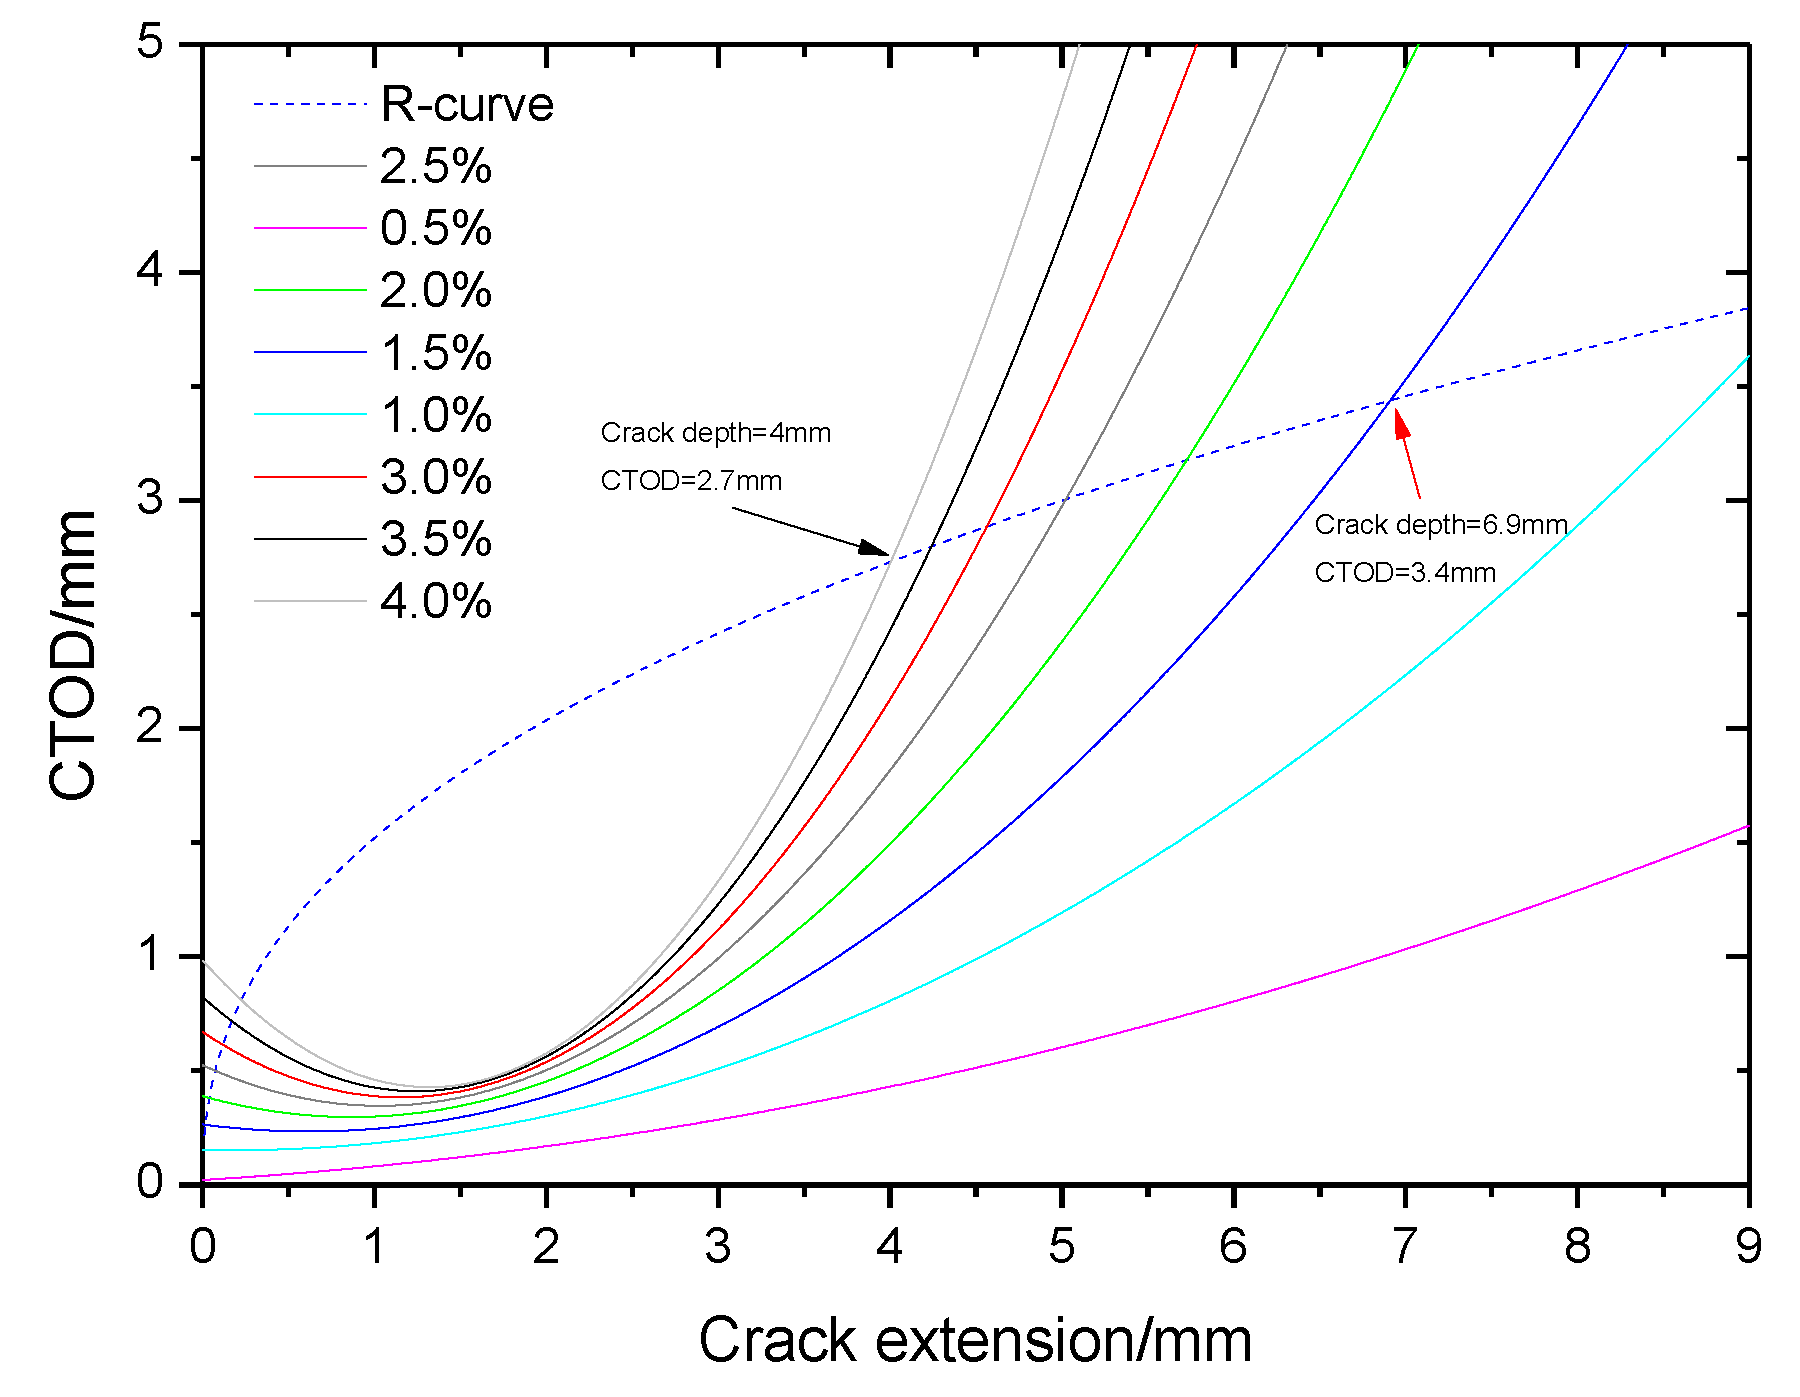
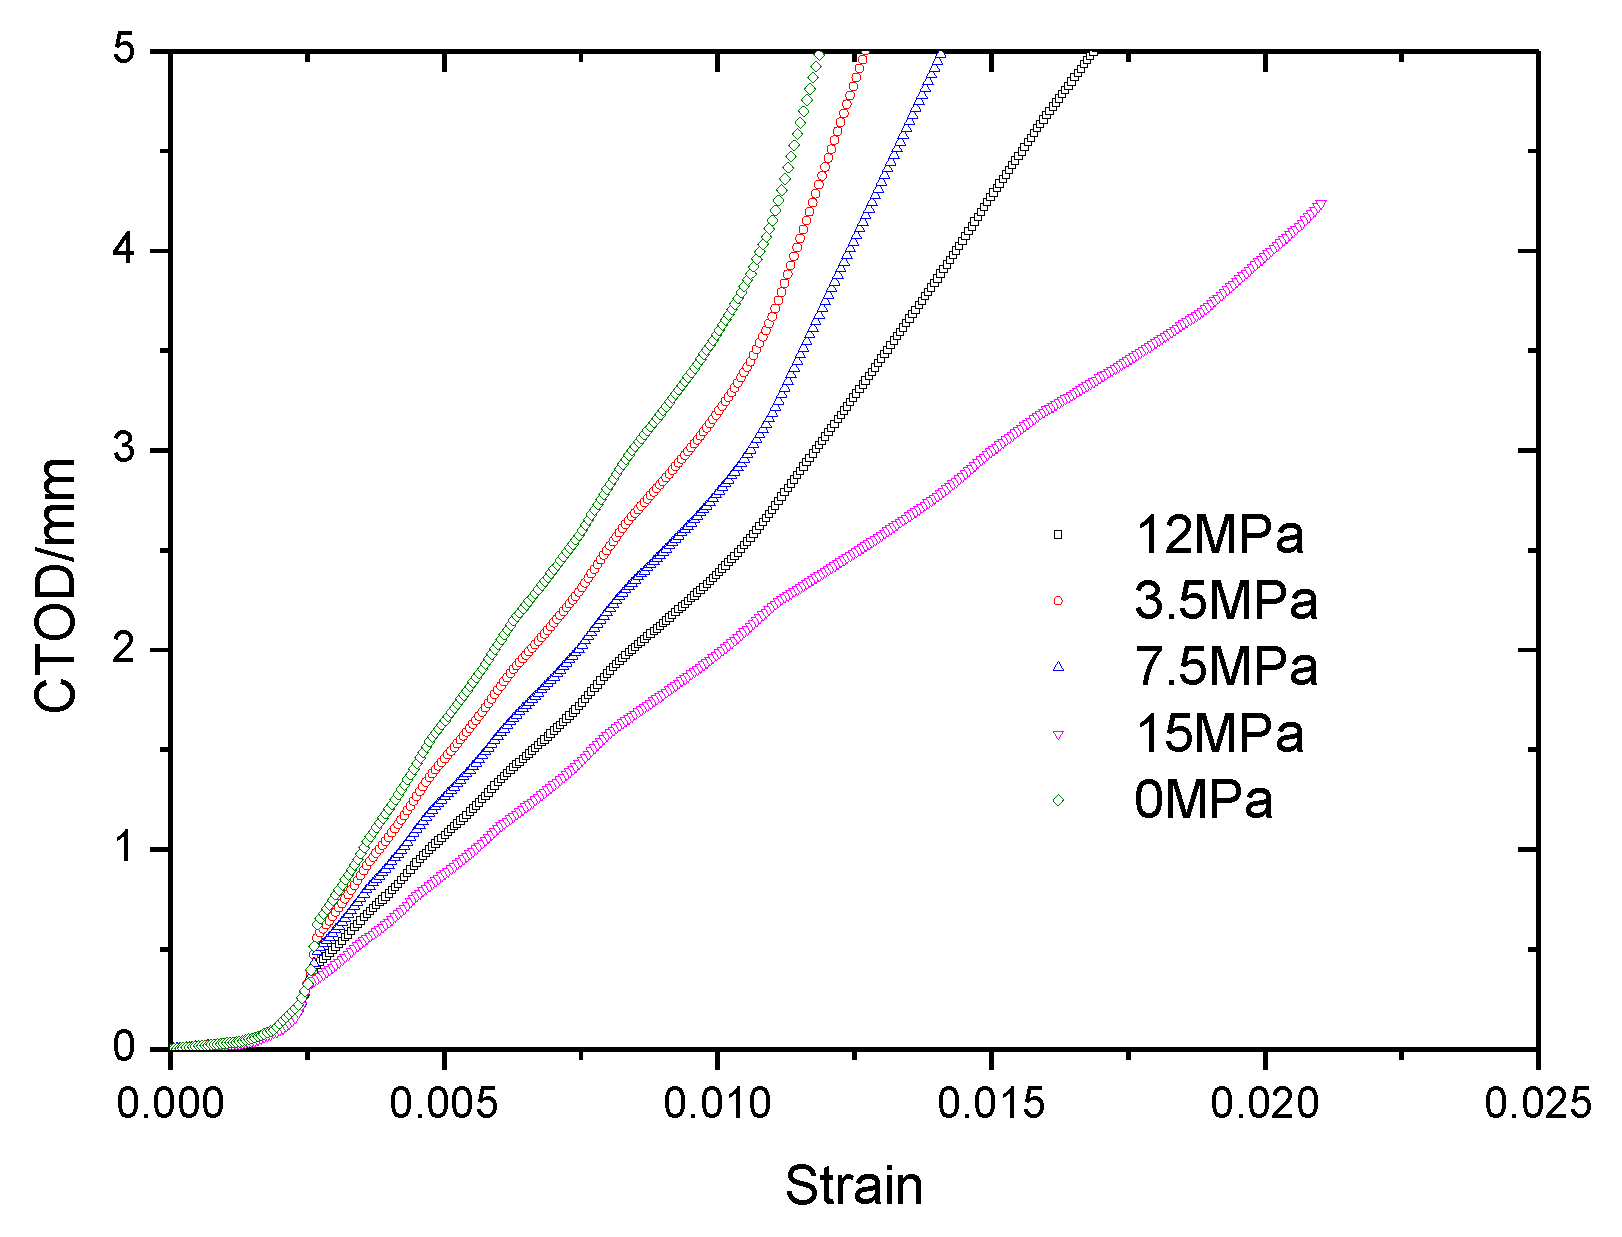
- The FEA method results showed that the crack growth resistance curve intersected a driving force curve of 0.04 tensile strain with a crack depth of 4 mm, and that unstable crack propagation will occur when the crack depth is larger than 4 mm and the tensile strain is higher than 0.04. The marine depth helps to reduce the crack driving force and improve the safety of the pipeline, and the FEA assessment can produce reliable results.
- -
- The results of CWP tests indicated that crack running does not occur when the initial crack depth is less than 4 mm, the failure model is the rupture of pipe metal, and the critical strain capacity is 0.05. Fracture occurs when the initial crack depth is 8 mm and the critical strain capacity is 0.02. The crack does not run in the full-size bending test, and the failure model is the pipe rupture.
- -
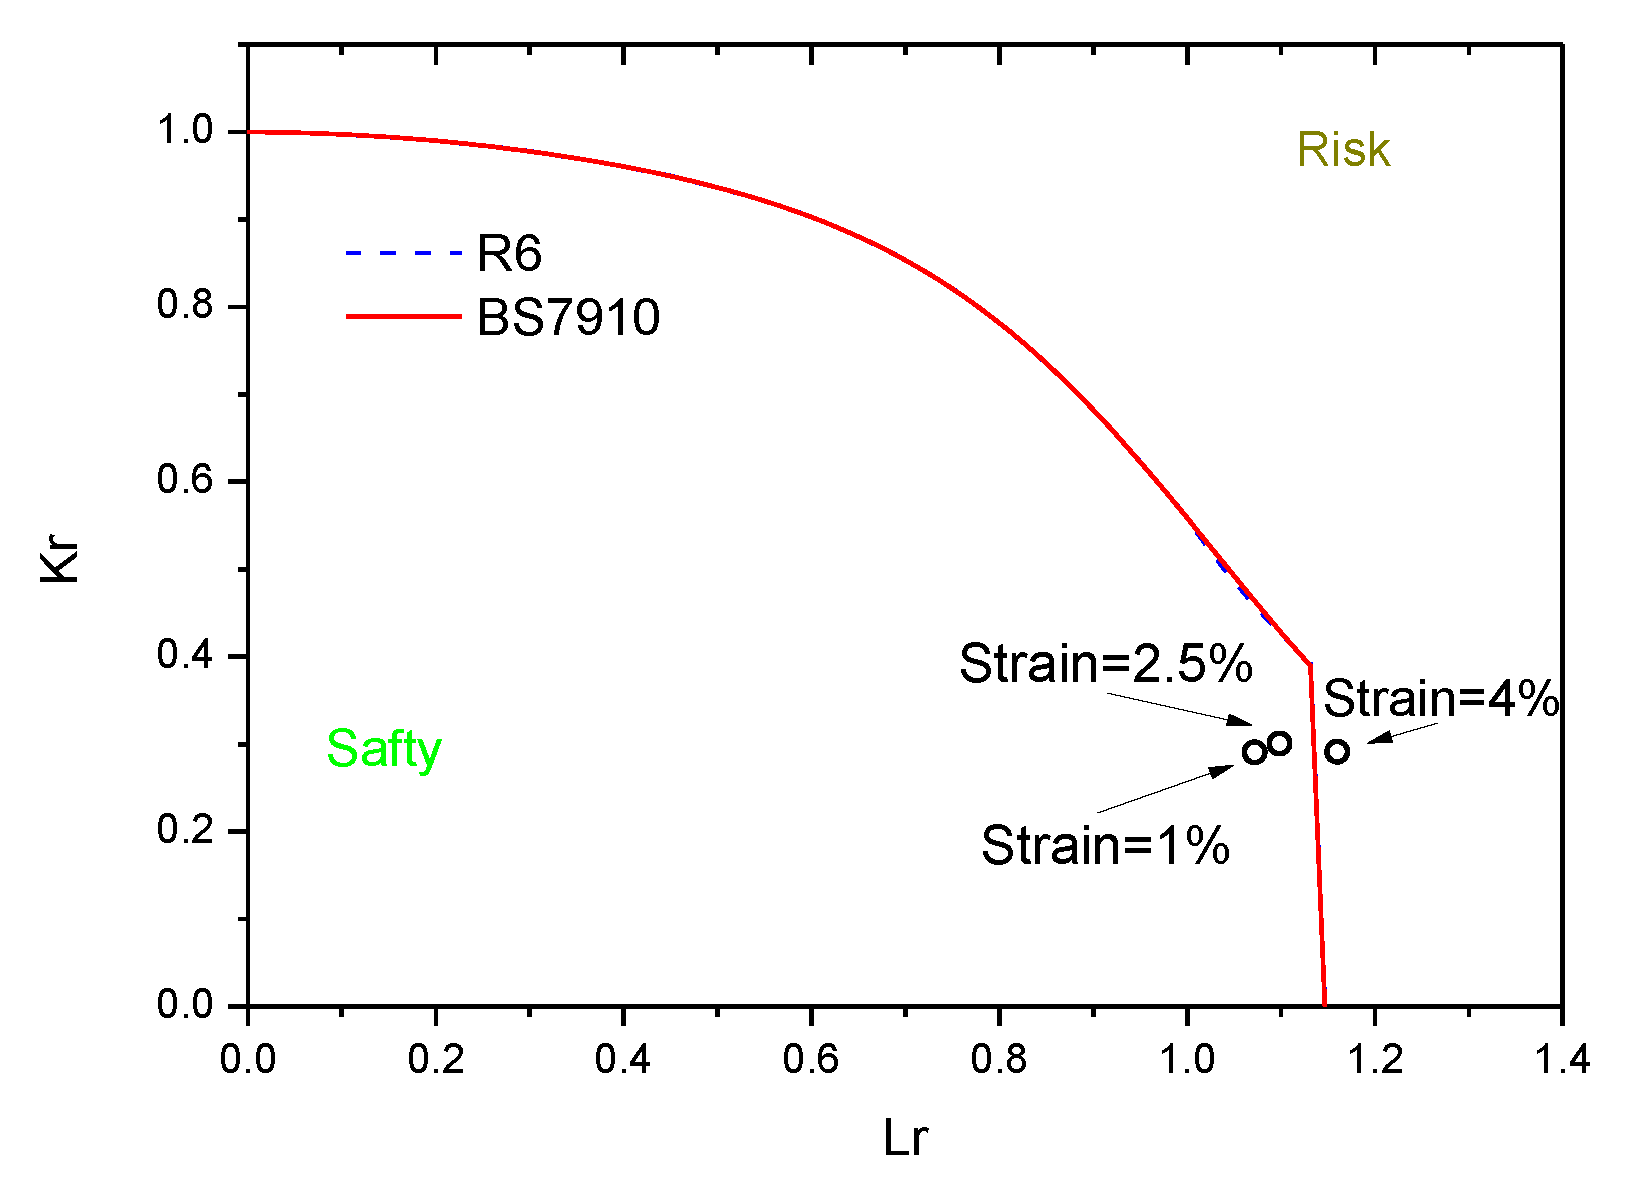
- The assessment comparison results show that the result of the failure assessment curve is more conservative; the FEA method is preferred and agrees well with the full-scale test.
Author Contributions
Funding
Institutional Review Board Statement
Informed Consent Statement
Data Availability Statement
Conflicts of Interest
References
- Olso, E.; Berg, E.; Nyhus, B.; Thaulow, C.; Ostby, E. A new assessment approach for ECA of clad and lined pipes based on shell and line-spring finite elements. In Proceedings of the Twenty-First (2011) International Offshore and Polar Engineering Conference, Honolulu, HI, USA, 16–21 June 2011. [Google Scholar]
- Souza, R.F.; Ruggieri, C. Fracture assessments of clad pipe girth welds incorporating improved crack driving force solutions. Eng. Fract. Mech. 2015, 148, 383–405. [Google Scholar] [CrossRef]
- Pepin, A.; Tkaczyk, T.; O’Dowd, N.; Nikbin, K. Methodology for assessment of surface defects in undermatched pipeline girth weld. J. Press. Vessel Technol. 2015, 137, 051402. [Google Scholar] [CrossRef]
- Souza, R.F.; Ruggieri, C.; Zhang, Z.L. A framework for fracture assessments of dissimilar girth welds in offshore pipelines under bending. Eng. Fract. Mech. 2019, 163, 66–88. [Google Scholar] [CrossRef]
- Manouchehri, S. A discussion of practical aspects of reeled flowline installation. In Proceedings of the 31st International Conference on Ocean, Offshore and Arctic Engineering (OMAE 2012), Rio de Janeiro, Brazil, 1–6 July 2012. [Google Scholar] [CrossRef] [Green Version]
- Hertelé, S.; O’Dowd, N.; Minnebruggen, K.; Denys, R. Effects of pipe steel heterogeneity on the tensile strain capacity of a flawed pipeline girth weld. Eng. Frac. Mech. 2014, 115, 172–189. [Google Scholar] [CrossRef]
- Tkaczyk, T.; O’Dowd, N.P.; Howard, B.P. Comparison of crack driving force estimation schemes for weld defects in reeled pipelines. In Proceedings of the International Offshore and Polar Engineering Conference (ISOPE 2007), Lisbon, Portugal, 1–6 July 2007. [Google Scholar]
- Cosham, A.; Macdonald, K.A. Fracture control in pipelines under high plastic strain—A critique of DNV-RP-F108. In Proceedings of the International Pipeline Conference (IPC 2008), Calgary, AB, Canada, 29 September–3 October 2008. [Google Scholar] [CrossRef]
- Kwofie, S.; Rahbar, N. An equivalent driving force model for crack growth prediction under different stress ratios. Int. J. Fatigue 2011, 33, 1199–1204. [Google Scholar] [CrossRef]
- Bilgen, C.; Weinberg, K. On the crack-driving force of phase-field models in linearized and finite elasticity. Comput. Methods Appl. Mech. Engrg. 2019, 353, 348–372. [Google Scholar] [CrossRef] [Green Version]
- Verstraete, M.; Hertelé, S.; Denys, R.; Minnebruggen, K.V.; Waele, W.D. Evaluation and interpretation of ductile crack extension in SENT specimens using unloading compliance technique. Eng. Fract. Mech. 2014, 115, 190–203. [Google Scholar] [CrossRef]
- Shih, C.F.; German, M.D. Requirements for a one parameter characterization of crack tip fields by the HRR singularity. Int. J. Fract. 1981, 17, 27–43. [Google Scholar] [CrossRef]
- Nyhus, B.; Polanco, M.L.; Orjasther, O. SENT specimens an alternative to SENB specimens for fracture mechanics testing of pipelines. In Proceedings of the ASME 2003 22nd International Conference on Offshore Mechanics and Arctic Engineering, Cancun, Mexico, 8–13 June 2003. [Google Scholar] [CrossRef]
- Sandivk, A.; Østby, E.; Naess, A.; Sigurdsson, G.; Thaulow, C. Fracture control–offshore pipelines: Probabilistic fracture assessment of surface cracked ductile pipelines using analytical equations. In Proceeding of the 24th International Conference on Offshore Mechanics and Arctic Engineering, Halkidiki, Greece, 12–17 June 2005. [Google Scholar] [CrossRef]
- Nyhus, B.; Østby, E.; Knagenhjelm, H.O.; Black, S. Fracture control—offshore pipelines: Experimental studies on the effect of crack depth and asymmetric geometries on the ductile tearing resistance. In Proceeding of the 24th International Conference on Offshore Mechanics and Arctic Engineering, Halkidiki, Greece, 12–17 June 2005. [Google Scholar] [CrossRef]
- Li, C.B.; Dang, S.H. Plastic damage analysis of oil and gas pipelines with unconstrained and constrained dents. Eng. Fail. Anal. 2017, 77, 399–407. [Google Scholar] [CrossRef]
- Pavankumar, T.V.; Chattopadhyay, J.; Dutta, B.K.; Kushwaha, H.S. Transferability of specimen J-R curve to straight pipes with throughwall circumferential flaws. Int. J. Pres. Ves. Pip. 2002, 79, 127–134. [Google Scholar] [CrossRef]
- Wallin, K.R. Critical assessment of the standard ASTM E 399. J. ASTM Int. 2005, 4, 17–37. [Google Scholar] [CrossRef]
- Thaulow, C.; Hauge, M.; Zhang, Z.L.; Ranestad, O.; Fattorini, F. On the interrelationship between fracture toughness and material mismatch for cracks located at the fusion line of weldments. Eng. Fract. Mech. 1999, 64, 369–382. [Google Scholar] [CrossRef]
- Betegon, C.; Hancock, J.W. Two-parameter characterization of elastic-plastic crack tip fields. J. Appl. Mech. 1991, 58, 104–113. [Google Scholar] [CrossRef]
- Kim, Y.J.; Budden, P.J. Reference stress approximations for J and cod of circumferential through-wall cracked pipes. Int. J. Fract. 2002, 116, 195–218. [Google Scholar] [CrossRef]
- Bishop, R.; Hill, R.; Mott, N.F. The theory of indentation and hardness tests. Proc. Phys. Soc. 1945, 57, 147–159. [Google Scholar] [CrossRef]


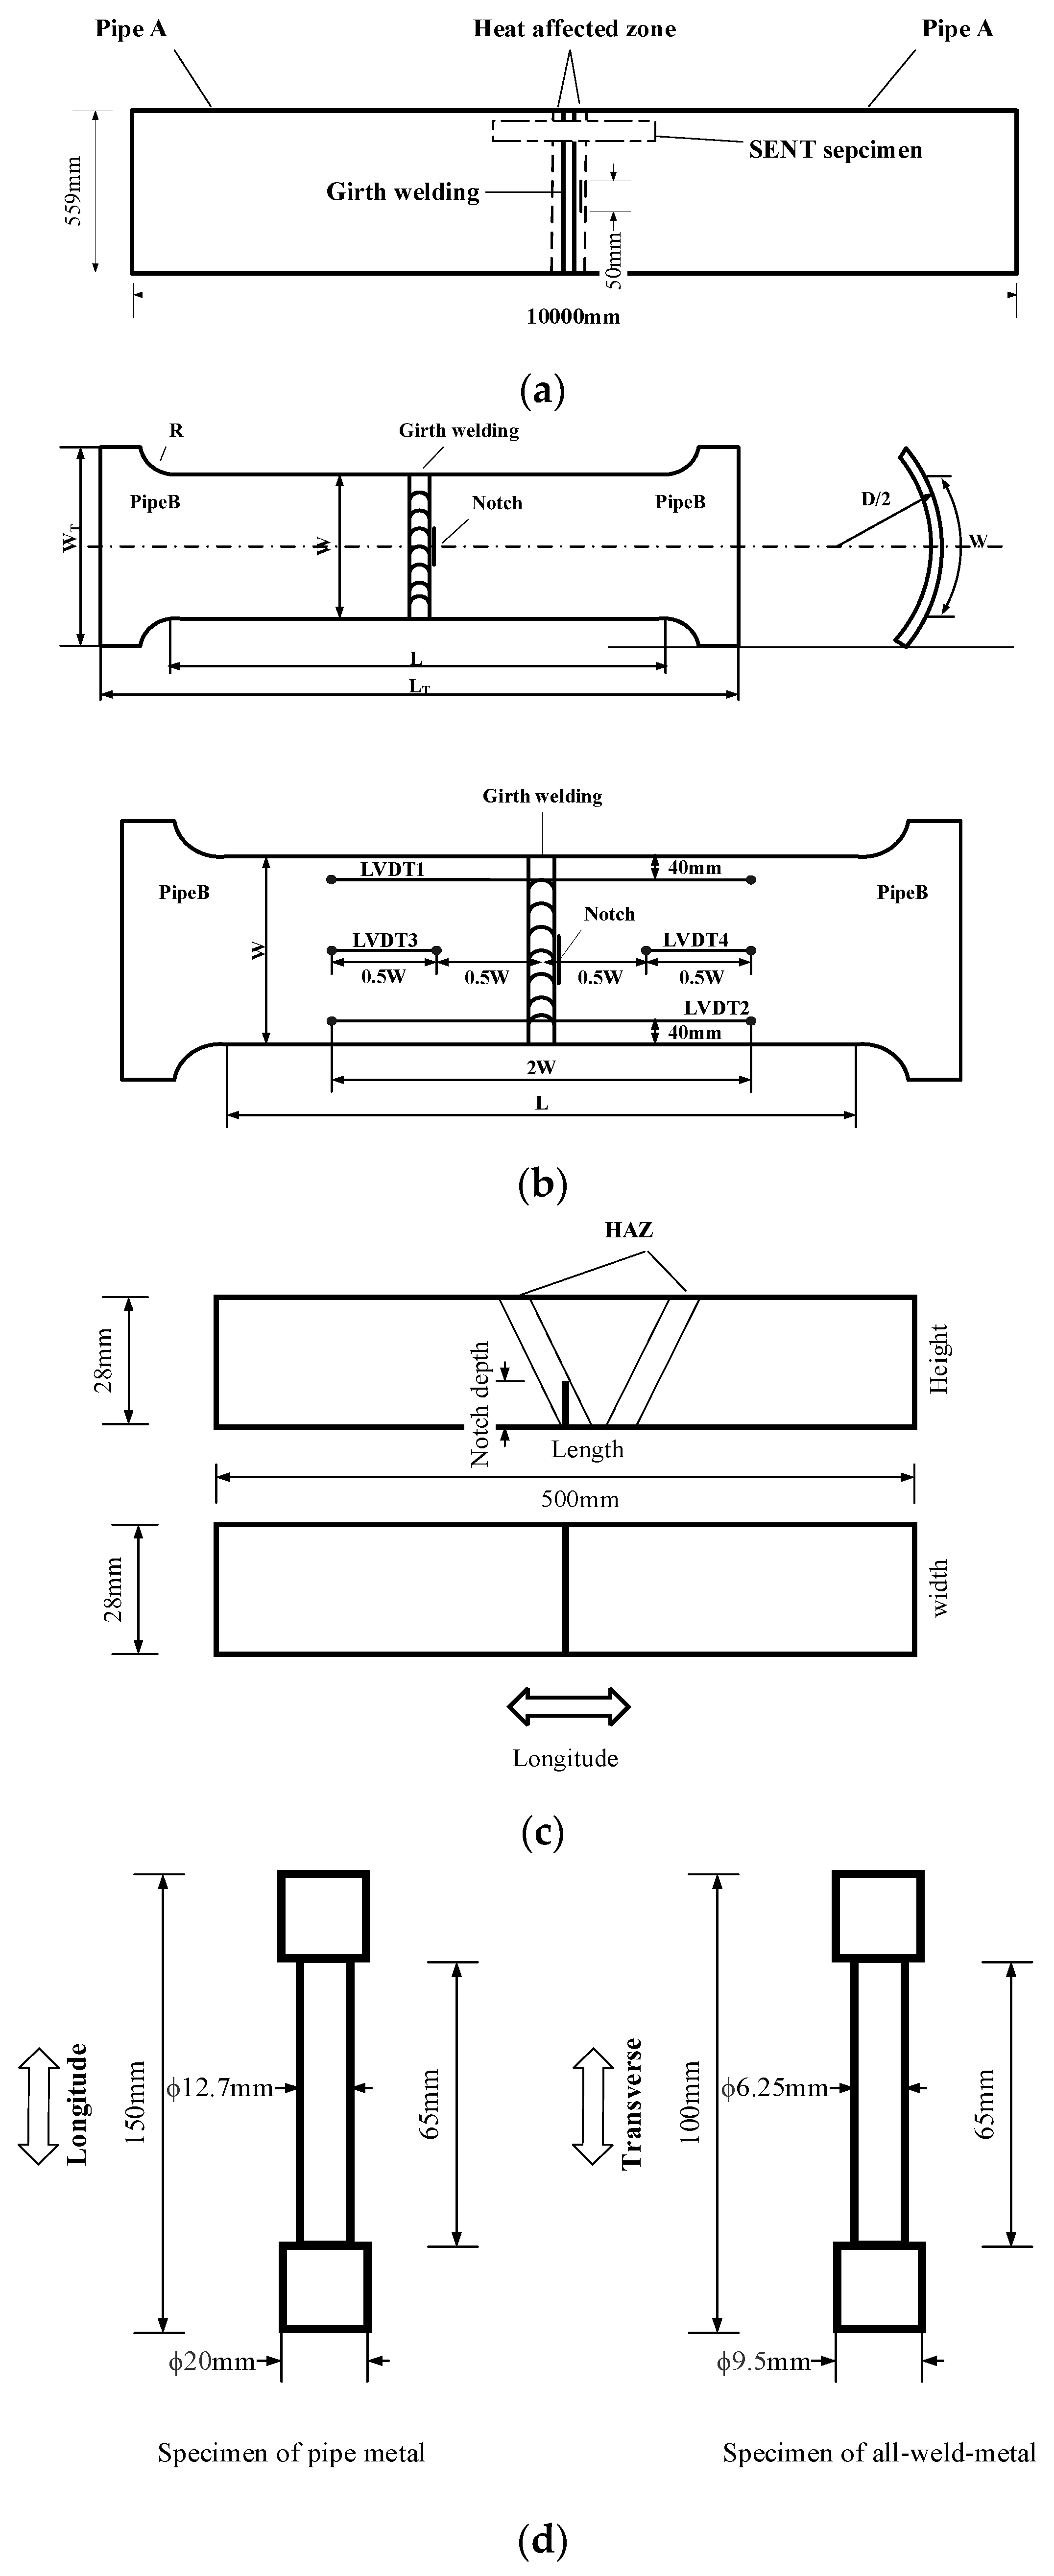
| SENT | Length × Width × Height | Notch depth | Instrument and Standard |
| 500 mm × 28 mm × 28 mm | 8.4 mm | MTS810; SY/T 7318.2-2016 | |
| Tensile test | Length × Diameter | / | SHT4106-SUNS; API 5L-2018 |
| 150 mm × ϕ12.7 mm 100 mm × ϕ6.25 mm | / | ||
| CWP | Length × wide × Thickness | Notch size (2c × a) | Combined Load Applying System; SY/T 7318.1-2016 |
| 1000 mm × 275 mm × 31.8 mm | 25 mm × 2 mm 50 mm × 4 mm 100 mm × 8 mm | ||
| Full-size bending test | Length × Outside Diameter × Thickness | Notch size (2c × a) | SY∕T 7318.3-2017 |
| 10,000 mm × 559 mm × 31.8 mm | 50 mm × 4 mm |
| C | Si | Mn | P | S | Mo | Ti | N | |
|---|---|---|---|---|---|---|---|---|
| Pipe A | 0.049 | 0.16 | 1.74 | 0.0082 | 0.0024 | 0.096 | 0.011 | 0.0033 |
| Pipe B | 0.048 | 0.16 | 1.74 | 0.0087 | 0.0029 | 0.097 | 0.011 | 0.0034 |
| Cr | Nb | V | Ni | Cu | B | Al | Pcm | |
| Pipe A | 0.29 | 0.053 | 0.0051 | 0.10 | 0.033 | 0.0003 | 0.031 | 0.17 |
| Pipe B | 0.29 | 0.053 | 0.0055 | 0.10 | 0.034 | 0.0003 | 0.030 | 0.17 |
| NO. | Crack Size (mm) | Remote Strain (%) | Failure Model | |||
|---|---|---|---|---|---|---|
| Depth | Length | LVDT3 | LVDT4 | Average | ||
| 1 | 2 | 25 | 4.02 | 5.98 | 5.00 | Necking |
| 2 | 4 | 50 | 3.69 | 6.26 | 4.98 | Necking |
| 3 | 8 | 100 | 1.52 | 2.76 | 2.14 | Fracture |
| Position | 1 | 2 | 3 | 4 | 5 | 6 | 7 | Failure model |
| Value | 4.0% | 4.5% | 3.0% | 2.1% | 1.8% | 0.8% | 4.1% | pipe rupture |
| Position | 8 | 9 | 10 | 11 | 12 | 13 | 14 | |
| Value | 4.5% | 3.2% | 2.0% | 1.9% | 0.9% | 0.07% | 0.08% |
Publisher’s Note: MDPI stays neutral with regard to jurisdictional claims in published maps and institutional affiliations. |
© 2022 by the authors. Licensee MDPI, Basel, Switzerland. This article is an open access article distributed under the terms and conditions of the Creative Commons Attribution (CC BY) license (https://creativecommons.org/licenses/by/4.0/).
Share and Cite
Yang, K.; Sha, T.; Gao, X.; Chen, H.; Chi, Q.; Ji, L. Study of Strain Capacity for High-Strain Marine Pipe. Materials 2022, 15, 5793. https://doi.org/10.3390/ma15165793
Yang K, Sha T, Gao X, Chen H, Chi Q, Ji L. Study of Strain Capacity for High-Strain Marine Pipe. Materials. 2022; 15(16):5793. https://doi.org/10.3390/ma15165793
Chicago/Turabian StyleYang, Kun, Ting Sha, Xiongxiong Gao, Hongyuan Chen, Qiang Chi, and Lingkang Ji. 2022. "Study of Strain Capacity for High-Strain Marine Pipe" Materials 15, no. 16: 5793. https://doi.org/10.3390/ma15165793
APA StyleYang, K., Sha, T., Gao, X., Chen, H., Chi, Q., & Ji, L. (2022). Study of Strain Capacity for High-Strain Marine Pipe. Materials, 15(16), 5793. https://doi.org/10.3390/ma15165793