
Effects of Quenching Cooling Rate on Residual Stress and Mechanical Properties of a Rare-Earth Wrought Magnesium Alloy

Abstract
:1. Introduction
2. Experimental
2.1. Heat Treatment and Mechanical Properties Measurements
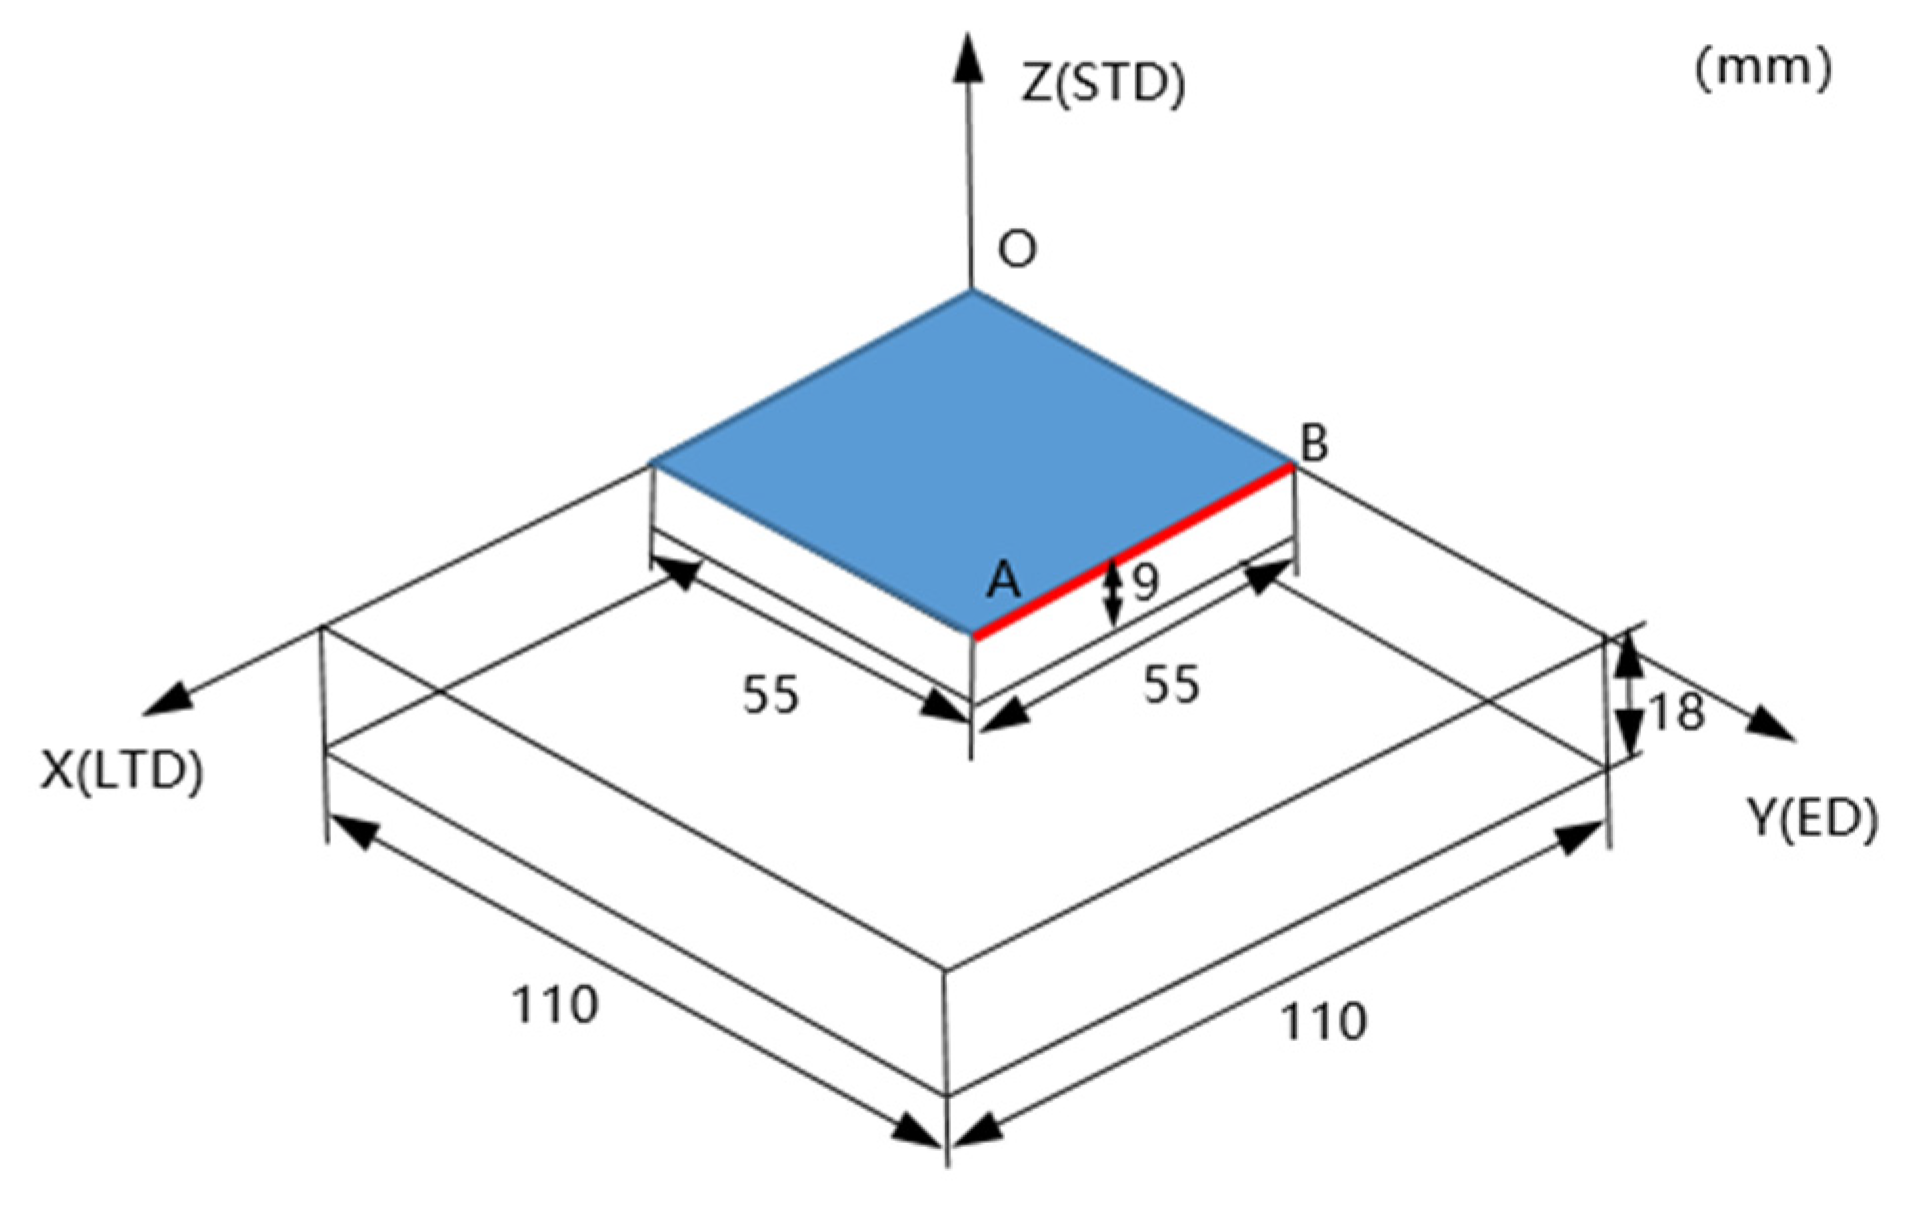
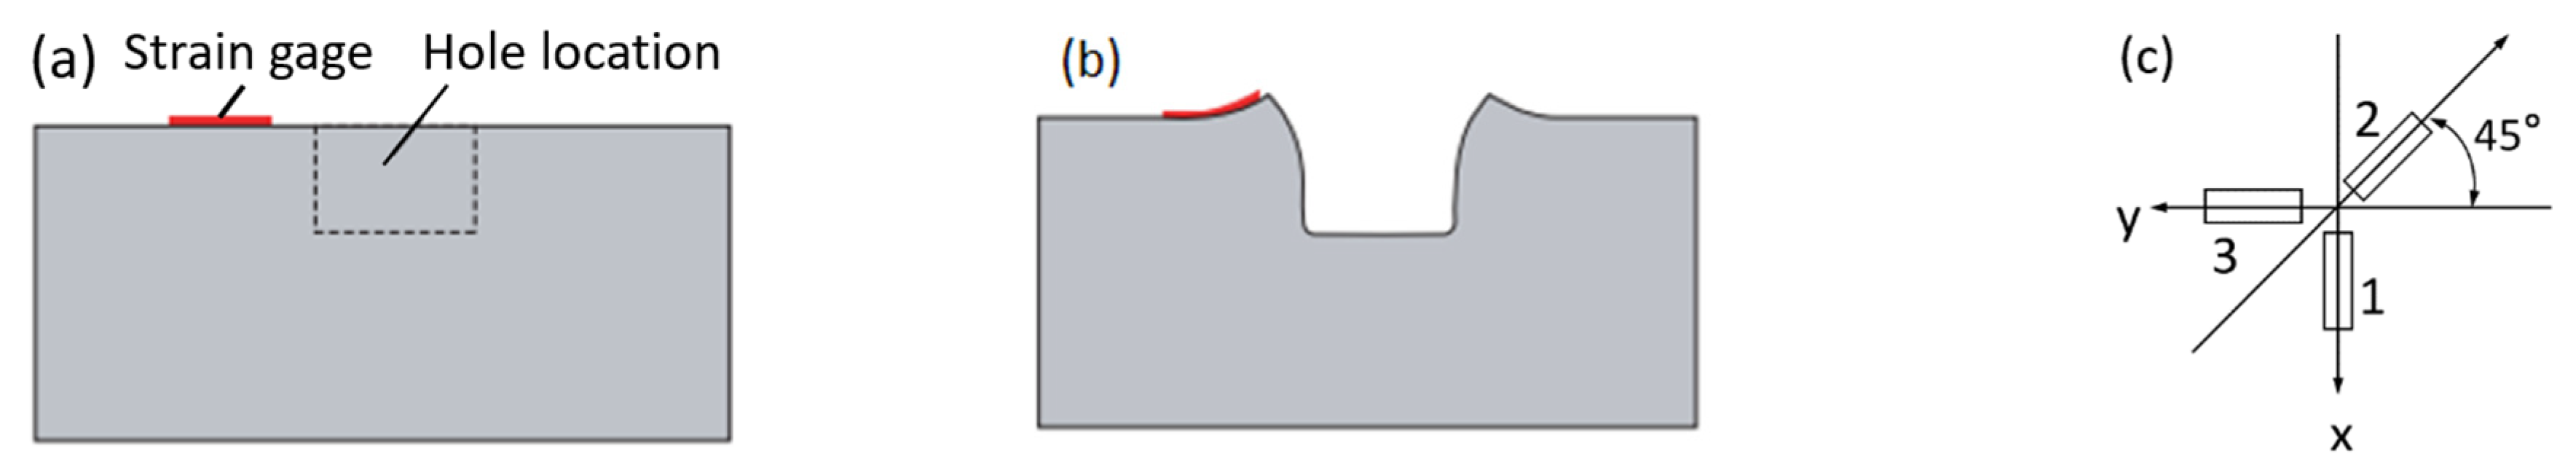
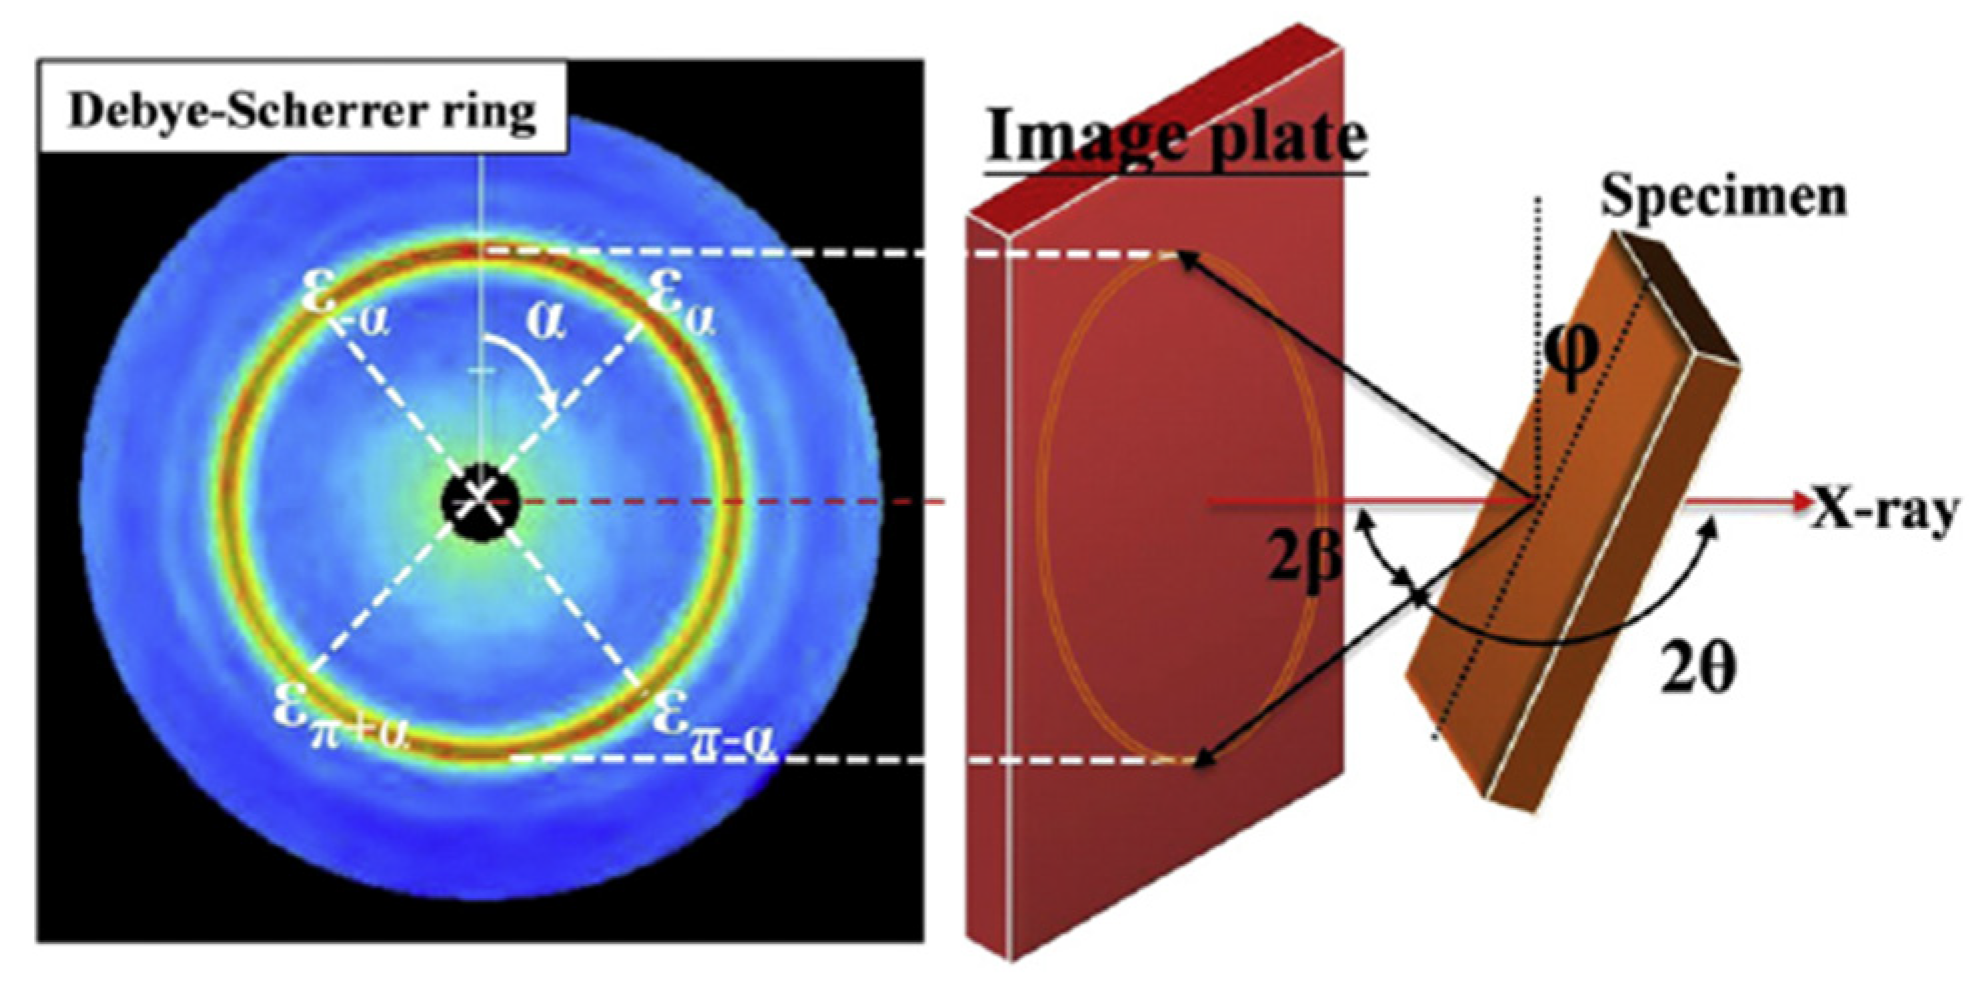
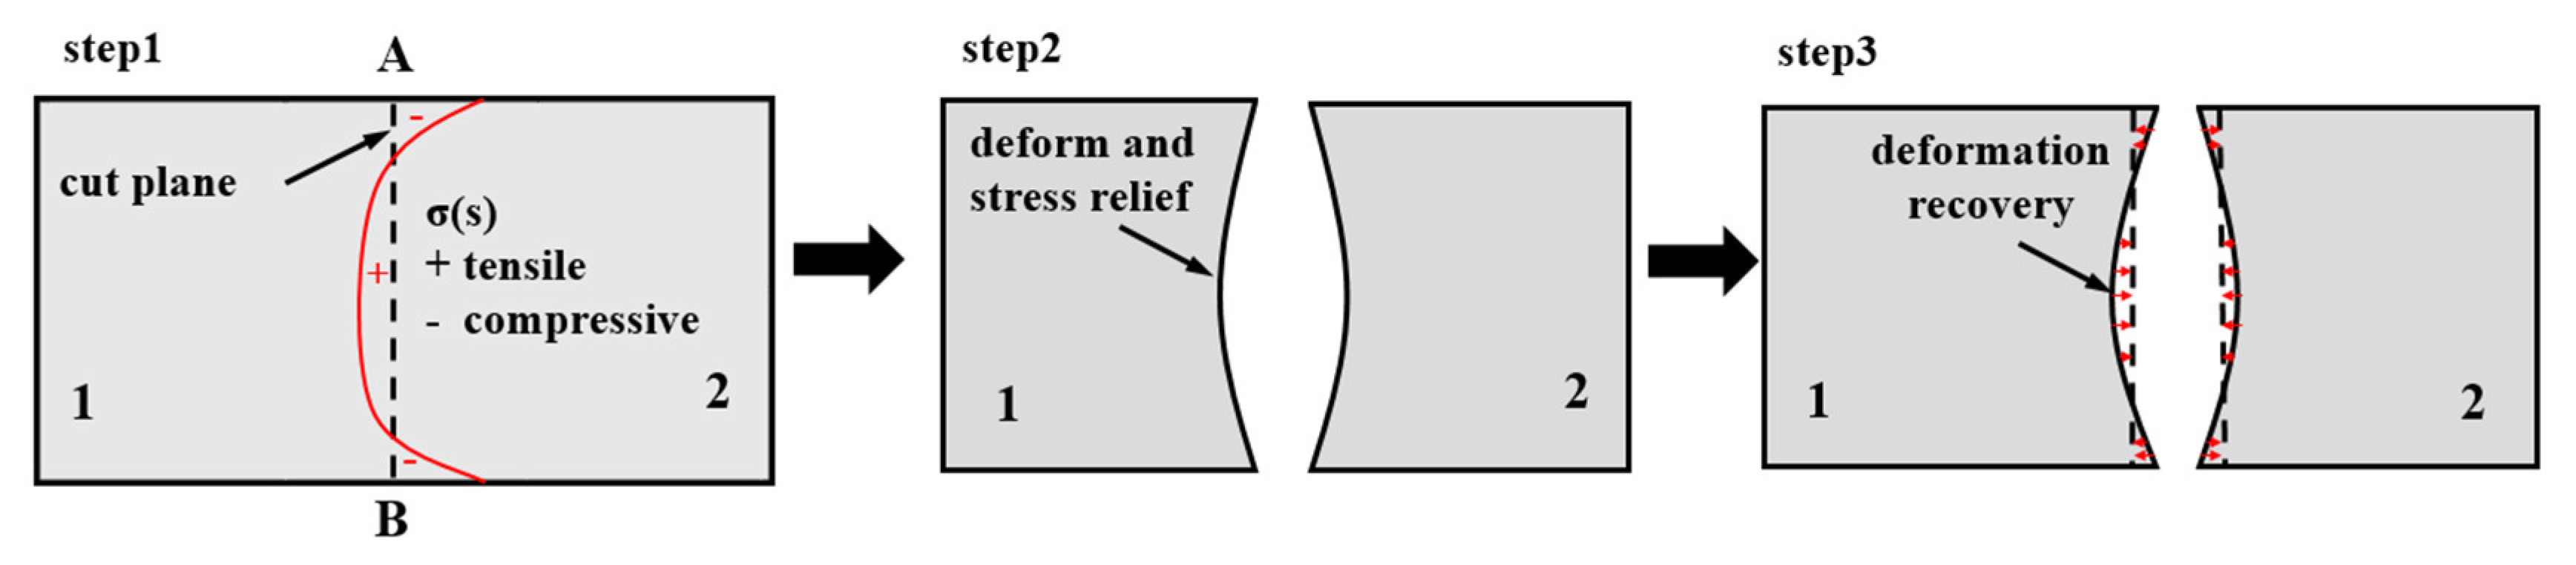
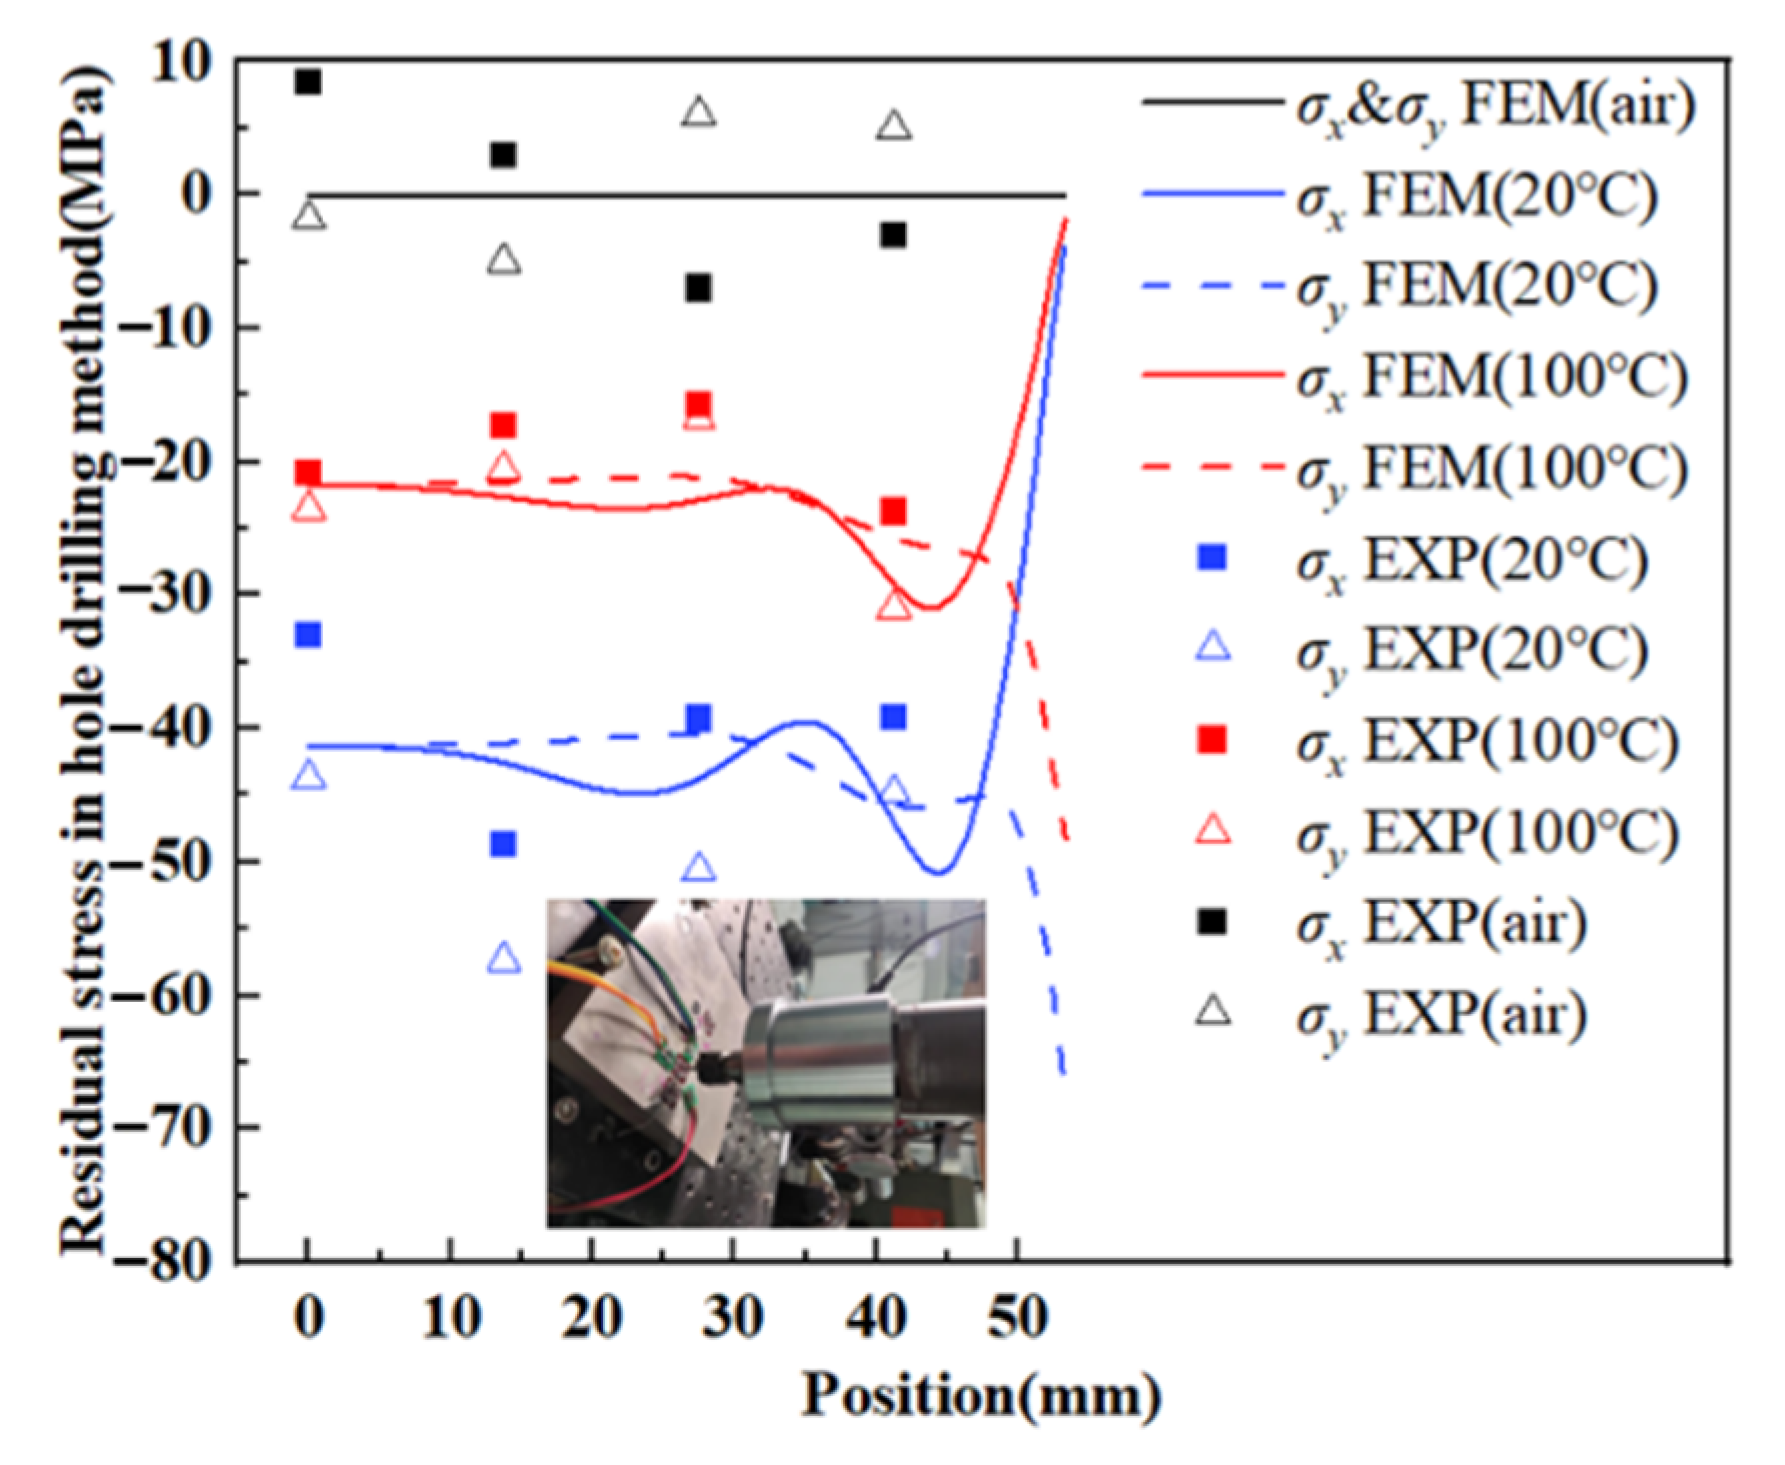
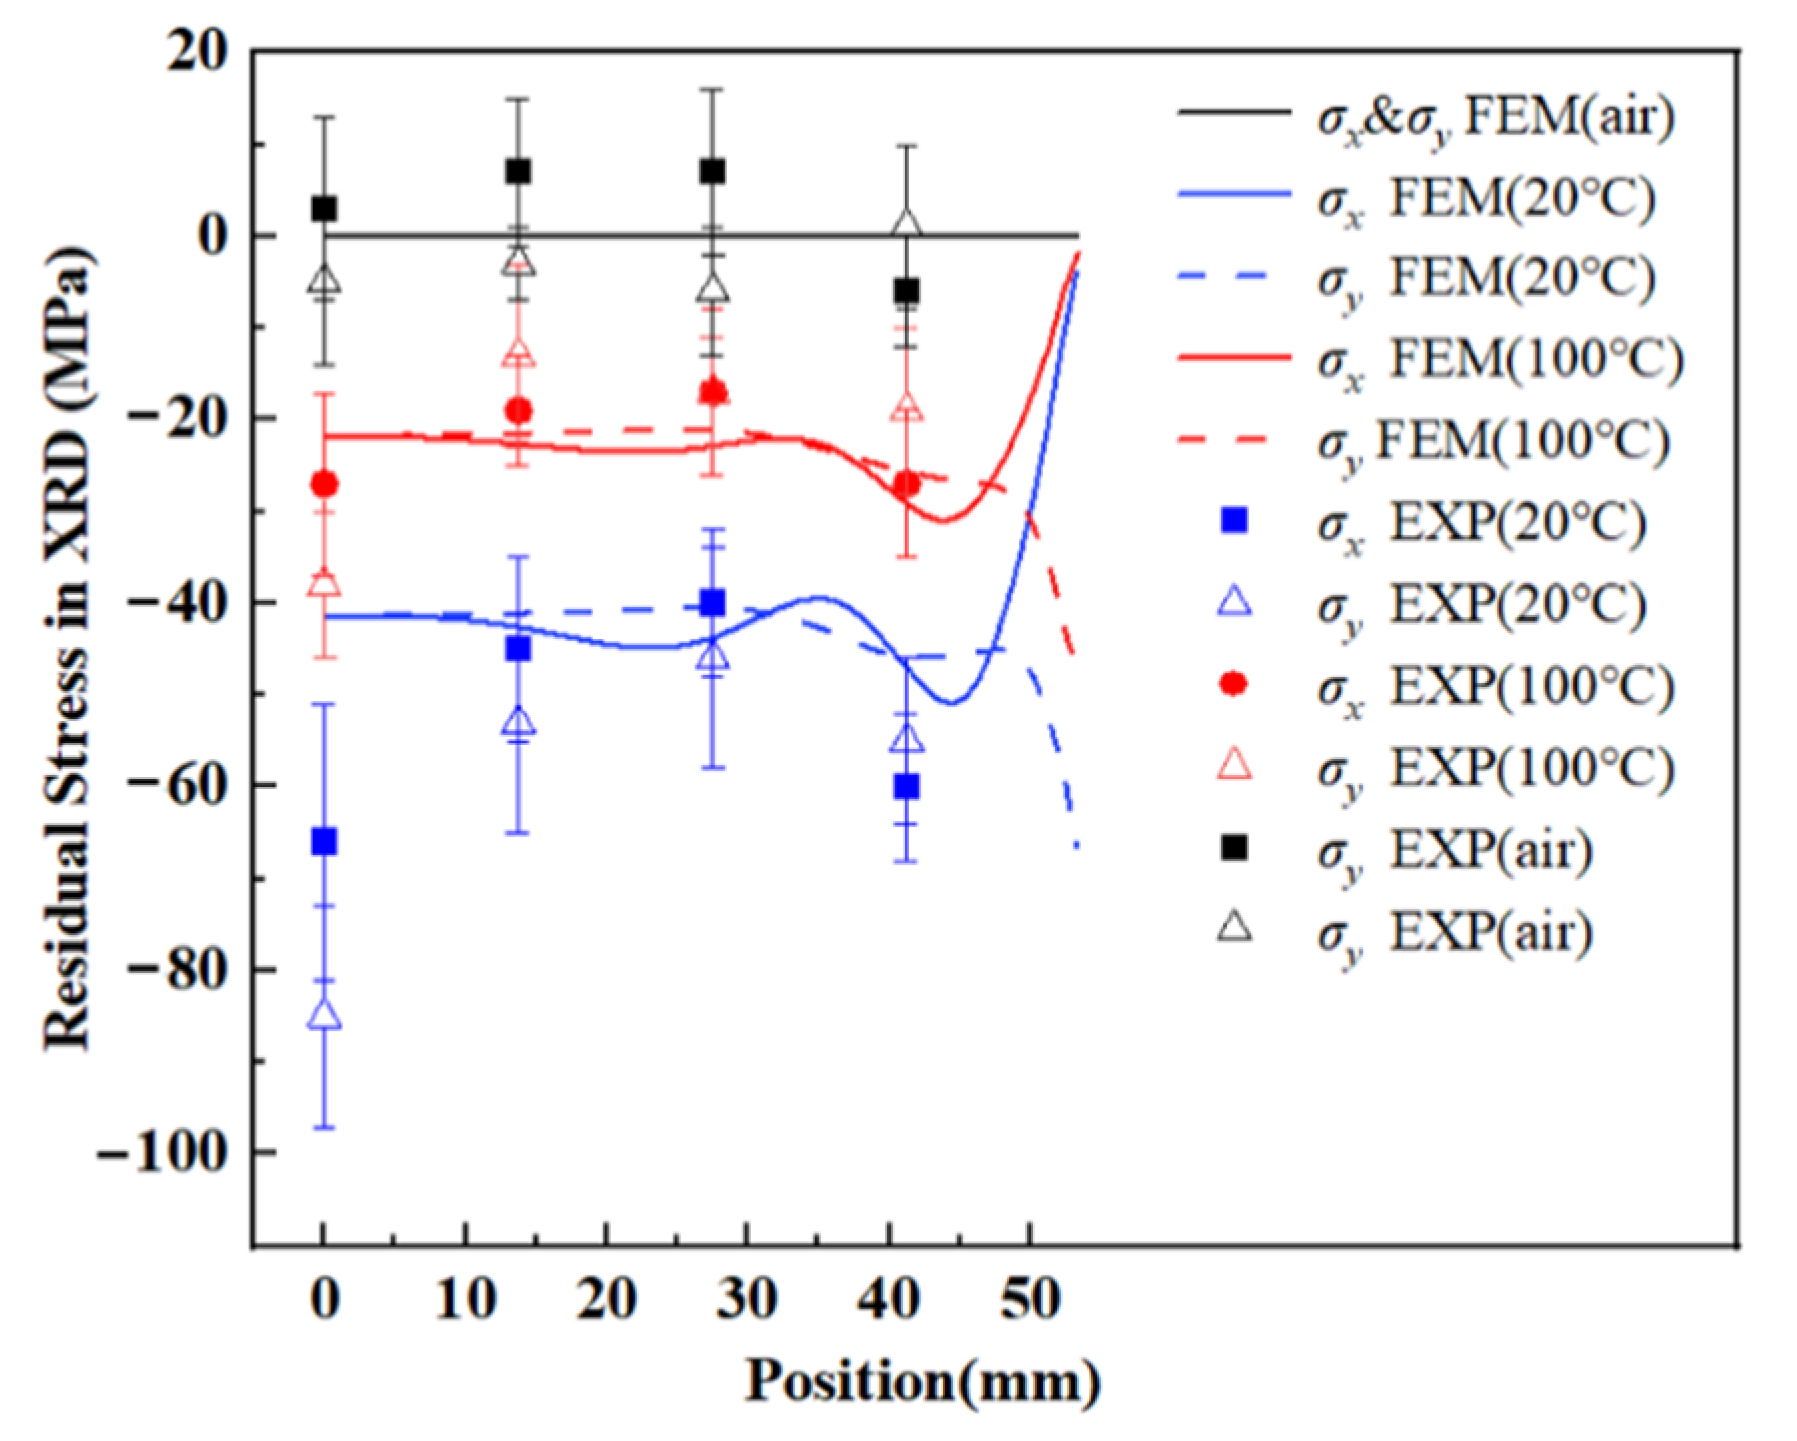
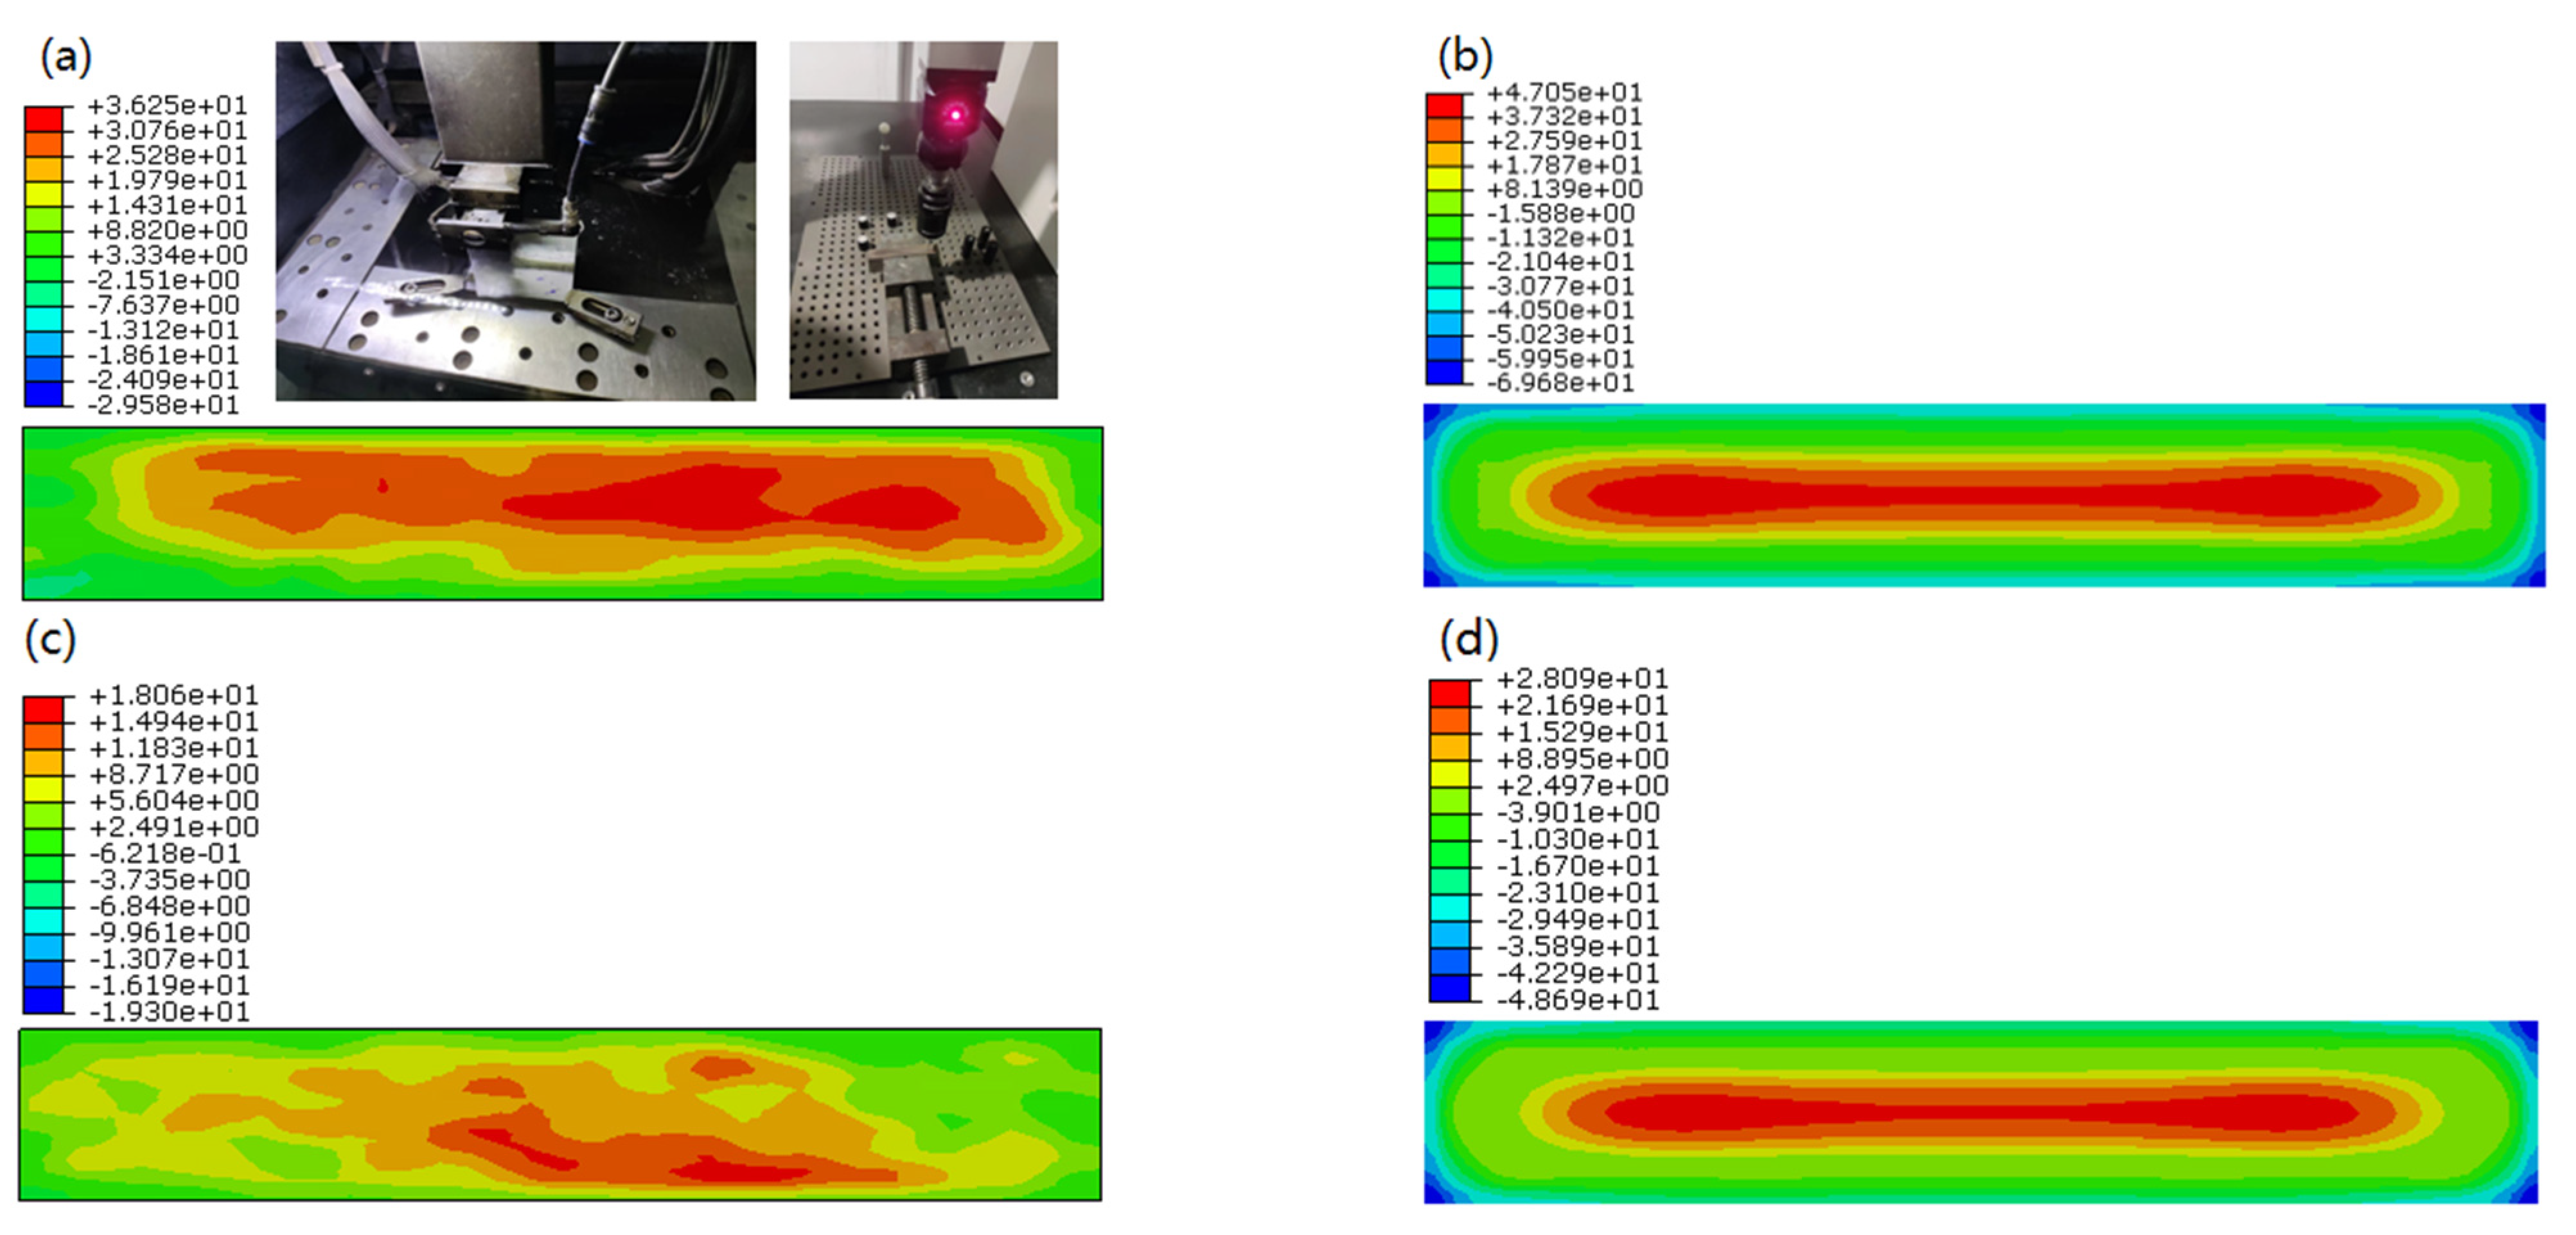
2.2. Residual Stress Measurement Methods
2.3. Microstructure Characterizations
3. Numerical Simulation
4. Results and Discussion
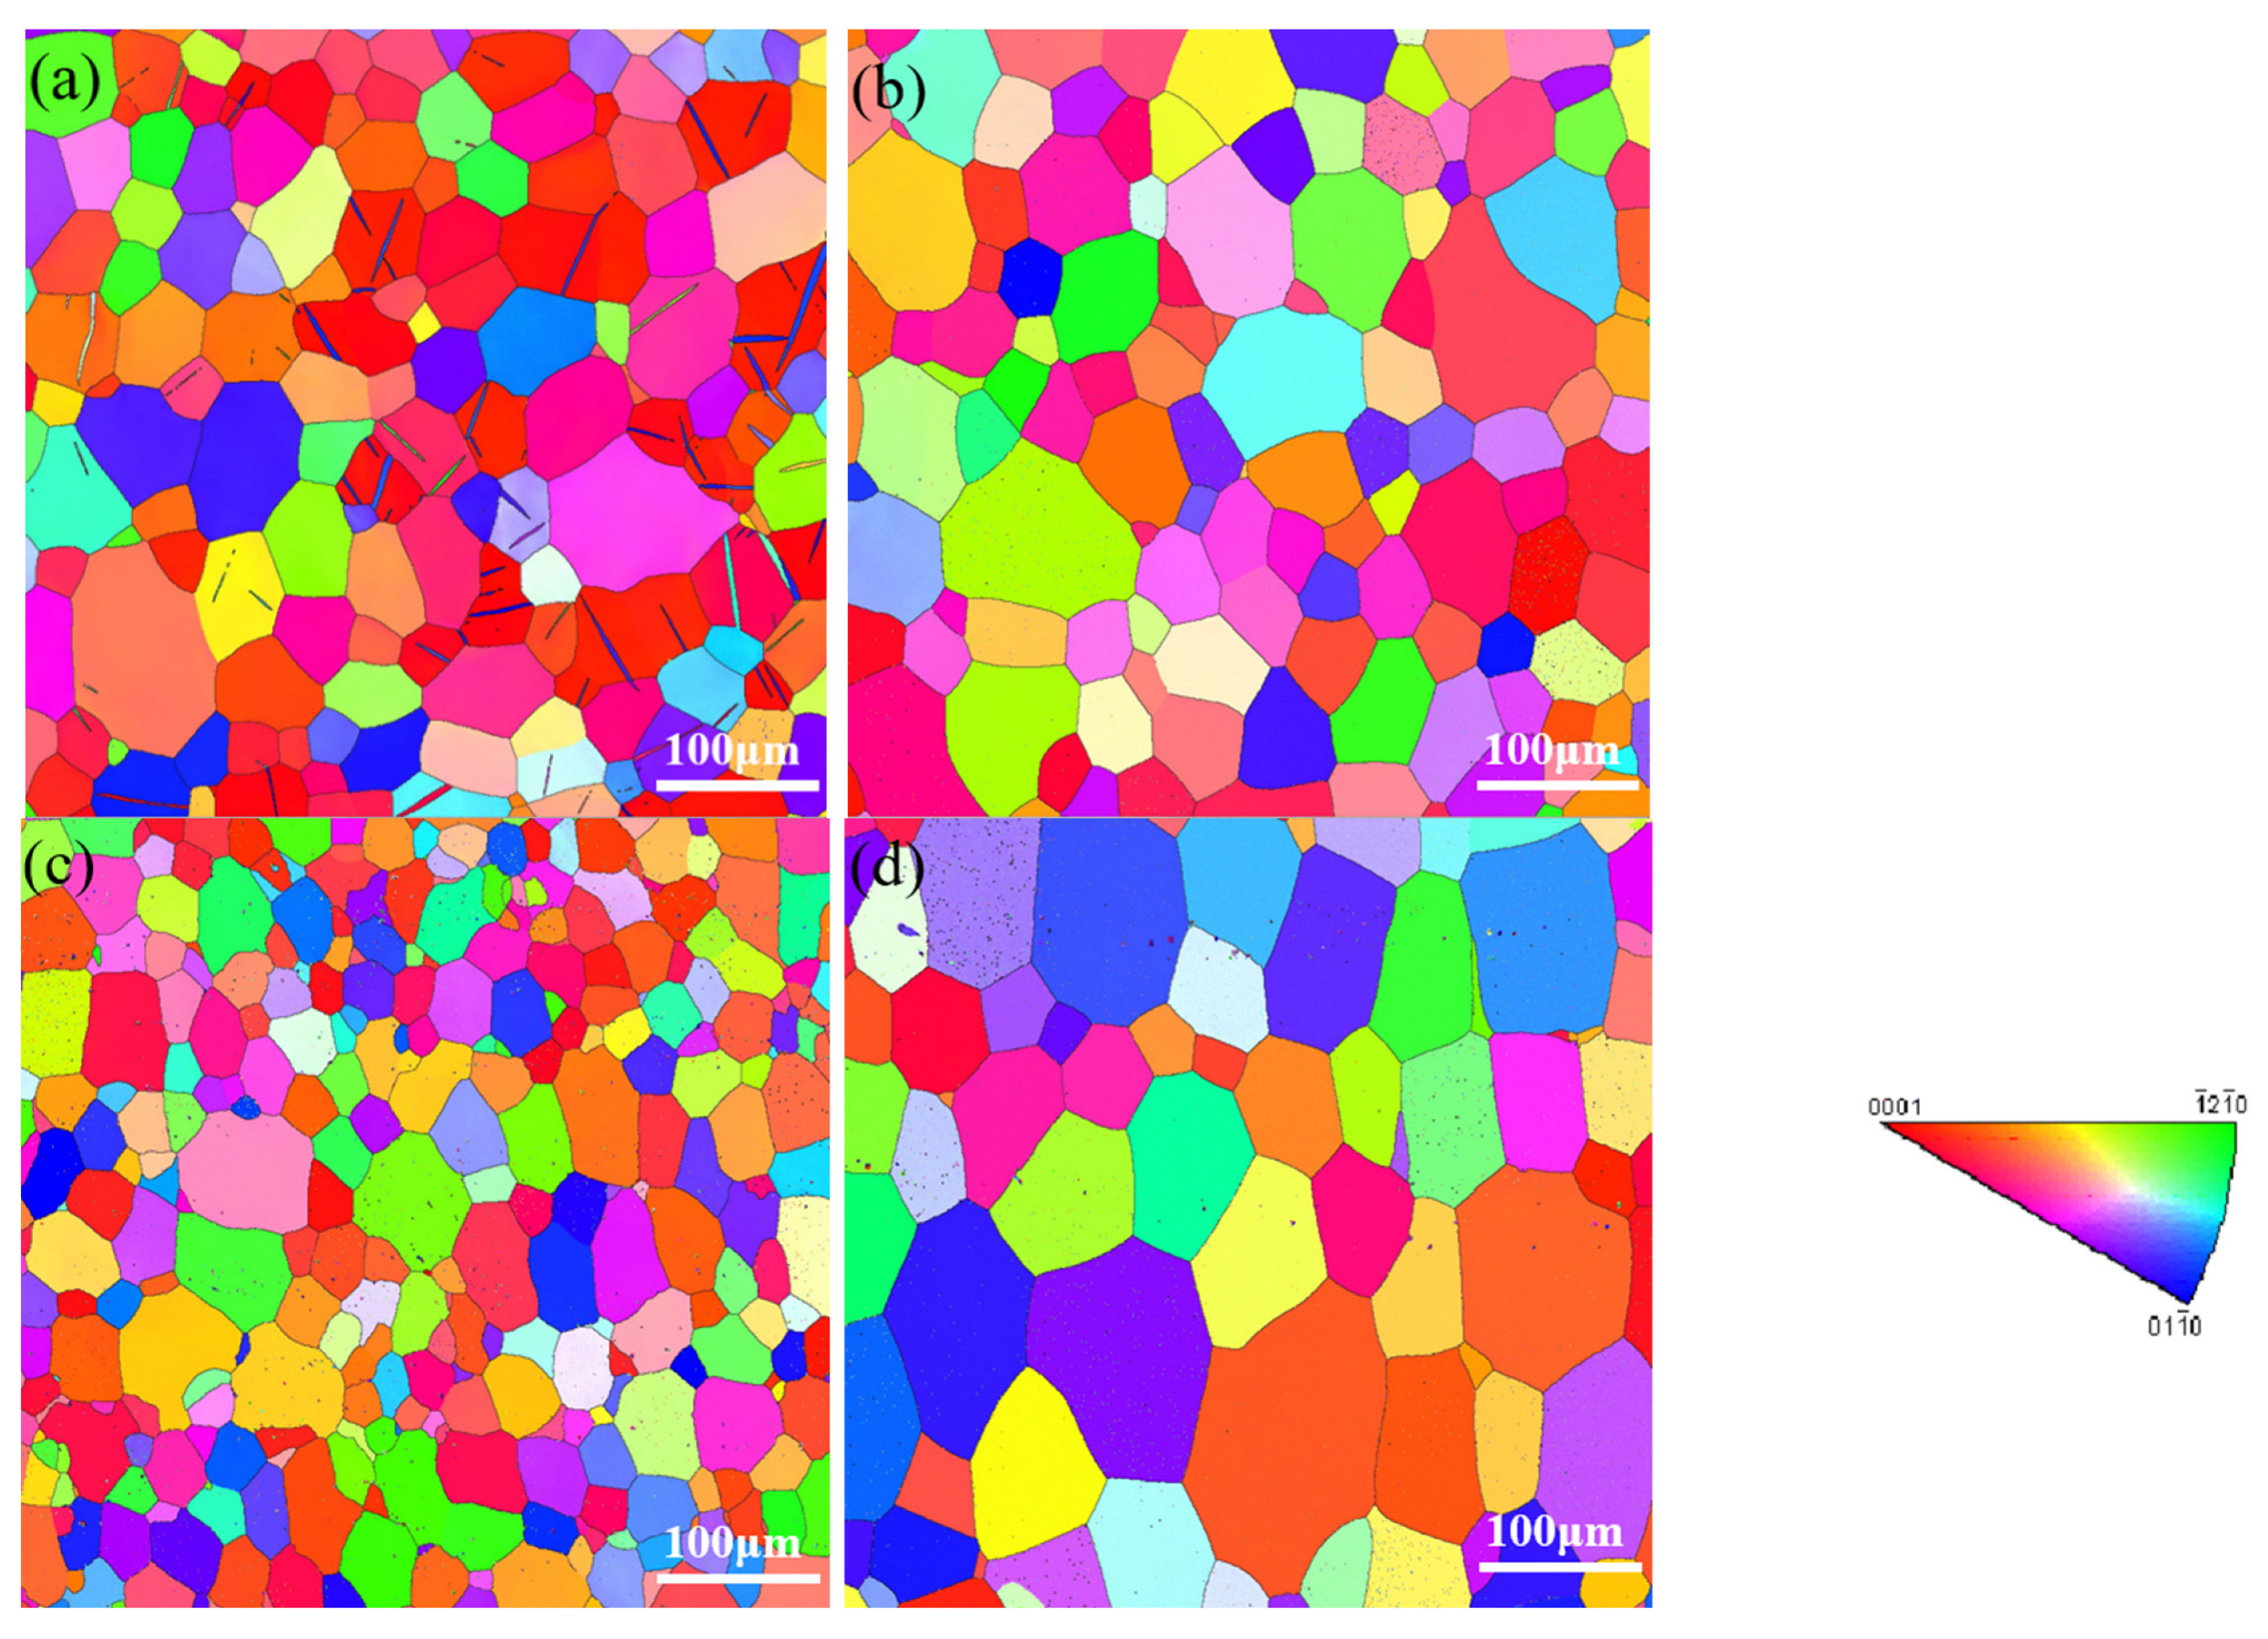
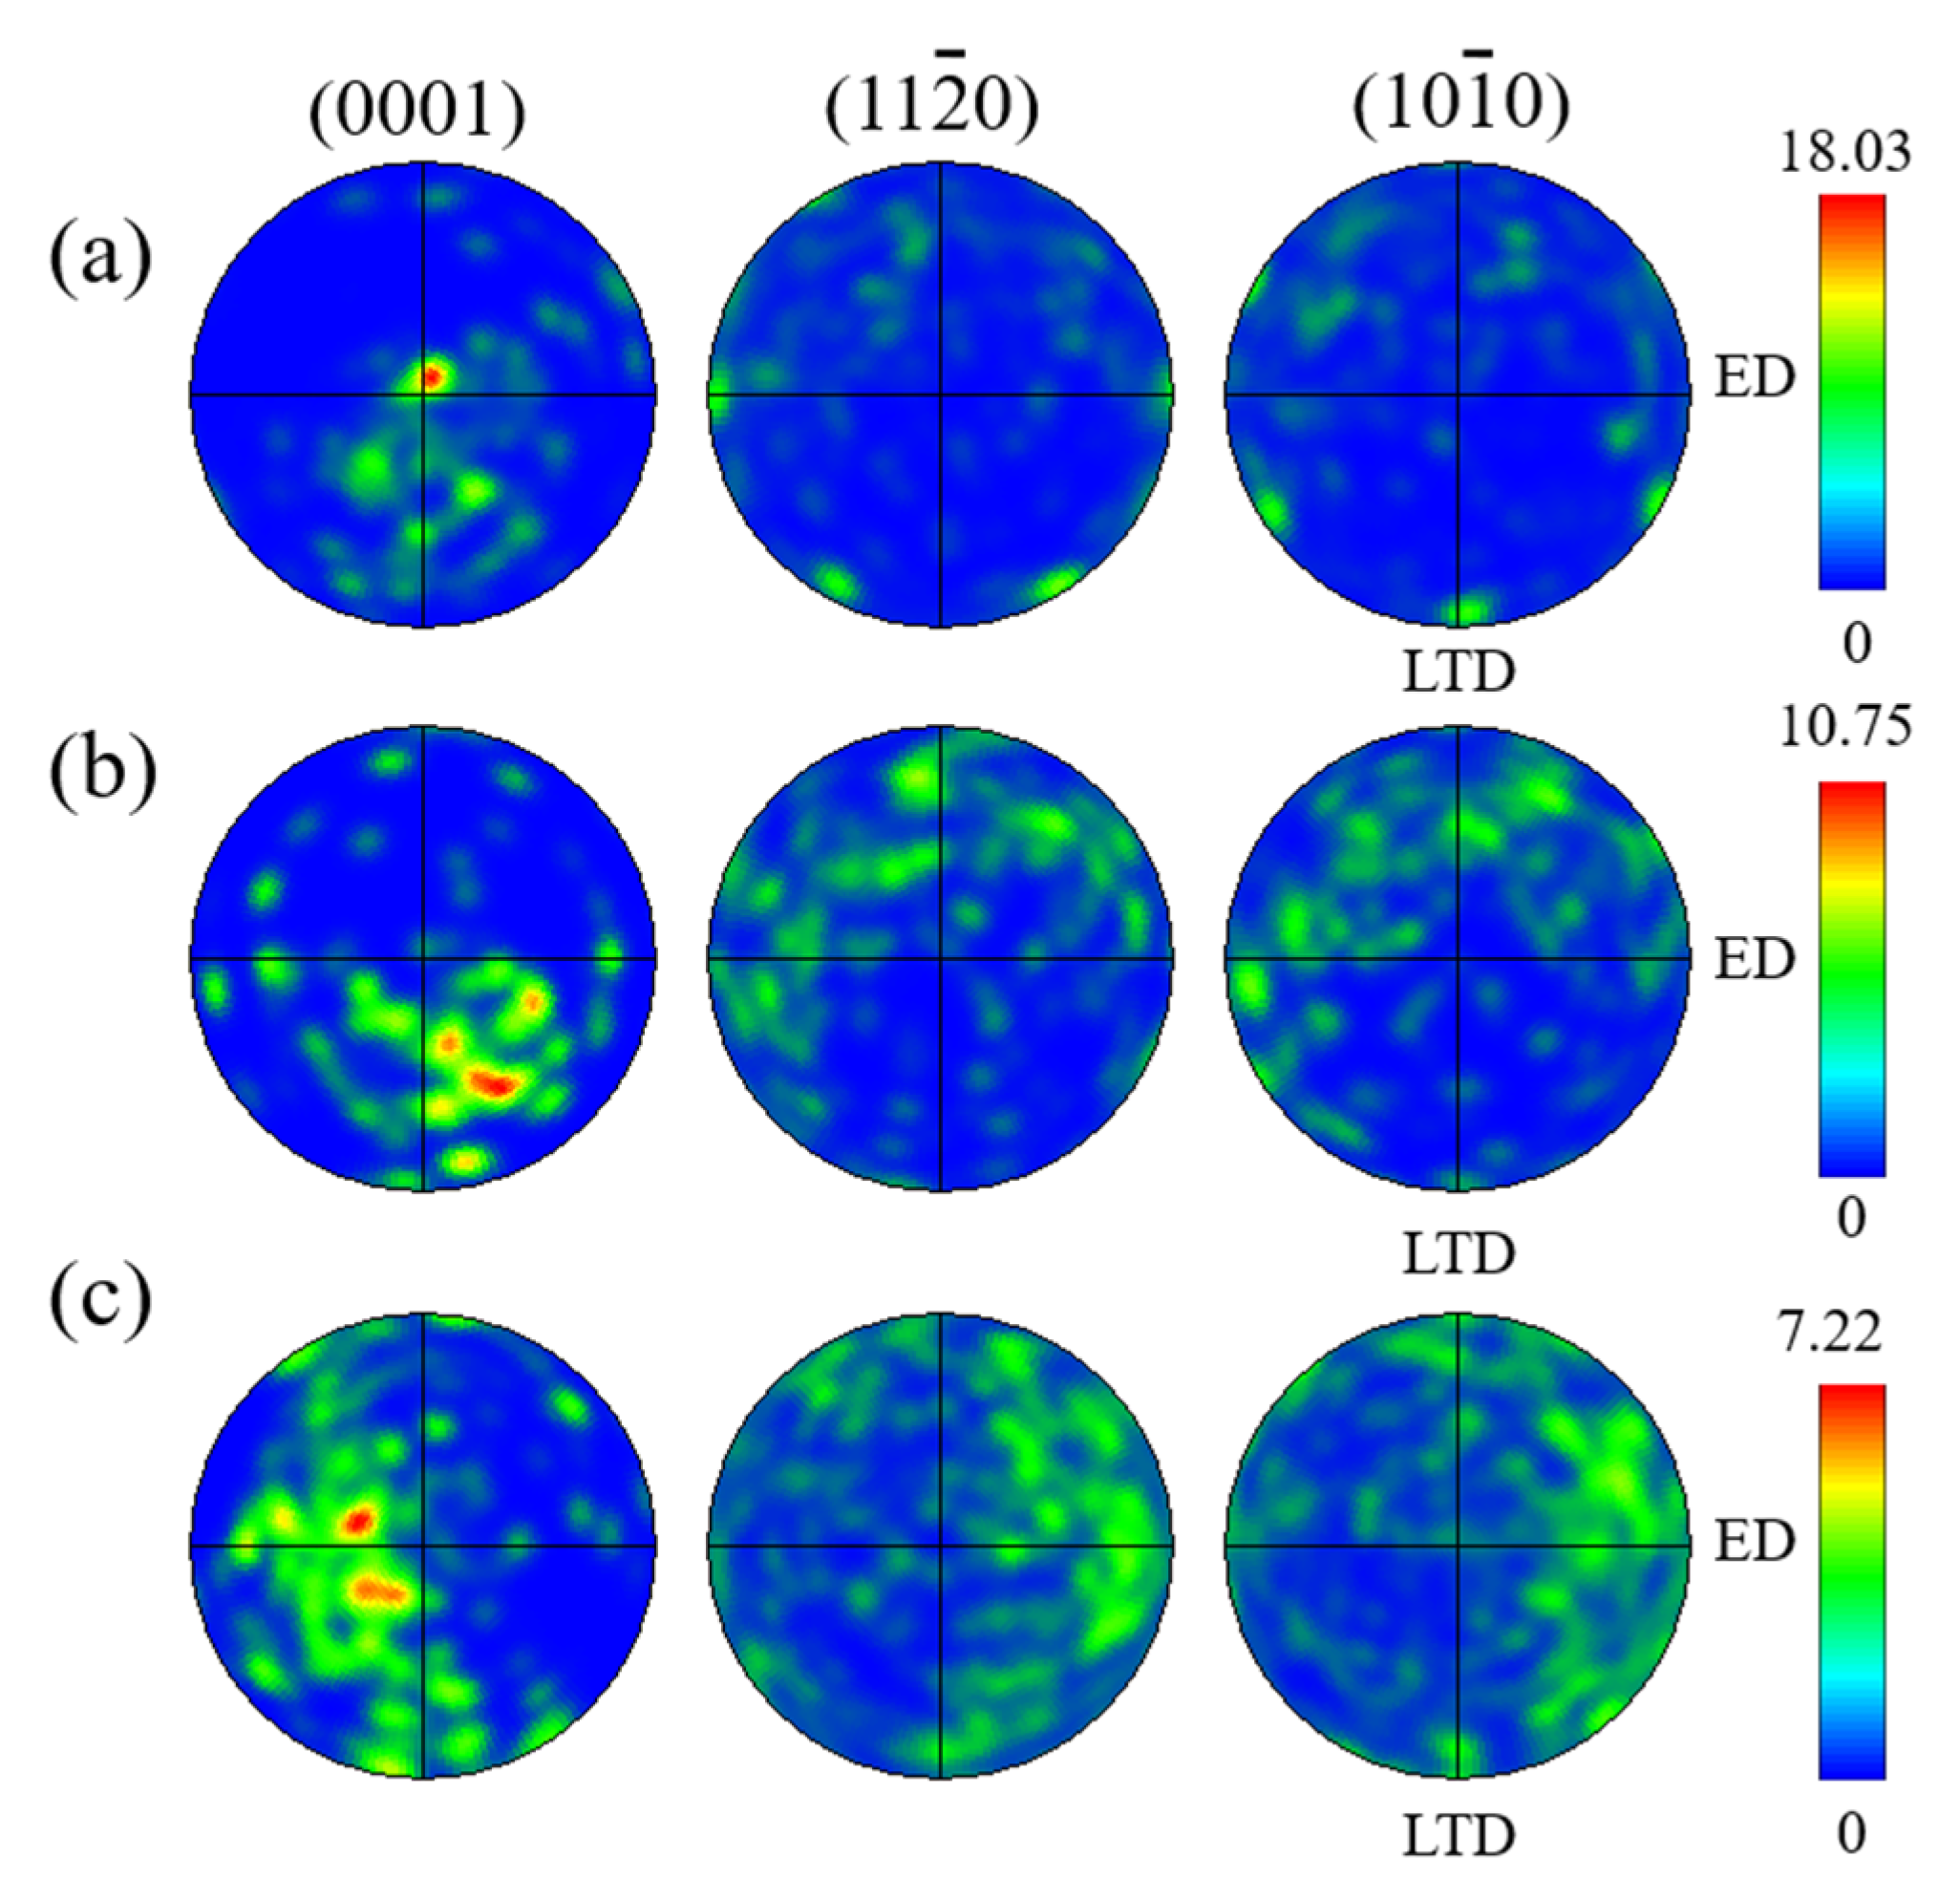
4.1. Microstructure
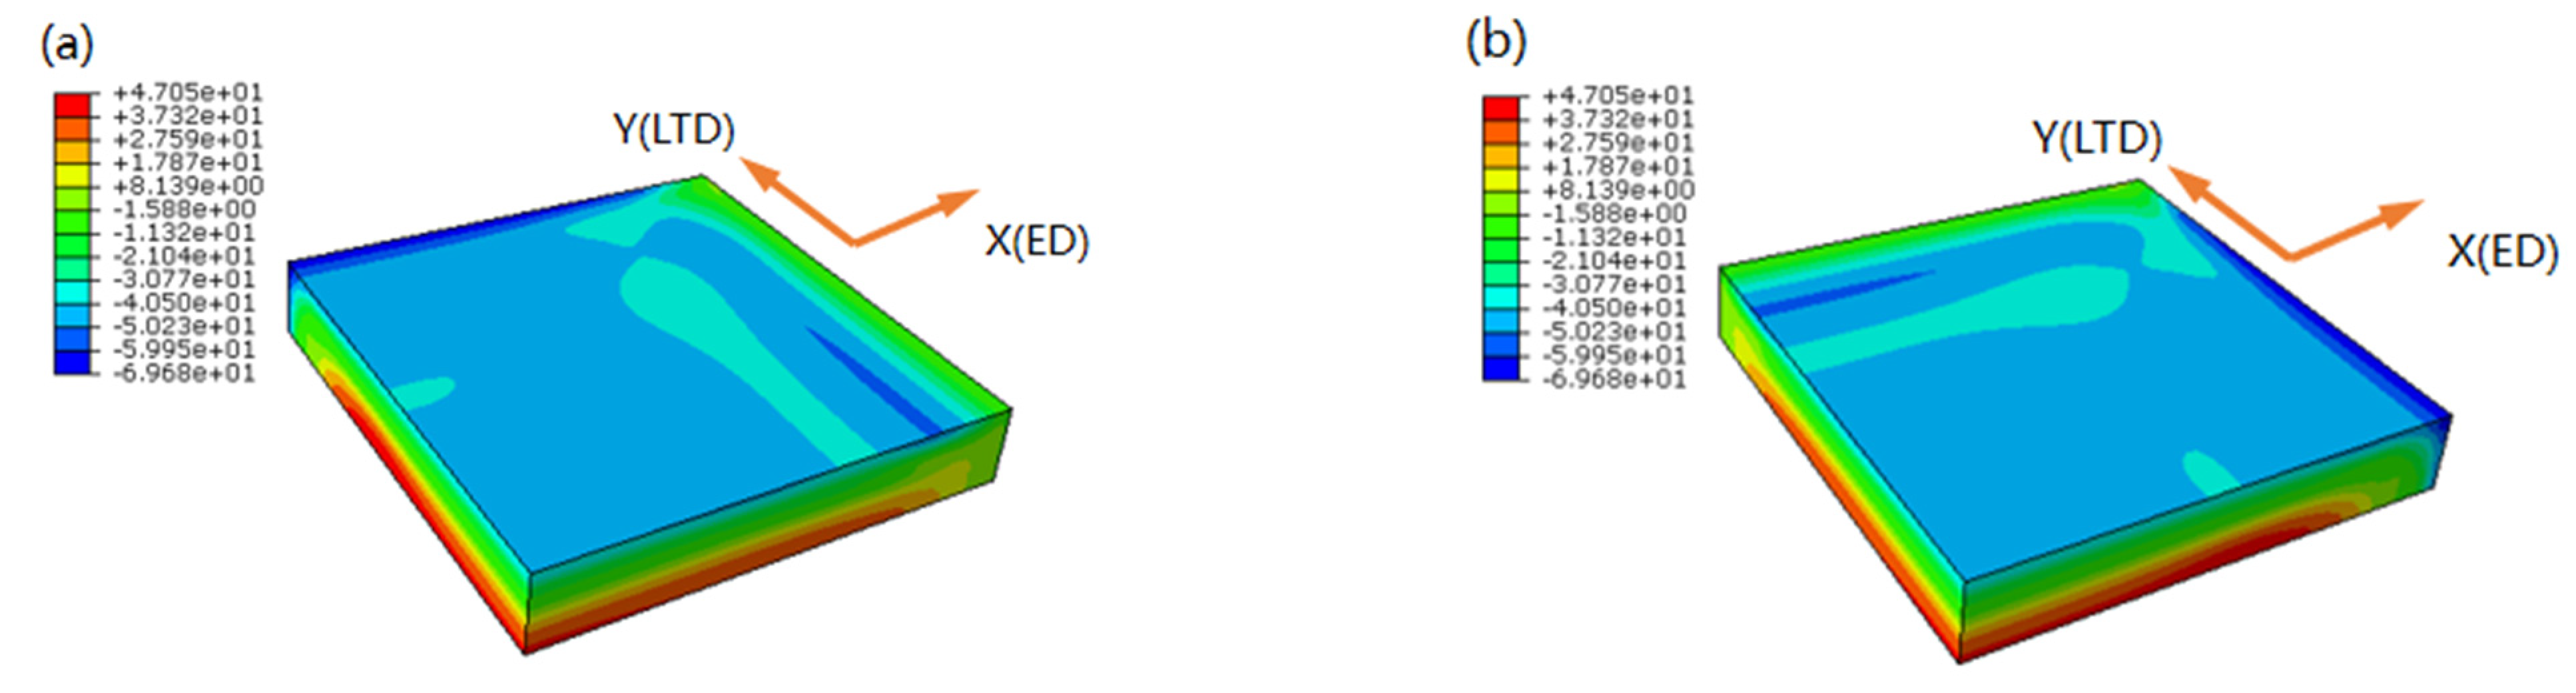
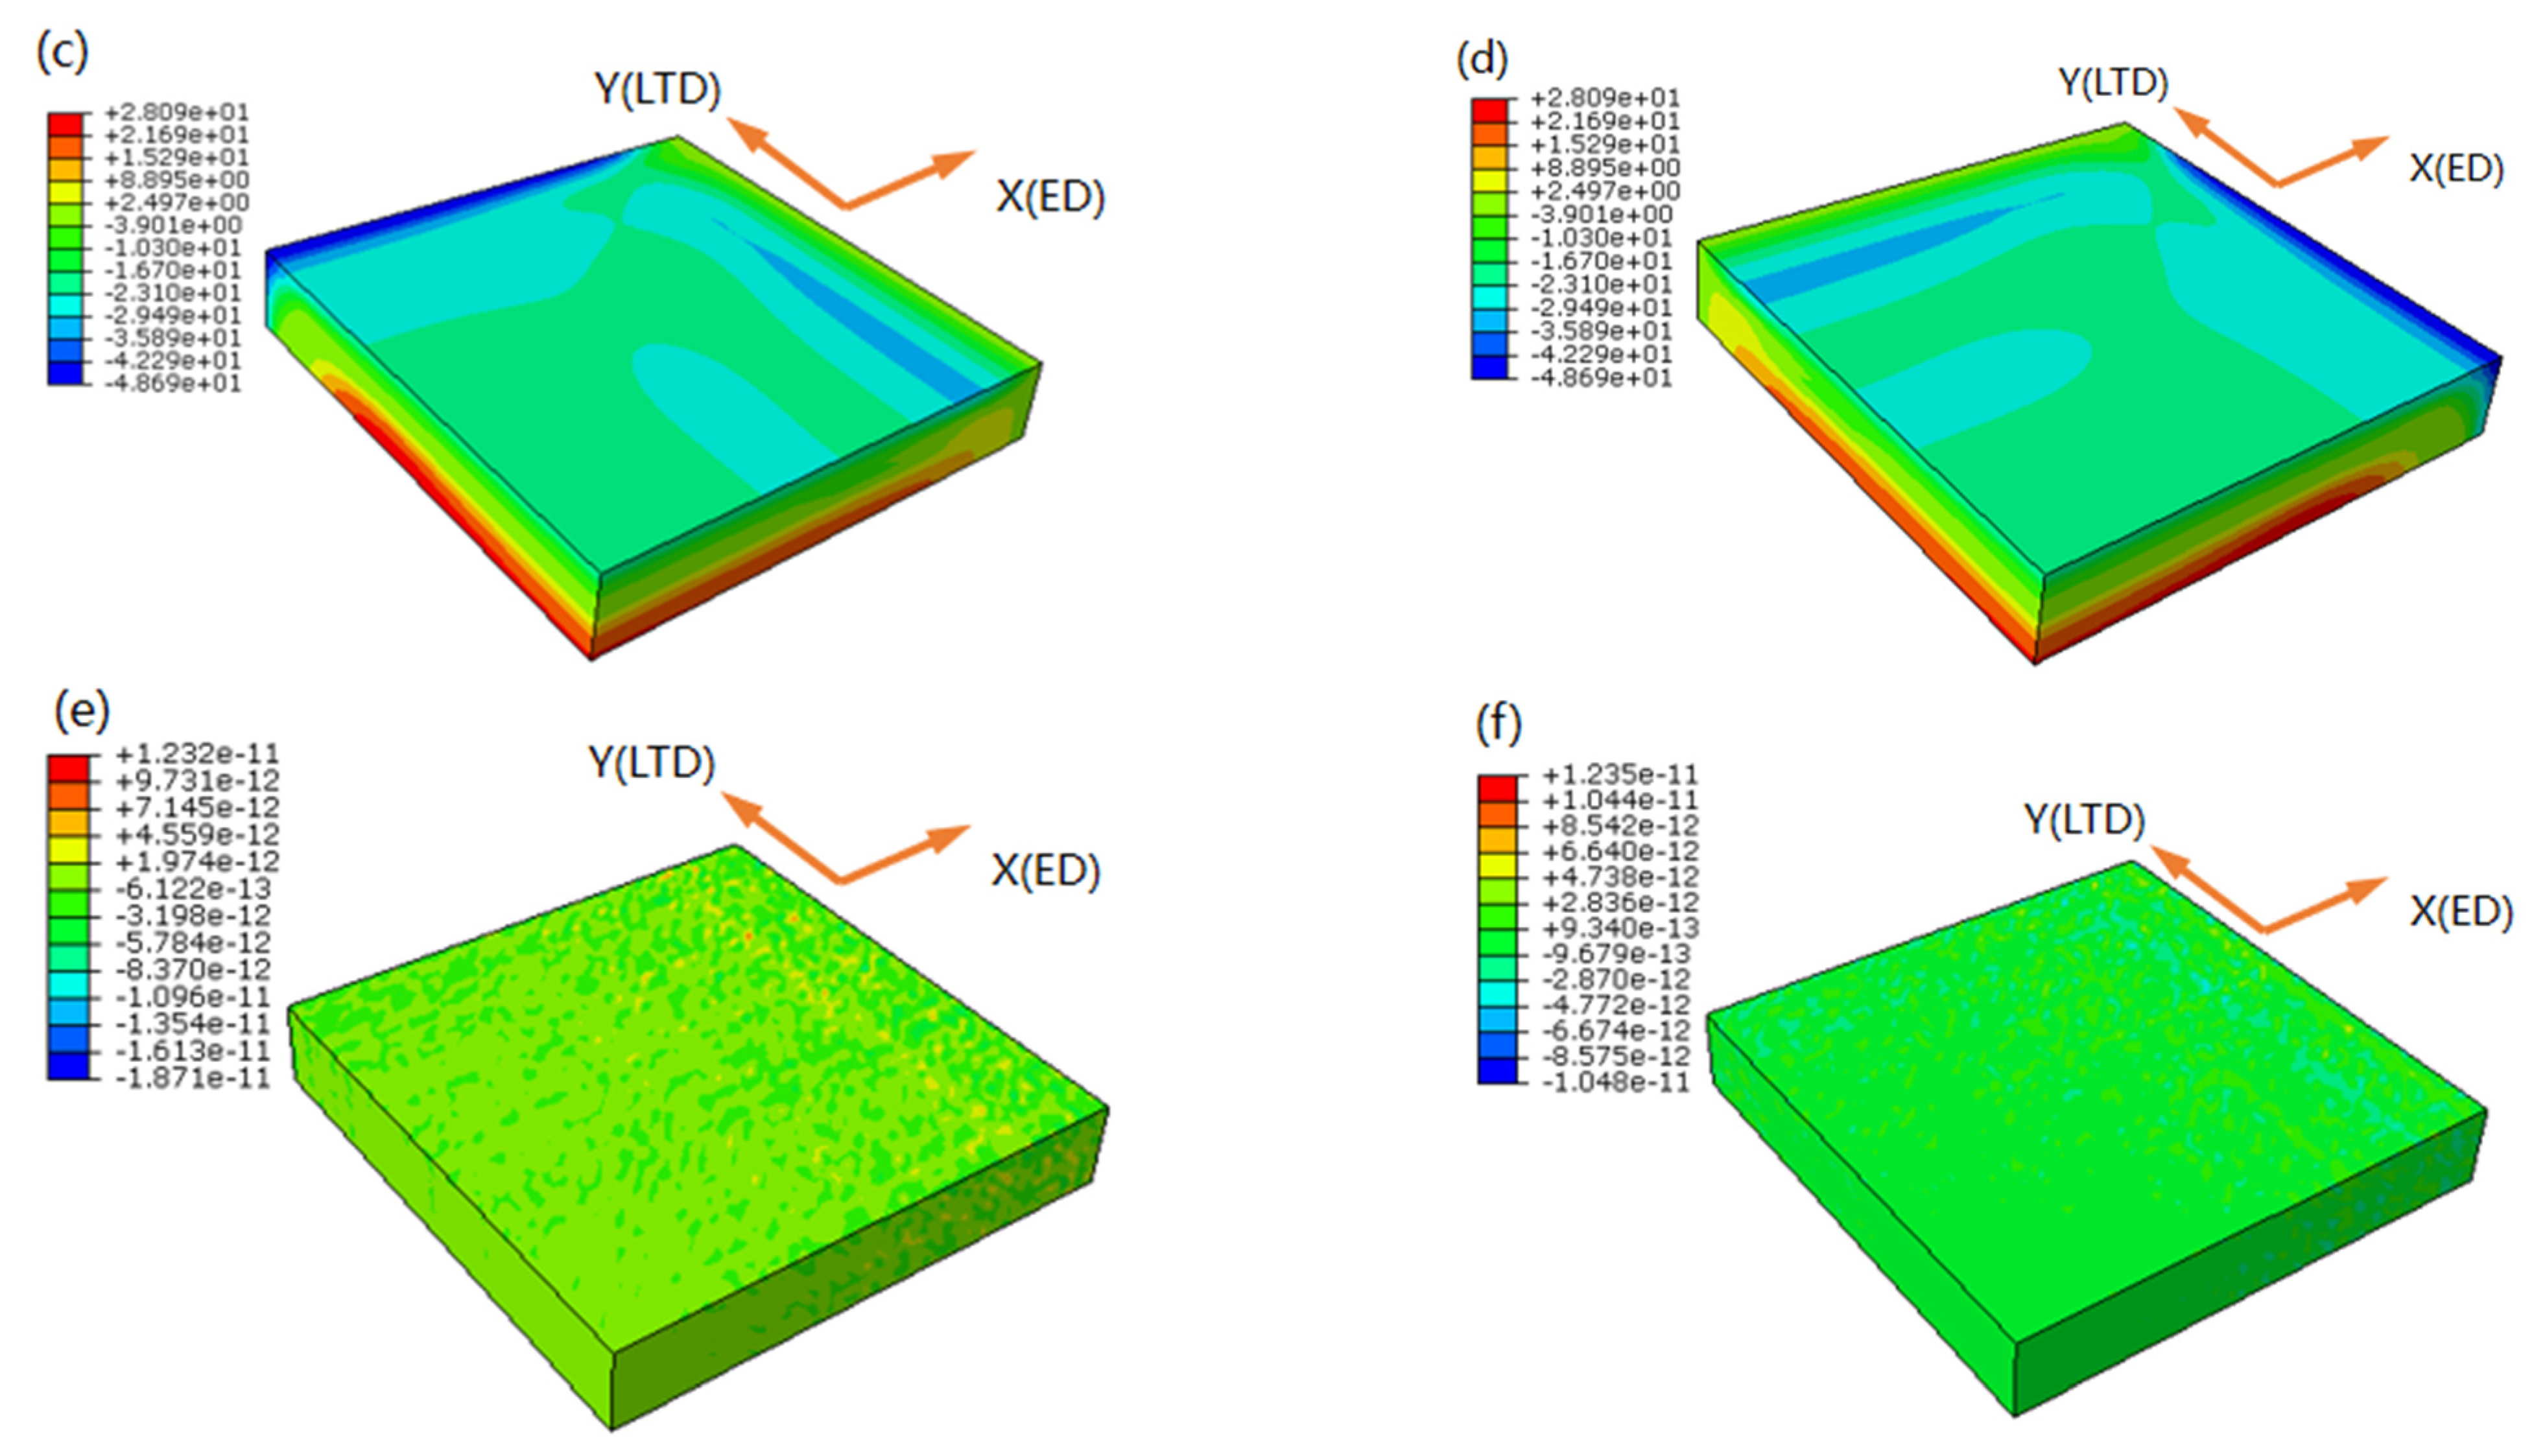
4.2. Residual Stress
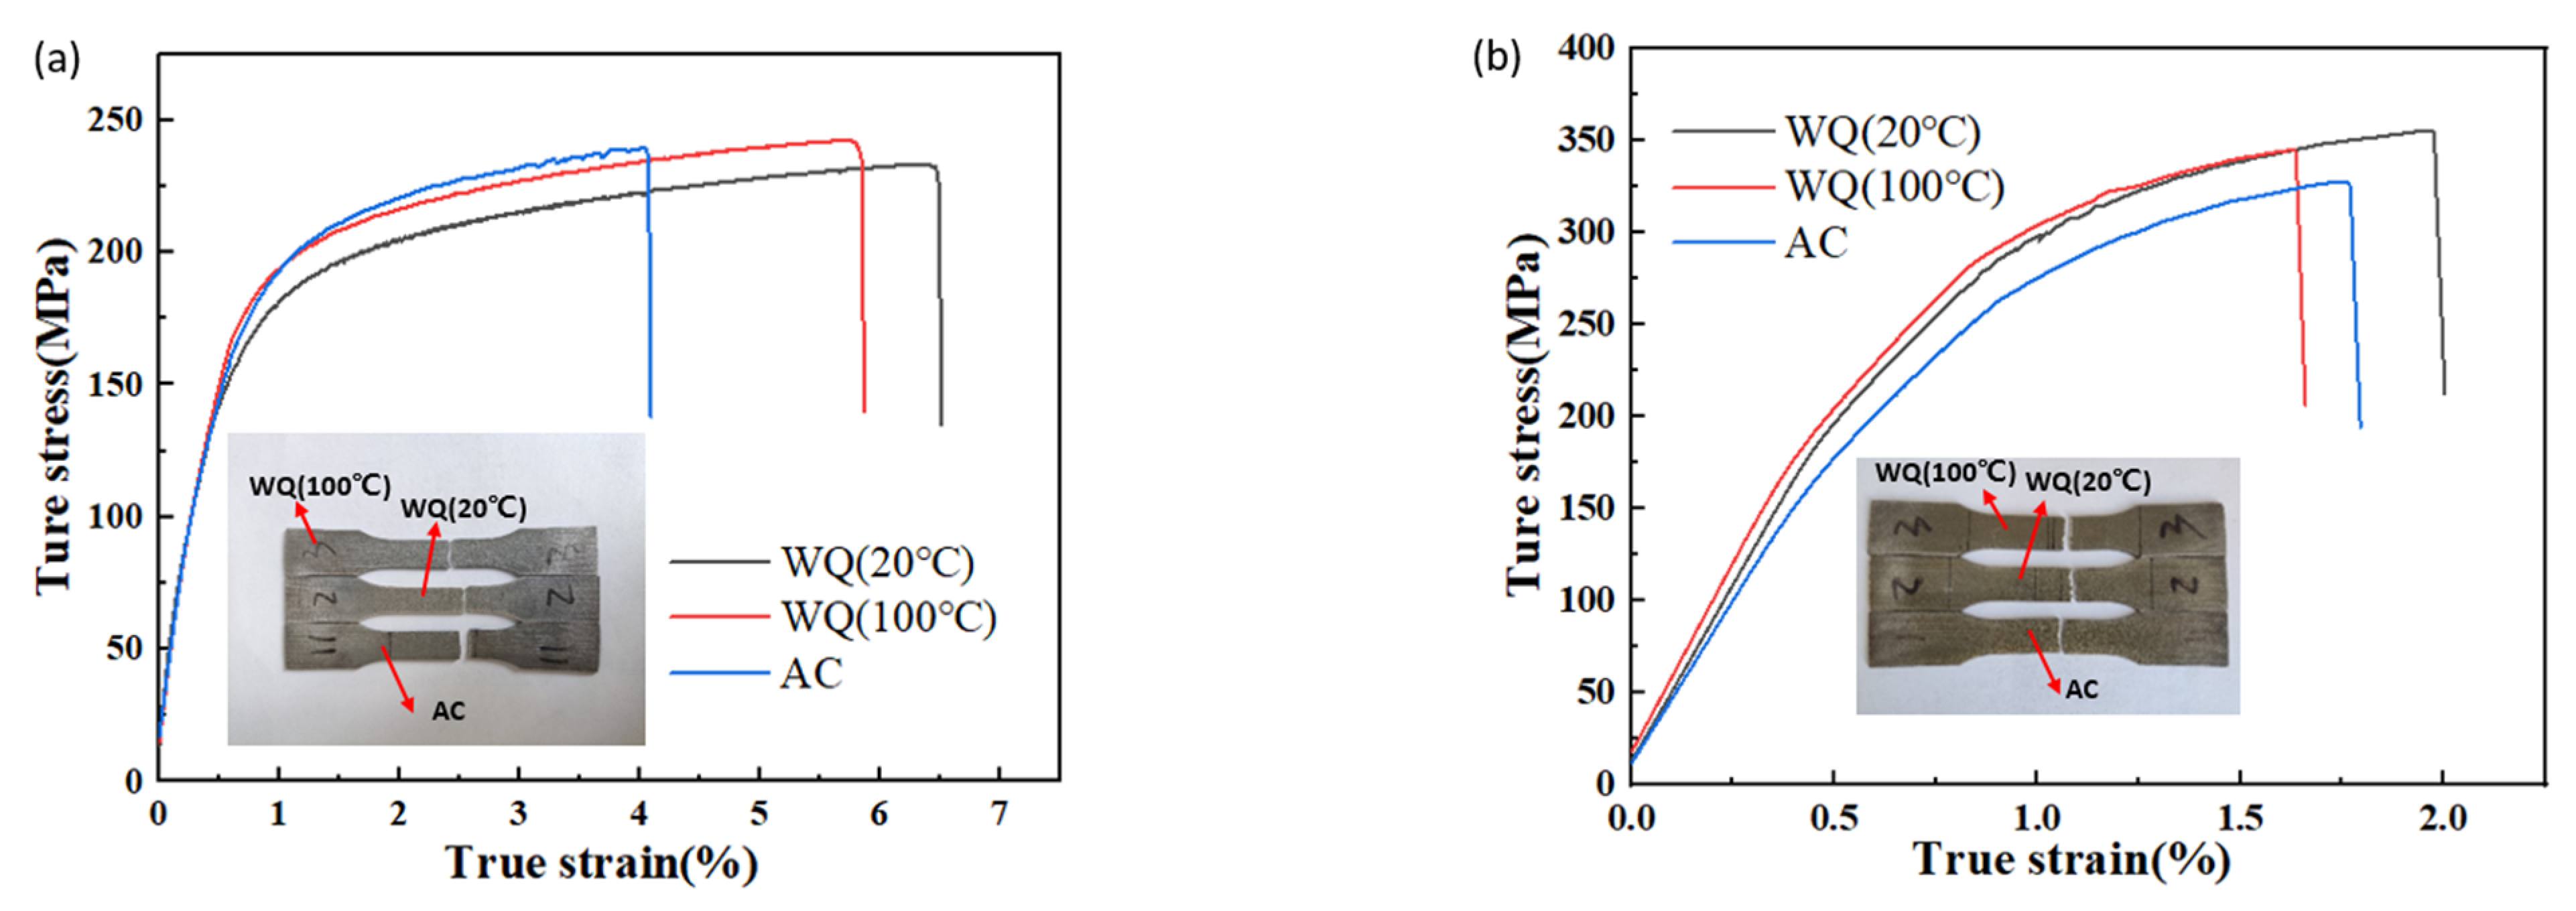
4.3. Mechanical Properties
5. Conclusions
- The decrease of quenching rate has little effect on the grain size, but makes the twinning disappear, precipitates increase and the texture weakened, leading to easier brittle fracture after aging;
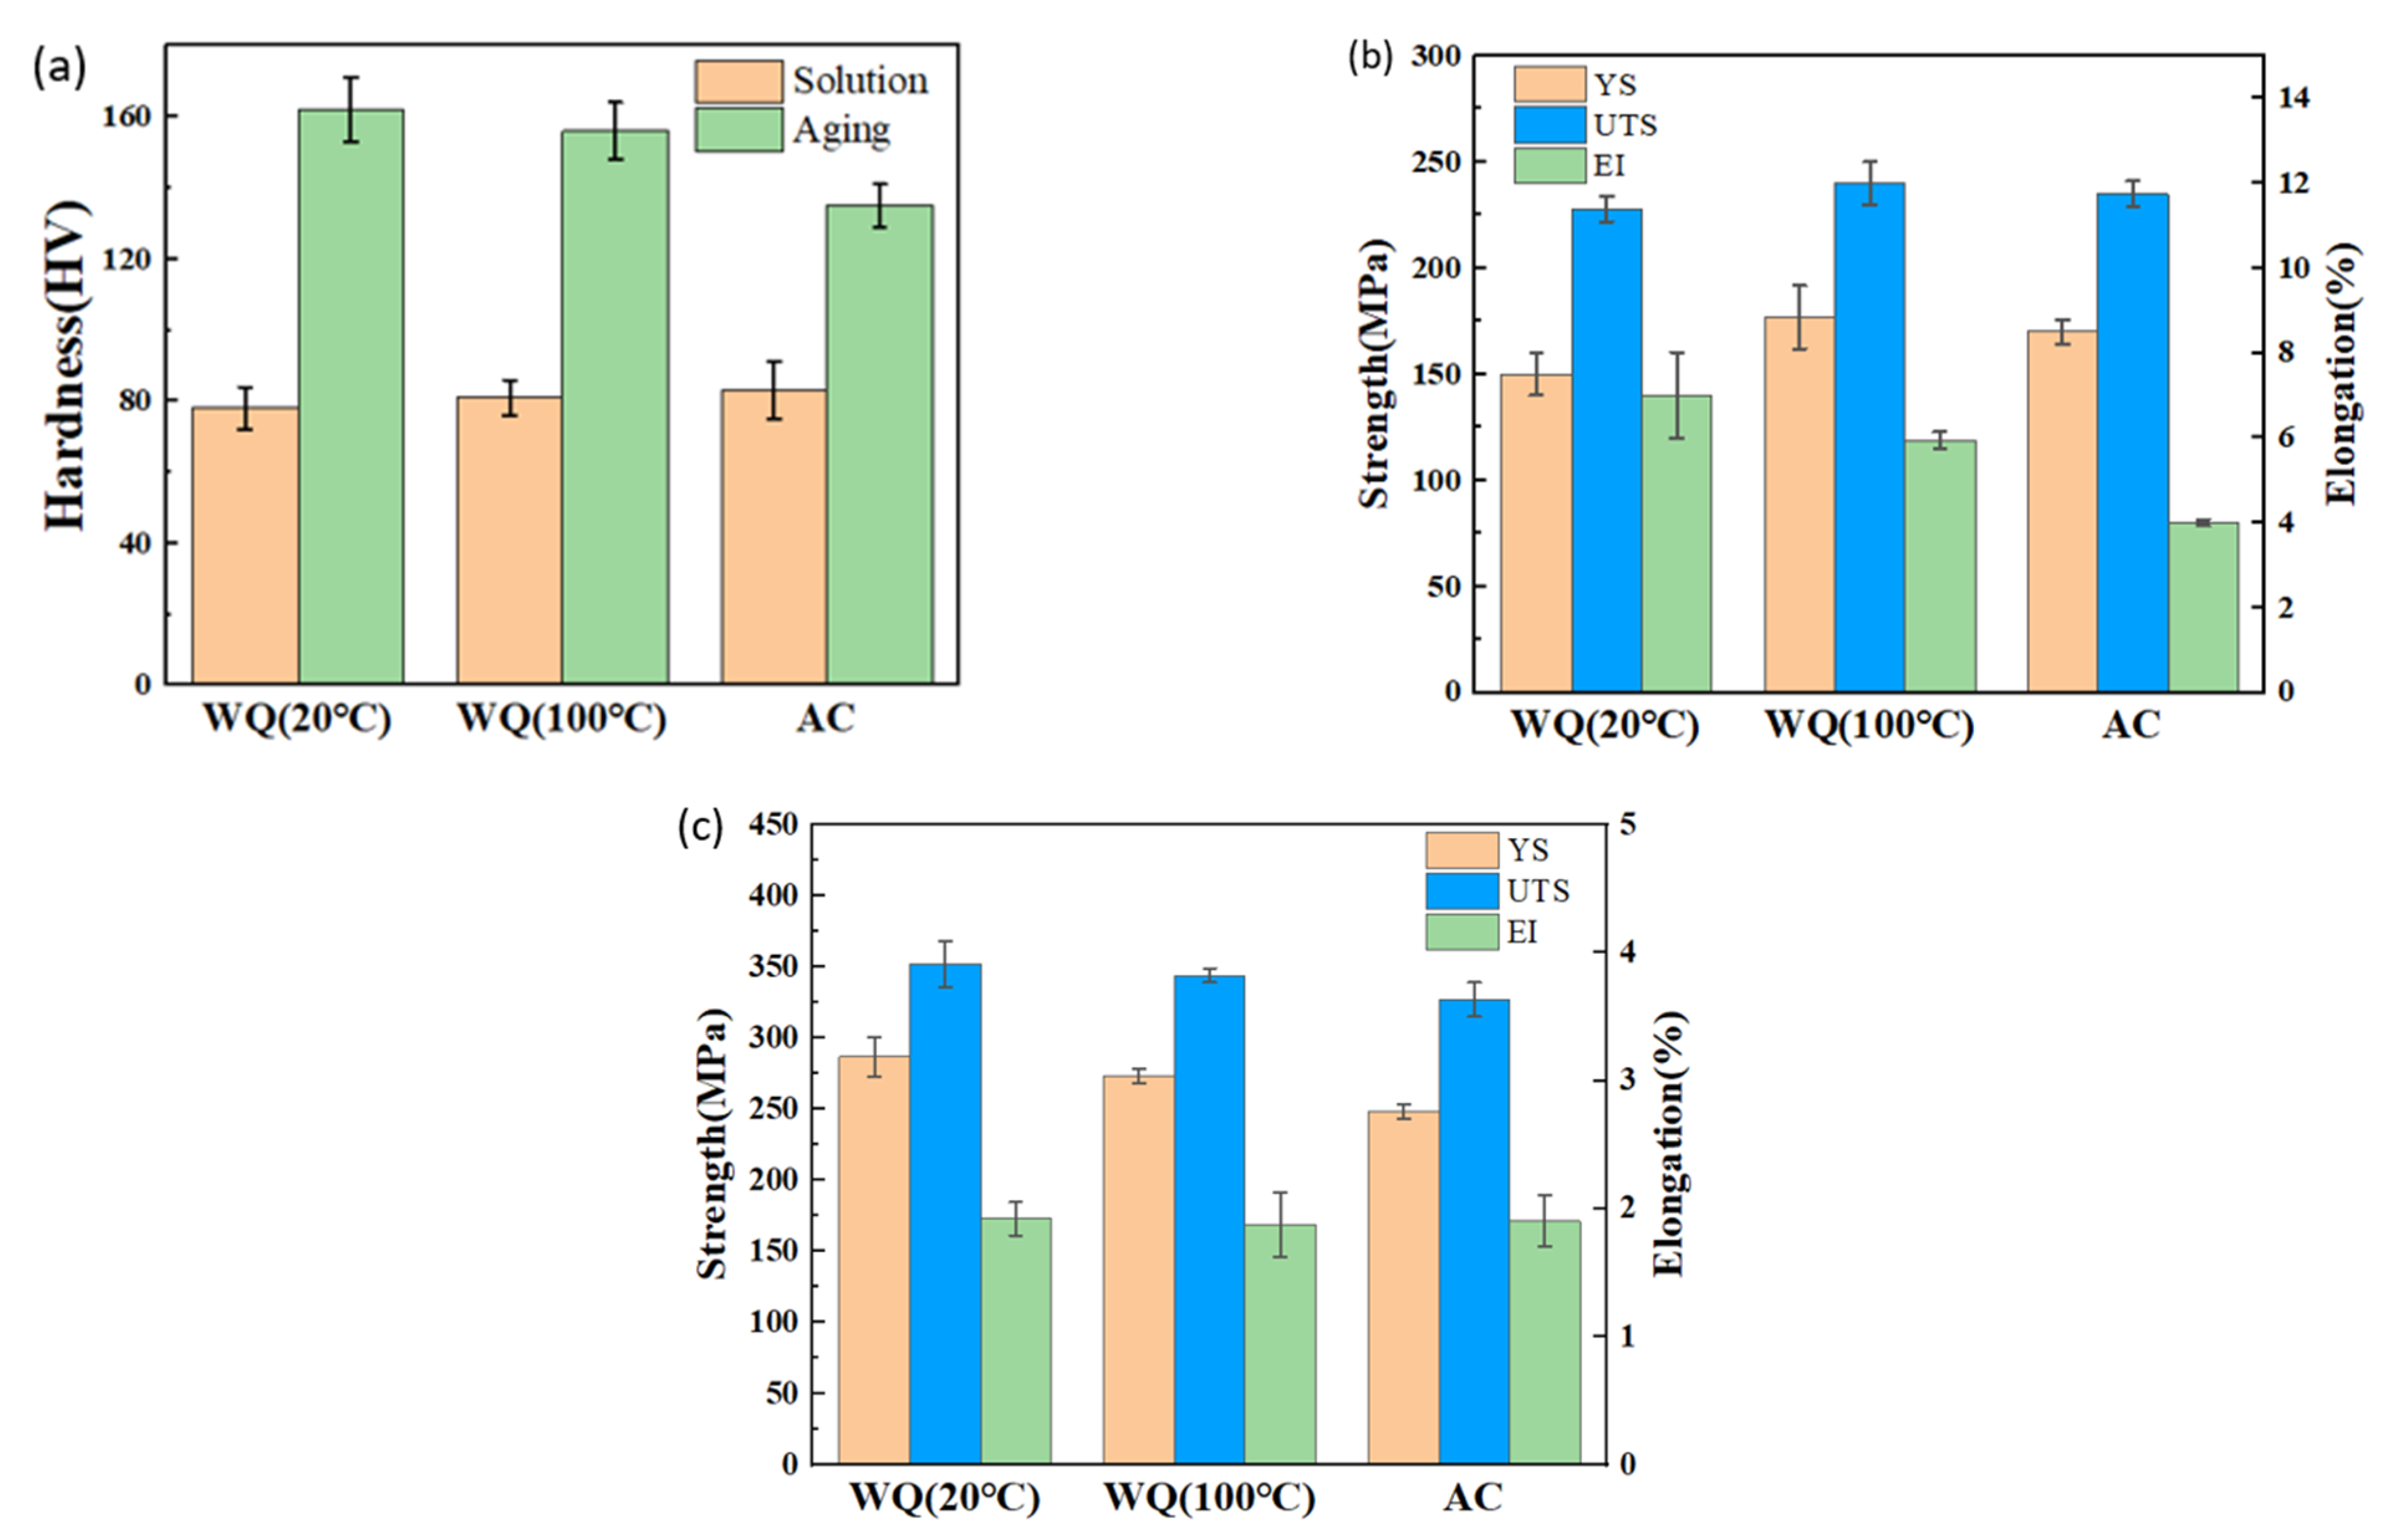
- WQ (100 °C) has the highest yield strength (YS) and ultimate tensile strength (UTS) in the quenching state. Cooling rates, RS and mechanical properties after aging could be listed in the following orders: WQ (20 °C) > WQ (100 °C) > AC;
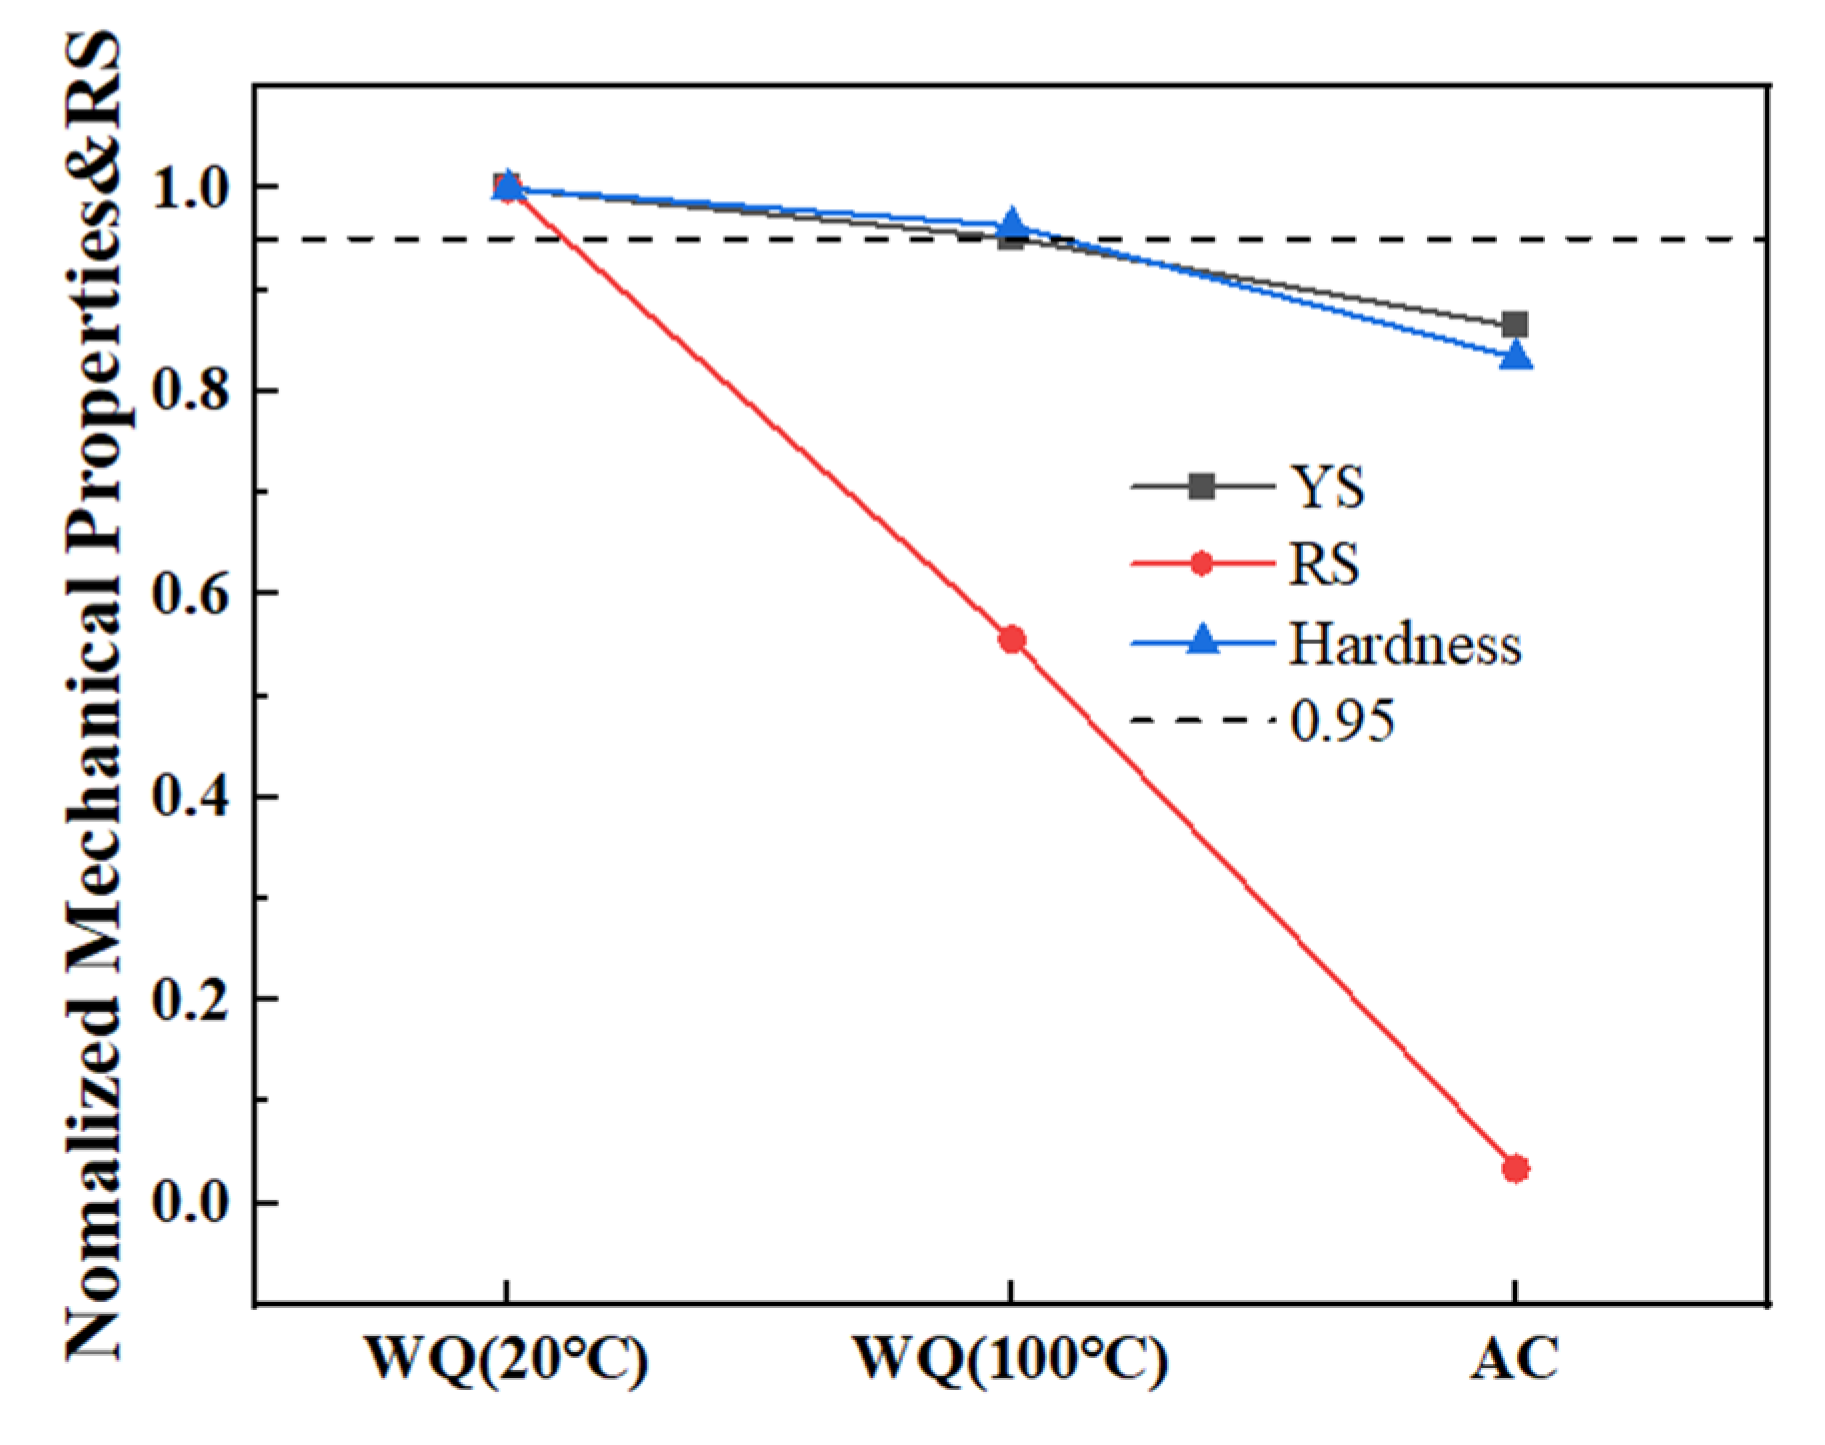
- The quenching RS declines greatly in WQ (100 °C) and close to zero in AC compared with WQ (20 °C) as cooling rates decrease, while YS and hardness only decrease by 4.9% and 3.7% in WQ (100 °C), 13.6% and 16.7% in AC after aging;
- WQ (100 °C) is the best quenching condition following solution treatment in this study, and it is feasible to greatly reduce RS while maintaining mechanical properties. The results would be beneficial to the application of the alloy.
Author Contributions
Funding
Institutional Review Board Statement
Informed Consent Statement
Data Availability Statement
Conflicts of Interest
References
- Wang, J.S.; Hsieh, C.C.; Lai, H.H.; Kuo, C.W.; Wu, P.T.Y.; Wu, W. The relationships between residual stress relaxation and texture development in AZ31 Mg alloys via the vibratory stress relief technique. Mater. Charact. 2015, 99, 248–253. [Google Scholar] [CrossRef]
- Zengin, H.; Turen, Y.; Turan, M.E.; Aydın, F. Evolution of Microstructure, Residual Stress, and Tensile Properties of Mg–Zn–Y–La–Zr Magnesium Alloy Processed by Extrusion. Acta Met. Sin. (Engl. Lett.) 2019, 32, 1309–1319. [Google Scholar] [CrossRef]
- Nie, J.F. Precipitation and Hardening in Magnesium Alloys. Met. Mater Trans. A 2012, 43, 3891–3939. [Google Scholar] [CrossRef]
- Sheikhani, A.; Roumina, R.; Mahmudi, R. Hot deformation behavior of an extruded AZ31 alloy doped with rare-earth elements. J. Alloys Compd. 2021, 852, 156961. [Google Scholar] [CrossRef]
- Imandoust, A.; Barrett, C.D.; Oppedal, A.L.; Whittington, W.R.; Paudel, Y.; El Kadiri, H. Nucleation and preferential growth mechanism of recrystallization texture in high purity binary magnesium-rare earth alloys. Acta Mater. 2017, 138, 27–41. [Google Scholar] [CrossRef]
- Zhang, F.; Liu, Z.; Wang, Y.; Mao, P.; Kuang, X.; Zhang, Z.; Ju, Y.; Xu, X. The modified temperature term on Johnson-Cook constitutive model of AZ31 magnesium alloy with 0002 texture. J. Magnes. Alloy. 2020, 8, 172–183. [Google Scholar] [CrossRef]
- Liu, W.C.; Zhou, B.P.; Wu, G.; Zhang, L.; Peng, X.; Cao, L. High temperature mechanical behavior of low-pressure sand-cast Mg–Gd–Y–Zr magnesium alloy. J. Magnes. Alloy. 2019, 7, 597–604. [Google Scholar] [CrossRef]
- Zhang, Y.X.; Yi, Y.P.; Huang, S.Q.; He, H.L. Influence of Temperature-Dependent Properties of Aluminum Alloy on Evolution of Plastic Strain and Residual Stress during Quenching Process. Metals 2017, 7, 228. [Google Scholar] [CrossRef]
- Gong, H.; Sun, Y.; Liu, Y.; Wu, Y.; He, Y.; Sun, X.; Zhang, M. Effect of Vibration Stress Relief on the Shape Stability of Aluminum Alloy 7075 Thin-Walled Parts. Metals 2018, 9, 27. [Google Scholar] [CrossRef]
- Citarella, R.; Carlone, P.; Lepore, M.; Sepe, R. Hybrid technique to assess the fatigue performance of multiple cracked FSW joints. Eng. Fract. Mech. 2016, 162, 38–50. [Google Scholar] [CrossRef]
- Hosaka, T.; Yoshihara, S.; Amanina, I.; MacDonald, B.J. Influence of Grain Refinement and Residual Stress on Corrosion Behavior of AZ31 Magnesium Alloy Processed by ECAP in RPMI-1640 Medium. Procedia Eng. 2017, 184, 432–441. [Google Scholar] [CrossRef]
- Ye, S.P.; Chen, K.H.; Zhu, C.J. A New Path of Quench-Induced Residual Stress Control in Thick 7050 Aluminum Alloy Plate. Metals 2019, 9, 393. [Google Scholar] [CrossRef]
- Gao, H.; Wu, S.; Wu, Q.; Li, B.; Gao, Z.; Zhang, Y.; Mo, S. Experimental and simulation investigation on thermal-vibratory stress relief process for 7075 aluminium alloy. Mater. Des. 2020, 195, 108954. [Google Scholar] [CrossRef]
- Robinson, J.S.; Tiernan, P.J.; Kelleher, J.F. Effect of post-quench delay on stress relieving by cold compression for the aluminium alloy 7050. Mater. Sci. Technol. 2014, 31, 409–417. [Google Scholar] [CrossRef]
- Dong, B.; Che, X.; Wang, Q.; Meng, M.; Gao, Z.; Ma, J.; Yang, F.; Zhang, Z. Refining the microstructure and modifying the texture of the AZ80 alloy cylindrical tube by the rotating backward extrusion with different rotating revolutions. J. Alloys Compd. 2020, 836, 155442. [Google Scholar] [CrossRef]
- Zhou, B.; Wu, D.; Chen, R.; Han, E.-H. Enhanced tensile properties in a Mg-6Gd-3Y-0.5Zr alloy due to hot isostatic pressing (HIP). J. Mater. Sci. Technol. 2019, 35, 1860–1868. [Google Scholar] [CrossRef]
- Asl, K.M.; Tari, A.; Khomamizadeh, F. Effect of deep cryogenic treatment on microstructure, creep and wear behaviors of AZ91 magnesium alloy. Mater. Sci. Eng. A 2009, 523, 27–31. [Google Scholar] [CrossRef]
- GB/T 31310-2014; Metallic Material-Determination of Residual Stress-Hole Drilling Strain-Gauge Method. Standards Press of China: Beijing, China, 2014.
- Gary, S. Schajer Practical Residual Stress Measurement Methods; John Wiley & Sons Ltd. Publication: Vancouver, BC, Canada, 2013. [Google Scholar]
- Giri, A.; Pandey, C.; Mahapatra, M.; Sharma, K.; Singh, P. On the estimation of error in measuring the residual stress by strain gauge rosette. Measurement 2015, 65, 41–49. [Google Scholar] [CrossRef]
- Liu, C.; Yi, X. Residual stress measurement on AA6061-T6 aluminum alloy friction stir butt welds using contour method. Mater. Des. 2013, 46, 366–371. [Google Scholar] [CrossRef]
- Kumar, A.; Pandey, C. Development and Evaluation of Dissimilar Gas Tungsten Arc-Welded Joint of P92 Steel/Inconel 617 Alloy for Advanced Ultra-Supercritical Boiler Applications. Met. Mater. Trans. A 2022, 53, 3245–3273. [Google Scholar] [CrossRef]
- Taraphdar, P.; Thakare, J.; Pandey, C.; Mahapatra, M. Novel residual stress measurement technique to evaluate through thickness residual stress fields. Mater. Lett. 2020, 277, 128347. [Google Scholar] [CrossRef]
- Zhang, X.; Klein, R.; Subbaraman, A.; Chumakov, S.; Li, X.; Christensen, J.; Linder, C.; Kim, S.U. Evaluation of convective heat transfer coefficient and specific heat capacity of a lithium-ion battery using infrared camera and lumped capacitance method. J. Power Sources 2018, 412, 552–558. [Google Scholar] [CrossRef]
- Wang, C.; Luo, T.; Zhou, J.; Yang, Y. Effects of solution and quenching treatment on the residual stress in extruded ZK60 magnesium alloy. Mater. Sci. Eng. A 2018, 722, 14–19. [Google Scholar] [CrossRef]
- Xiao, L.; Yang, G.; Qin, H.; Ma, J.; Jie, W. Microstructure evolution and quench sensitivity characterizations of Mg-9.5Gd-0.9Zn-0.5Zr alloy. Vacuum 2020, 181, 109651. [Google Scholar] [CrossRef]
- Woo, W.; Choo, H.; Prime, M.; Feng, Z.; Clausen, B. Microstructure, texture and residual stress in a friction-stir-processed AZ31B magnesium alloy. Acta Mater. 2008, 56, 1701–1711. [Google Scholar] [CrossRef]
- Lian, Y.; Ji, P.; Zhang, J.; Yuan, X.; Xu, W.; Zhao, Y.; Mo, J.; Zheng, L.; Dou, S. Effect of homogenization annealing on internal residual stress distribution and texture in ME21 magnesium alloy extruded plates. J. Magnes. Alloy. 2019, 7, 186–192. [Google Scholar] [CrossRef]
- Wang, C.; Luo, T.; Liu, Y.; Huang, Q.; Yang, Y. Residual stress and precipitation of Mg-5Zn-3.5Sn-1Mn-0.5Ca-0.5Cu alloy with different quenching rates. J. Magnes. Alloy. 2021, 9, 604–612. [Google Scholar] [CrossRef]
- Chen, T.; Chen, Z.; Shao, J.; Wang, R.; Mao, L.; Liu, C. The role of long period stacking ordered phase in dynamic recrystallization of a Mg–Zn–Y alloy during hot compression. J. Alloys Compd. 2019, 818, 152814. [Google Scholar] [CrossRef]
- Zhang, T.; Li, H.; Gong, H.; Wu, Y.; Ahmad, A.S.; Chen, X. Effect of rolling force on tensile properties of additively manufactured Inconel 718 at ambient and elevated temperatures. J. Alloys Compd. 2021, 884, 161050. [Google Scholar] [CrossRef]
- Wang, D.; Fu, P.; Peng, L.; Wang, Y.; Ding, W. Quench sensitivity characterization of a LPSO-phase containing Mg alloy. Mater. Sci. Eng. A 2019, 749, 291–300. [Google Scholar] [CrossRef]
- Shang, B.C.; Yin, Z.M.; Wang, G.; Liu, B.; Huang, Z.Q. Investigation of Quench Sensitivity and Transformation Kinetics During Isothermal Treatment in 6082 Aluminum Alloy. Mater. Des. 2011, 32, 3818–3822. [Google Scholar] [CrossRef]
- Zhang, Y.-X.; Yi, Y.-P.; Huang, S.-Q.; Dong, F. Influence of quenching cooling rate on residual stress and tensile properties of 2A14 aluminum alloy forgings. Mater. Sci. Eng. A 2016, 674, 658–665. [Google Scholar] [CrossRef]
- Lin, L.; Liu, Z.; Bai, S.; Zhou, Y.; Liu, W.; Lv, Q. Effects of Ge and Ag additions on quench sensitivity and mechanical properties of an Al–Zn–Mg–Cu alloy. Mater. Sci. Eng. A 2017, 682, 640–647. [Google Scholar] [CrossRef]
- Li, J.-F.; Liu, D.-Y.; Ning, H.; Liu, C.; Ma, P.-C.; Chen, Y.-L.; Zhang, X.-H. Experimental quantification of “hardenability” of 2195 and 2050 Al-Li alloys by using cold-rolled sheets. Mater. Charact. 2018, 137, 180–188. [Google Scholar] [CrossRef]


| Cooling Rates | 1 mm Deep (1#) (°C/s) | Middle Part (3#) (°C/s) |
|---|---|---|
| WQ (20 °C) | 6.38 | 5.41 |
| WQ (100 °C) | 5.36 | 4.67 |
| AC | 0.16 | 0.14 |
Publisher’s Note: MDPI stays neutral with regard to jurisdictional claims in published maps and institutional affiliations. |
© 2022 by the authors. Licensee MDPI, Basel, Switzerland. This article is an open access article distributed under the terms and conditions of the Creative Commons Attribution (CC BY) license (https://creativecommons.org/licenses/by/4.0/).
Share and Cite
Xie, Q.; Wu, Y.; Zhang, T.; Peng, S.; Yuan, Z. Effects of Quenching Cooling Rate on Residual Stress and Mechanical Properties of a Rare-Earth Wrought Magnesium Alloy. Materials 2022, 15, 5627. https://doi.org/10.3390/ma15165627
Xie Q, Wu Y, Zhang T, Peng S, Yuan Z. Effects of Quenching Cooling Rate on Residual Stress and Mechanical Properties of a Rare-Earth Wrought Magnesium Alloy. Materials. 2022; 15(16):5627. https://doi.org/10.3390/ma15165627
Chicago/Turabian StyleXie, Qiumin, Yunxin Wu, Tao Zhang, Shunli Peng, and Zhongyu Yuan. 2022. "Effects of Quenching Cooling Rate on Residual Stress and Mechanical Properties of a Rare-Earth Wrought Magnesium Alloy" Materials 15, no. 16: 5627. https://doi.org/10.3390/ma15165627
APA StyleXie, Q., Wu, Y., Zhang, T., Peng, S., & Yuan, Z. (2022). Effects of Quenching Cooling Rate on Residual Stress and Mechanical Properties of a Rare-Earth Wrought Magnesium Alloy. Materials, 15(16), 5627. https://doi.org/10.3390/ma15165627