
Cytokines Activate JAK–STAT Signaling Pathway in MG-63 Cells on Titanium and Zirconia

 , ,
, ,  , ,
, ,
Abstract
:1. Introduction
2. Materials and Methods
2.1. Materials and Specimens
2.2. Cell Culture
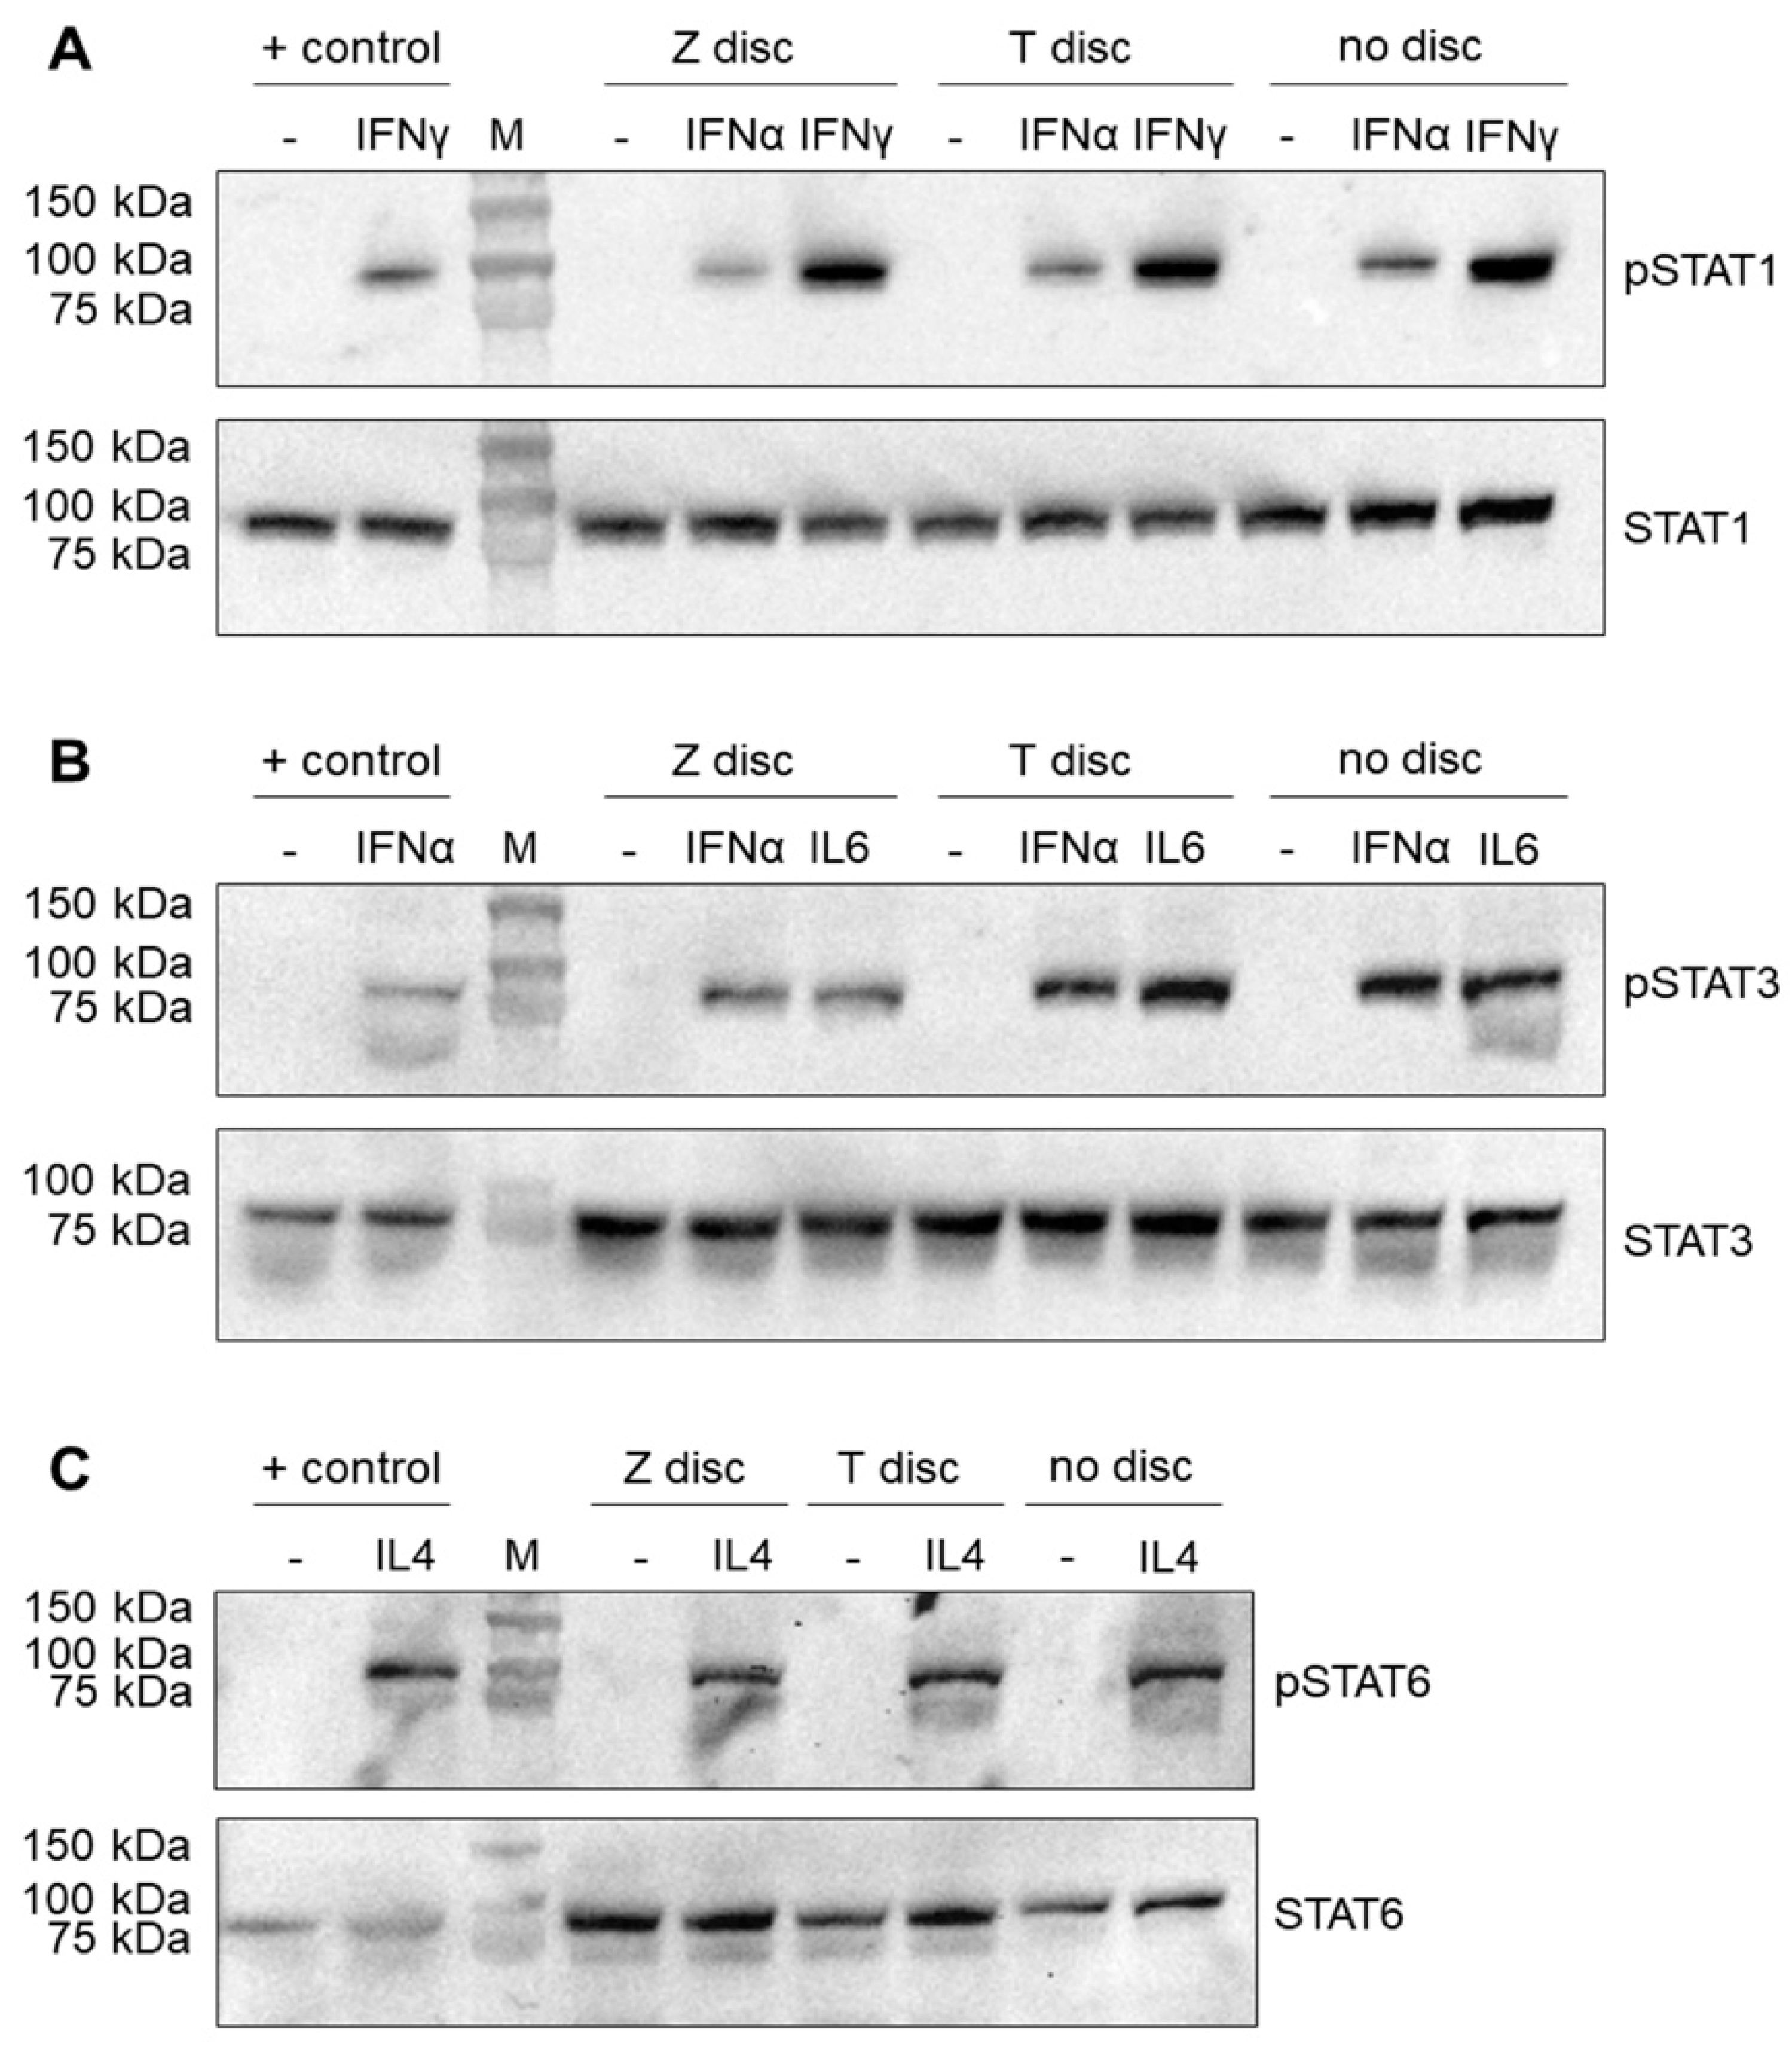
2.3. Western Blot
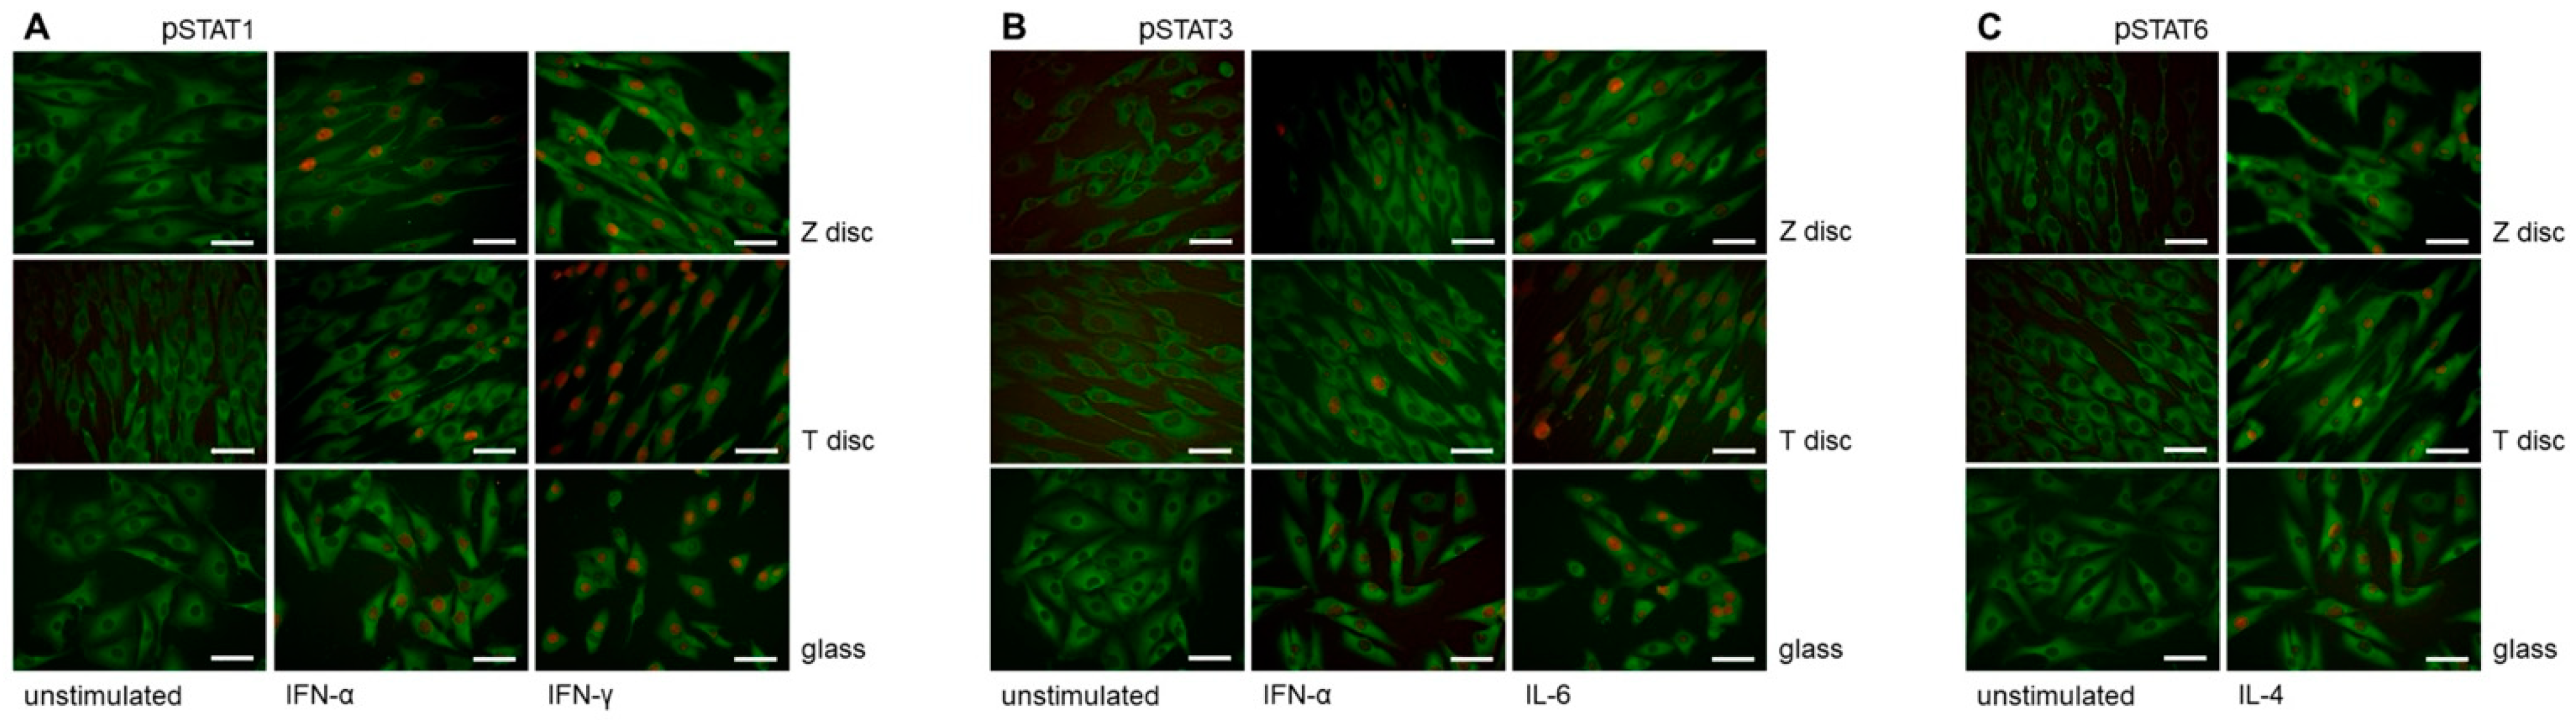
2.4. Immunofluorescence Staining
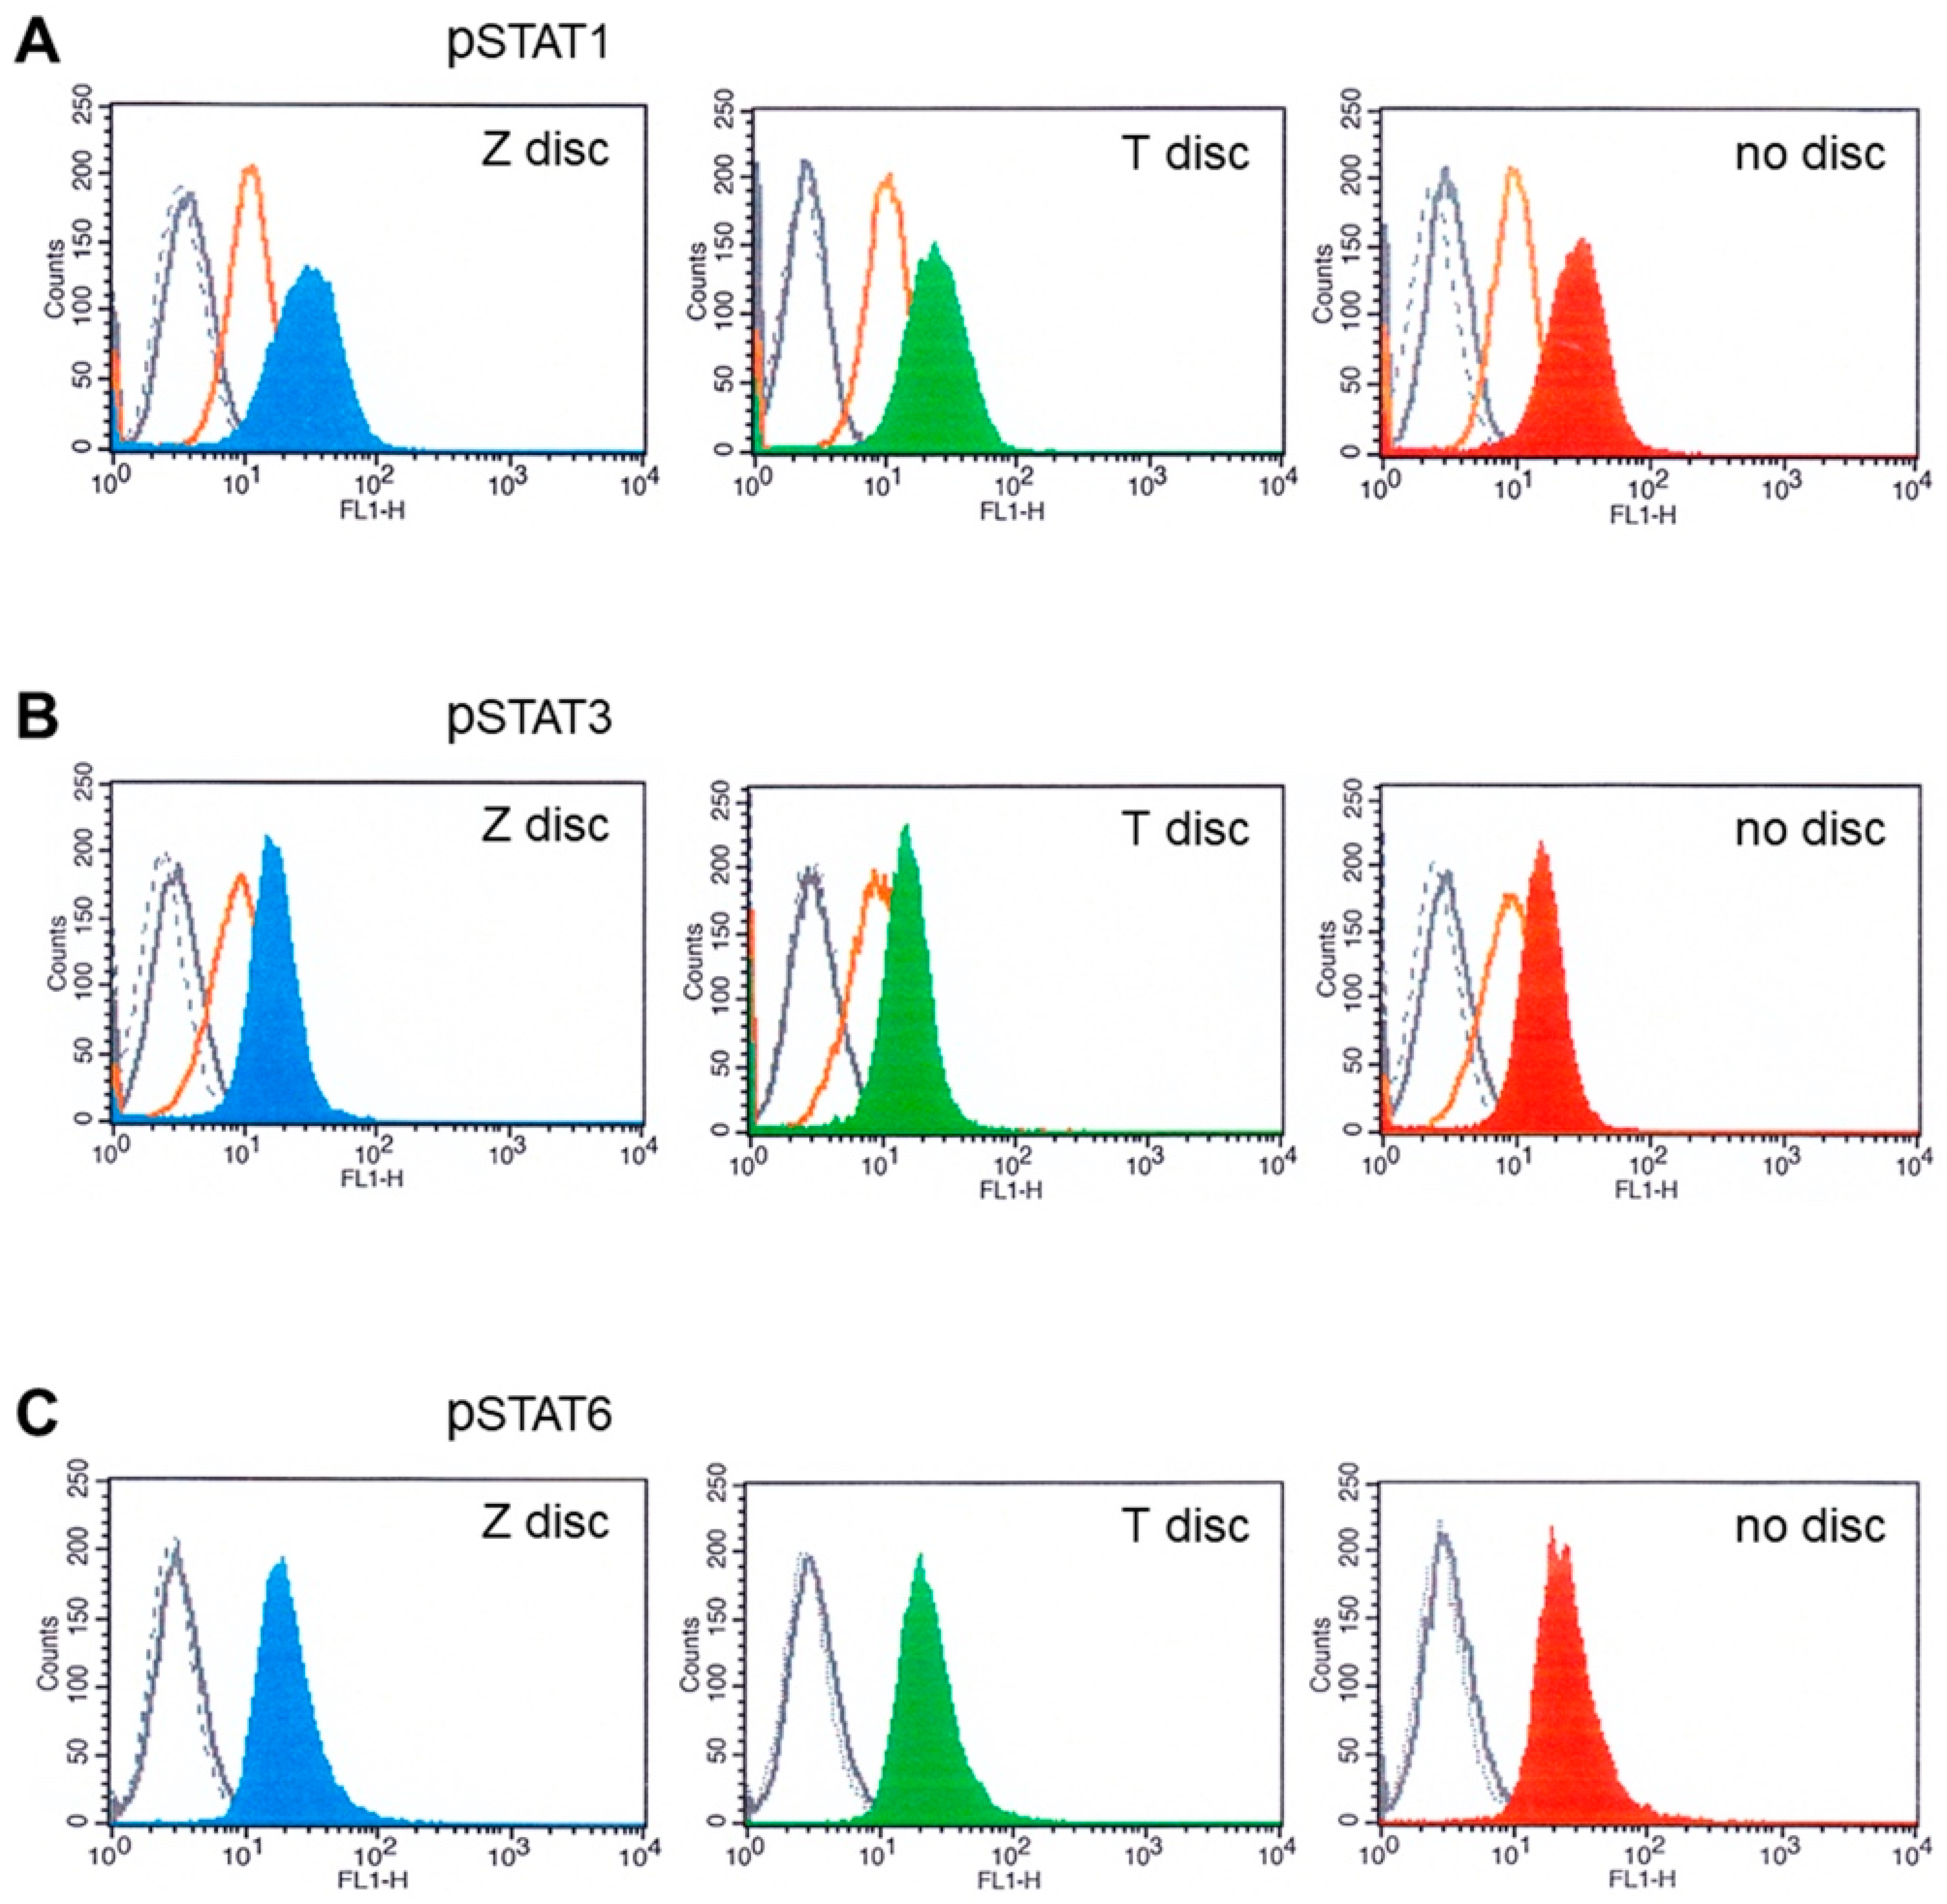
2.5. Analysis of Activated STAT Proteins by Flow Cytometry
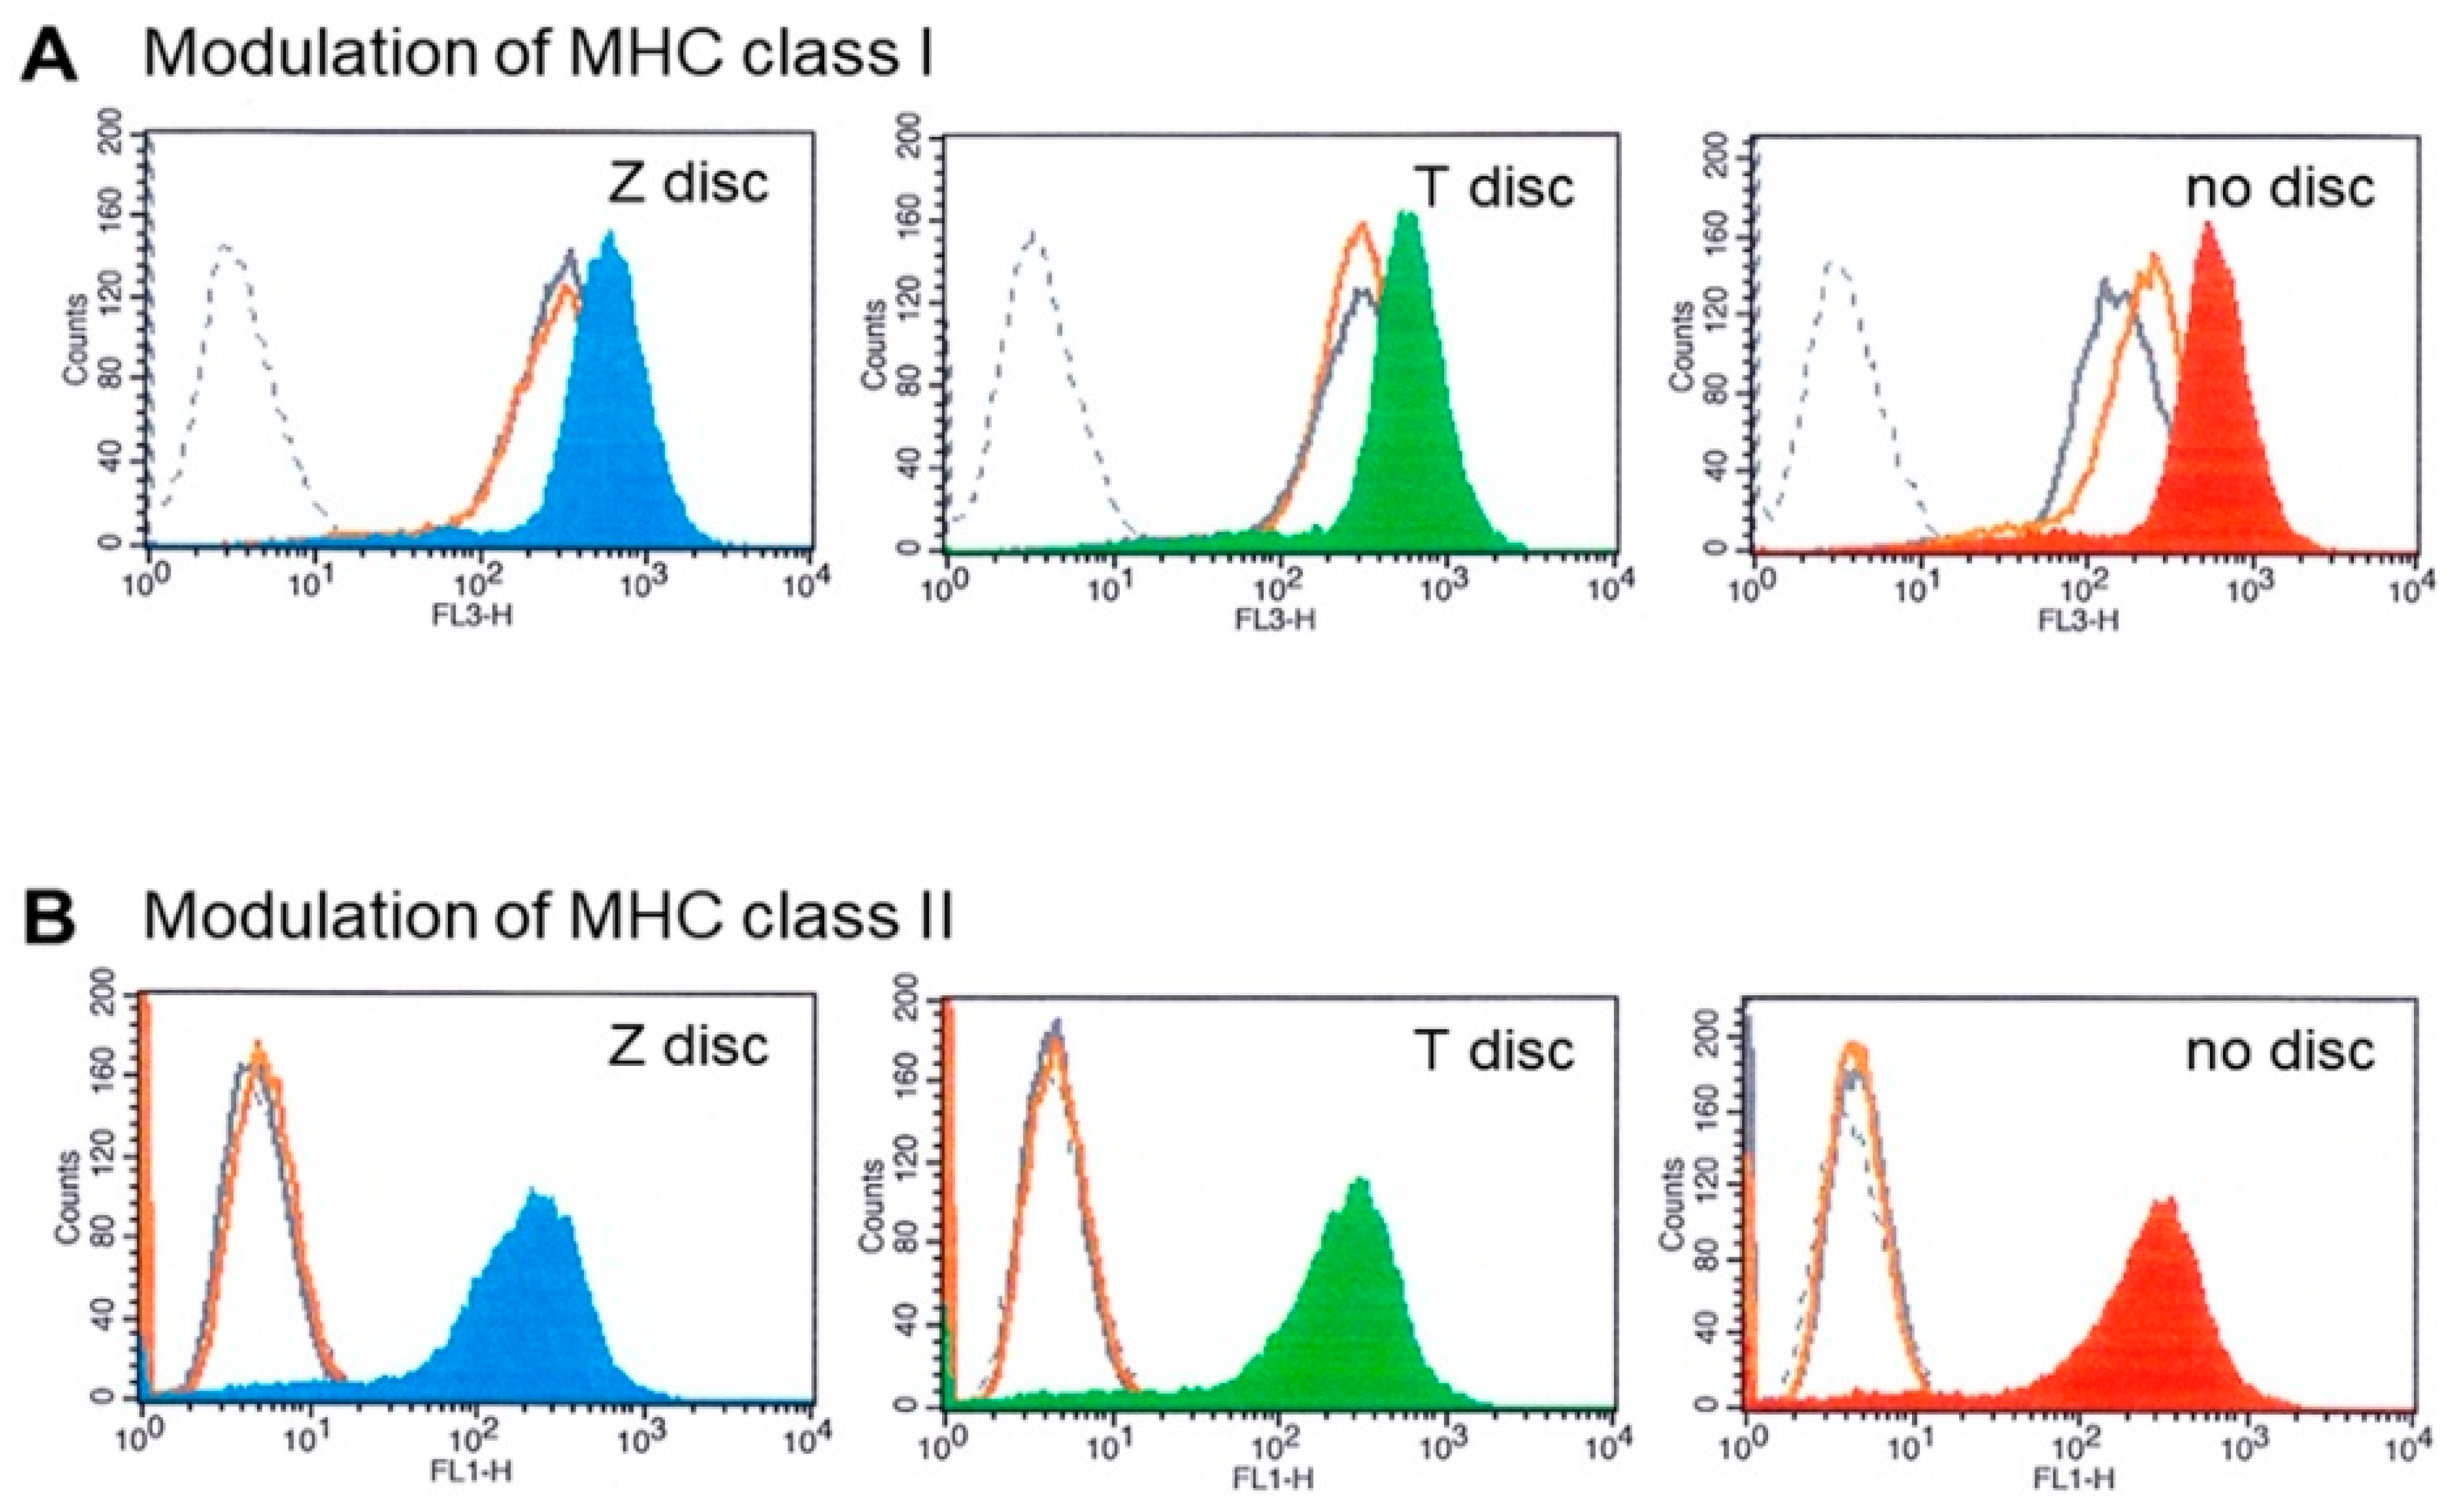
2.6. HLA Modulation Assay
2.7. MTT Assay
2.8. Statistical Analysis
3. Results
3.1. Western Blot Analysis of STAT Proteins
3.2. Immunofluorescence Analysis of STAT Proteins
3.3. Flow Cytometry Analysis of STAT Proteins
3.4. MHC Modulation
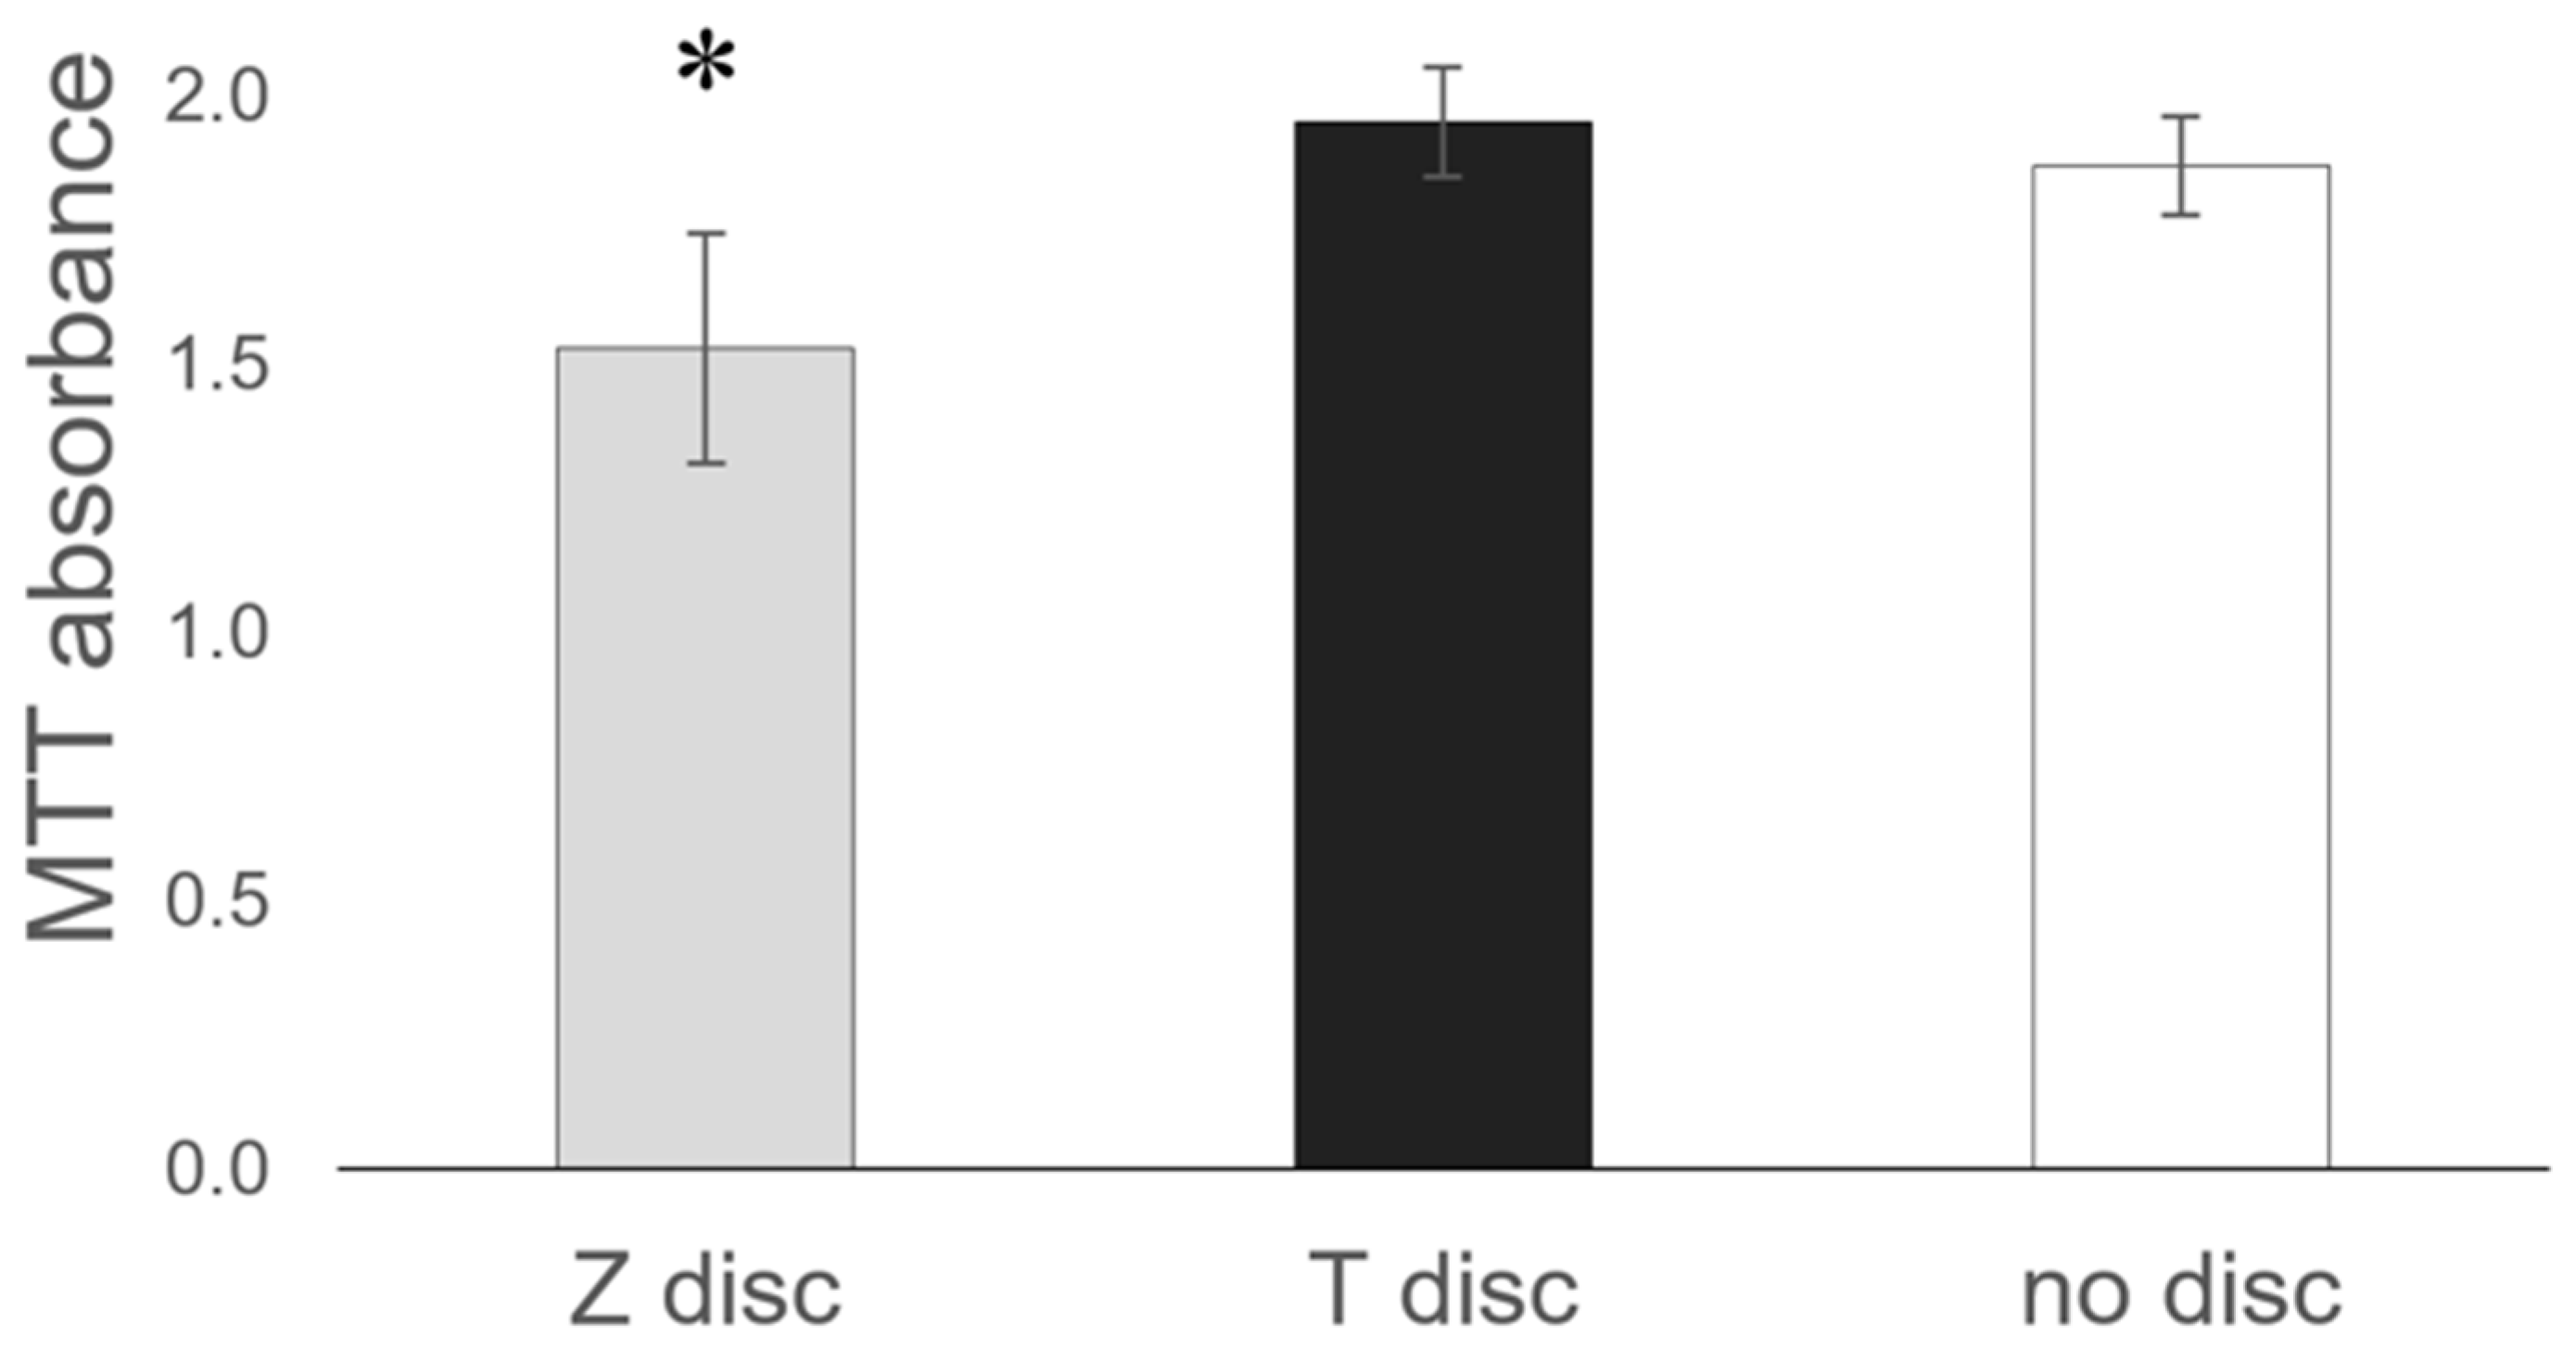
3.5. MTT Assay
4. Discussion
5. Conclusions
Author Contributions
Funding
Institutional Review Board Statement
Informed Consent Statement
Data Availability Statement
Conflicts of Interest
References
- Albrektsson, T.; Brånemark, P.I.; Hansson, H.A.; Lindström, J. Osseointegrated titanium implants. Requirements for ensuring a long-lasting, direct bone-to-implant anchorage in man. Acta Orthop. Scand. 1981, 52, 155–170. [Google Scholar] [CrossRef] [PubMed]
- Balmer, M.; Spies, B.C.; Kohal, R.-J.; Hämmerle, C.H.; Vach, K.; Jung, R.E. Zirconia implants restored with single crowns or fixed dental prostheses: 5-year results of a prospective cohort investigation. Clin. Oral Implant. Res. 2020, 31, 452–462. [Google Scholar] [CrossRef] [PubMed]
- Harrison, D.A. The JAK/STAT Pathway. Cold Spring Harb. Perspect. Biol. 2012, 4, a011205. [Google Scholar] [CrossRef] [PubMed]
- Bousoik, E.; Montazeri Aliabadi, H. “Do We Know Jack” about JAK? A Closer Look at JAK/STAT Signaling Pathway. Front. Oncol. 2018, 8, 287. [Google Scholar] [CrossRef]
- Darnell, J.E., Jr. STATs and gene regulation. Science 1997, 277, 1630–1635. [Google Scholar] [CrossRef]
- Schindler, C. Cytokines and JAK-STAT signaling. Exp. Cell Res. 1999, 253, 7–14. [Google Scholar] [CrossRef]
- Hu, X.; Li, J.; Fu, M.; Zhao, X.; Wang, W. The JAK/STAT signaling pathway: From bench to clinic. Signal Transduct. Target. Ther. 2021, 6, 402. [Google Scholar] [CrossRef]
- Ihle, J.N.; Witthuhn, B.A.; Quelle, F.W.; Yamamoto, K.; Thierfelder, W.E.; Kreider, B.; Silvennoinen, O. Signaling by the cytokine receptor superfamily: JAKs and STATs. Trends Biochem. Sci. 1994, 19, 222–227. [Google Scholar] [CrossRef]
- Lee, C.-J.; An, H.-J.; Cho, E.S.; Kang, H.C.; Lee, J.Y.; Lee, H.S.; Cho, Y.-Y. Stat2 stability regulation: An intersection between immunity and carcinogenesis. Exp. Mol. Med. 2020, 52, 1526–1536. [Google Scholar] [CrossRef]
- Ihle, J.N. The Stat family in cytokine signaling. Curr. Opin. Cell Biol. 2001, 13, 211–217. [Google Scholar] [CrossRef]
- Garcia, R.; Jove, R. Activation of STAT transcription factors in oncogenic tyrosine kinase signaling. J. Biomed. Sci. 1998, 5, 79–85. [Google Scholar] [CrossRef] [PubMed]
- Visconti, R.; Gadina, M.; Chiariello, M.; Chen, E.H.; Stancato, L.F.; Gutkind, J.S.; O’Shea, J.J. Importance of the MKK6/p38 pathway for interleukin-12-induced STAT4 serine phosphorylation and transcriptional activity. Blood 2000, 96, 1844–1852. [Google Scholar] [CrossRef] [PubMed]
- Demoulin, J.-B.; Roost, E.V.; Stevens, M.; Groner, B.; Renauld, J.-C. Distinct Roles for STAT1, STAT3, and STAT5 in Differentiation Gene Induction and Apoptosis Inhibition by Interleukin-9. J. Biol. Chem. 1999, 274, 25855–25861. [Google Scholar] [CrossRef] [PubMed]
- Meinke, A.; Barahmand-Pour, F.; Wöhrl, S.; Stoiber, D.; Decker, T. Activation of different Stat5 isoforms contributes to cell-type-restricted signaling in response to interferons. Mol. Cell. 1996, 16, 6937–6944. [Google Scholar] [CrossRef] [PubMed]
- Hou, J.; Schindler, U.; Henzel, W.J.; Ho, T.C.; Brasseur, M.; McKnight, S.L. An Interleukin-4-Induced Transcription Factor: IL-4 Stat. Science 1994, 265, 1701–1706. [Google Scholar] [CrossRef]
- Fasler-Kan, E.; Pansky, A.; Wiederkehr, M.; Battegay, M.; Heim, M.H. Interferon-α activates signal transducers and activators of transcription 5 and 6 in Daudi cells. Eur. J. Biochem. 1998, 254, 514–519. [Google Scholar] [CrossRef]
- Takeda, K.; Tanaka, T.; Shi, W.; Matsumoto, M.; Minami, M.; Kashiwamura, S.-I.; Nakanishi, K.; Yoshida, N.; Kishimoto, T.; Akira, S. Essential role of Stat6 in IL-4 signalling. Nature 1996, 380, 627–630. [Google Scholar] [CrossRef]
- Frank, D.A. STAT signaling in the pathogenesis and treatment of cancer. Mol. Med. 1999, 5, 432–456. [Google Scholar] [CrossRef]
- Stark, G.R.; Darnell, J.E., Jr. The JAK-STAT Pathway at Twenty. Immunity 2012, 36, 503–514. [Google Scholar] [CrossRef]
- Darnell, J.E., Jr.; Kerr, I.M.; Stark, G.R. Jak-STAT pathways and transcriptional activation in response to IFNs and other extracellular signaling proteins. Science 1994, 264, 1415–1421. [Google Scholar] [CrossRef]
- Rausch, M.A.; Shokoohi-Tabrizi, H.; Wehner, C.; Pippenger, B.E.; Wagner, R.S.; Ulm, C.; Moritz, A.; Chen, J.; Andrukhov, O. Impact of Implant Surface Material and Microscale Roughness on the Initial Attachment and Proliferation of Primary Human Gingival Fibroblasts. Biology 2021, 10, 356. [Google Scholar] [CrossRef] [PubMed]
- Andrukhov, O.; Behm, C.; Blufstein, A.; Wehner, C.; Gahn, J.; Pippenger, B.; Wagner, R.; Rausch-Fan, X. Effect of Implant Surface Material and Roughness to the Susceptibility of Primary Gingival Fibroblasts to Inflammatory Stimuli. Dent. Mater. 2020, 36, e194–e205. [Google Scholar] [CrossRef] [PubMed]
- Ruggiero, S.; Cosgarea, R.; Potempa, J.; Potempa, B.; Eick, S.; Chiquet, M. Cleavage of extracellular matrix in periodontitis: Gingipains differentially affect cell adhesion activities of fibronectin and tenascin-C. Biochim. Biophys. Acta (BBA) Mol. Basis Dis. 2013, 1832, 517–526. [Google Scholar] [CrossRef] [PubMed]
- Fasler-Kan, E.; Suenderhauf, C.; Barteneva, N.; Poller, B.; Gygax, D.; Huwyler, J. Cytokine signaling in the human brain capillary endothelial cell line hCMEC/D3. Brain Res. 2010, 1354, 15–22. [Google Scholar] [CrossRef]
- Mukaddam, K.; Astasov-Frauenhoffer, M.; Fasler-Kan, E.; Marot, L.; Kisiel, M.; Meyer, E.; Köser, J.; Waser, M.; Bornstein, M.M.; Kühl, S. Effect of a Nanostructured Titanium Surface on Gingival Cell Adhesion, Viability and Properties against P. gingivalis. Materials 2021, 14, 7686. [Google Scholar] [CrossRef]
- Fasler-Kan, E.; Barteneva, N.; Ketterer, S.; Wunderlich, K.; Huwyler, J.; Gygax, D.; Flammer, J.; Meyer, P. Activation of the JAK–STAT intracellular pathway in human retinal pigment epithelial cell line ARPE-19. Int. J. Interf. Cytokine Mediat. Res. 2010, 2, 127–136. [Google Scholar] [CrossRef]
- Hanawa, T. Zirconia versus titanium in dentistry: A review. Dent. Mater. J. 2020, 39, 24–36. [Google Scholar] [CrossRef]
- Oliveira, G.R.D.; Pozzer, L.; Cavalieri-Pereira, L.; Moraes, P.H.D.; Olate, S.; Barbosa, J.R.D.A. Bacterial adhesion and colonization differences between zirconia and titanium implant abutments: An in vivo human study. J. Periodontal Implant Sci. 2012, 42, 217–223. [Google Scholar] [CrossRef]
- Corry, K.A.; Zhou, H.; Brustovetsky, T.; Himes, E.R.; Bivi, N.; Horn, M.R.; Kitase, Y.; Wallace, J.M.; Bellido, T.; Brustovetsky, N.; et al. Stat3 in osteocytes mediates osteogenic response to loading. Bone Rep. 2019, 11, 100218. [Google Scholar] [CrossRef]
- Li, J. JAK-STAT and bone metabolism. JAK-STAT 2013, 2, e23930. [Google Scholar] [CrossRef]
- Bellido, T.; Borba, V.Z.C.; Roberson, P.; Manolagas, S.C. Activation of the Janus Kinase/STAT (Signal Transducer and Activator of Transcription) Signal Transduction Pathway by Interleukin-6-Type Cytokines Promotes Osteoblast Differentiation*. Endocrinology 1997, 138, 3666–3676. [Google Scholar] [CrossRef] [PubMed]
- De Souza, P.P.C.; Henning, P.; Lerner, U.H. Stimulation of Osteoclast Formation by Oncostatin M and the Role of WNT16 as a Negative Feedback Regulator. Int. J. Mol. Sci. 2022, 23, 3287. [Google Scholar] [CrossRef] [PubMed]
- Gao, A.; Liao, Q.; Xie, L.; Wang, G.; Zhang, W.; Wu, Y.; Li, P.; Guan, M.; Pan, H.; Tong, L.; et al. Tuning the Surface Immunomodulatory Functions of Polyetheretherketone for Enhanced Osseointegration. Biomaterials 2020, 230, 119642. [Google Scholar] [CrossRef] [PubMed]
- Sanpaolo, E.R.; Rotondo, C.; Cici, D.; Corrado, A.; Cantatore, F.P. JAK/STAT pathway and molecular mechanism in bone remodeling. Mol. Biol. Rep. 2020, 47, 9087–9096. [Google Scholar] [CrossRef]
- Depprich, R.; Zipprich, H.; Ommerborn, M.; Naujoks, C.; Wiesmann, H.-P.; Kiattavorncharoen, S.; Lauer, H.-C.; Meyer, U.; Kübler, N.R.; Handschel, J. Osseointegration of zirconia implants compared with titanium: An in vivo study. Head Face Med. 2008, 4, 30. [Google Scholar] [CrossRef] [PubMed]
- Sun, Y.; Liu, L.; Wang, Y.; He, A.; Hu, H.; Zhang, J.; Han, M.; Huang, Y. Curcumin inhibits the proliferation and invasion of MG-63 cells through inactivation of the p-JAK2/p-STAT3 pathway. OncoTargets Ther. 2019, 12, 2011–2021. [Google Scholar] [CrossRef]
- Annamalai, V.; Kotakonda, M.; Periyannan, V. JAK1/STAT3 regulatory effect of β-caryophyllene on MG-63 osteosarcoma cells via ROS-induced apoptotic mitochondrial pathway by DNA fragmentation. J. Biochem. Mol. Toxicol. 2020, 34, e22514. [Google Scholar] [CrossRef]
- Ahn, R.; Sabourin, V.; Bolt, A.M.; Hébert, S.; Totten, S.; Jay, N.D.; Festa, M.C.; Young, Y.K.; Im, Y.K.; Pawson, T.; et al. The Shc1 adaptor simultaneously balances Stat1 and Stat3 activity to promote breast cancer immune suppression. Nat. Commun. 2017, 8, 14638. [Google Scholar] [CrossRef]
- Wang, Y.; Shen, Y.; Wang, S.; Shen, Q.; Zhou, X. The role of STAT3 in leading the crosstalk between human cancers and the immune system. Cancer Lett. 2018, 415, 117–128. [Google Scholar] [CrossRef]
- See, A.P.; Han, J.E.; Phallen, J.; Binder, Z.; Gallia, G.; Pan, F.; Jinasena, D.; Jackson, C.; Belcaid, Z.; Jeong, S.J.; et al. The role of STAT3 activation in modulating the immune microenvironment of GBM. J. Neuro-Oncol. 2012, 110, 359–368. [Google Scholar] [CrossRef]
- Pantouli, E.; Boehm, M.M.; Koka, S. Inflammatory cytokines activate p38 MAPK to induce osteoprotegerin synthesis by MG-63 cells. Biochem. Biophys. Res. Commun. 2005, 329, 224–229. [Google Scholar] [CrossRef] [PubMed]


| Cytokine | Protein | WB | IF | FC |
|---|---|---|---|---|
| IFN-α | STAT1 | ++ | ++ | ++ |
| IFN-γ | STAT1 | +++ | +++ | +++ |
| IFN-α | STAT3 | ++ | ++ | + |
| IL-6 | STAT3 | +++ | ++ | ++ |
| IL-4 | STAT6 | ++ | ++ | ++ |
Publisher’s Note: MDPI stays neutral with regard to jurisdictional claims in published maps and institutional affiliations. |
© 2022 by the authors. Licensee MDPI, Basel, Switzerland. This article is an open access article distributed under the terms and conditions of the Creative Commons Attribution (CC BY) license (https://creativecommons.org/licenses/by/4.0/).
Share and Cite
Mukaddam, K.; Ruggiero, S.; Berger, S.M.; Cholewa, D.; Kühl, S.; Vegh, D.; Payer, M.; Bornstein, M.M.; Alhawasli, F.; Fasler-Kan, E. Cytokines Activate JAK–STAT Signaling Pathway in MG-63 Cells on Titanium and Zirconia. Materials 2022, 15, 5621. https://doi.org/10.3390/ma15165621
Mukaddam K, Ruggiero S, Berger SM, Cholewa D, Kühl S, Vegh D, Payer M, Bornstein MM, Alhawasli F, Fasler-Kan E. Cytokines Activate JAK–STAT Signaling Pathway in MG-63 Cells on Titanium and Zirconia. Materials. 2022; 15(16):5621. https://doi.org/10.3390/ma15165621
Chicago/Turabian StyleMukaddam, Khaled, Sabrina Ruggiero, Steffen M. Berger, Dietmar Cholewa, Sebastian Kühl, Daniel Vegh, Michael Payer, Michael M. Bornstein, Farah Alhawasli, and Elizaveta Fasler-Kan. 2022. "Cytokines Activate JAK–STAT Signaling Pathway in MG-63 Cells on Titanium and Zirconia" Materials 15, no. 16: 5621. https://doi.org/10.3390/ma15165621
APA StyleMukaddam, K., Ruggiero, S., Berger, S. M., Cholewa, D., Kühl, S., Vegh, D., Payer, M., Bornstein, M. M., Alhawasli, F., & Fasler-Kan, E. (2022). Cytokines Activate JAK–STAT Signaling Pathway in MG-63 Cells on Titanium and Zirconia. Materials, 15(16), 5621. https://doi.org/10.3390/ma15165621