Article

Influence of CeO2 and TiO2 Particles on Physicochemical Properties of Composite Nickel Coatings Electrodeposited at Ambient Temperature

1
Department of Separation Science, School of Engineering Science, LUT University, Yliopistonkatu 34, FI-53850 Lappeenranta, Finland
2
Helmholtz-Zentrum Dresden-Rossendorf, Helmholtz Institute Freiberg for Resource Technology, 09599 Freiberg, Germany
3
Soft Matter Nanostructures Group, Jerzy Haber Institute of Catalysis and Surface Chemistry, Polish Academy of Sciences, Niezapominajek 8, PL-30239 Krakow, Poland
4
Division of Machine Elements, Luleå University of Technology, Regnbågsallén, SE-97187 Luleå, Sweden
5
Institute of Nanotechnology and Materials Engineering, Faculty of Applied Physics and Mathematics, Gdansk University of Technology, Narutowicza St. 11/12 Gdansk, PL-80233 Gdansk, Poland
6
Division of Materials Science, Luleå University of Technology, Regnbågsallén, SE-97187 Luleå, Sweden
*
Author to whom correspondence should be addressed.
Materials 2022, 15(16), 5550; https://doi.org/10.3390/ma15165550
Submission received: 17 June 2022 / Revised: 21 July 2022 / Accepted: 10 August 2022 / Published: 12 August 2022
(This article belongs to the Section Advanced Composites)

Abstract

:
The Ni-TiO2 and Ni-CeO2 composite coatings with varying hydrophilic/hydrophobic characteristics were fabricated by the electrodeposition method from a tartrate electrolyte at ambient temperature. To meet the requirements of tight regulation by the European Chemicals Agency classifying H3BO3 as a substance of very high concern, Rochelle salt was utilized as a buffer solution instead. The novelty of this study was to implement a simple one-step galvanostatic electrodeposition from the low-temperature electrolyte based on a greener buffer compared to traditionally used, aiming to obtain new types of soft-matrix Ni, Ni-CeO2, and Ni-TiO2 coatings onto steel or copper substrates. The surface characteristics of electrodeposited nickel composites were evaluated by SEM, EDS, surface contact angle measurements, and XPS. Physiochemical properties of pure Ni, Ni-CeO2, and Ni-TiO2 composites, namely, wear resistance, microhardness, microroughness, and photocatalytic activity, were studied. Potentiodynamic polarization, EIS, and ICP-MS analyses were employed to study the long-term corrosion behavior of coatings in a 0.5 M NaCl solution. Superior photocatalytic degradation of methylene blue, 96.2% after 6 h of illumination, was achieved in the case of Ni-TiO2 composite, while no substantial change in the photocatalytic behavior of the Ni-CeO2 compared to pure Ni was observed. Both composites demonstrated higher hardness and wear resistance than pure Ni. This study investigates the feasibility of utilizing TiO2 as a photocatalytic hydrophilicity promoter in the fabrication of composite coatings for various applications.

1. Introduction

Electrodeposition of composite coatings is one of the cheapest, simplest, and most versatile surface modification methods [1,2]. It is based on the introduction of inert second-phase particles into the plating electrolyte. Pure nickel coatings are used in various industrial applications due to their high microhardness, corrosion, and wear resistance. Moreover, nickel is frequently used as a metal matrix for composite coatings [3]. The introduction of the second phase particles into the Ni matrix can effectively tailor the properties of the formed composites. Previous studies demonstrated that the inclusion of 0.5–5.0 wt.% of solid particles (oxides and salts) into the nickel matrix could improve the microstructure [4,5,6], wettability [7], physicochemical [8], tribological [9,10], photocatalytic [11,12], and antibacterial [13] properties of the initial surface.
The composition of nickel-plating electrolytes, parameters of electrodeposition (pH, agitation, and current density), size, and concentration of the second phase particles are of particular importance. The Watts electrolyte is the most commonly used in industry for the deposition of Ni and Ni-based coatings. It has some advantages, such as relatively wide ranges of operating current densities and pH [14]. One of the important components of the Watts electrolyte is boric acid (H3BO3), which stabilizes the pH of the electrolyte and controls the nucleation and grain growth of Ni deposits [14,15]. However, the European Chemicals Agency has considered boric acid as a SVHC (substance of very high concern) [16]. Moreover, according to the guidelines of the World Health Organization (WHO), the concentration of boron (B) in drinking water and large desalination plants is restricted to 0.5 ppm and 0.3–0.5 ppm, respectively. It is also well-known that the boron concentration in global seawater varies between 4 and 6 ppm [17]. Irrigation water is the most critical source of boron contamination, such that prolonged irrigation with water containing >1 ppm of boron can have a detrimental effect on soil and plants [18]. However, the concentration of boric acid in the standard Watts nickel-plating electrolyte is up to 30 g/L (30,000 ppm) [14], making its utilization expensive and energy-consumptive. The removal of boron to accepted levels requires specific and expensive treatment strategies. As an example, a regular one-pass standard seawater reverse osmosis (SWRO) cannot meet the above-mentioned requirements as boron is in the non-ionic undissociated boric acid form, indicating its small molecular size due to the nearly neutral pH of seawater (7.5–8.5), which can easily penetrate through the membrane. The increase in pH before the first pass in SWRO increases the scaling formation, which in turn reduces the RO system performance and increases the capital cost (the requirement of a high dosage of antiscalant). Therefore, the two-pass design is usually necessitated to fulfill the guidelines of WHO for boron removal, in which the pH will be adjusted to around 11 between the two-pass [17]. From the above discussion, it is crucial to substitute boric acid with other effective buffer agents in the nickel electroplating industry [19].
In our previous works [20,21,22,23], we have developed a novel type of tartrate electrolytes for electrodeposition of Ni at ambient temperature and examined their properties. The proposed tartrate electrolytes do not require heating of the deposition bath, thus decreasing operation cost and excluding the step of the bath’s composition adjustment due to water evaporation. Compared to Ni coatings obtained from the Watts electrolyte, which is commonly utilized at 45–55 °C [24], coatings obtained from low-temperature electrolytes have slightly lower microhardness [20,25,26]. Such coatings can also be defined as a soft matrix, which facilitates the polishing and drilling of the inner phase of composite materials and opens up new promising exploitation opportunities for these types of Ni-based coatings, such as dental applications (dental drills) and polishing wheels [27,28].
Nanosized TiO2 and CeO2 oxides are insoluble in water and are well-known for their photocatalytic activity, anti-bacterial properties [29,30], and influence on surface wettability [31]. Therefore, modification of nickel coatings with these oxides can lead to the formation of novel composite materials with advanced functionality. To the best of the authors’ knowledge, no systematic studies devoted to comparing the properties of the above-mentioned composite coatings obtained at ambient temperature have been performed to date. A few studies have investigated the effects of Ti and Ce oxides on the properties of Ni coatings deposited at temperatures from 30 to 60 °C from plating baths based on the mixture of chlorides and sulfates (Watts electrolyte) or sulfamates (Table 1 and Table 2).
As can be seen from Table 1 and Table 2, several particle sizes and concentrations were analyzed by other researchers. Particularly, TiO2 and CeO2 particles with a mean size from 21–350 nm to 3 μm and 15–30 nm to 3 μm, respectively, were added as the second phase to nickel-plating electrolytes. The concentration of TiO2 in electrolytes varied between 1 and 15 g/L, whereas the variation for CeO2 was from 10 to 60 g/L. The majority of studies used specific concentrations of the second phase particles [32,33,34], while some others studied a range of concentrations [35,36]. The variety of examined properties has been determined by the type of the incorporated second phase. Although the same type of second phase particles has been employed in these studies, variation in the second phase concentration and particle sizes, as well as composition and conditions of electrodeposition, substantially altered the physicochemical and mechanical properties of the obtained composites (Table 1 and Table 2). Additionally, almost all studies focused only on specific properties of the composite coating. Moreover, Ni-CeO2 coatings were predominantly electrodeposited from electrolytes that contained organic additives/surfactants (brighteners, leveling additives) [34,37,38,39,40,41]. Such additives themselves strongly influence the microstructure and increase the microhardness of nickel matrix up to 450–600 HV [29,42]. At the same time, organic additives decrease the stability of the electrolyte and complicate the electrodeposition process. Therefore, it is preferable to use simple electrolytes with high dispersion stability for the deposition of composite coatings.
Table 1. Influence of TiO2 particles on properties of nickel matrix.
Electrolyte TypeExamined PropertiesConditions of ElectrodepositionRef.
WattsCorrosion WearHydrophilicityPhotocatalyticMicroroughnessMicrohardness, HVTemperature, °CConcentration of TiO2, g/LParticle Size, nm
Watts 387 501250[32]
148330650[43]
5510–80200–350[35]
Watts
+surfactant
64060 ± 55–15>100[44]
31345150, 80[45]
504525[37]
5010–25 mL/L[46]
Sulphamate
+surfactant
82450502–3 μm[47]
Sulphamate, pyrophosphate 620401–1021[33]
Methansulfonate 601–730[48]
Tartrate2210~11 μmpresent contribution
Table 2. Influence of CeO2 nanoparticles on properties of nickel matrix.
Electrolyte TypeExamined PropertiesConditions of ElectrodepositionRef.
WattsPhotocatalyticMicroroughnessMicrohardness, HVTemperature, °CConcentration of TiO2, g/LParticle Size, nm
Watts
+surfactant
760 ± 1004510–5015–20[38,49]
560555–20 [39]
99455120[40]
5010[50]
25 ± 35 [51]
sulphamate
+surfactant
50 ± 110–5030[52]
508 10022[34]
4510–603 μm[53]
Watts824505–2015–25[36]
acetate+H3BO3
+surfactant
725303–12[41]
Tartrate2210~46 μmpresent contribution
All hardness values reported in Table 1 and Table 2 are average of five to ten indentations at randomly selected positions. √ means properties that were studied in the publication.
Consequently, in the present contribution, we employed a simple one-step galvanostatic electrodeposition, from the low-temperature electrolyte based on Na, K-tartrate buffer agent (Rochelle salt) as a greener substitute of the traditionally used boric acid aiming to obtain new types of soft-matrix Ni, Ni-CeO2, and Ni-TiO2 coatings onto steel or copper substrates. Herein, a detailed investigation of the physicochemical, mechanical, photocatalytic characteristics, and corrosion properties of obtained composites and pure nickel coatings was conducted using various analytical techniques. This study was designed to contribute to a deeper understanding of the physicochemical properties of composite nickel coatings prepared with TiO2 and CeO2 as second-phase particles for their potential industrial use. For this purpose, several analytical methods (SEM, EDX, XRD, and XPS) were used to investigate the composition and structure of the nickel and composite coatings as well as characterize products of corrosion.

2. Materials and Methods

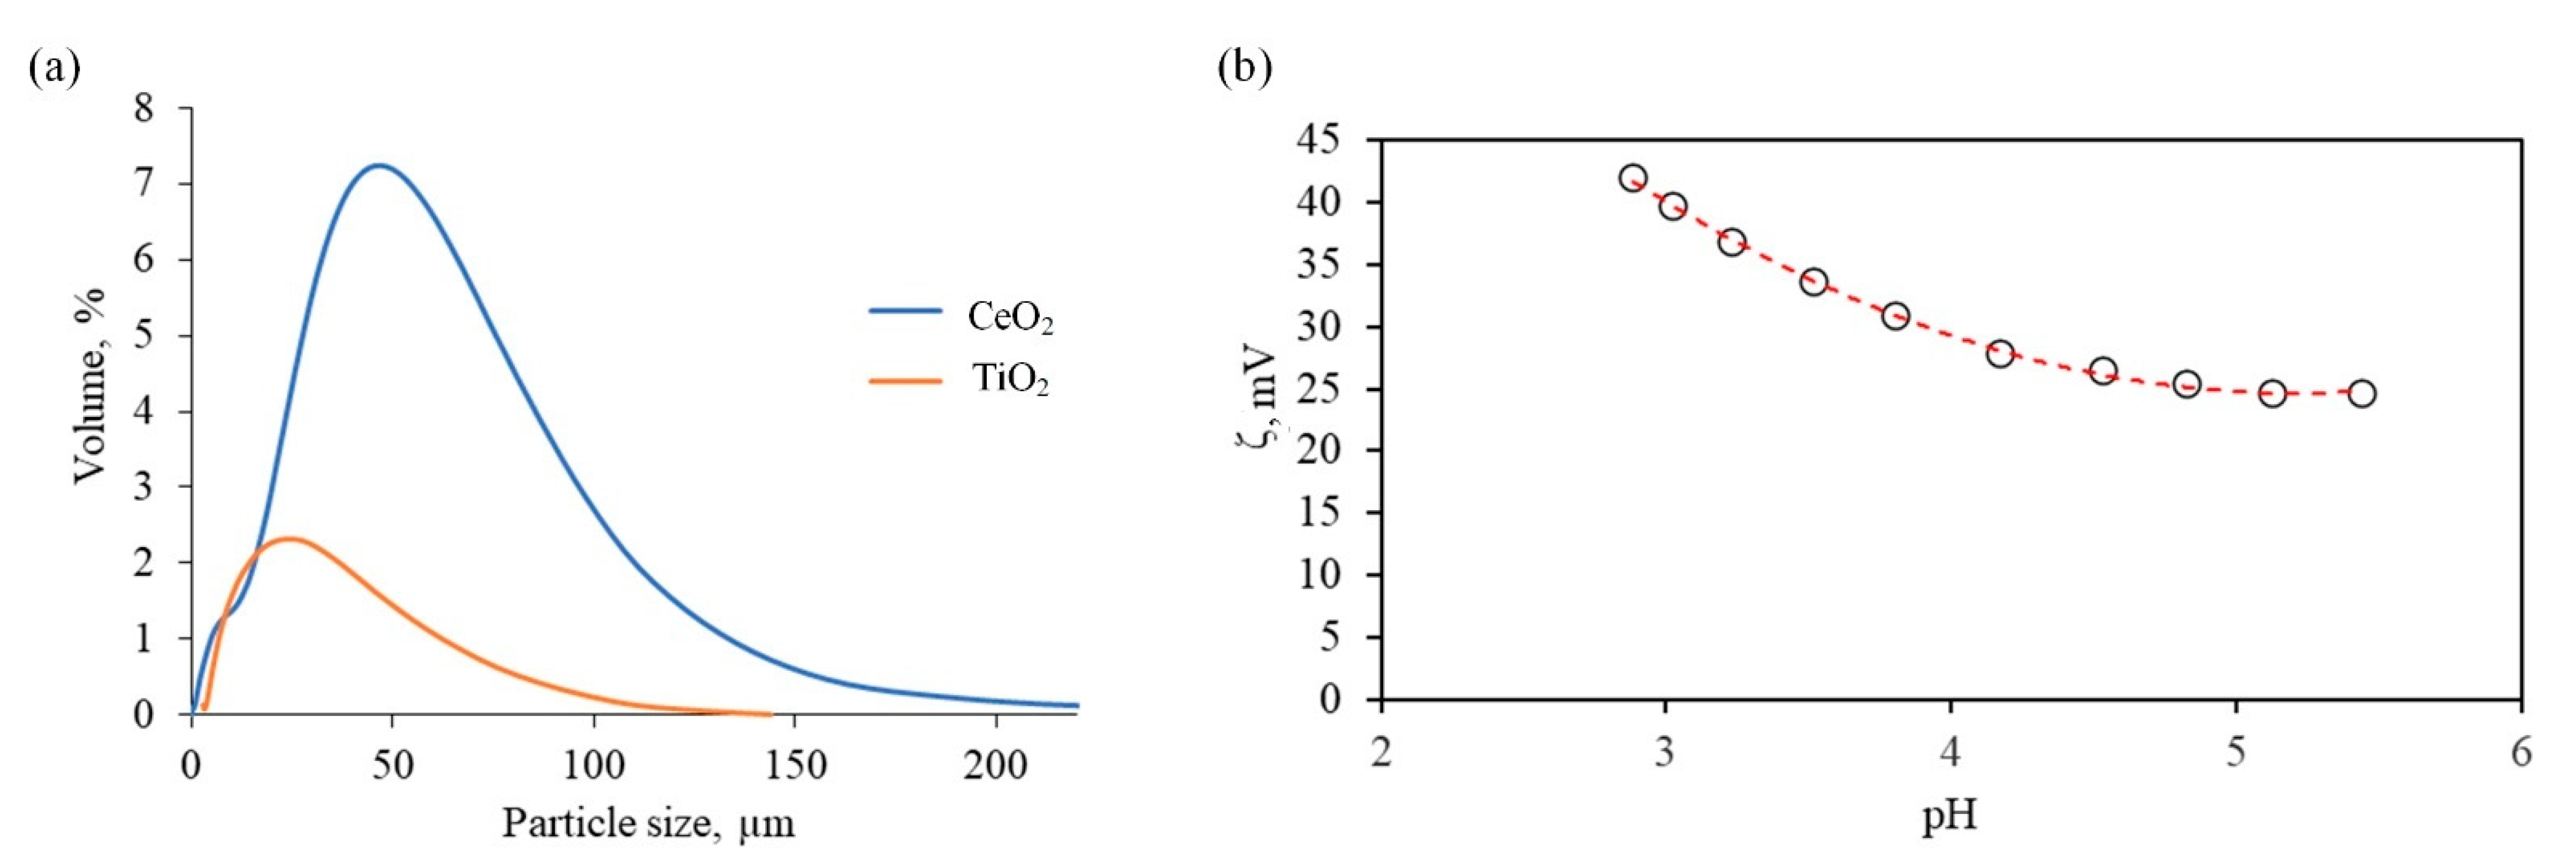
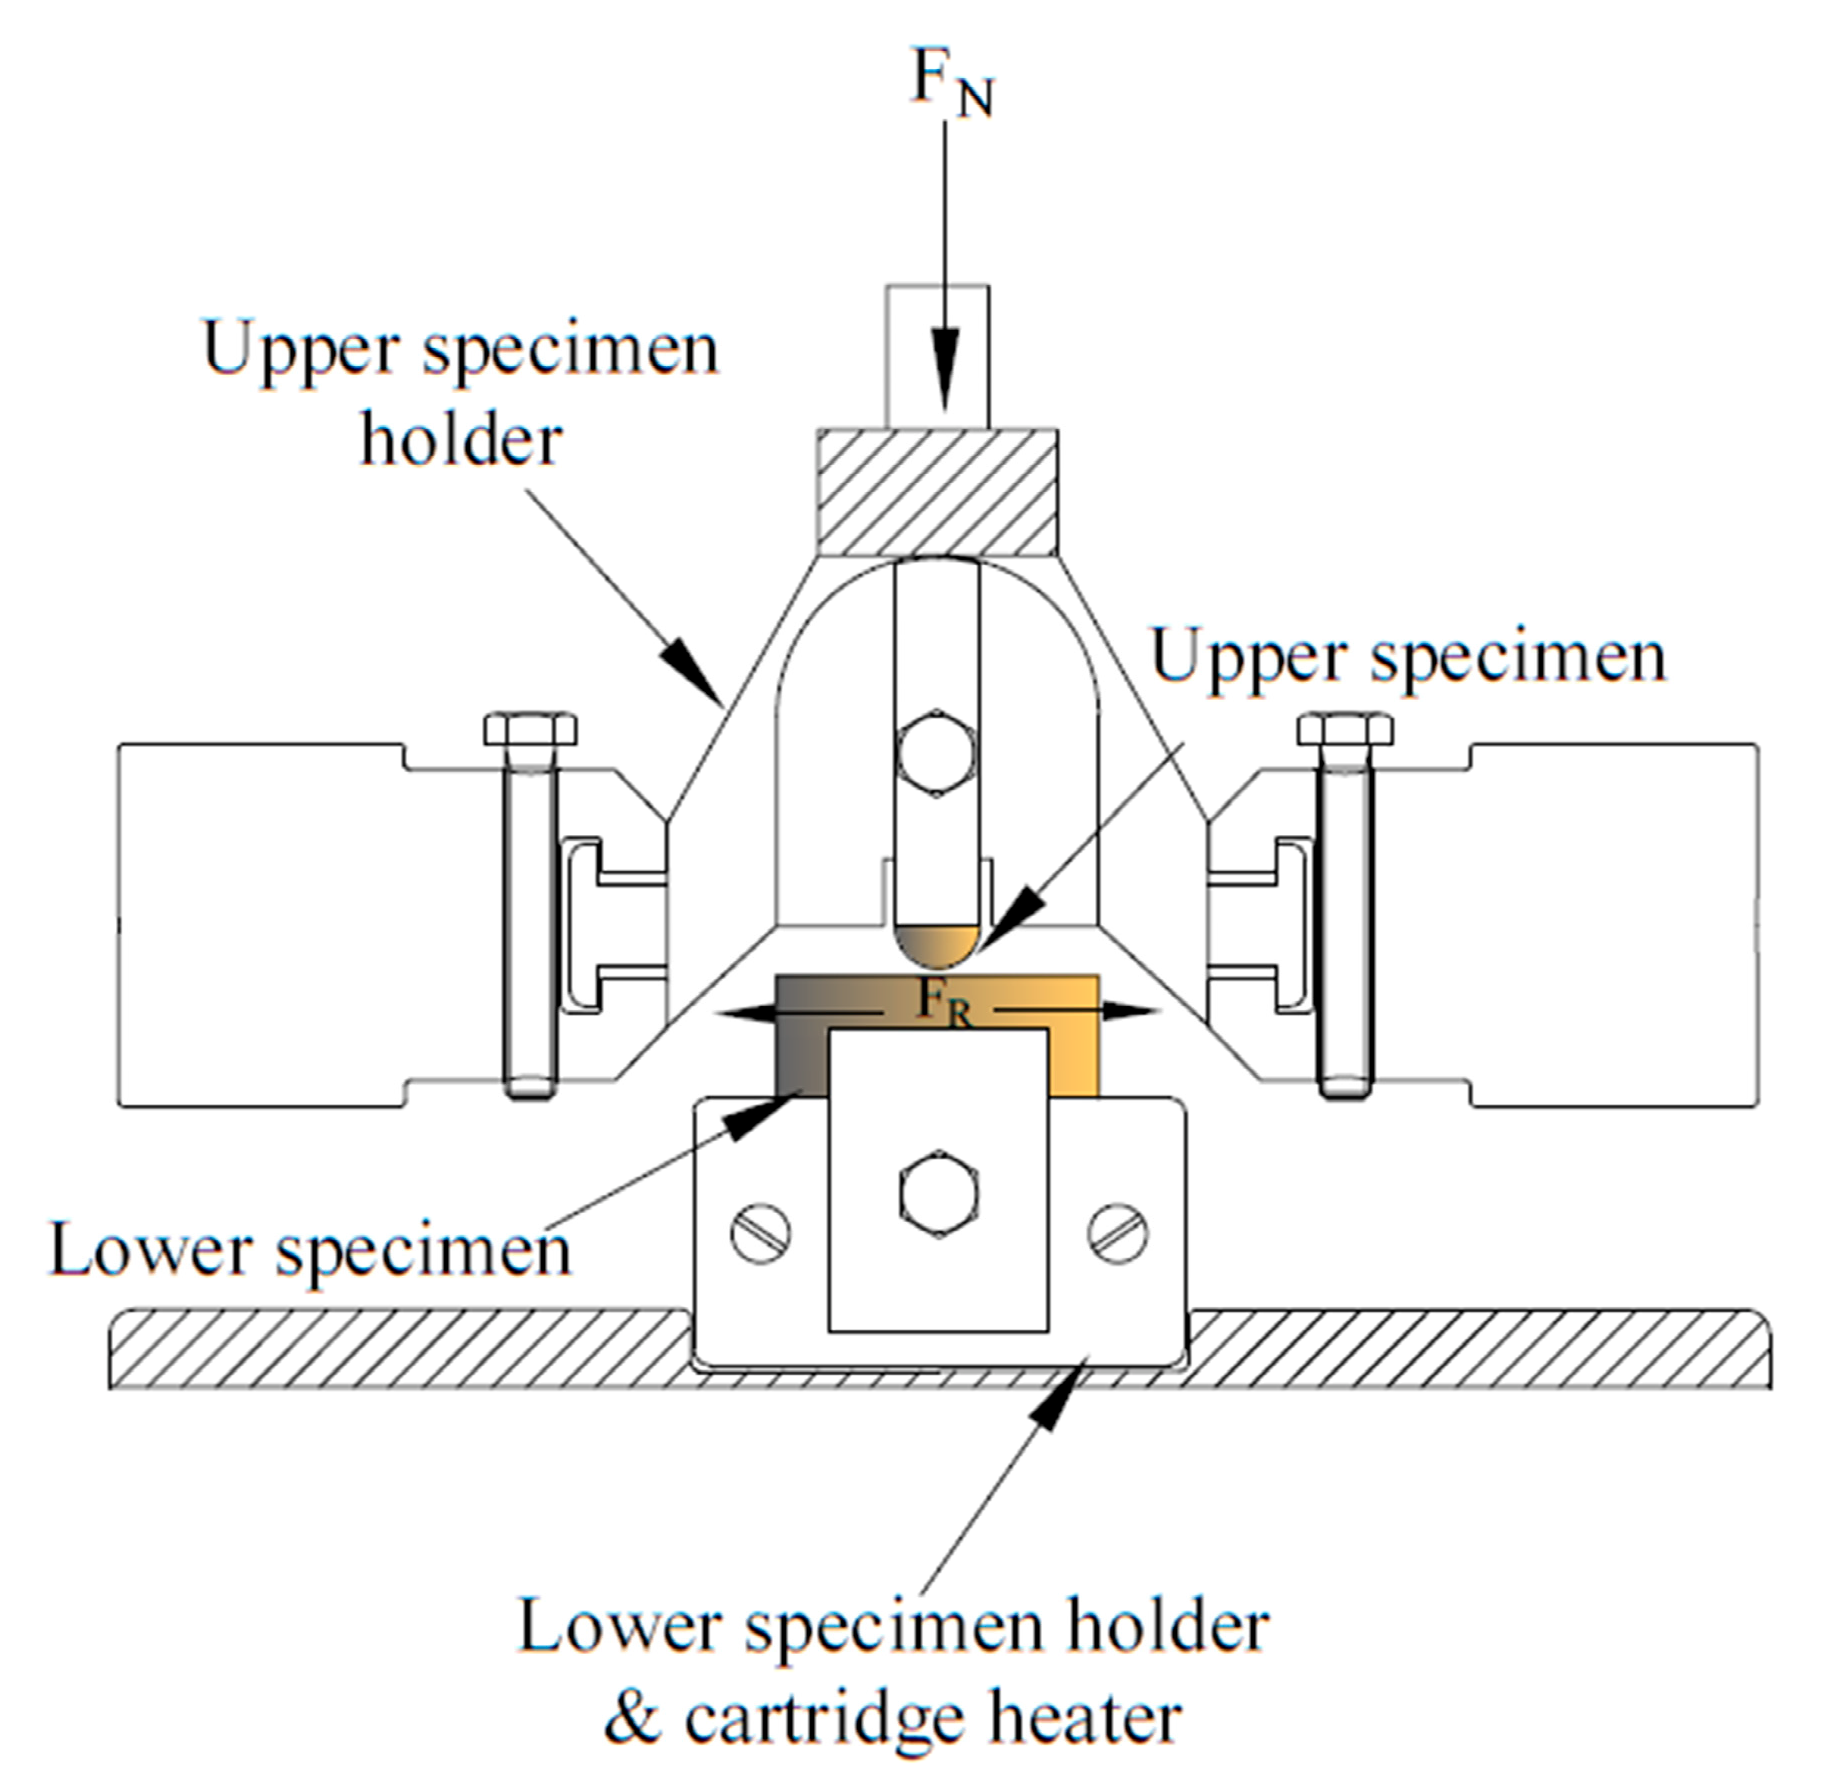
2.1. Materials and Conditions of Deposition

In the electrodeposition process, copper or steel plates were used as a cathode (substrate), and Ni plates served as an anode. Prior to electrodeposition, the surface of the cathode was treated according to the procedure described in detail in our previous work [22]. Briefly, the surface of the cathode was mechanically ground with #500, #900, #1200, and #2000 emery paper, cleaned in an alkaline solution, and etched in nitric acid. Ultra-pure deionized water (DI) (Merck Millipore Q-POD, DI, 15 MΩ) was used to rinse the substrates after each step, and finally, samples were dried with N2 gas at ambient temperature. Electrodeposition of nickel coatings was performed from the electrolyte with composition and under conditions represented in Table 3, which were chosen based on our previous study [22]. All chemicals were used as received. The temperature of the electrolyte was controlled by an RK8 CS water bath. Electrolysis was carried out in a galvanostatic mode using a PS 3005 power supply. The pH of the solutions was monitored using a Radiometer PHM 240 pH/ion pH meter. Suspensions for electrodeposition of composite nickel-based coatings were prepared by adding either TiO2 or CeO2 particles into the electrolyte to reach oxide concentration of 10 g/L. The commercial TiO2 and CeO2 powders were characterized by XRD, Figure S1 (Supplementary material), particle size distribution was measured with a Beckman Coulter LS 13320 laser diffraction particle size analyzer in Fraunhofer optical model (Figure 1a), and zeta potential of CeO2 was measured by a SurPASS electro-kinetic analyzer, Figure 1b.
ζ-potential of CeO2 particles was measured in a cylindric cell by a SurPASS electro-kinetic analyzer using 1 mM KCl solution as the background electrolyte. A 0.05 M HCl solution was used during ζ-potential analysis to decrease the pH of the solution to 3. ζ-potential of TiO2 particles was not examined because the average size of particles was less than 25 μm. Finally, the zeta potential was calculated from streaming current measurement according to the classic Helmholtz–Smoluchowski equation (Equation (1)).
ζ = d l d p η ε ε 0 L A ,
where dl/dp is the slope of streaming current versus pressure, η is the liquid viscosity (viscosity of pure water at room temperature about 20 °C), ε0 is the vacuum permittivity, and ε is the dielectric constant of the electrolyte (water at the same temperature), L is the length of the streaming channel, and A is the cross-section of the streaming channel.
The TiO2 powder was predominantly in anatase phase (Figure S1) with the mean particle size (Figure 1a) of 11 μm (D10: 6.76; D50: 40.6; D90: 91). The CeO2 powder revealed distinct intense lines corresponding to the fcc structure (Figure S1). The mean size of CeO2 particles (Figure 1a) is 46.6 μm (D10: 0.31; D50: 1.11; D90: 36.1). The measured mean size varied from that provided by the manufacturer, perhaps, due to the particle’s agglomeration.
The cathode current efficiency of the nickel coating without second-phase particles was estimated to be about 95% by weight the cathode before and after electrolysis using a Mettler AC 88 analytical balance. Coatings with a thickness of about 9 μm for electrochemical and photocatalytic tests and 25–30 μm for all other tests were obtained. The coatings’ thickness was determined by examining cross-sections with a scanning electron microscope.

2.2. Material Characterization

After deposition, obtained composites were ultrasonically cleaned in acetone for 10 min in order to remove loosely adsorbed TiO2 or CeO2 particles from the surface. Thereafter, the coatings were rinsed with distilled water and dried in a flow of N2. Characterization of the surface morphology, composition, and elemental distribution over the surface was carried out using a Hitachi SU3500 scanning electron microscope (SEM, Tokyo, Japan) equipped with an energy dispersive X-ray (EDX) unit. The chemical composition and crystal structure of coatings were ascertained using X-ray diffraction (XRD) (PANalytical MPD, the Netherlands) with a cobalt X-ray tube. The 2θ range was 20–70° and the step size was 0.02 °/s. The grain size was calculated using the Debye-Scherrer equation (Equation (2)).
D = 0.94 λ β cos θ ,
where D, λ, β, and θ are the mean crystalline size (nm), X-ray wavelength (0.178897 nm), the full width at half maxima in intensity, and Bragg diffraction angle, respectively.
The microhardness of the coatings was measured at room temperature by indention using a Struers DuraScan 70 setup. A pyramidal diamond tip was used for the test. The indenter was lowered to the matrix with a 0.5 kg load (HV5) and then retrieved from the coating surface. A total of ten indentations were made at the center and on edges with a distance of 1 mm on each specimen surface, and the average values were calculated.
The tribological tests of nickel and composite nickel-based coatings were carried out using an Optimol SRV high-temperature reciprocating friction and wear tester in a ball-on-disc test configuration. In the wear equipment depicted in Figure 2 an upper specimen (Si3N4) is loaded against the lower stationary disc (coated specimen) and oscillated by means of an electromagnetic drive. The lower specimen is mounted on a specimen block incorporating a heating element that allows conducting tests at temperatures up to 900 °C. The data acquisition and control software enabled the measurement and control of different test parameters, such as friction coefficient, frequency, stroke length, temperature, and load. All wear tests were performed using a frequency of 50 Hz and speed of 200 mm/s in a dry sliding mode at room temperature with a load of 12 N. The stroke length was 2 mm, and the total sliding length was 180 m with the data recorded automatically during tests. After the tests, the specimen was washed with distilled water to remove the debris from the surface. The wear behavior and the wear rate of the samples were studied by making profilometric measurements of wear tracks. The wear rates were calculated based on the profiles of wear tracks vs. duration of wear and the corresponding wear scar depth and length were determined by a Zygo NewView 7300 3D optical interferometer. The volume of scars after the test was calculated using the MountainsMaps ® software 7.4 (Digital Surf, Besançon, France).
Wear rate, R, was calculated by dividing the volume loss by the load and the total sliding distance on the disk specimen according to the following equation (Equation (3)):
R = V 2 × L × S × N ,
where V is the volume loss of material during the test duration; L is the applied load; S is the stroke length; N is the total number of reciprocations.
The surface hydrophilicity of electrodeposited composites and pure Ni was evaluated by measuring the average equilibrium sessile drop contact angles of deionized water using a KSV CAM 101 instrument (Helsinki, Finland). Nickel and composite Ni-CeO2 and Ni-TiO2 coatings were initially cleaned with ethanol and gently dried at room temperature. Afterward, the contact angle (CA) was measured by putting a droplet of deionized water using a microsyringe (~5 μL) on the top of the examined surface. With the aid of a CCD camera (DMK 21F04, The Imaging Source Europe GmbH, Bremen, Germany), which is connected to the instrument, the image of the droplet was taken, and further treated by curve fitting analysis with the CAM 2008 software. The final reported CA results are the average of at least 8 measurements. Images were analyzed based on statistics measurement and Young/Laplace fitting methods.
The photocatalytic activity of Ni, Ni-CeO2, and Ni-TiO2 coatings was evaluated by performing methylene blue (MB, CAS No. 61-73-4, Sigma Aldrich, St. Louis, MI, USA) degradation under simulated solar light. A sample with a surface area of 15 cm2 was placed into 50 mL of 0.03 mM aqueous MB solution in a beaker coupled with a jacket for adjusting the temperature (20 ± 1 °C) and exposed to a simulated solar light source (Max-350 Compact Xenon Light Source, Japan) for up to 6 h. Illumination was applied to the solution and sample from the top side at a distance of ~14 cm. The intensity of the incident light was measured to be about 33 mW/cm2. The MB solution was initially stirred for about 2 h in darkness to reach the adsorption equilibrium. During light irradiation, the reaction mixture was continuously stirred on a magnetic stirrer, and aliquots of the reaction mixture were collected at regular time intervals. The leftover MB concentrations were estimated with the help of a UV-vis spectrophotometer (Jasco V-670 spectrophotometer, Tokyo, Japan). The maximum absorption peak (λmax) of MB at about 666 nm was considered to estimate the remaining concentration of MB in aqueous solutions [54,55]. All experiments were performed in triplicate to ensure the statistical reliability of the results.
Electrochemical measurements were carried out in a three-electrode thermostated cell using an Autolab PGSTAT 302N potentiostat-galvanostat (Methrom Autolab BV, the Netherlands). The measured setup contained a saturated silver/silver-chloride reference electrode, a platinum wire counter electrode, and a copper substrate with the examined coating (exposed surface area 1 cm2) as a working electrode. Electrochemical corrosion studies of nickel and composite nickel-based coatings were carried out in 0.5 M NaCl solution at room temperature (~20 °C–22 °C). Polarization curves were recorded at a potential sweep rate of 1 mV/s in the potential range of ±300 mV from the open circuit potential (OCP). The corrosion current density (icorr) of the specimens was determined by extrapolating the Tafel regions of anodic and cathodic branches of the polarization curves [22] and corrosion rate (vcorr) is calculated according to [56]. The electrochemical impedance spectroscopy (EIS) spectra values were recorded at the OCP in the frequency range from 10 kHz to 0.01 Hz with an amplitude of 10 mV. The measured frequency responses were interpreted using a nonlinear least square fitting procedure in Nova 2.1 and ZView 3.2c software. Prior to experiments, the working electrode was immersed in the electrolyte for 30 min for OCP stabilization. All electrochemical studies reported in the present work were at least triplicated.
For weight loss tests, nickel and composite nickel-based coatings were exposed to 50 mL of 0.5 M NaCl solution for 3.5 months. Samples (4 cm2) were periodically removed, washed thoroughly with DI water, weighted using a microbalance, and examined by SEM. The weight differences of the specimens were recorded after 5, 10, 20 days, and 3.5 months of immersion. At the same time, a portion of corrosion media was analyzed with inductively coupled plasma mass spectroscopy (ICP-MS, an Agilent 7900) in a mixture of 1% HNO3 and 1% HCl (Ultrapure, Merck) to evaluate the concentration of released nickel ions. The relative standard deviation of all ICP measurements was less than 3.6%.
X-ray photoelectron spectroscopy (XPS) was used for the characterization of coatings after corrosion tests. The samples were cleaned in deionized water for 10 min and dried with N2. No other treatment was implemented in order to not compromise the subtle chemical changes on the surface. Spectra were recorded in the Ni2p, Ti2p, Ce3d, Cl2p, C1s, and O1s binding energy (BE) ranges for each sample to verify their surface chemistry. The measurements were carried out using an Escalab 250Xi multispectroscope (ThermoFisher Scientific) equipped with an Al Kα monochromatic X-Ray source with a spot diameter of 0.65 mm. Applied pass energy was 10 eV, and the energy step size was 0.1 eV. Charge compensation was controlled through low-energy electron and low-energy Ar+ ions emission using the flood gun (emission current 0.15 mA). For the final peak calibration adventitious carbon signal C1s at 284.6 eV were used.

3. Results

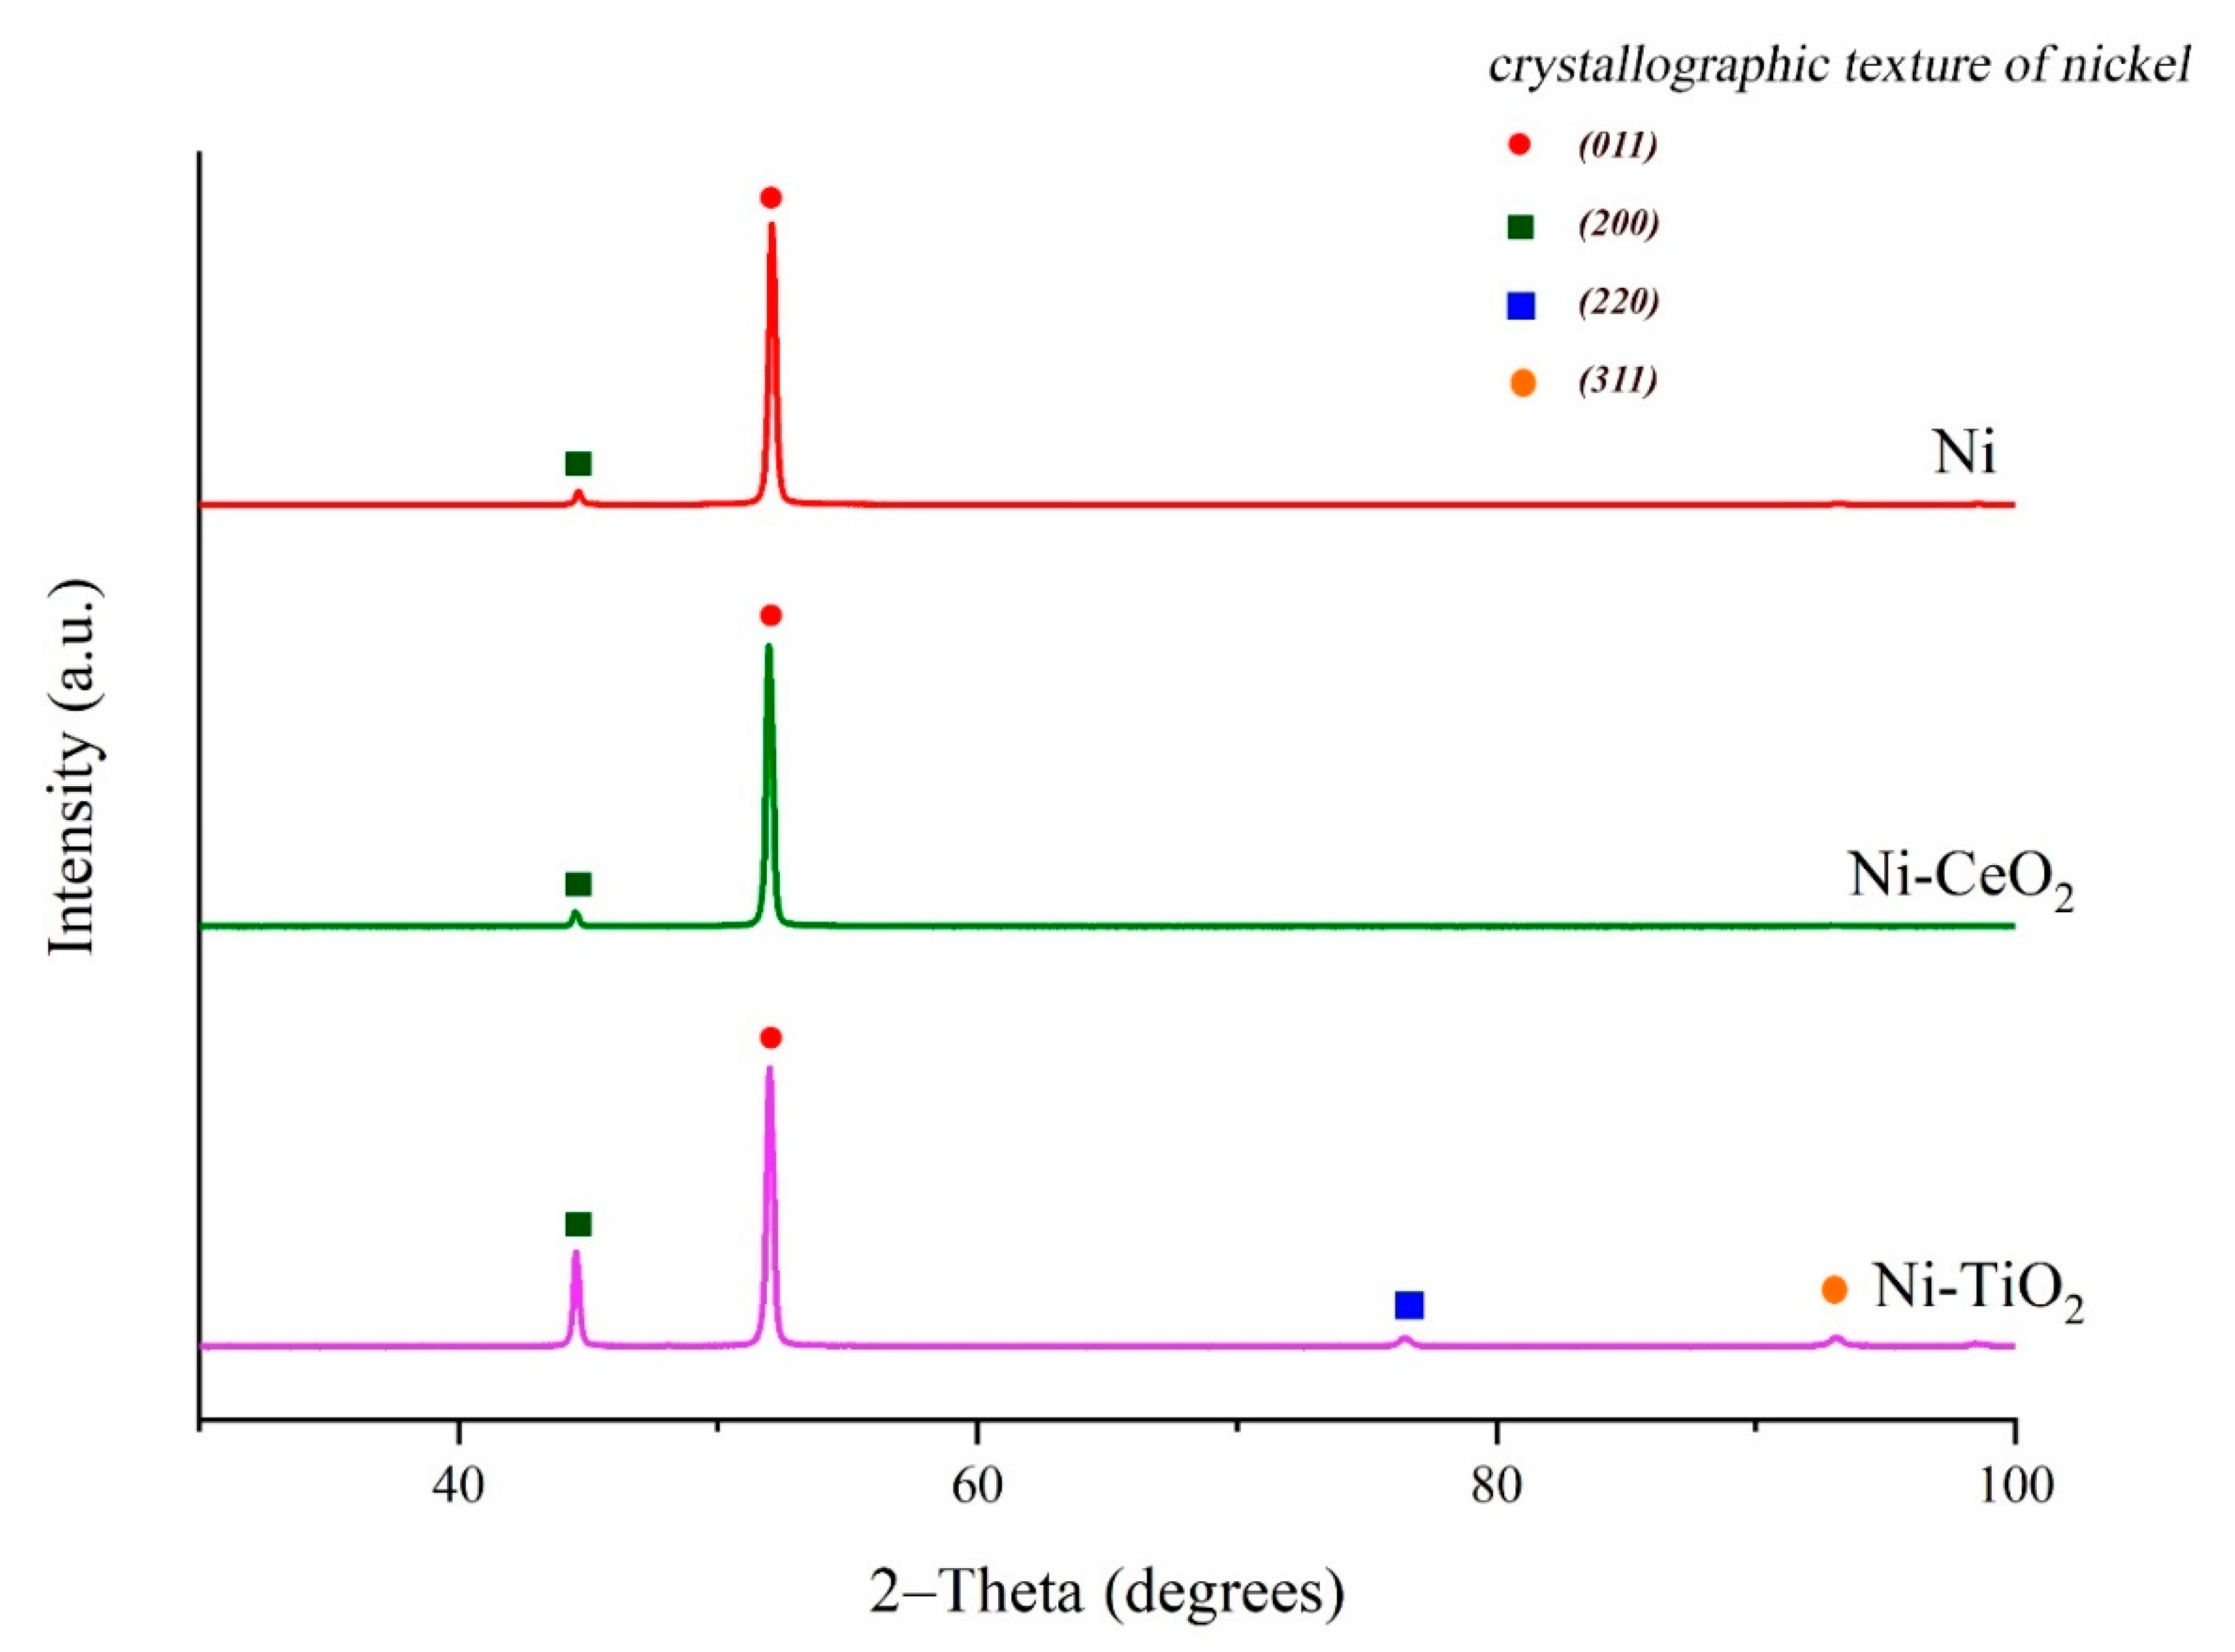
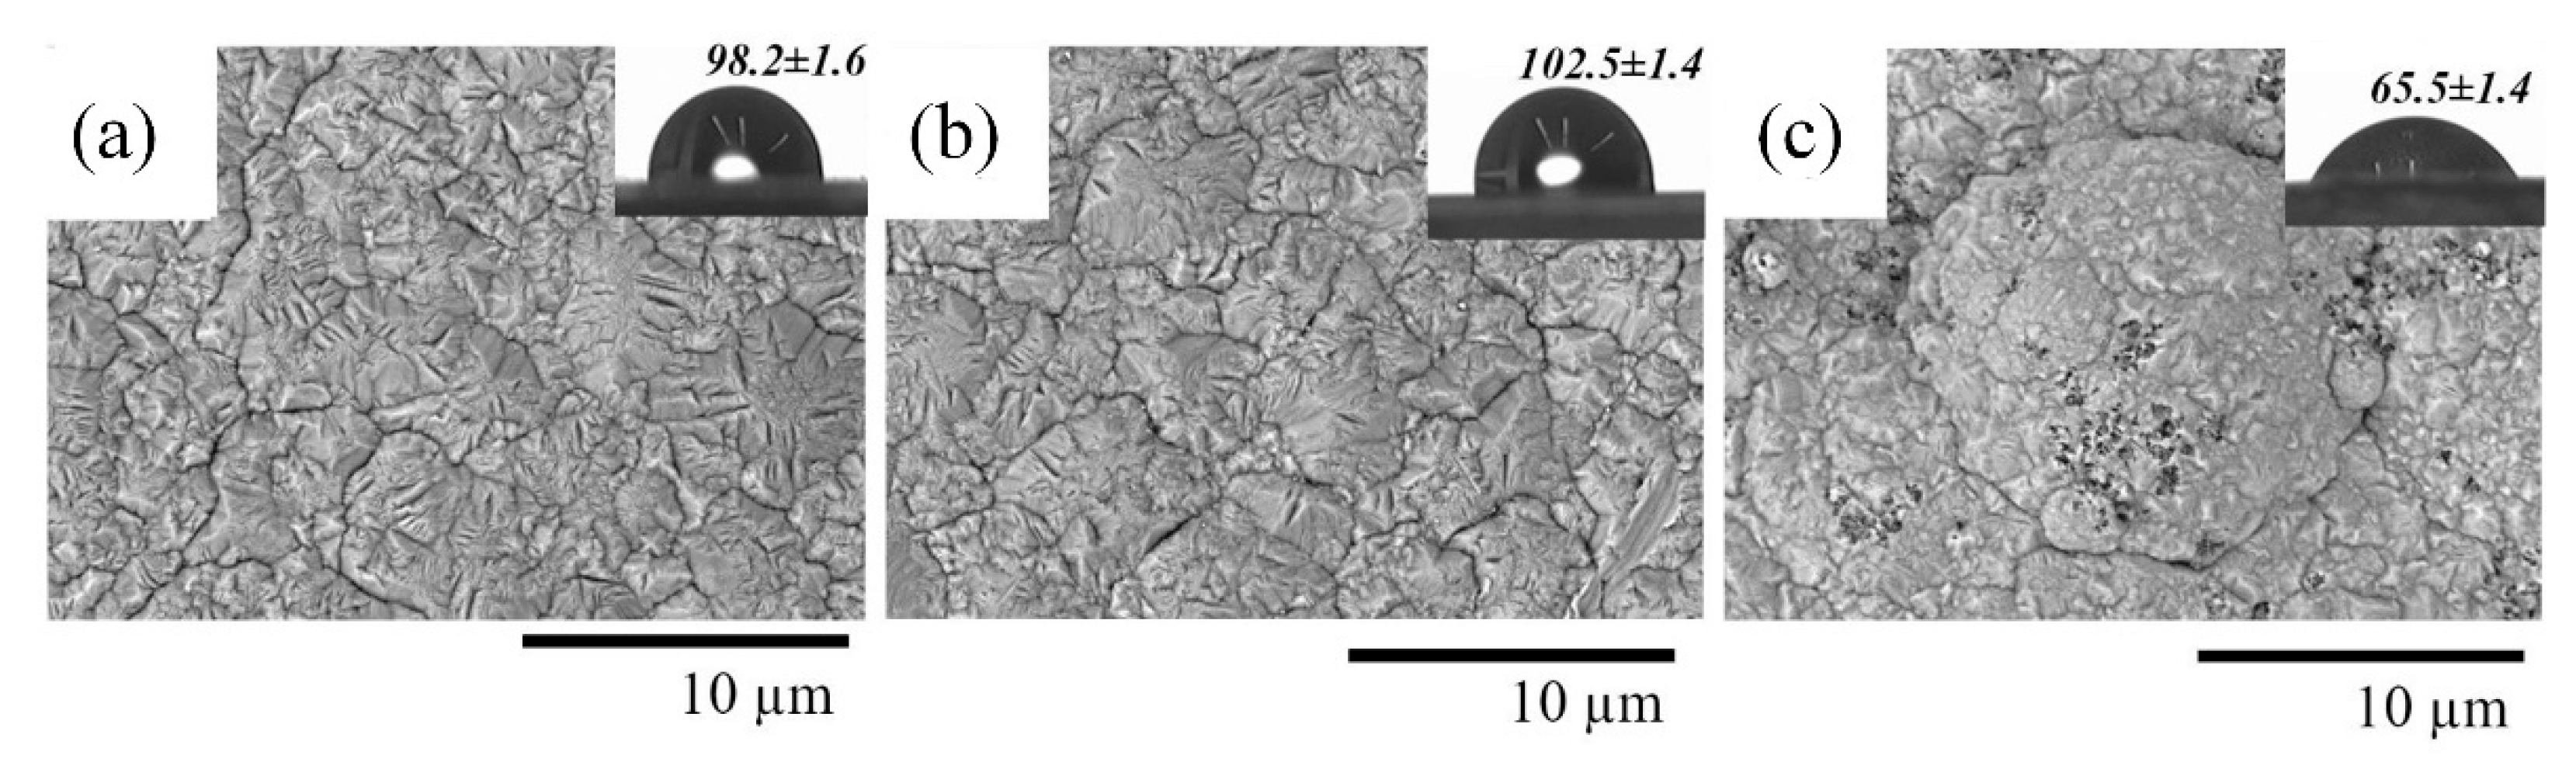
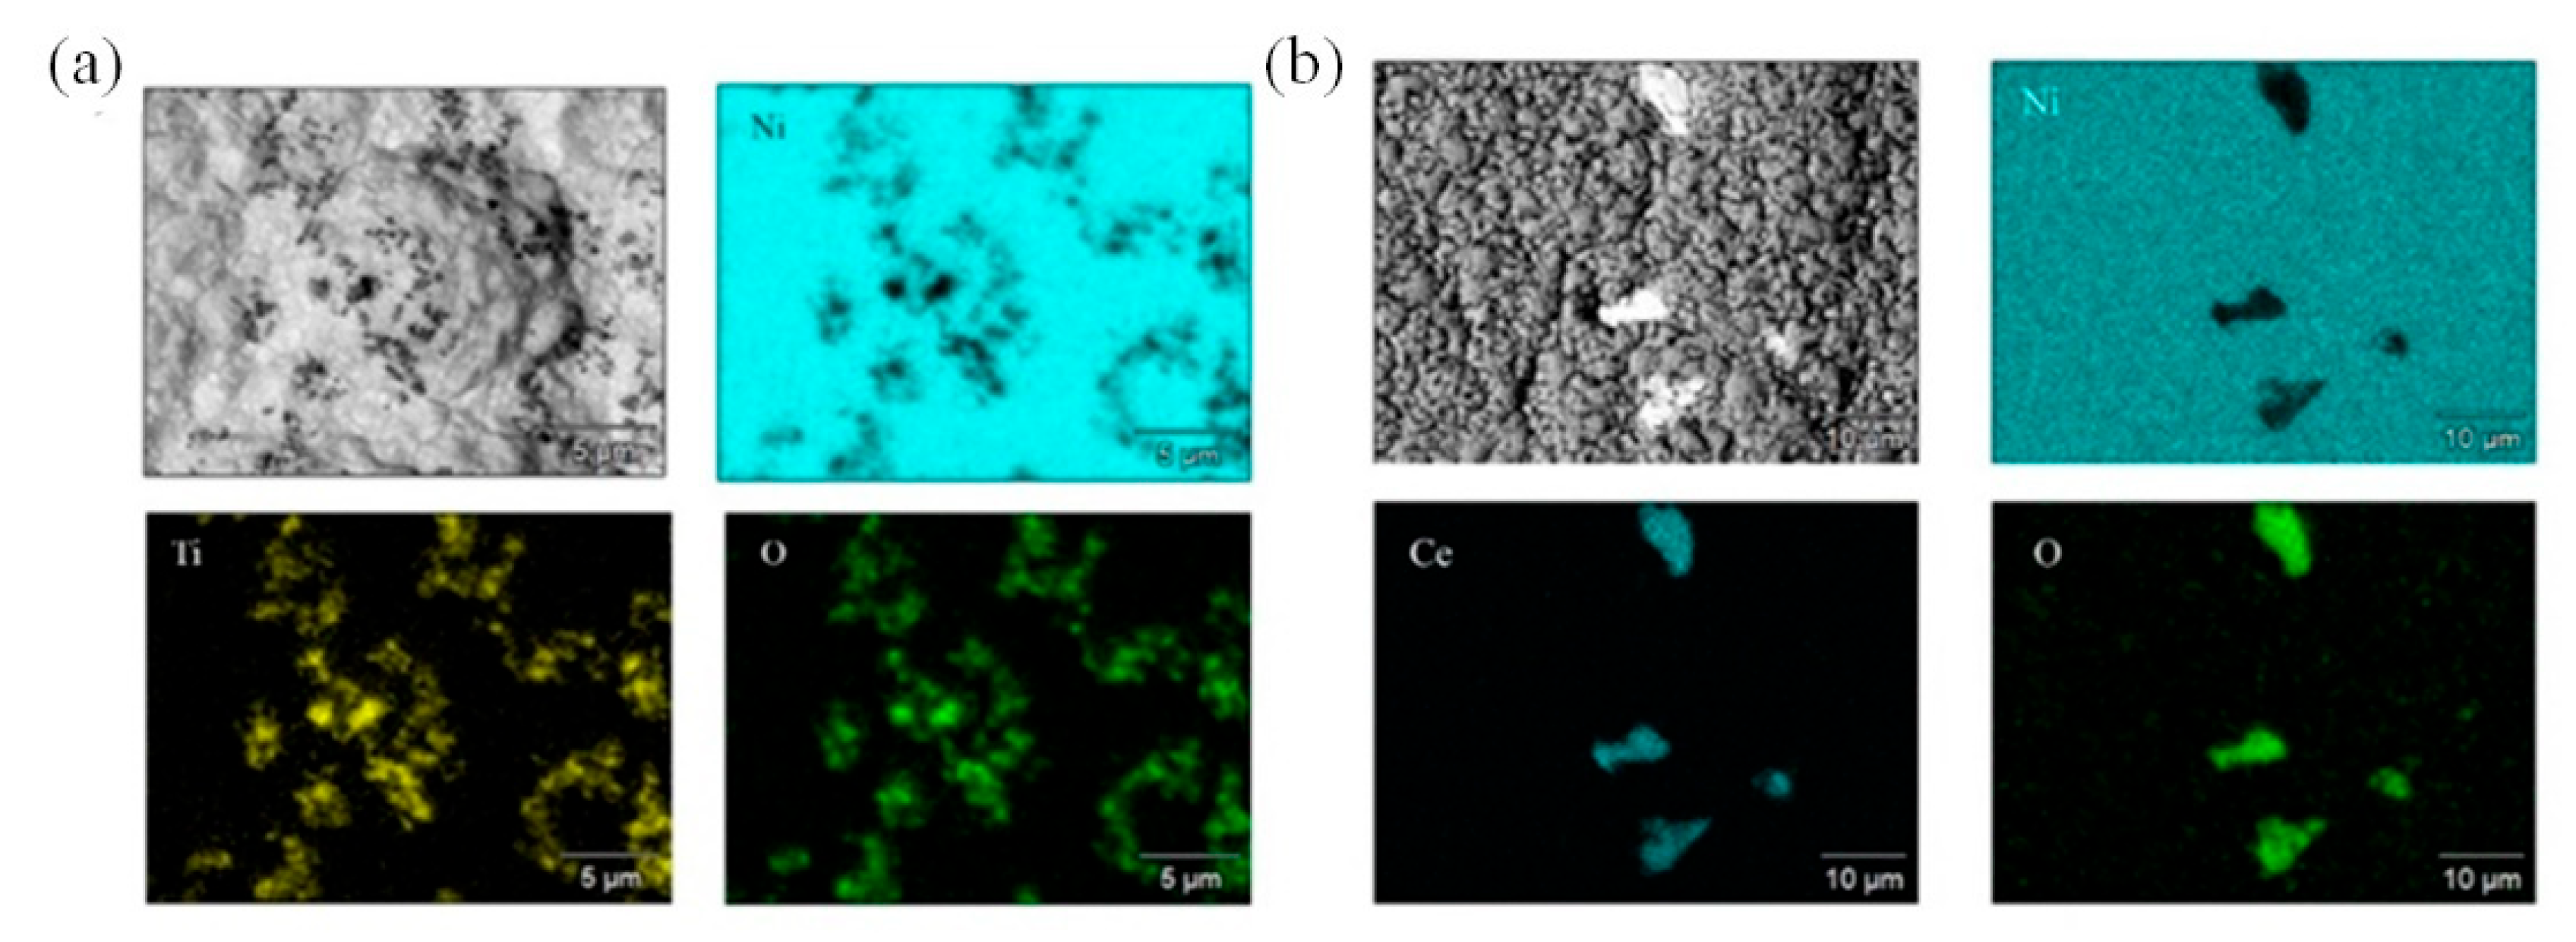
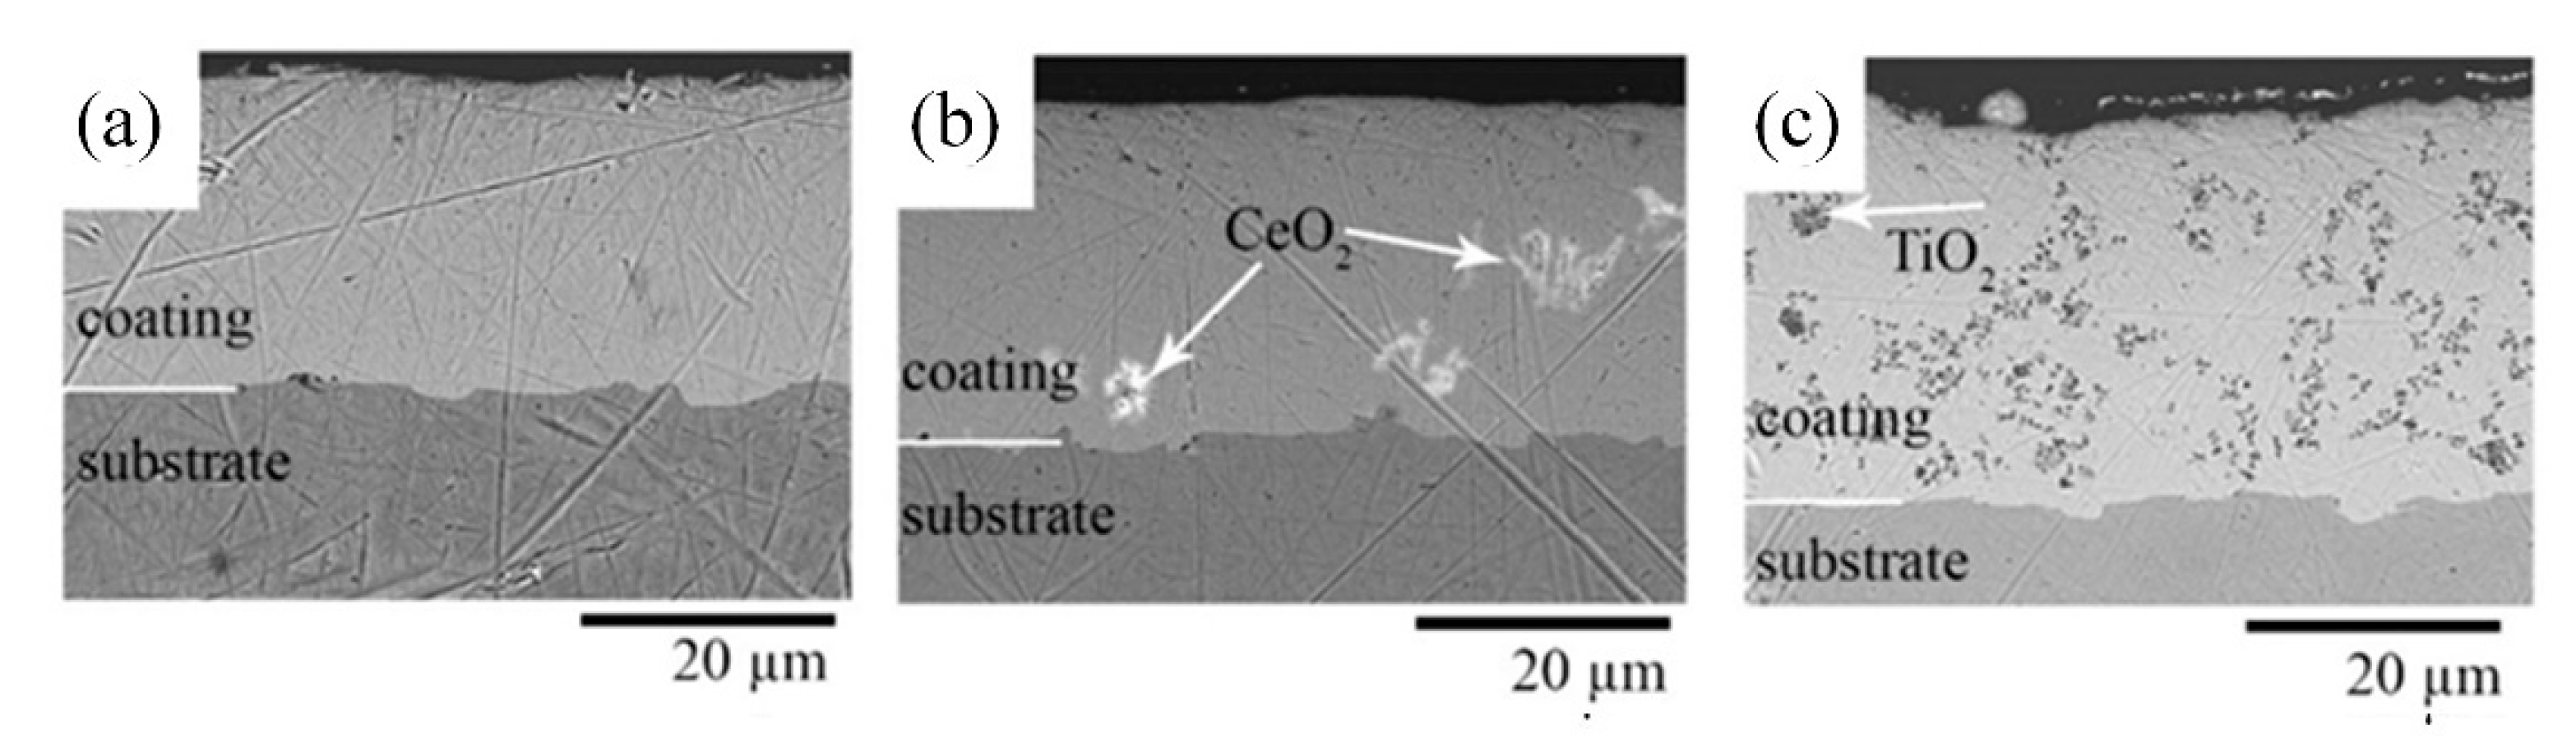
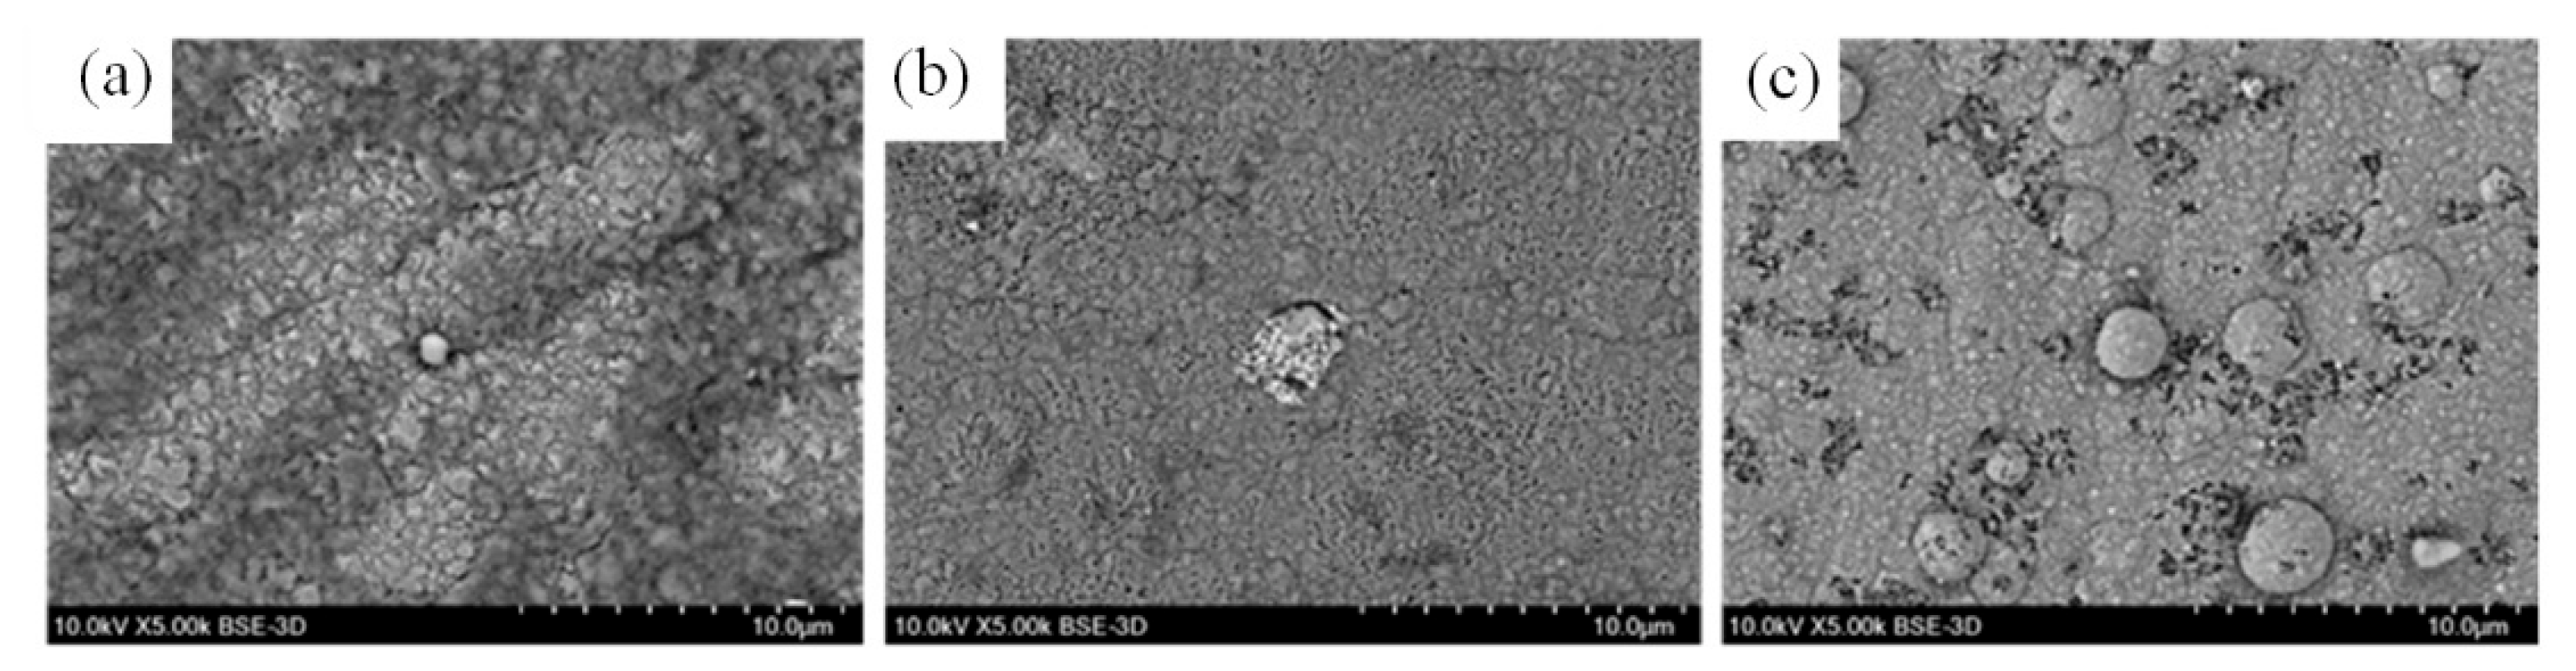
3.1. Microstructure and Phase Composition of Nickel and Composite Nickel-Based Coatings

The SEM micrographs and the surface EDX composition of pure nickel and composite coatings are depicted in Figure 3 and Table 4, respectively. The nickel coating has a uniform structure with relatively straight grain boundaries of an average size of around 2–3 μm, see Figure 3a. No significant change in the surface morphology in comparison with the nickel coating was noticed due to the incorporation of CeO2 particles (Figure 3b), whereas the nickel-TiO2 composite (Figure 3c) reveals a different microstructure. The surface of composite nickel-TiO2 coatings has numerous nodules and spherical structures with a size of 10 μm. A similar microstructure was reported in [32,35,37] and could be explained by increasing the overpotential of nickel electrodeposition in the solutions containing TiO2 particles [57]. Based on the results of the EDX analysis (Table 4), nickel-TiO2 and nickel-CeO2 composite coatings have 2.1 and 0.4 wt.% of incorporated Ti and Ce, respectively.
The contact angle (CA) measurement is frequently utilized as an index for evaluating hydrophilicity. As can be seen in Figure 4, the hydrophilicity of the Ni-TiO2 composite surface was increased by about 33% as compared to pure Ni, while the introduction of CeO2 contributed to a 4.5% increase in the CA, making the surface more hydrophobic. The contact angle (CA) for pure Ni was in good agreement with the reported CA (93–104°) obtained in previous studies [11,58], indicating a relatively hydrophobic characteristic of the pure nickel surface. Moreover, the improvement of hydrophilicity (i.e., lower contact angle) as a result of the incorporation of TiO2 nanoparticles into the Ni matrix in this study corroborates the earlier findings [11,58]. In the case of surface wettability behavior, both surface roughness and chemical composition play a vital role. A broad absorption band in the region of 3000–3600 cm−1 visible in the FTIR spectrum of pure TiO2 nanoparticles (Figure S2) was assigned to the hydrophilic –OH surface bonding groups and their stretching vibration on the surface of TiO2. In addition, the FTIR spectrum can confirm the surface-adsorbed water molecules (H–O–H bending, adsorption band at ~1626 cm−1) for pure TiO2 particles, confirming a strong interaction with water molecules. The photocatalytic activity of TiO2 particles, which can be activated even under visible light [59], could also be considered as another parameter that enhances the wetting ability of the Ni-TiO2 composite surface. During the photocatalytic action of TiO2, an excited state occurs in which the electron from the valence band is excited to the conduction band, and thus the Ti(IV) state reduces to the Ti(III) state. Created oxygen vacancies due to this excitation can be further occupied by water molecules, producing surface adsorbed OH radical groups and, thus, a more hydrophilic surface [59]. In general, the hydrophilicity mechanism on the Ni-TiO2 composite surface seems to be governed by the titania nanoparticles’ efficient dispersion/immobilization, chemical composition (presence of hydrophilic functional group), and their photocatalytic activity.
Generally, rare-earth oxides (REOs) have hydrophobic nature as they have a lower tendency to exchange electrons and form a hydrogen bond with interfacial water molecules, and, thus, they have been considered an effective way of making superhydrophobic surfaces [60,61]. Similar to the current study, the incorporation of CeO2 into Ni-CeO2 composite coatings by electrodeposition leads to the formation of a hydrophobic surface, as previously reported [51,61,62].
The incorporation of CeO2 and TiO2 into the Ni matrix is also illustrated by the EDX mapping results presented in Figure 4.
Ni-TiO2 composite coatings are characterized by an almost uniform distribution of TiO2 in the Ni matrix. However, the CeO2 particles are not homogeneously spread in the nickel matrix, and that could be the reason for the lower influence of these particles on the morphological and structural changes in the volume of the coating (Figure 3). On the other hand, the cross-section SEM images (Figure 5) show that particles are not simply adsorbed on the surface but are distributed in the bulk of the coating. Scratches seen in the SEM cross-section images originate from the polishing procedure.
The uniform structure without visible cracks at the interface between the coating and the substrate was observed. Such a homogeneous distribution of the TiO2 particles in the nickel matrix is expected to enhance the physicochemical properties of the formed composite coating.
XRD patterns of pure Ni, Ni-CeO2, and Ni-TiO2 composites are presented in Figure 6. The XRD pattern of the Ni coating (Figure 6) shows the main peaks at 44.1° and 52.2°, which correspond to the nickel (111) and (200) crystal planes typical for the fcc structure. The main peaks in the XRD pattern of the Ni-TiO2 coating are shifted compared to the standard XRD pattern of nickel (111) plane at 44.51° and (200) plane at 51.84° (JCPDS No. 04-0850), the 2θ of the crystal planes is slightly shifted to lower angles due to the lattice distortion as a result of TiO2 particles in the nickel matrix composites [33]. XRD patterns of Ni and Ni-CeO2 coatings overlap each other, indicating that the inclusion of CeO2 particles into the coating does not change the crystallographic structure of the matrix. A possible explanation could be attributed to the small number of incorporated CeO2 (Table 4), which possesses a larger mean size (~46 μm) compared to TiO2. For Ni-TiO2 coating, the increase of (111), (220), and (311) planes’ intensity in the face-centered cubic lattice of Ni was determined. A similar trend was also reported by Thiemig and Bund [33]. In the electrodeposition process, the presence of TiO2 and CeO2 particles as nucleation sites could promote the formation of new grains and inhibit the growth of the already formed grains. According to Debye-Scherrer’s Equation (2), the size of the crystallites calculated for the Ni (111) plane was 18–45 nm.

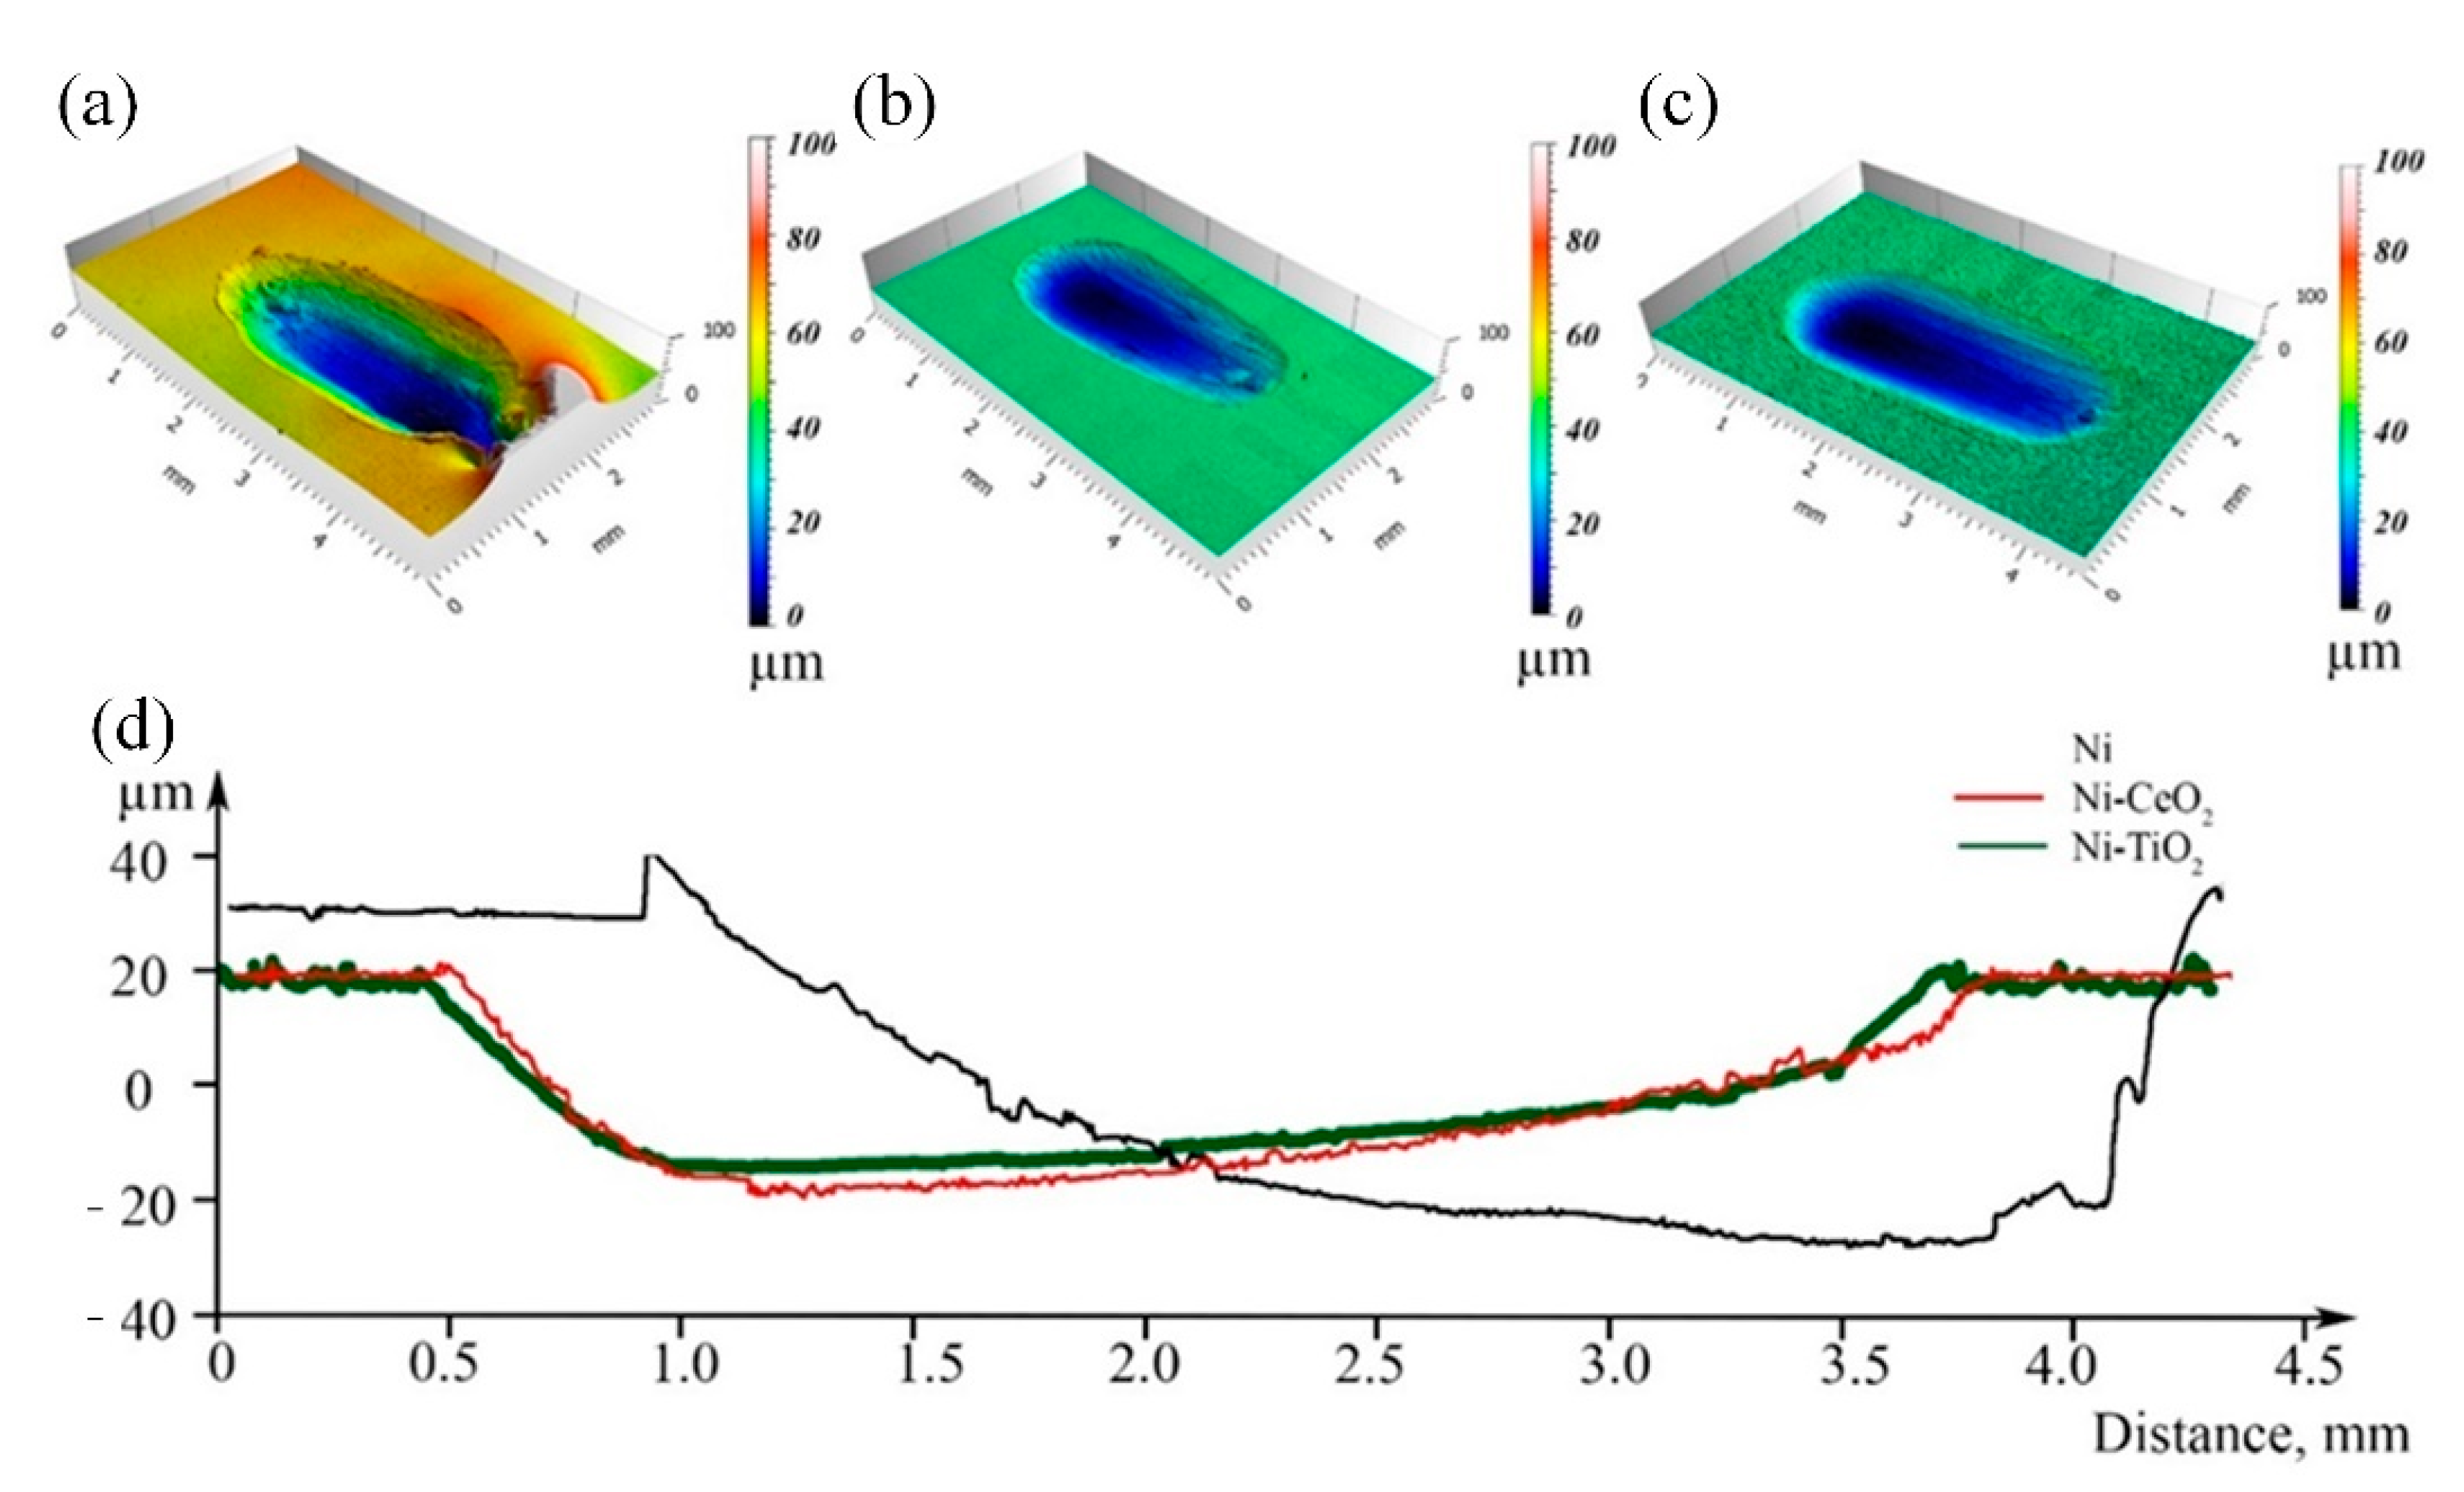
3.2. Physicochemical Properties

The surface properties of coatings, such as microhardness and microroughness, which have critical effects on the protective performance, are presented in Table 5. As can be seen, no significant change in the surface roughness (Sa = 0.26 µm) was observed when the CeO2 was incorporated into the Ni matrix, whilst it increased by about three times for the Ni-TiO2 coating. This result is in line with the study of Stanković et al. [35], who reported a substantial increase in microroughness in the presence of TiO2. The microroughness of nickel coatings deposited from tartrate electrolyte is ca. 2 times lower compared to Ni coatings deposited from the Watts electrolyte.
As shown in Table 5, the inclusion of CeO2 and TiO2 particles in the nickel matrix improved the microhardness by ~20% and ~40%, respectively. The increase in measured hardness of the composite coating containing CeO2 and TiO2 is usually attributed to the Orowan dispersion hardening mechanism [36,64,65]. However, in the examined case, the particle size of the used CeO2 and TiO2 was much larger than the grain size of the Ni matrix. Therefore, the impact of the Orowan hardening can be neglected. As the crystallite sizes of the Ni matrix of these two coatings are similar, the rule of the mixture has the main impact in the microhardness [66]. In this case, the change of microhardness is mainly attributed to the fraction of CeO2 and TiO2 particles embedded in the metallic matrix, and it can also be affected by the current density and the deposition time [25]. Compared to coatings from the standard Watts electrolyte (269.46 ± 12 [14]), and the Watts electrolyte that operates at ambient temperature (201 HV [67]), Ni coatings obtained in the present contribution have lower microhardness (191 ± 10 HV), which could also be caused by significant differences in pH of the electrolyte [14]. Here it is important to mention that we based the comparison on the experimental results provided by references [14] and [67] not in a sense of comparable electrolyte parameters, but as a reference of the absolute standard that is usually in use in the industry.
The profiles of wear tracks on the surface of the obtained nickel and composite coatings are presented in Figure 7. The wear track of the Ni coating, Figure 7a, is far wider than that of the composites (Figure 7b,c). Moreover, cracking and spalling on the worn surface of the pure Ni coating can be observed. This shows that without incorporating CeO2 and TiO2 particles into the Ni matrix, its wear resistance is significantly lower.
In the case of the co-deposition of nickel with TiO2 (Figure 7b) and CeO2 (Figure 7c), the depth of the wear tracks significantly decreased. This indicates that the incorporation of CeO2 and TiO2 particles in the Ni matrix can largely reduce the wear of the nickel-based composite coatings. Besides the clear reduction in wear depth, no plastic deformation was observed for either the coatings with CeO2 or TiO2, whereas the Ni coating was severely deformed. No significant differences were observed concerning the wear resistance based on the type of particles used, TiO2 or CeO2. The largest difference between the two types of coatings was associated with the surface roughness after the deposition, which was highest when TiO2 was used. The composite with embedded CeO2 particles had a similar surface roughness compared to the pure Ni coating.

3.3. Corrosion Properties

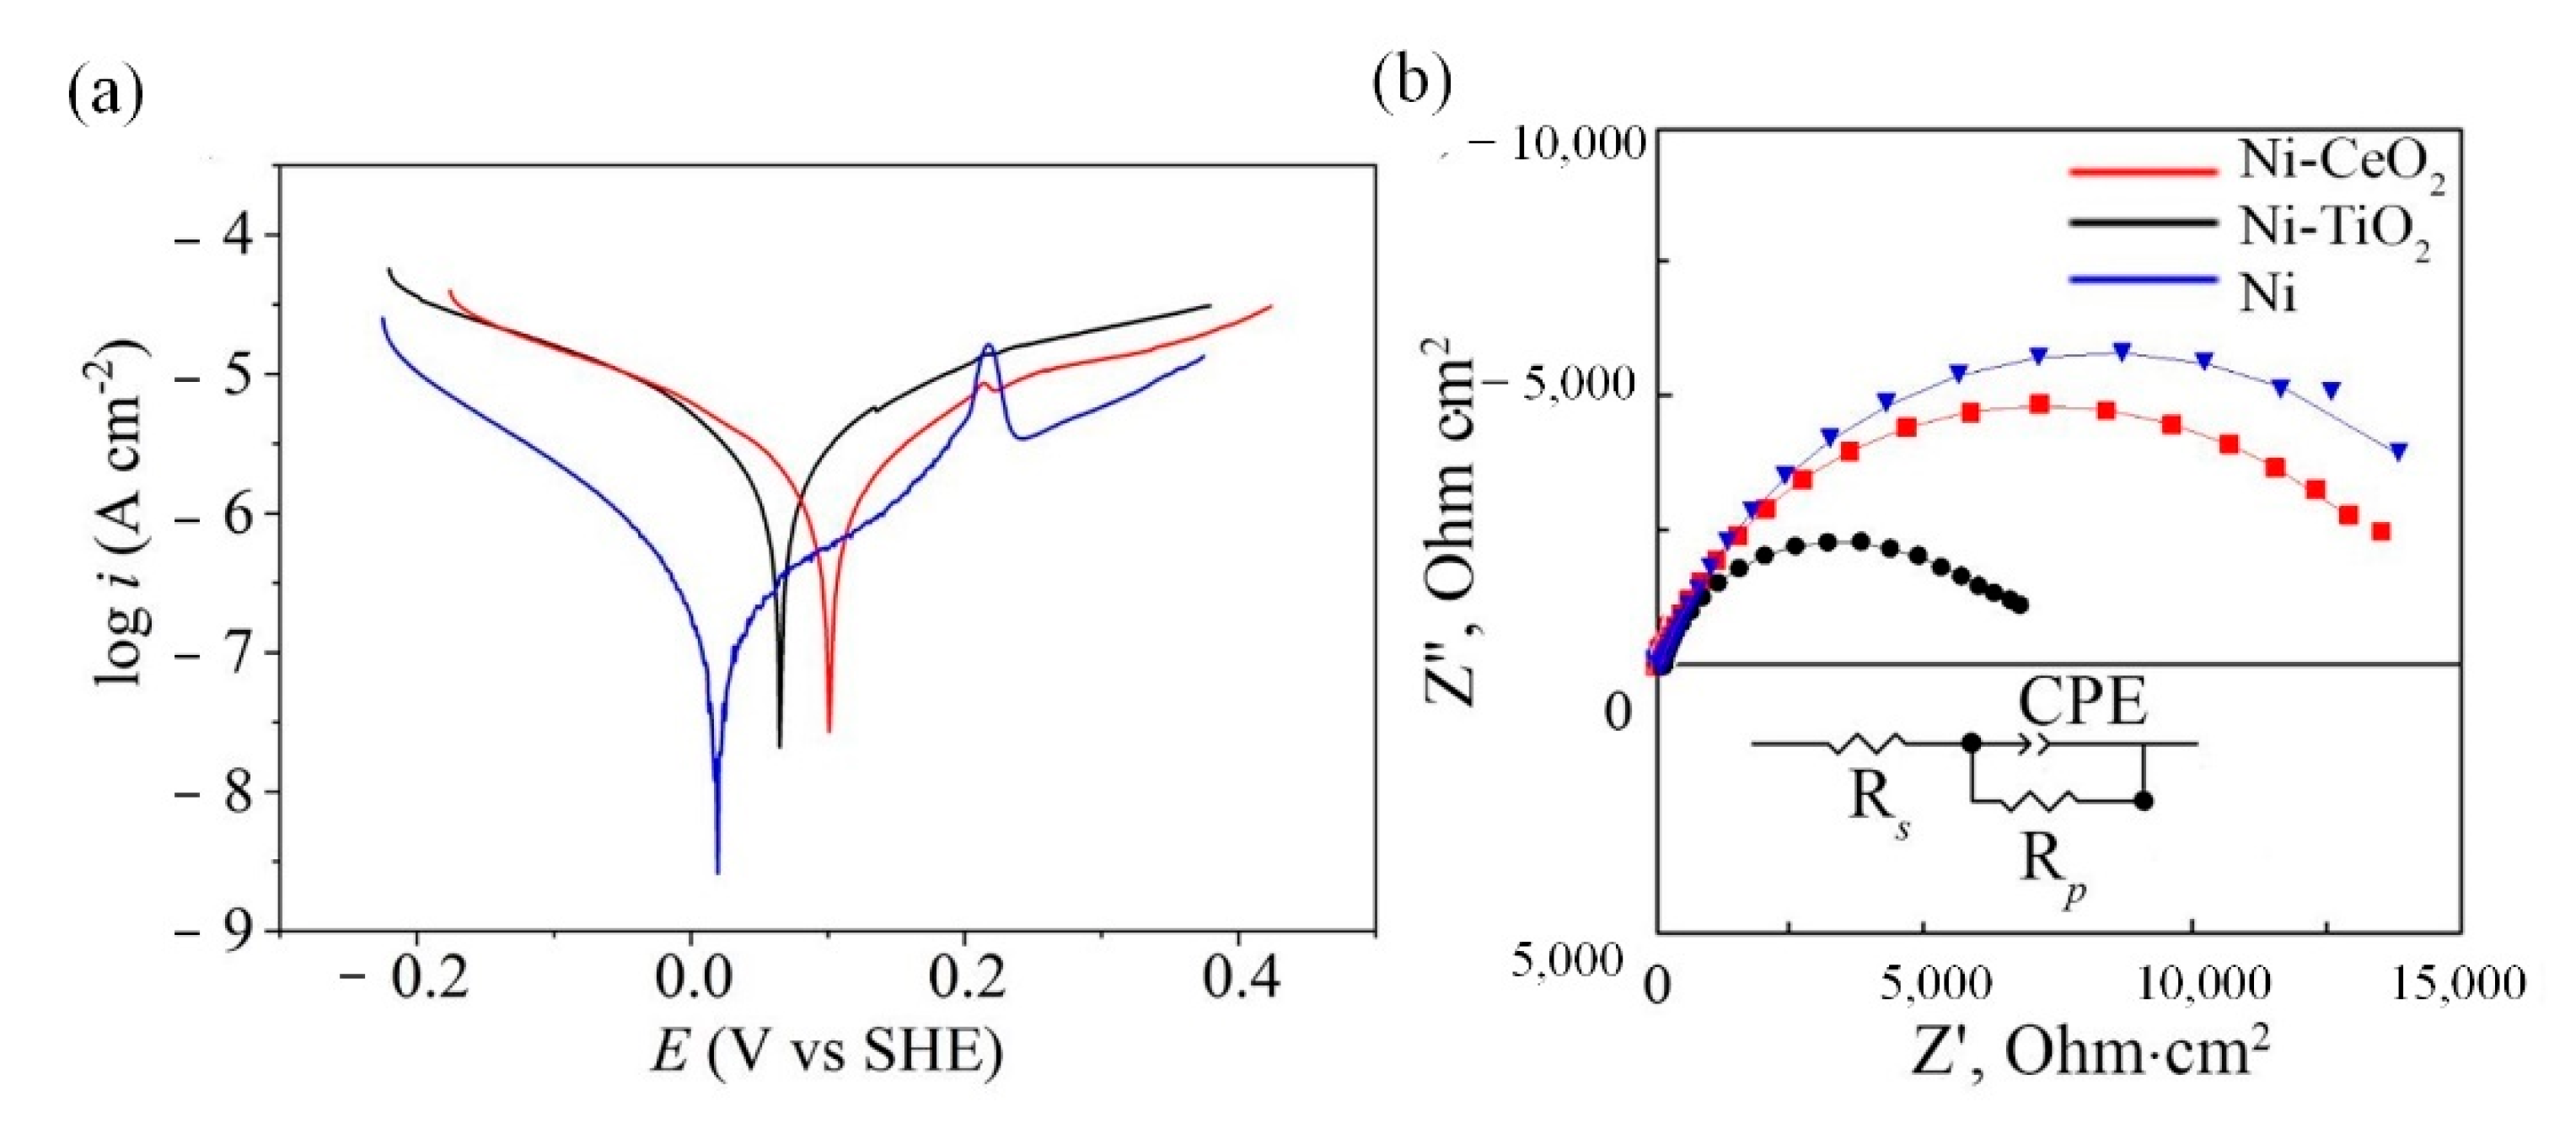
3.3.1. Potentiodynamic and EIS Measurements

Figure 8 shows potentiodynamic polarization curves (a) and Nyquist EIS plots (b) of pure Ni, Ni-CeO2, and Ni-TiO2 composite coatings. The main electrochemical parameters were extracted from the potentiodynamic polarization curves and are represented in Table 6. The corrosion current density icorr and the Tafel slopes bc and ba were extracted from the Tafel region of polarization curves.
The corrosion potential (Ecorr) of Ni-CeO2 and Ni-TiO2 composite coatings shifts toward more positive potentials compared to Ni by the values of 81 and 47 mV, respectively (Table 6). The introduced heterogeneities are the primary reason for worsening the corrosion resistance, as indicated by the values of the corrosion current density icorr (Table 5). Surprisingly, there was no reinforcement of the nickel matrix, and the included particles did not act as a physical barrier to the propagation of defects [68]. On the contrary, the presence of the CeO2 and TiO2 particles in the metallic matrix formed galvanic microcells, which increased the dissolution of the nickel matrix, resulting in the initiation of local corrosion. Similar worsening of corrosion properties of coating in presence of TiO2 were discussed by Kasach et al. [69]. For Ni-CeO2 coating, which revealed almost similar corrosion resistance and degradation mechanisms as pure Ni in corrosion tests in 0.5 M NaCl solution, the air entrapped in the structures can also prevent the hydrophobic composite coating from being wetted by the corrosion medium through the limited solid contact area, and thus lower the corrosion rate [62]. This tendency can be clearly noticed between Ni-CeO2 and Ni-TiO2 composite coatings. Various coating formulations containing CeO2 particles have shown inhibitory and self-healing properties because OH– ions released during corrosion interact with CeO2 particles and formed stable hydrated CeO2 [70,71]. In a Ni composite matrix, CeO2 could therefore prevent corrosion propagation by blocking the electrolyte’s diffusion paths.
The lowest icorr and respectively the lowest corrosion rate vcorr among the studied coatings was shown by pure nickel coating, 0.07 ± 0.072 μA/cm2 and 0.75 μm/year, respectively. The difference in values of the corrosion current density indicates that in the 0.5 M NaCl solution, the pure nickel coating has higher corrosion resistance than composite coatings. Nevertheless, these values are of the same order of magnitude, indicating that the surface resistance is not compromised dramatically. The low corrosion rate (0.00075–0.0032 mm/year) of the obtained coatings shows their high corrosion resistance in a commonly used NaCl media.
Similar conclusions can be made from the analysis of the EIS data (Figure 7b and Table 7). For all examined coatings, Nyquist plots obtained in 0.5 M NaCl solution have the shape of a distorted semicircle. Both Ni-CeO2 and Ni-TiO2 composites are characterized by smaller impedance responses as compared to Ni coating (see Figure 7b). This indicates lower corrosion resistance of the composite coatings. The equivalent circuit used for spectra fitting is shown as an inset in Figure 7b. The equivalent circuit includes solution resistance (Rs), polarization resistance Rp, and the capacitive response of the Ni coating described by a constant phase element (CPE) [72]. The impedance of the CPE element can be calculated based on the following equation (Equation (4)):
Z C P E = 1 Y 0 ( j ω ) n
where Y0 is the CPE constant; n (0 ≤ n ≤ 1) is the mathematical factor showing the deviation from the ideal capacitive impedance response; j is the imaginary unit; ω is an angular frequency, rad−1. The CPE shows ideal capacitive behavior when its exponent n = 1, while the value of n below 1 corresponds to the degree of surface inhomogeneity. The equivalent circuit showed a good fit for all impedance plots (Figure 8b). The highest value of Rp was observed for the pure nickel coating, which can be ascribed to the smaller number of surface defects and pores on the surface due to the lack of galvanic microcells. The lowest corrosion resistance was shown for Ni-TiO2 coatings, for which the values of Rp were almost two times lower than those for Ni and Ni-CeO2 coatings. Moreover, the CPE constant Y1 fitted for Ni-TiO2 coating had the largest value, indicating lower capacitance of the double layer and decreased corrosion resistance. The corrosion behavior of a coating is usually closely related to its hydrophilic properties, such that the increase in hydrophilicity leads to a decrease in corrosion resistance [69]. As expected, the Ni-TiO2 composite coating revealed weaker corrosion resistance due to its higher hydrophilic characteristics, which increase the exposure area to aggressive media compared to the other composites.
The long-term corrosion behavior of the studied coatings was examined by weight loss. The concentration of nickel ions released during 3.5 months of exposure to 0.5 M NaCl solution with an initial pH of 5.4 is depicted in Figure 9 and Table 8, respectively. Increasing the pH during the dissolution of nickel can be described by the mechanism explained in our previous study [72], which includes the following steps: Ni→NiOHads→NiOH+. In the last step, hydroxide ions will be released according to the reaction as follows (Equation (5)):
NiOH+→Ni2+ + OH
The highest amount of Ni2+ ions (~88 ppm) was released into a 0.5 M NaCl solution after 3.5 months of immersion of the Ni-TiO2 composite coating, which is in accordance with the polarization and EIS data. For Ni and Ni-CeO2 coatings, the concentration of released ions was 3.8 ppm and 2.3 ppm, respectively, after 20 days of testing in 0.5 M NaCl and then decreased to about 0.79 ppm and 0.18 ppm, respectively. The possible formation of nickel hydroxide in the bulk solution could be considered as an explanation for the changes in pH of the solution. The lower corrosion resistance of composites could be related to the pores and microcracks formed in the coatings during the deposition process and subsequent drying. The possible interconnection of the pores and microcracks might extend from the surface to the bulk of the material and, therefore, decrease corrosion resistance [73].

3.3.2. Surface Characterization of Coatings after Corrosion

To ascertain the surface states of Ni, Ni-CeO2, and Ni-TiO2 composite coatings after immersion in 0.5 M NaCl for 3.5 months, high-resolution XPS spectra were obtained (Figure 10). Peaks corresponding to the binding energy states of Ni2p, O1s, and Cl2p were analyzed. The complex spectrum of Ni2p3/2 was deconvoluted into peaks at 851.26 eV and 854.53 eV, respectively attributed to Ni0 and oxidized surface Ni atoms (NiOx) [72], as well as the peak ascribed to Ni(OH)2, which exhibits at ∼857 eV [72,74]. Finally, a wide Ni2p3/2 Ni2+ satellite feature is present in the 860–865 eV range. O1s peak was deconvoluted into 4 peaks. Two main components, peaking at 530.2 and 531.7 eV, are characteristic of Ni oxides and hydroxides, respectively. It is worth mentioning that the Ni-TiO2 spectral shape is significantly different compared to Ni and Ni-CeO2 and has a dominant feature at 531.6 eV that can be attributed to TiO2 [75]. There is different oxide chemistry which might be connected with corrosion resistance. The formation of oxidized forms of nickel has been reported in previous studies for Ni-TiO2 [76] and Ni-CeO2 [77] surfaces.
Compared with Ni, the Ni-TiO2 coating in particular reveals altered surface chemistry, with a significantly higher share of oxidized nickel. This difference is confirmed by the eminent presence of Ni2O3 peak at both Ni2p and O1s spectra (Figure 10b,e, respectively). On the other hand, the surface chemistry registered for Ni-CeO2 coating is much alike Ni, which may indicate similar corrosion resistance and degradation mechanisms under 0.5 M NaCl immersion and is confirmed by the higher value of Rp obtained by impedance spectroscopy (Figure 8b). This observation is confirmed by the presence of chlorides in the layer of corrosion products [78], which were detected at ∼197.6–198 eV. The analysis showed that the amount of Cl at the surface of studied samples changes in the following ascending order: Ni > Ni-CeO2 > Ni-TiO2, Figure 10. During corrosion examinations, localized interaction of chloride ions with the nickel matrix of the deposited coatings can cause the breakdown of the surface passivity. Afterward, localized corrosion attack of the substrate in the form of pitting will occur. The most probable mechanism of the corrosion attack in this case includes two stages [79]. At first, chloride ions adsorb on the outer surface of the Ni matrix by competitive adsorption with hydroxyl ions. Further, chloride ions intersect on the metal surface, most probably by the place exchange mechanism.
Next, the XPS spectra of Ti2p (Ni-TiO2) and Ce3d (Ni-CeO2) for the studied coatings before and after corrosion tests are depicted in Figure 11, together with the proposed deconvolution model. The Ti2p3/2 peak at 458.91 eV and Ce3d5/2 at 881.42 eV are located at the energies often found in the literature for TiO2 powder [80] and CeO2 powder [81], while metallic Ti and metallic Ce are expected to have XPS peaks at binding energies of 453.7 eV (Ti2p3/2) [82] and 885.01 eV (Ce3d3/2) [83], respectively.
Interestingly, as a result of the exposure, the signal from TiO2 disappears as the species are dissolved throughout the corrosion test, increasing the surface sites active to corrosion. No such observation is performed for Ni-CeO2 coating, where the chemistry of Ce species is intact at the end of the experiment, corroborating high corrosion resistance in electrochemical studies. The composition of Ni, Ni-CeO2, and Ni-TiO2 composite coatings surface after immersing in 0.5 M NaCl after 3.5 months is presented in Table 9.
Long-term immersion of coatings led to the formation of a nickel oxide/hydroxide layer, which is 70.1 at.% and 76 at.% for Ni-CeO2 and Ni coating, respectively. In turn, the Ni-TiO2 coating was almost fully covered with a passive oxide/hydroxide layer (97.6 at.%), indicating the higher tendency of the Ni-TiO2 surface to oxidation/corrosion and explaining a small amount of metallic nickel (2.4 at.%), which might be related to their lower corrosion resistance as indicated by the impedance spectra. It is also supported by the highest release of nickel ions during immersion in 0.5 M NaCl (Figure 9). For Ni-TiO2 composite coatings, TiO2 in galvanic coupled with the Ni matrix acts as a cathode and enhances the dissolution and release of nickel ions. Note that in the case of Ni-CeO2 composites, the amount of the second-phase particles embedded in the matrix was much smaller, resulting in lower local galvanic activity. The dissolution of nickel leads to the mechanical removal of TiO2 particles (Table 9, Figure 12).
Furthermore, elemental analysis of the surface of Ni, Ni-CeO2, and Ni-TiO2 coatings (Figure 10h) showed 0.22, 0.61, and 0.82% of chloride ions, respectively. Compared to pure Ni and Ni-CeO2, the Ni-TiO2 coating revealed 3–4 times more adsorption affinity towards Cl ions when it was exposed to the NaCl medium. A possible explanation for the higher adsorption affinity of the Ni-TiO2 composite towards Cl ions could be related to the presence of specific potential adsorption sites (i.e., Ti and O) on the surface of TiO2 [80], which could preferably allow Cl to be attached to the bridging O on the surface [81].
Surface images of pure nickel and composite coatings after 3.5 months of exposure to 0.5 M NaCl are depicted in Figure 13.
A slight change in the microstructure of Ni and composite coatings after the corrosion test is clearly visible compared to the initial surface (Figure 3). For pure Ni, uniform corrosion was observed. In the case of composite coatings, corrosion is preferentially initiated at the interfaces between TiO2 and CeO2 particles and the Ni matrix. The pitting corrosion can be clearly seen in the case of Ni-CeO2. It can also be noticed from the SEM micrographs that Ni coatings demonstrated better corrosion resistance compared to the composites, which is in line with the XPS results.

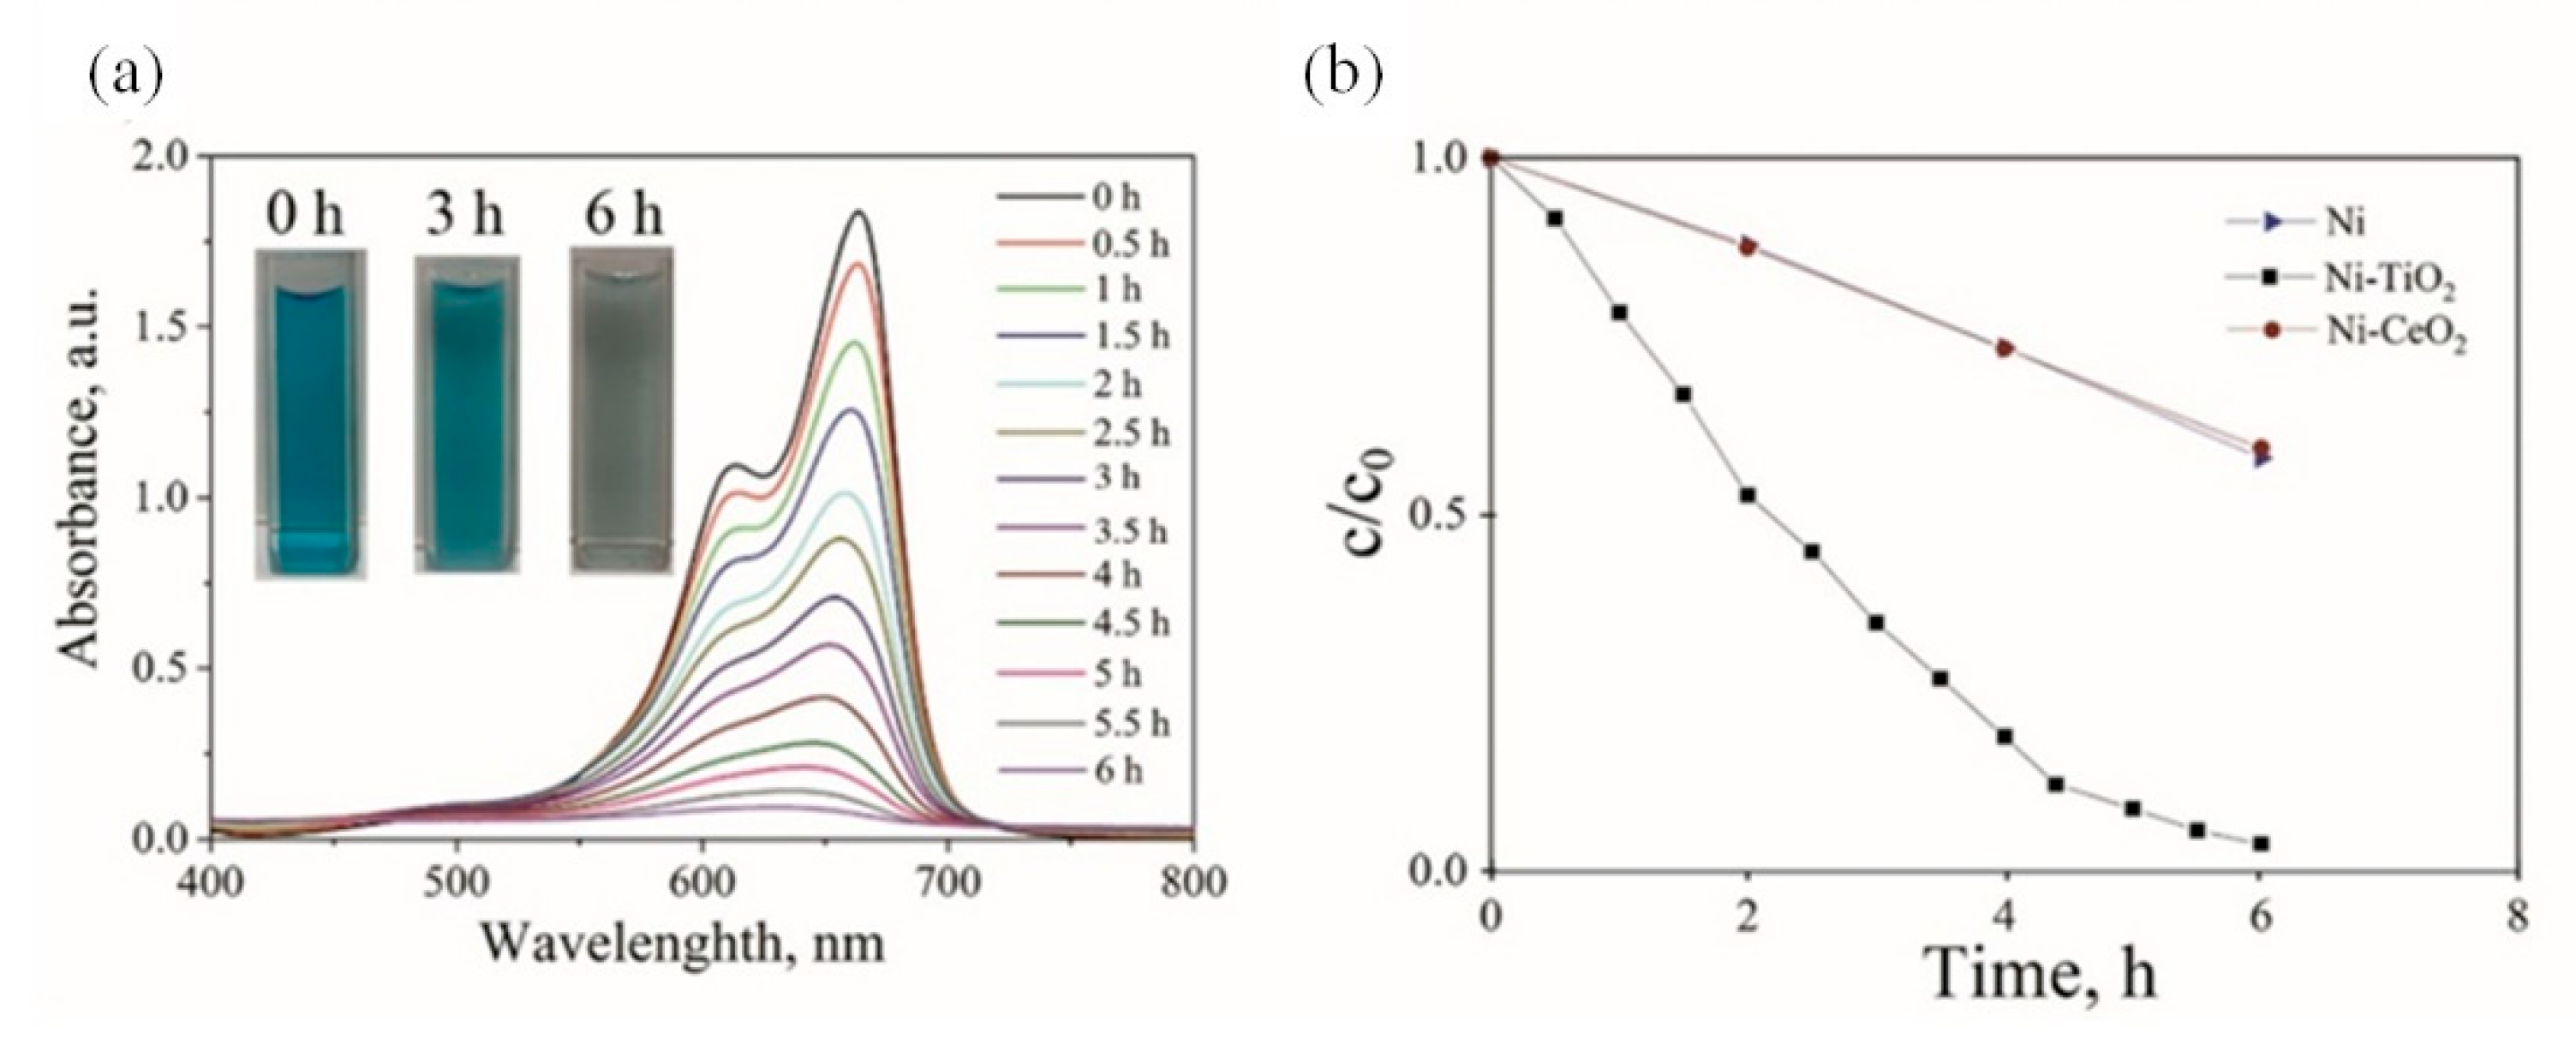
3.4. Photocatalytic Activity

The photocatalytic activity of Ni and composite Ni-TiO2 and Ni-CeO2 coatings was evaluated by measuring the degradation rate of methylene blue (MB) in the aqueous solution. During irradiation, samples were analyzed with a UV–visible spectrophotometer. The mechanism of photocatalytic activity of coatings is explained in Figure S3 and can be explained by the positive holes (h+) and negative electrons (e−) formed on the TiO2 photo-catalyst surface due to the excitation of electrons from the valence band to the conduction band [84,85,86]. As a result, hydroxyl radicals could be produced due to the reaction of the hole with water or hydroxyl ions. The electron in the conduction band is responsible for the reduction of molecular oxygen to superoxide anion. In general, three forms of reactive species, namely, hydrogen peroxides (HO2∙), hydroxyl (HO∙), and superoxide (∙O2−), are considered the main oxidizers of the organic compounds, which are adsorbed on the oxide surface [86,87,88]. In most cases, these generated radicals react with a dye, forming radicals and radical cations, which then mineralize into carbon dioxide, water, and inorganic nitrogen with nitrate ions [86].
The influence of irradiation time (6 h) of Ni-TiO2 composite coatings on the photodegradation of MB using visible-light radiation is presented in Figure 14. Photodegradation of MB by Ni and Ni-CeO2 coatings is depicted in Figure 14b and Figure S4.
The decomposition of MB on the Ni-TiO2 composite coating was 96.2% after 6 h of illumination. The decomposition occurred effectively on TiO2 particles and was related to the high crystalline anatase phase structure of TiO2 (Figure S1). The Ni and Ni-CeO2 coatings showed similar behavior in the degradation of MB after 6 h, which was around 40%.

4. Conclusions

This study was set out to evaluate the deposition of Ni-TiO2 and Ni-CeO2 composite coatings by the conventional direct current electrodeposition process at ambient temperature.
  • The electrodeposition of pure nickel with a current efficiency of approximately 97% was performed in a simple one-step galvanostatic deposition regime from the solution based on a green buffer agent (Rochelle salt) compared to a traditionally used solution with boric acid;
  • The incorporation of CeO2 and TiO2 particles in the Ni matrix increase the wear resistance of the nickel-based composite coatings by 2 times and microhardness by 1.2 and 1.4 times, respectively. The results of this investigation showed that composites possess multifunctional properties that can open new promising exploitation opportunities for these types of materials;
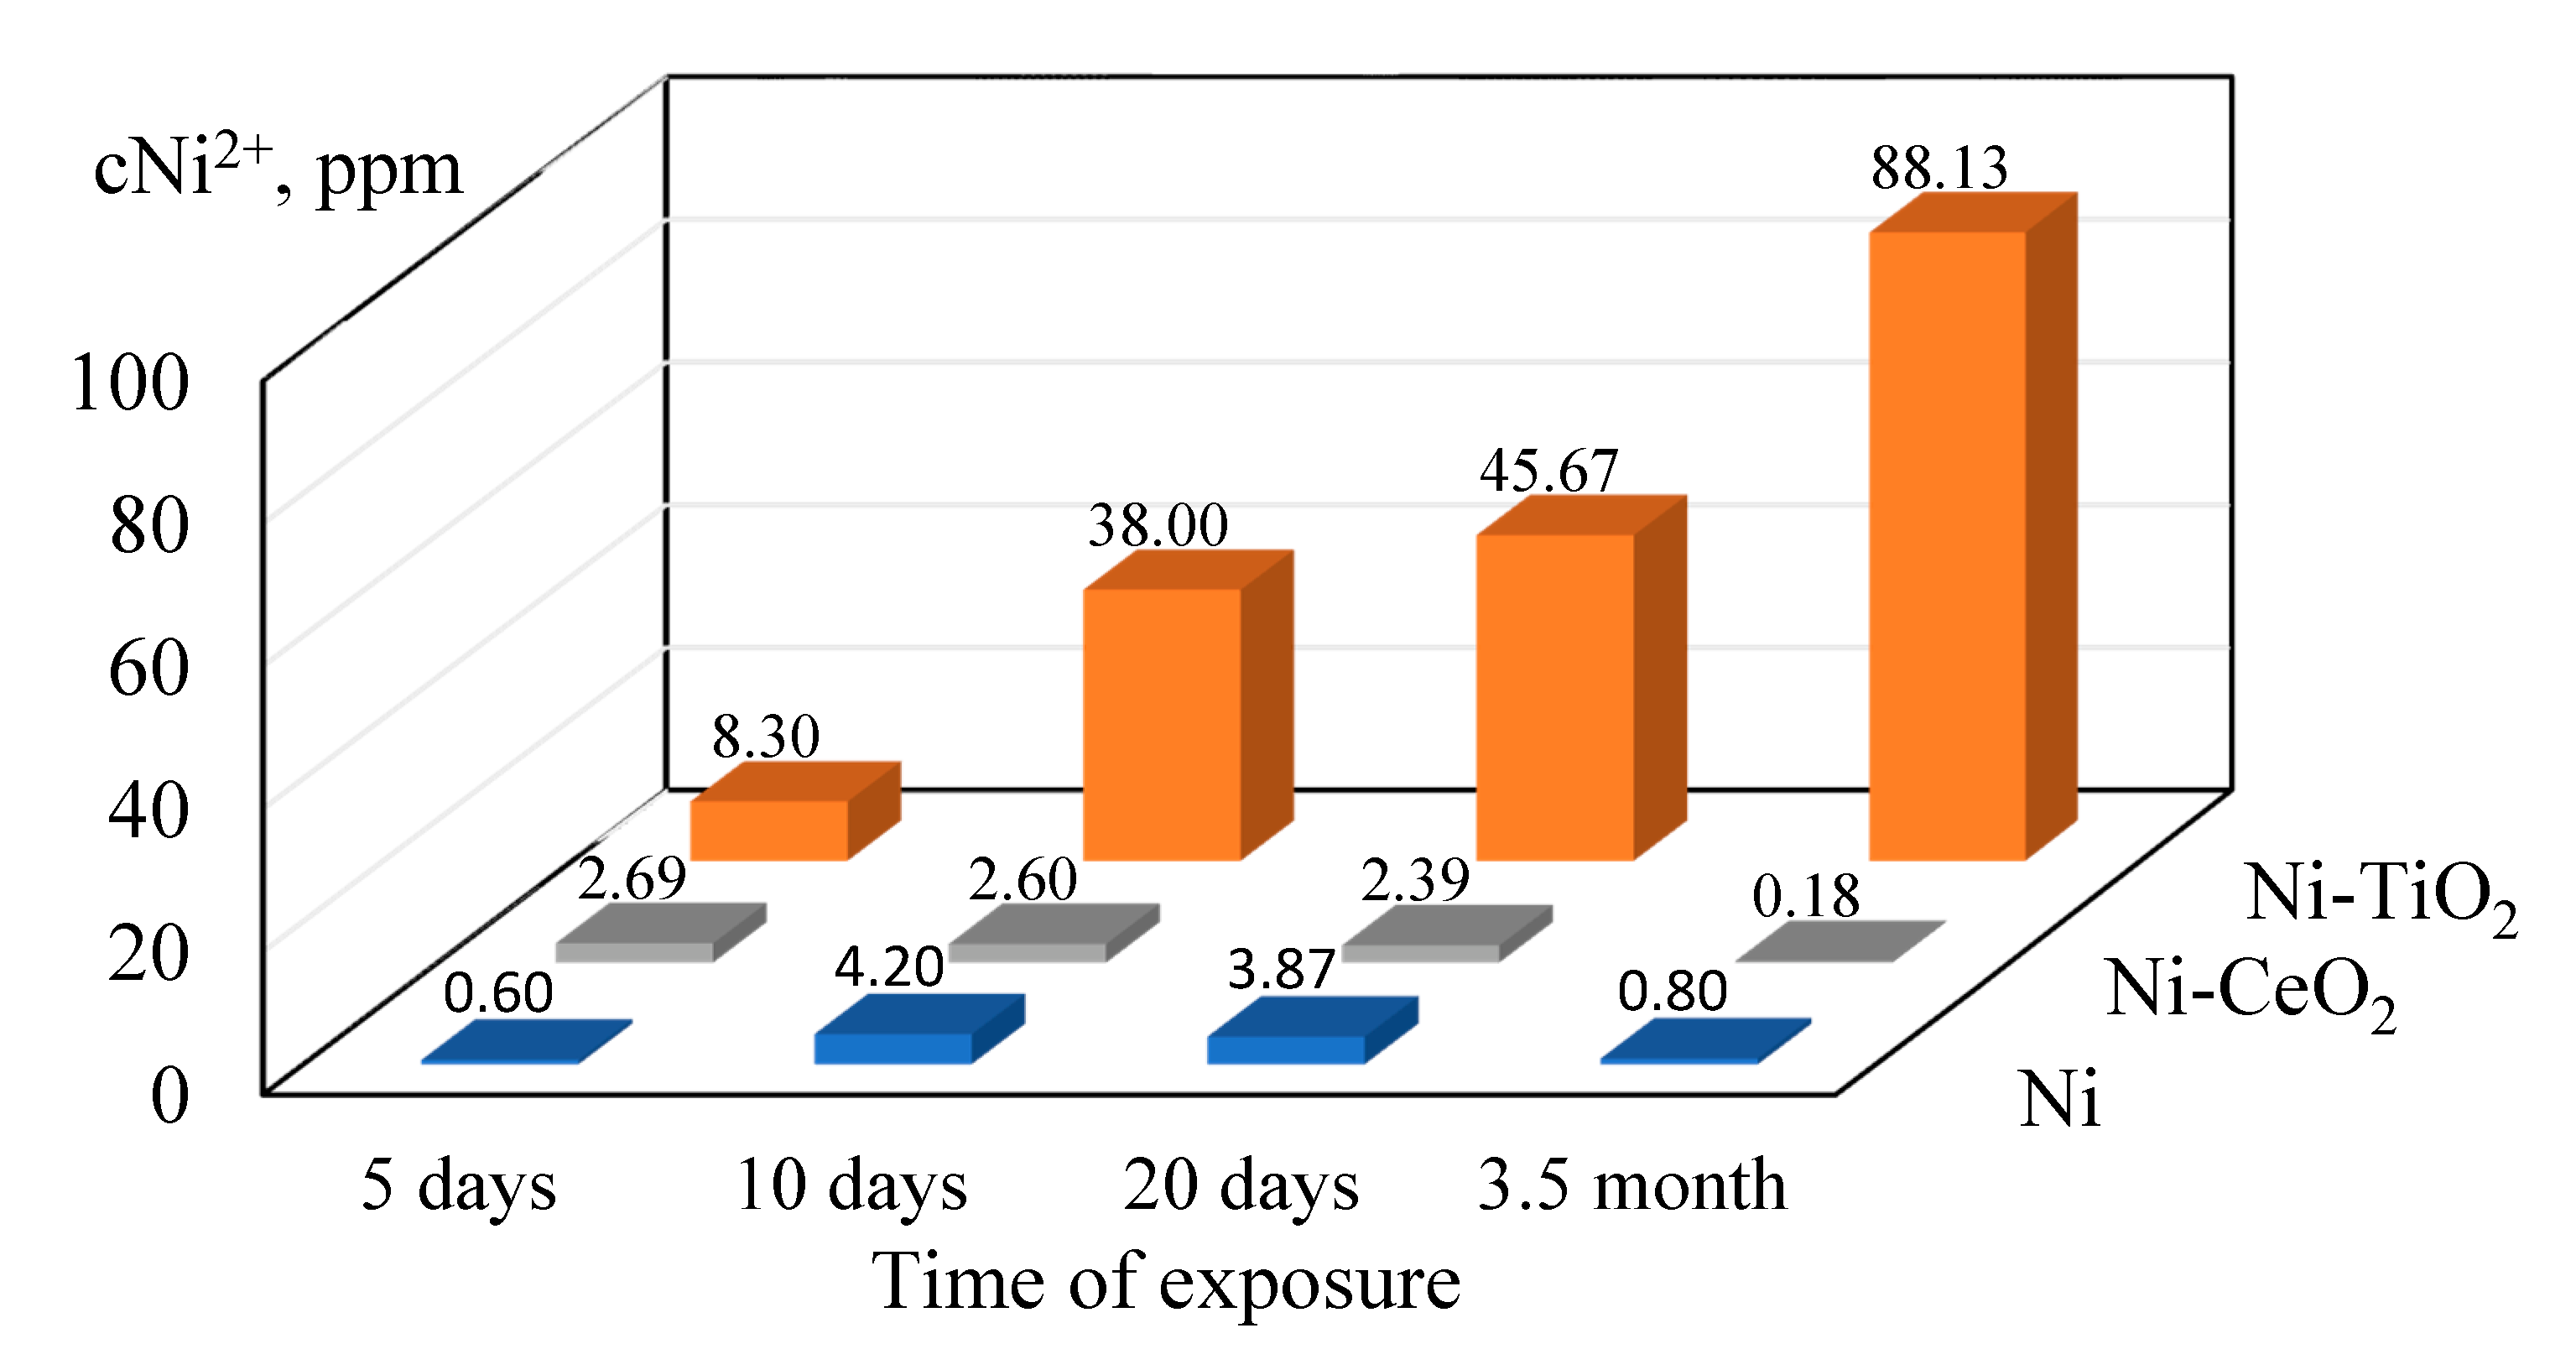
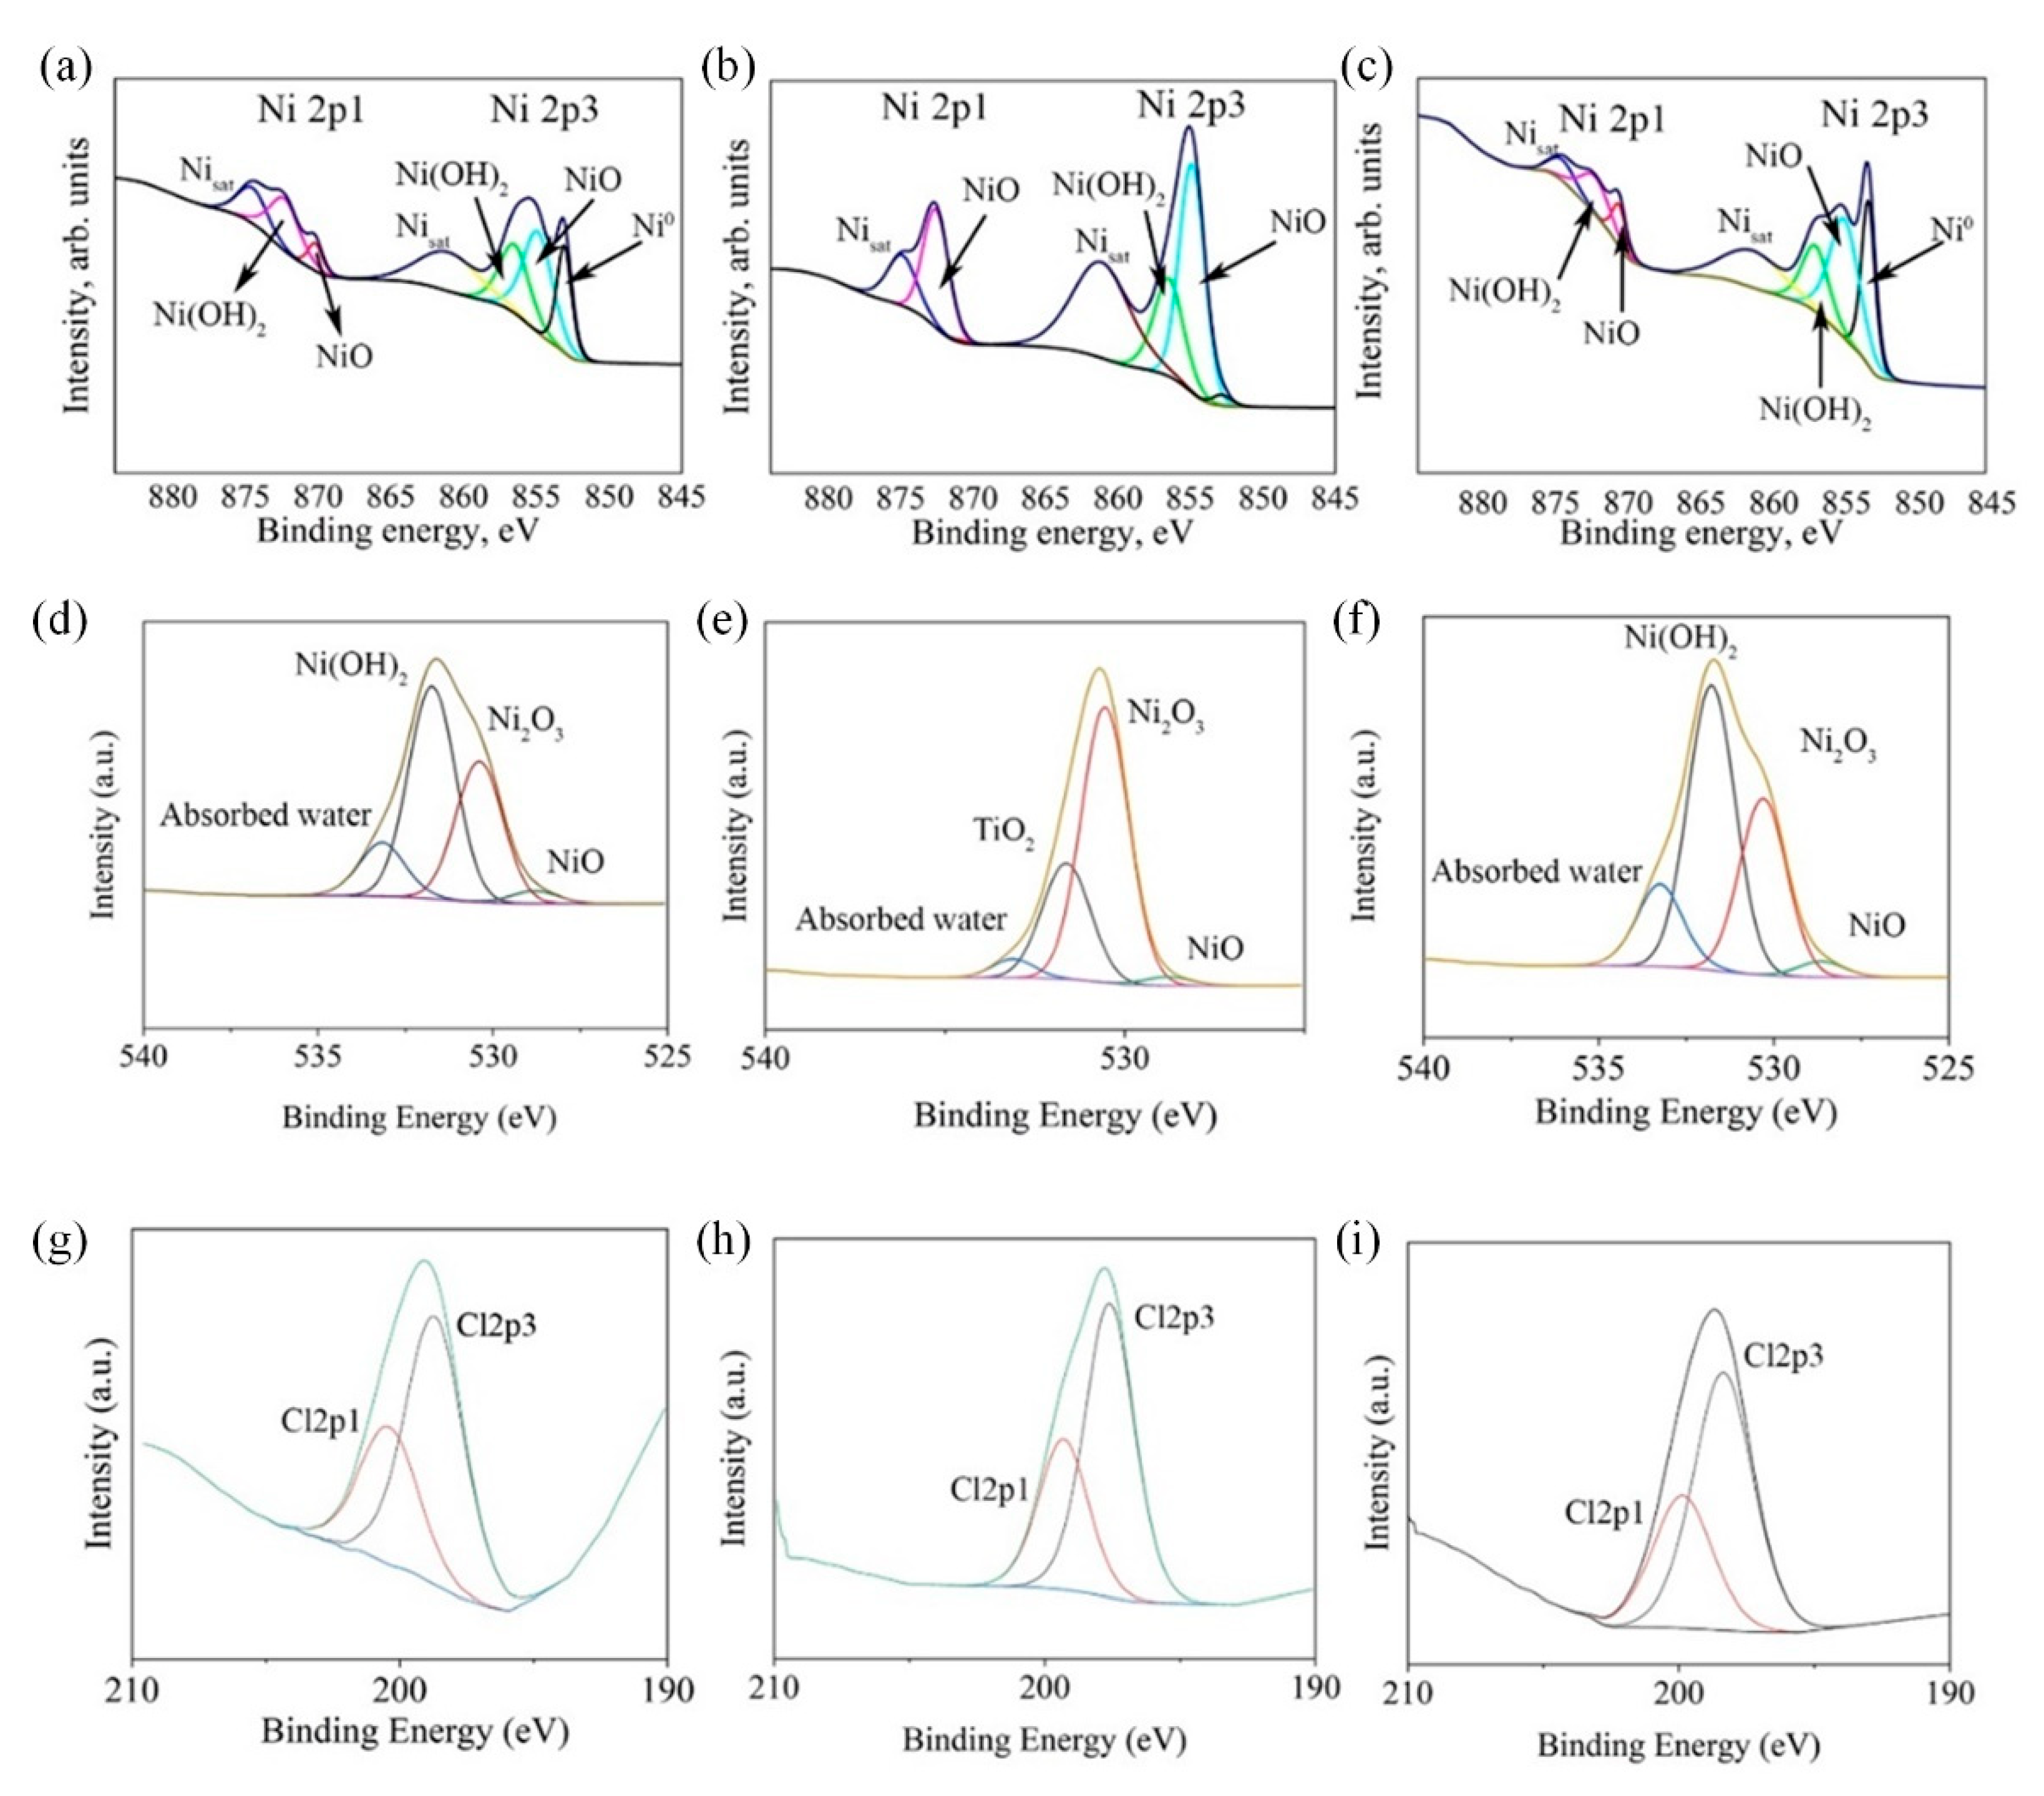
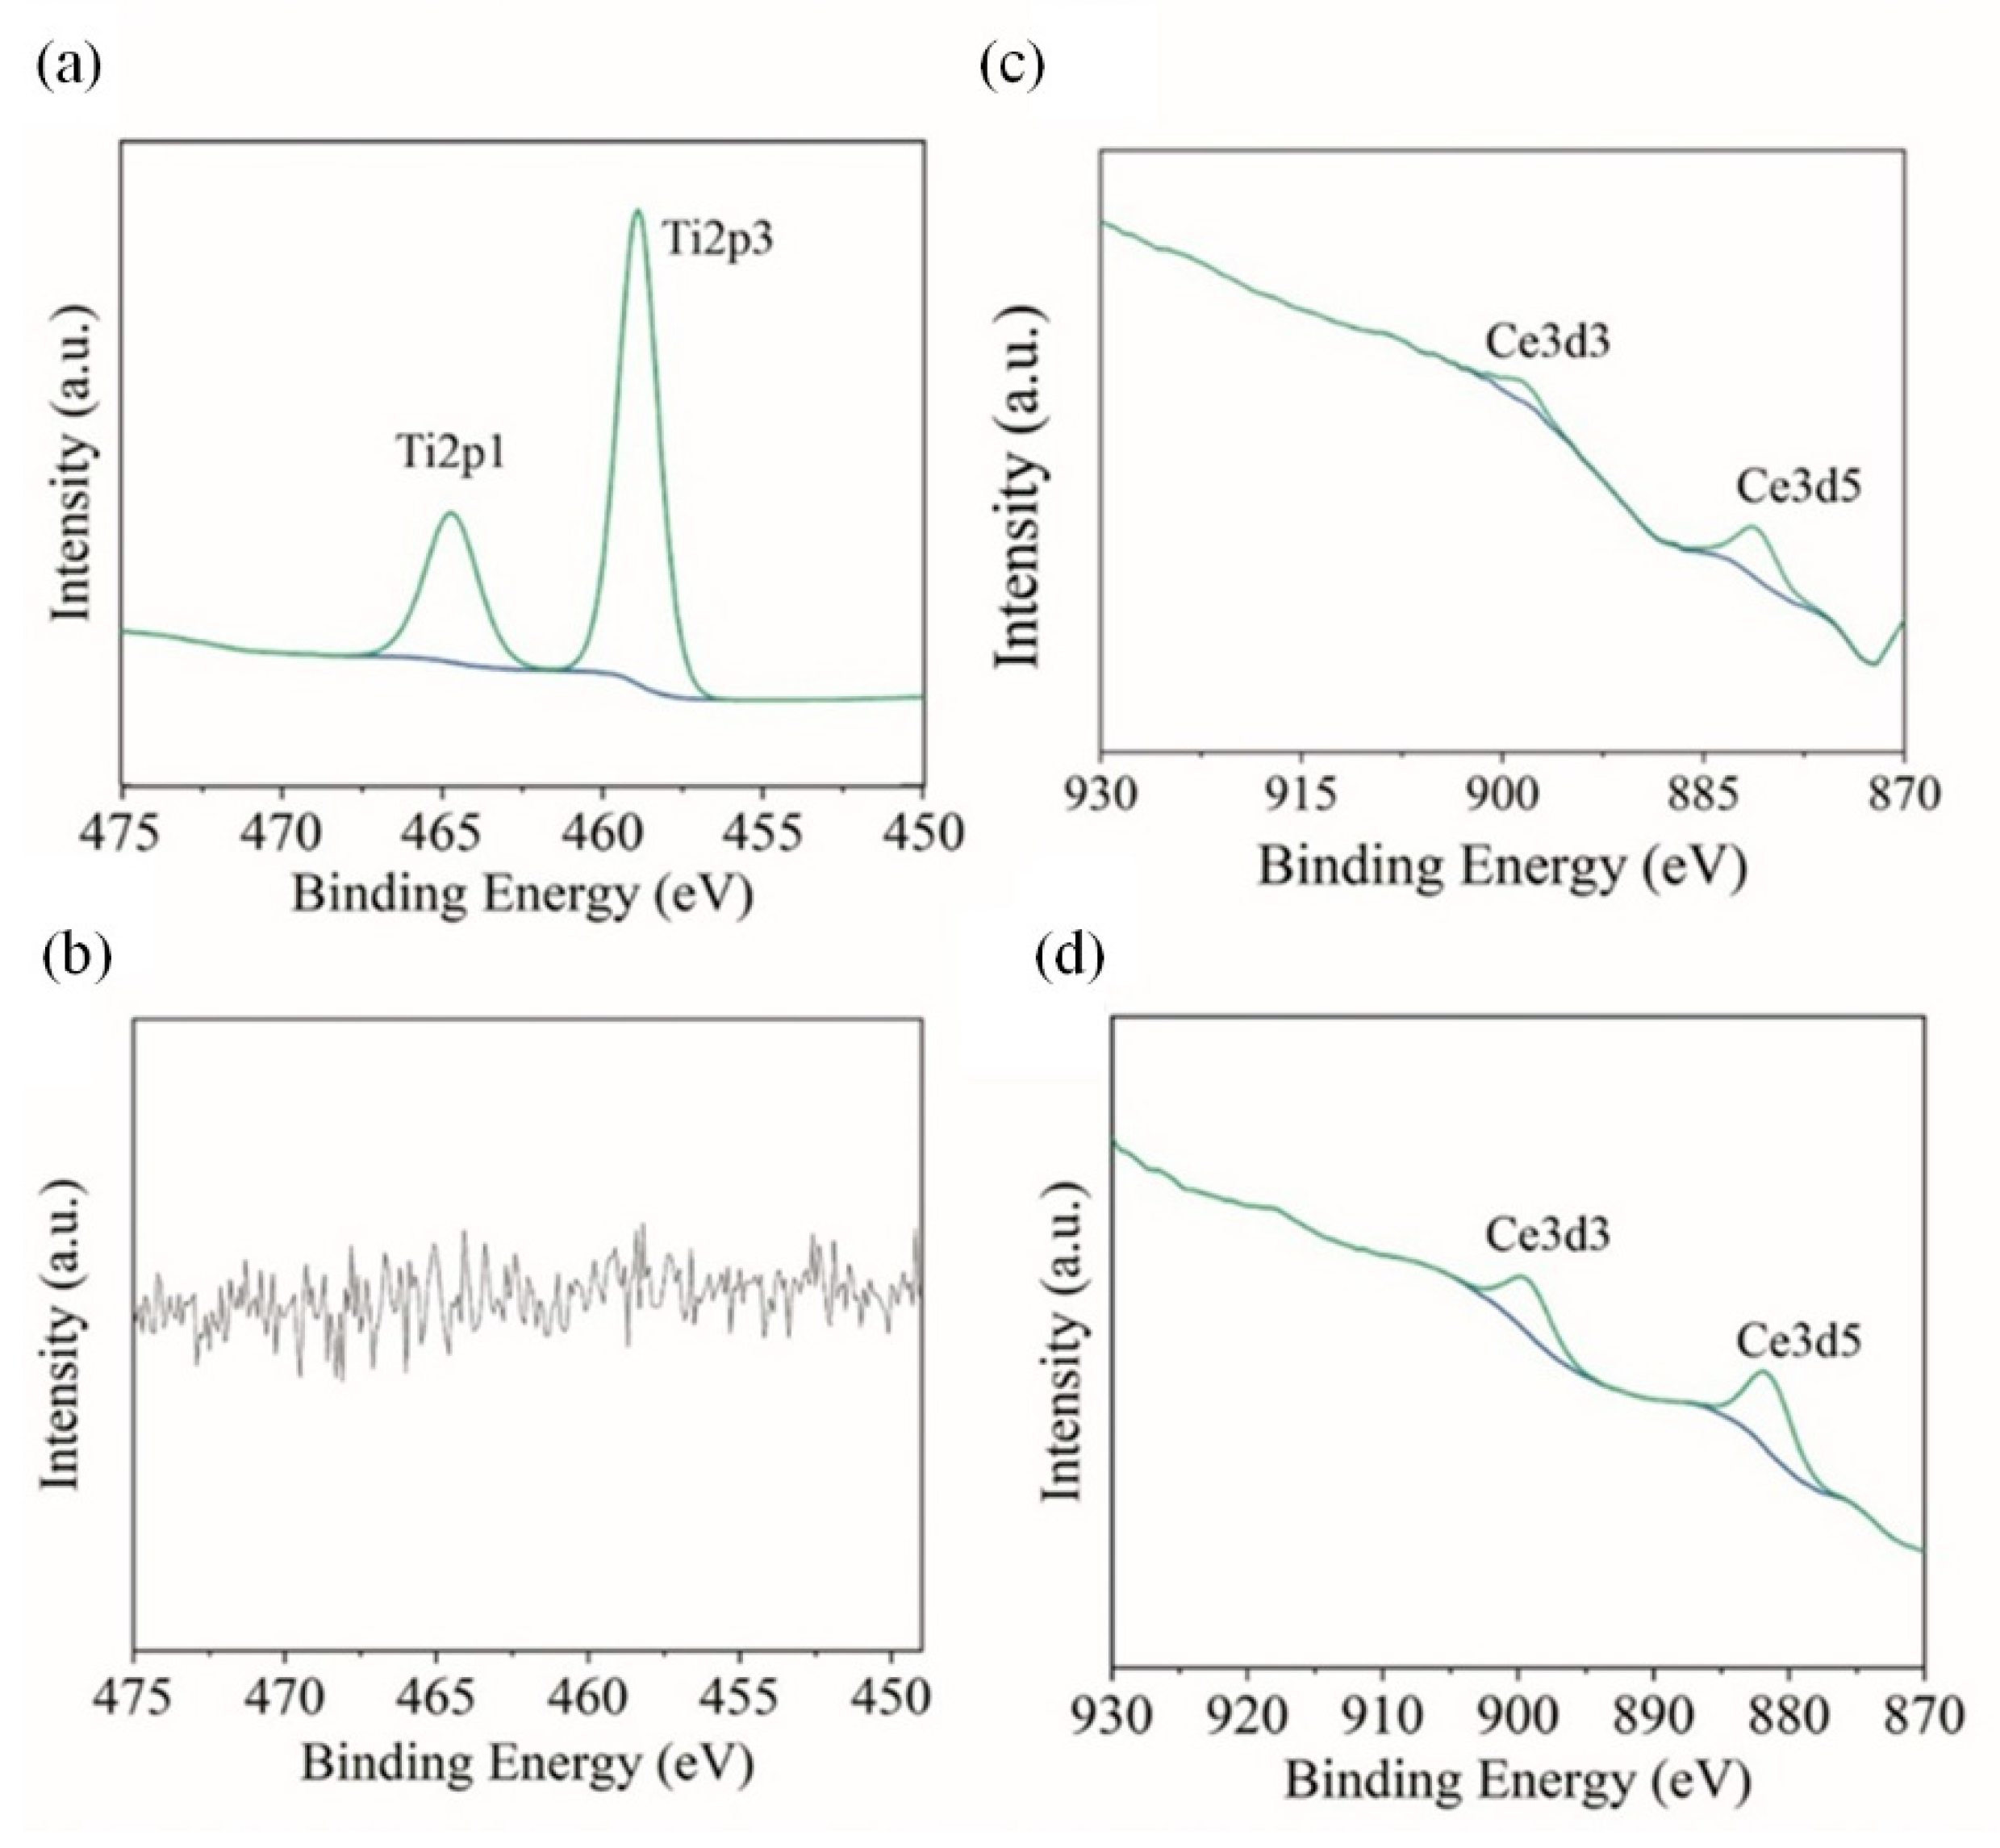
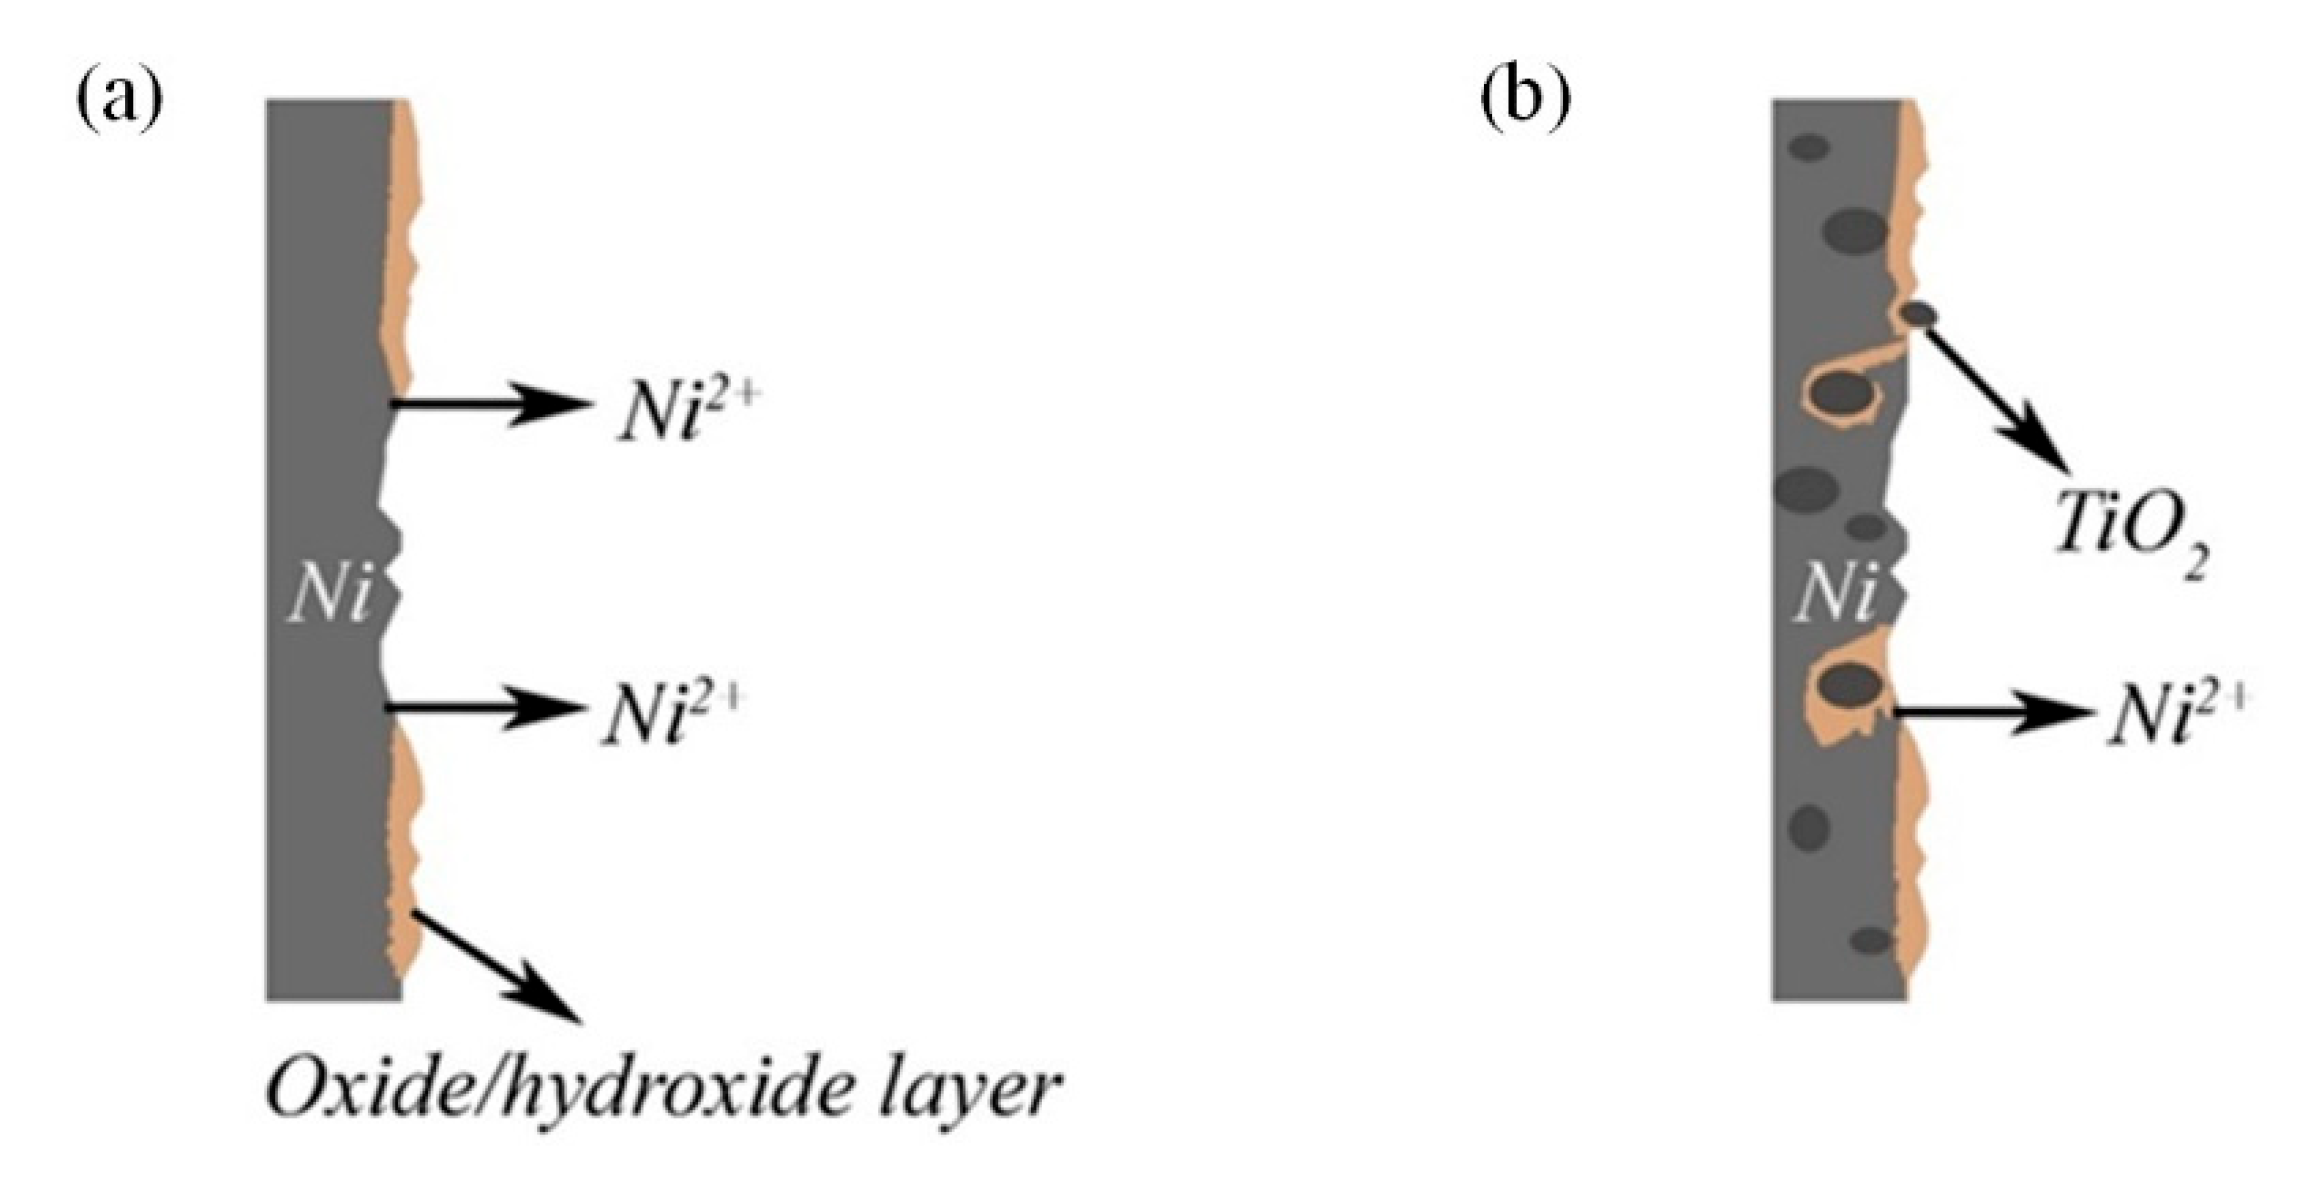
  • Corrosion of pure nickel, as well as Ni-CeO2 and Ni-TiO2 composites, were studied by polarization and EIS techniques. Corrosion current density of 0.07 ± 0.072, 0.23 ± 0.095, and 0.29 ± 0.009 μA/cm2 were obtained for Ni, Ni-CeO2, and Ni-TiO2, respectively; thus, the lowest icorr was shown by the pure nickel coating. The presence of the layer of corrosion products in the form of nickel oxides/hydroxides on the surface of coatings was proved by XPS analysis;
  • Significant decomposition of methylene blue for Ni-TiO2 composite coating in aqueous solution after 6 h of UV light irradiation demonstrated the outstanding photocatalytic activity of this composite. Moreover, the introduction of the TiO2 particles into the plating solution resulted in an increase in the microroughness of the coating.
It is anticipated that current findings can be extended to other metals to synthesize coatings with multifunctional properties.

Supplementary Materials

The following supporting information can be downloaded at: https://www.mdpi.com/article/10.3390/ma15165550/s1, Figure S1: XRD patterns of TiO2 (PDF 00-064-0863 TiO2 Anatase, syn) and CeO2 powder; Figure S2: FTIR spectrum of TiO2 particles; Figure S3: Mechanisms of photocatalysis (a) and energy of band gap (b); Figure S4: UV-Vis spectra of (a) Ni, (b) Ni-CeO2 in MB aqueous solution; Table S1: Positions of XPS peaks obtained after 3.5 month corrosion tests in NaCl media. References [89,90,91,92,93] are cited in the supplementary materials.

Author Contributions

Conceptualization, I.M. and M.E.; methodology, I.M.; formal analysis, I.M. and D.S.K.; investigation, I.M., M.E., L.P., M.R.B. and J.R.; writing—original draft preparation, I.M., M.E., D.S.K. and J.R.; writing—review and editing, M.R.B., E.R., E.V. and L.P.; visualization, I.M.; supervision, E.V. and E.R.; project administration, E.R.; funding acquisition, E.R. All authors have read and agreed to the published version of the manuscript.

Funding

This research received no external funding.

Institutional Review Board Statement

Not applicable.

Informed Consent Statement

Not applicable.

Acknowledgments

The authors are grateful to Liisa Puro and Toni Väkiparta for their kind support during this project and help in ICP and SEM/EDX measurements, Liang Yu (Luleå tekniska universitet, LTU) for his help in XRD measurements.

Conflicts of Interest

The authors declare no conflict of interest.

References

  1. Zhang, H.; Zhang, N.; Fang, F. Fabrication of High-Performance Nickel/Graphene Oxide Composite Coatings Using Ultrasonic-Assisted Electrodeposition. Ultrason. Sonochem. 2020, 62, 104858. [Google Scholar] [CrossRef] [PubMed]
  2. Bostani, B.; Parvini Ahmadi, N.; Yazdani, S.; Arghavanian, R. Co-Electrodeposition and Properties Evaluation of Functionally Gradient Nickel Coated ZrO2 Composite Coating. Trans. Nonferrous Met. Soc. China 2018, 28, 66–76. [Google Scholar] [CrossRef]
  3. Xue, Z.; Lei, W.; Wang, Y.; Qian, H.; Li, Q. Effect of Pulse Duty Cycle on Mechanical Properties and Microstructure of Nickel-Graphene Composite Coating Produced by Pulse Electrodeposition under Supercritical Carbon Dioxide. Surf. Coat. Technol. 2017, 325, 417–428. [Google Scholar] [CrossRef]
  4. Nayana, K.O.; Ranganatha, S.; Shubha, H.N.; Pandurangappa, M. Effect of Sodium Lauryl Sulphate on Microstructure, Corrosion Resistance and Microhardness of Electrodeposition of Ni–Co3O4 Composite Coatings. Trans. Nonferrous Met. Soc. China 2019, 29, 2371–2383. [Google Scholar] [CrossRef]
  5. Li, B.; Zhang, W. Facile Synthesis and Electrochemical Properties of a Novel Ni-B/TiC Composite Coating via Ultrasonic-Assisted Electrodeposition. Ultrason. Sonochem. 2020, 61, 104837. [Google Scholar] [CrossRef] [PubMed]
  6. Zhao, Y.; Wang, L.; Sun, Y.; Liu, H.; Jiang, C.; Ji, V.; Li, W. Influences of Al and Ti Particles on Microstructure, Internal Stress and Property of Ni Composite Coatings. J. Alloys Compd. 2019, 793, 314–325. [Google Scholar] [CrossRef]
  7. Yılmaz, E.; Çakıroğlu, B.; Gökçe, A.; Findik, F.; Gulsoy, H.O.; Gulsoy, N.; Mutlu, Ö.; Özacar, M. Novel Hydroxyapatite/Graphene Oxide/Collagen Bioactive Composite Coating on Ti16Nb Alloys by Electrodeposition. Mater. Sci. Eng. C 2019, 101, 292–305. [Google Scholar] [CrossRef]
  8. Walsh, F.C.; Wang, S.; Zhou, N. The Electrodeposition of Composite Coatings: Diversity, Applications and Challenges. Curr. Opin. Electrochem. 2020, 20, 8–19. [Google Scholar] [CrossRef]
  9. Lelevic, A.; Walsh, F.C. Electrodeposition of Ni-P Composite Coatings: A Review. Surf. Coat. Technol. 2019, 378, 124803. [Google Scholar] [CrossRef]
  10. Vaezi, M.R.; Sadrnezhaad, S.K.; Nikzad, L. Electrodeposition of Ni-SiC Nano-Composite Coatings and Evaluation of Wear and Corrosion Resistance and Electroplating Characteristics. Colloids Surf. A Physicochem. Eng. Asp. 2008, 315, 176–182. [Google Scholar] [CrossRef]
  11. Spanou, S.; Kontos, A.I.; Siokou, A.; Kontos, A.G.; Vaenas, N.; Falaras, P.; Pavlatou, E.A. Self Cleaning Behaviour of Ni/Nano-TiO2 Metal Matrix Composites. Electrochim. Acta 2013, 105, 324–332. [Google Scholar] [CrossRef]
  12. Faraldos, M.; Bahamonde, A. Multifunctional Photocatalytic Coatings for Construction Materials; Elsevier Ltd.: Amsterdam, The Netherlands, 2018; ISBN 9780081026410. [Google Scholar]
  13. Xi, Y.Y.; Huang, B.Q.; Djurišić, A.B.; Chan, C.M.N.; Leung, F.C.C.; Chan, W.K.; Au, D.T.W. Electrodeposition for Antibacterial Nickel-Oxide-Based Coatings. Thin Solid Films 2009, 517, 6527–6530. [Google Scholar] [CrossRef]
  14. Wu, W.; Huang, J.; Näther, J.; Omar, N.A.B.; Köster, F.; Lampke, T.; Liu, Y.; Pan, H.; Zhang, Y. Texture Orientation, Morphology and Performance of Nanocrystalline Nickel Coatings Electrodeposited from a Watts-Type Bath: Effects of H3BO3 Concentration and Plating Time. Surf. Coat. Technol. 2021, 424, 127648. [Google Scholar] [CrossRef]
  15. Tsuru, Y.; Nomura, M.; Foulkes, F.R. Effects of Boric Acid on Hydrogen Evolution and Internal Stress in Films Deposited from a Nickel Sulfamate Bath. J. Appl. Electrochem. 2002, 32, 629–634. [Google Scholar] [CrossRef]
  16. Available online: https://Echa.Europa.Eu/Substance-Information/-/Substanceinfo/100.014.129 (accessed on 9 August 2022).
  17. Xu, J.; Gao, X.; Chen, G.; Zou, L.; Gao, C. High Performance Boron Removal from Seawater by Two-Pass SWRO System with Different Membranes. Water Sci. Technol. Water Supply 2010, 10, 327–336. [Google Scholar] [CrossRef]
  18. Brdar-Jokanovi, M. Boron Toxicity and Deficiency in Agricultural Plants. Int. J. Mol. Sci. 2020, 21, 1424. [Google Scholar] [CrossRef] [PubMed]
  19. Saito, B.Y.F.; Kishihoto, K.; Nobira, Y.; Kobayakawa, K.; Sato, Y. Nickel Electroplating Bath Using Malic Acid as a Substitute Agent for Boric Acid. Met. Finish. 2007, 105, 34–38. [Google Scholar] [CrossRef]
  20. Antikhovich, I.V.; Kharitonov, D.S.; Chernik, A.A.; Dobryden’, I.B. Corrosion Resistance of Nickel Coatings Deposited from Low-Temperature Nickel-Plating Electrolytes. Russ. J. Appl. Chem. 2017, 90, 566–573. [Google Scholar] [CrossRef]
  21. Makarova, I.V.; Kharitonov, D.S.; Dobryden’, I.B.; Chernik, A.A. Corrosion Behavior in Acid and Alkaline Media of Nickel Coatings Deposited at Room Temperature. Russ. J. Appl. Chem. 2018, 91, 1441–1450. [Google Scholar] [CrossRef]
  22. Makarova, I.; Dobryden, I.; Kharitonov, D.; Kasach, A.; Ryl, J.; Repo, E.; Vuorinen, E. Nickel-Nanodiamond Coatings Electrodeposited from Tartrate Electrolyte at Ambient Temperature. Surf. Coat. Technol. 2019, 380, 125063. [Google Scholar] [CrossRef]
  23. Bogomazova, N.V.; Antikhovich, I.V.; Chernik, A.A.; Zharskii, I.M. Specific Features of Electrodeposition of Ni-SiO2 Micromounting Composite Coatings from Complex Electrolytes. Russ. J. Appl. Chem. 2014, 87, 1235–1239. [Google Scholar] [CrossRef]
  24. Mockute, D.; Bernotiene, G.; Vilkaite, R. Reaction Mechanism of Some Benzene Sulfonamide and Saccharin Derivatives during Nickel Electrodeposition in Watts-Type Electrolyte. Surf. Coat. Technol. 2002, 160, 152–157. [Google Scholar] [CrossRef]
  25. Antikhovich, I.V.; Chernik, A.A.; Zharskii, I.M.; Bolvako, A.K. Electrodeposition of a Nickel Coating from a Low-Temperature Acetate-Chloride Nickel-Plating Electrolyte. Russ. J. Electrochem. 2015, 51, 281–285. [Google Scholar] [CrossRef]
  26. Antihovich, I.V.; Ablazhey, N.M.; Chernik, A.A.; Zharsky, I.M. Electrodeposition of Nickel and Composite Nickel-Fullerenol Coatings from Low-Temperature Sulphate-Chloride-Isobutyrate Electrolyte. Procedia Chem. 2014, 10, 373–377. [Google Scholar] [CrossRef]
  27. Lu, A.; Jin, T.; Guo, Z.; Qu, M.; Chang, Y.; Liu, Q.; Zhang, C. Characterization of the Tool Influence Function in a Dual-Axis Wheel Polishing Process to Achieve High Material Removal Rates. Precis. Eng. 2018, 52, 276–290. [Google Scholar] [CrossRef]
  28. Tang, H.; Yang, W.; Liu, W.; Ma, J.; Luo, X. Characteristic of Fixed Abrasive Polishing for Fused Silica in Anhydrous Environment. Optik 2020, 202, 163623. [Google Scholar] [CrossRef]
  29. Pyanko, A.V.; Makarova, I.V.; Kharitonov, D.S.; Makeeva, I.S.; Sergievich, D.S.; Chernik, A.A. Physicochemical and Biocidal Properties of Nickel–Tin and Nickel–Tin—Titania Coatings. Prot. Met. Phys. Chem. Surf. 2021, 57, 88–95. [Google Scholar] [CrossRef]
  30. Kharitonov, D.S.; Kasach, A.A.; Sergievich, D.S.; Wrzesinska, A.; Bobowska, I.; Darowicki, K.; Zielinski, A.; Ryl, J.; Kurilo, I.I. Ultrasonics Sonochemistry Ultrasonic-Assisted Electrodeposition of Cu-Sn-TiO2 Nanocomposite Coatings with Enhanced Antibacterial Activity. Ultrason. Sonochem. 2021, 75, 105593. [Google Scholar] [CrossRef] [PubMed]
  31. Azizi, H.; Pourafshari, M.; Haghighi, A.; Esmaeili, M.; Pihlajamäki, A.; Kallioinen, M.; Mänttäri, M. Ultra-Desulfurization of Sulfur Recovery Unit Wastewater Using Thin Film Nanocomposite Membrane. Sep. Purif. Technol. 2019, 221, 211–225. [Google Scholar] [CrossRef]
  32. Shao, W.; Nabb, D.; Renevier, N.; Sherrington, I.; Fu, Y.; Luo, J. Mechanical and Anti-Corrosion Properties of TiO2 Nanoparticle Reinforced Ni Coating by Electrodeposition. J. Electrochem. Soc. 2012, 159, D671–D676. [Google Scholar] [CrossRef]
  33. Thiemig, D.; Bund, A. Characterization of Electrodeposited Ni-TiO2 Nanocomposite Coatings. Surf. Coat. Technol. 2008, 202, 2976–2984. [Google Scholar] [CrossRef]
  34. Aruna, S.T.; Bindu, C.N.; Ezhil Selvi, V.; William Grips, V.K.; Rajam, K.S. Synthesis and Properties of Electrodeposited Ni/Ceria Nanocomposite Coatings. Surf. Coat. Technol. 2006, 200, 6871–6880. [Google Scholar] [CrossRef]
  35. Stanković, V.; Gojo, M.; Grekulovic, V.; Pajkić, N.; Cigula, T. Surface Quality of the Ni-TiO2 Composite Coatings Produced by Electroplating Produced by Electroplating. J. Min. Met. Sect. B-Metall 2017, 53, 341–348. [Google Scholar] [CrossRef]
  36. Shanmugasamy, S.; Balakrishnan, K.; Subasri, A.; Ramalingam, S.; Subramania, A. Development of CeO2 Nanorods Reinforced Electrodeposited Nickel Nanocomposite Coating and Its Tribological and Corrosion Resistance Properties. J. Rare Earths 2018, 36, 1319–1325. [Google Scholar] [CrossRef]
  37. Hu, Y.; Liu, S.; Huang, S.; Pan, W. Fabrication of Superhydrophobic Surfaces of Titanium Dioxide and Nickel through Electrochemical Deposition on Stainless Steel Substrate. Key Eng. Mater. 2010, 434–435, 496–498. [Google Scholar] [CrossRef]
  38. Sen, R.; Das, S.; Das, K. Synthesis and Properties of Pulse Electrodeposited Ni-CeO2 Nanocomposite. Metall. Mater. Trans. A Phys. Metall. Mater. Sci. 2012, 43, 3809–3823. [Google Scholar] [CrossRef]
  39. Xiong, C.; Wang, Y.; Hu, B.; Chen, L.; Tay, S.L.; Xu, A.; Gao, W. Microstructure and Properties of Electrodeposited Ni-CeO2 Coatings. Int. J. Electrochem. Sci. 2016, 11, 906–914. [Google Scholar]
  40. Jin, H.; Wang, Y.Y.; Wang, Y.T.; Yang, H.B. Synthesis and Properties of Electrodeposited Ni–CeO2 Nano-Composite Coatings. Rare Met. 2018, 37, 148–153. [Google Scholar] [CrossRef]
  41. Kasturibai, S.; Kalaignan, G.P. Characterizations of Electrodeposited Ni-CeO2 Nanocomposite Coatings. Mater. Chem. Phys. 2014, 147, 1042–1048. [Google Scholar] [CrossRef]
  42. Xue, Y.J.; Li, J.S.; Ma, W.; De Duan, M.; Lan, M.M. Fabrication and Wear Resistance of Ni-CeO2 Nanocomposite Coatings by Electrodeposition under Ultrasound Condition. Int. J. Surf. Sci. Eng. 2010, 4, 202–213. [Google Scholar] [CrossRef]
  43. Bhogal, S.S.; Kumar, V.; Dhami, S.S.; Pabla, B.S. Preparation and Properties of Electrodeposited Ni-TiO2 Composite Coating. J. Electrochem. Sci. Eng. 2015, 5, 37–45. [Google Scholar] [CrossRef]
  44. Parida, G.; Chaira, D.; Chopkar, M.; Basu, A. Synthesis and Characterization of Ni-TiO2 Composite Coatings By. Surf. Coat. Technol. 2011, 205, 4871–4879. [Google Scholar] [CrossRef]
  45. Birlik, I.; Ak Azem, N.F.; Toparli, M.; Celik, E.; Koc Delice, T.; Yildirim, S.; Bardakcioglu, O.; Dikici, T. Preparation and Characterization of Ni-TiO2 Nanocomposite Coatings Produced by Electrodeposition Technique. Front. Mater. 2016, 3, 46. [Google Scholar] [CrossRef]
  46. Mohajery, B.; Dolati, A. An Investigation on the Electrodeposition Mechanism of Ni-TiO2 Nanocomposite Coatings. J. Ultrafine Grained Nanostructured Mater. 2016, 49, 51–63. [Google Scholar] [CrossRef]
  47. Lin, C.S.; Lee, C.Y.; Chang, C.F.; Chang, C.H. Annealing Behavior of Electrodeposited Ni-TiO2 Composite Coatings. Surf. Coatings Technol. 2006, 200, 3690–3697. [Google Scholar] [CrossRef]
  48. Sknar, Y.E.; Sknar, I.V.; Savchuk, A.A.; Bezik, A.A.; Danilov, F.I. Danilov Photocatalytic Activity of Ni-TiO2 Composites Electrodeposited on a Nickel Matrix with Developed Surface. Vopr. Khimii I Khimicheskoi Tekhnologi 2017, 6, 50–56. [Google Scholar]
  49. Sen, R.; Das, S.; Das, K. Effect of Stirring Rate on the Microstructure and Microhardness of Ni-CeO2 Nanocomposite Coating and Investigation of the Corrosion Property. Surf. Coat. Technol. 2011, 205, 3847–3855. [Google Scholar] [CrossRef]
  50. Li, Y.; Geng, S.; Chen, G. Electrodeposited Ni/CeO2 Mulriple Coating on SUS 430 Steel Interconnect. Int. J. Hydrogen Energy 2018, 43, 12811–12816. [Google Scholar] [CrossRef]
  51. Phala, M.F.; Popoola, A.P.I.; Fayomi, O.S.I. Corrosion and Properties of Developed Ni-CeO2 Co-Deposited on Mild Steel at Varying Current Densities. Procedia Manuf. 2017, 7, 543–548. [Google Scholar] [CrossRef]
  52. Ningsong, Q. Synthesis of Ni-CeO2 Nanocomposite Coatings by Electroforming. Appl. Mech. Mater. 2013, 248, 48–53. [Google Scholar] [CrossRef]
  53. Xue, Y.-J.; Jia, X.-Z.; Zhou, Y.-W.; Ma, W.; Li, J.-S. Tribological Performance of Ni–CeO2 Composite Coatings by Electrodeposition. Surf. Coat. Technol. 2006, 200, 5677–5681. [Google Scholar] [CrossRef]
  54. Hou, C.; Hu, B.; Zhu, J. Photocatalytic Degradation of Methylene Blue over TiO2 Pretreated with Varying Concentrations of NaOH. Catalysts 2018, 8, 575. [Google Scholar] [CrossRef]
  55. Zuo, R.; Du, G.; Zhang, W.; Liu, L.; Liu, Y.; Mei, L.; Li, Z. Photocatalytic Degradation of Methylene Blue Using TiO2 Impregnated Diatomite. Adv. Mater. Sci. Eng. 2014, 2014, 170148. [Google Scholar] [CrossRef]
  56. Burduhos-Nergis, D.P.; Vizureanu, P.; Sandu, A.V.; Bejinariu, C. Phosphate Surface Treatment for Improving the Corrosion Resistance of the C45 Carbon Steel Used in Carabiners Manufacturing. Materials 2020, 13, 3410. [Google Scholar] [CrossRef]
  57. Hou, F.; Wang, W.; Guo, H. Effect of the Dispersibility of ZrO2 Nanoparticles in Ni-ZrO2 Electroplated Nanocomposite Coatings on the Mechanical Properties of Nanocomposite Coatings. Appl. Surf. Sci. 2006, 252, 3812–3817. [Google Scholar] [CrossRef]
  58. Aruna, S.T.; Muniprakash, M.; William Grips, V.K. Effect of Titania Particles Preparation on the Properties of Ni–TiO2 Electrodeposited Composite Coatings. J. Appl. Electrochem. 2013, 43, 805–815. [Google Scholar] [CrossRef]
  59. Guan, B.; Yu, J.; Guo, S.; Yu, S.; Han, S. Porous Nickel Doped Titanium Dioxide Nanoparticles with Improved Visible Light Photocatalytic Activity. Nanoscale Adv. 2020, 2, 1352–1357. [Google Scholar] [CrossRef]
  60. Azimi, G.; Dhiman, R.; Kwon, H.-M.; Paxson, A.T.; Varanasi, K.K. Hydrophobicity of Rare-Earth Oxide Ceramics. Nat. Mater. 2013, 12, 315–320. [Google Scholar] [CrossRef] [PubMed]
  61. Xue, Y.; Wang, S. Fabrication of Co-Ni Based Superhydrophobic Coating and Its Wear Resistance, Durability and Corrosion Resistance. In Surfaces, Interfaces and Coatings Technology; Bosia, A., Ed.; Vide Leaf: Hyderabad, India, 2021; pp. 1–26. [Google Scholar]
  62. Xue, Y.; Wang, S.; Xue, Y.; Cao, L.; Nie, M.; Jin, Y. Robust Self-Cleaning and Marine Anticorrosion Super-Hydrophobic Co-Ni/CeO2 Composite Coating. Adv. Eng. Mater. 2020, 22, 2000402. [Google Scholar] [CrossRef]
  63. Moharana, M.; Mallik, A. Nickel Electrocrystallization in Different Electrolytes: An in-Process and Post Synthesis Analysis. Electrochim. Acta 2013, 98, 1–10. [Google Scholar] [CrossRef]
  64. Kasach, A.A.; Kharitonov, D.S.; Wrzesińska, A.; Bobowska, I.; Predko, A.A.; Romanovskii, V.I.; Zharskii, I.M.; Kurilo, I.I. The Effect of Ultrasound Treatment on Physicochemical and Tribological Properties of Electrolytic Cu–Sn–TiO2 Coatings. Prot. Met. Phys. Chem. Surf. 2020, 56, 385–391. [Google Scholar] [CrossRef]
  65. Mattli, M.R.; Matli, P.R.; Khan, A.; Abdelatty, R.H.; Yusuf, M.; Al Ashraf, A.; Kotalo, R.G.; Shakoor, R.A. Study of Microstructural and Mechanical Properties of Al/SiC/TiO2 Hybrid Nanocomposites Developed by Microwave Sintering. Crystals 2021, 11, 1078. [Google Scholar] [CrossRef]
  66. Wasekar, N.P.; Latha, S.M.; Ramakrishna, M.; Rao, D.S.; Sundararajan, G. Pulsed Electrodeposition and Mechanical Properties of Ni-W/SiC Nano-Composite Coatings. Mater. Des. 2016, 112, 140–150. [Google Scholar] [CrossRef]
  67. Badarulzaman, N.A.; Mohamad, A.A.; Puwadaria, S.; Ahmad, Z.A. The Evaluation of Nickel Deposit Obtained via Watts Electrolyte at Ambient Temperature. J. Coat. Technol. Res. 2010, 7, 815–820. [Google Scholar] [CrossRef]
  68. Shozib, I.A.; Ahmad, A.; Abdul-Rani, A.M.; Beheshti, M.; Aliyu, A.A. A Review on the Corrosion Resistance of Electroless Ni-P Based Composite Coatings and Electrochemical Corrosion Testing Methods. Corros. Rev. 2022, 40, 1–37. [Google Scholar] [CrossRef]
  69. Kasach, A.A.; Kharytonau, D.S.; Paspelau, A.V.; Ryl, J.; Sergievich, D.S.; Zharskii, I.M.; Kurilo, I.I. Effect of TiO2 Concentration on Microstructure and Properties of Composite Cu–Sn–TiO2 Coatings Obtained by Electrodeposition. Materials 2021, 14, 6179. [Google Scholar] [CrossRef]
  70. Montemor, M.F.; Ferreira, M.G.S. Cerium Salt Activated Nanoparticles as Fillers for Silane Films: Evaluation of the Corrosion Inhibition Performance on Galvanised Steel Substrates. Electrochim. Acta 2007, 52, 6976–6987. [Google Scholar] [CrossRef]
  71. Sharma, A.; Das, S.; Das, K. Electrochemical Corrosion Behavior of CeO2 Nanoparticle Reinforced Sn-Ag Based Lead Free Nanocomposite Solders in 3.5wt.% NaCl Bath. Surf. Coat. Technol. 2015, 261, 235–243. [Google Scholar] [CrossRef]
  72. Cruz, M.J.; Makarova, I.V.; Kharitonov, D.S.; Ushak, S.; Chernik, A.A.; Grageda, M. Corrosion Properties of Nickel Coatings Obtained from Aqueous and Nonaqueous Electrolytes. Surf. Interface Anal. 2019, 51, 943–953. [Google Scholar] [CrossRef]
  73. Huang, C.C.; Li, H.M.; Li, D.H.; Lin, S.Y. The Performance of Titanium Composite Coatings Obtained through Thermal Spraying and Microarc Oxidation. Compos. Adv. Mater. 2021, 30, 1–11. [Google Scholar] [CrossRef]
  74. Mansour, A.N.; Mansour, A.N. Characterization of ΒNi(OH)2 by XPS. Surf. Sci. Spectra 1994, 3, 239. [Google Scholar] [CrossRef]
  75. Diebold, U.; Madey, T.E. TiO2 by XPS. Surf. Sci. Spectra 1996, 4, 227–231. [Google Scholar] [CrossRef]
  76. Deng, S.-H.; Lu, H.; Li, D. Effect of UV Light Illumination on the Corrosion Behavior of Electrodeposited TiO2 -Ni Composite Foils. Appl. Surf. Sci. 2018, 462, 291–302. [Google Scholar] [CrossRef]
  77. Zhou, G.; Liu, H.; Cui, K.; Jia, A.; Hu, G.; Jiao, Z. Role of Surface Ni and Ce Species of Ni / CeO2 Catalyst in CO2 Methanation. Appl. Surf. Sci. 2016, 383, 248–252. [Google Scholar] [CrossRef]
  78. Liu, L.; Li, Y.; Wang, F. Influence of Grain Size on the Corrosion Behavior of a Ni-Based Superalloy Nanocrystalline Coating in NaCl Acidic Solution. Electrochim. Acta 2008, 53, 2453–2462. [Google Scholar] [CrossRef]
  79. Pineau, N.; Minot, C.; Maurice, V.; Marcus, P. Density Functional Theory Study of the Interaction of Cl with Passivated Nickel Surfaces. Electrochem. Solid-State Lett. 2003, 6, B47. [Google Scholar] [CrossRef]
  80. Bharti, B.; Kumar, S.; Lee, H.N.; Kumar, R. Formation of Oxygen Vacancies and Ti3+ State in TiO2 Thin Film and Enhanced Optical Properties by Air Plasma Treatment. Sci. Rep. 2016, 6, srep32355. [Google Scholar] [CrossRef]
  81. Beche, E.; Charvin, P.; Perarnau, D.; Abanades, S.; Flamant, G. Ce3d XPS Investigation of Cerium Oxides and Mixed Cerium Oxide (CexTiyOz). Surf. Interface Anal. 2008, 40, 264–267. [Google Scholar] [CrossRef]
  82. Biesinger, M.C.; Lau, L.W.M.; Gerson, A.R.; St, R.; Smart, C. Resolving surface chemical states in XPS analysis of first row transition metals, oxides and hydroxides: Sc, Ti, V, Cu and Zn. Appl. Surf. Sci. 2010, 257, 887–898. [Google Scholar] [CrossRef]
  83. Sharma, R.; Raghav, S.; Nair, M.; Kumar, D. Kinetics and Adsorption Studies of Mercury and Lead by Ceria Nanoparticles Entrapped in Tamarind Powder. ACS Omega 2018, 3, 14606–14619. [Google Scholar] [CrossRef]
  84. Dvoranová, D.; Brezová, V.; Mazúr, M.; Malati, M.A. Investigations of Metal-Doped Titanium Dioxide Photocatalysts. Appl. Catal. B Environ. 2002, 37, 91–105. [Google Scholar] [CrossRef]
  85. Fujishima, A.; Tryk, A.; RaoDonald, T.N. Titanium Dioxide Photocatalysis. J. Photochem. Photobiol. C Photochem. Rev. 2000, 1, 112666. [Google Scholar] [CrossRef]
  86. Ahmed, M.A. Synthesis and Structural Features of Mesoporous NiO/TiO2 Nanocomposites Prepared by Sol-Gel Method for Photodegradation of Methylene Blue Dye. J. Photochem. Photobiol. A Chem. 2012, 238, 63–70. [Google Scholar] [CrossRef]
  87. Mahmoodi, N.M.; Arami, M.; Limaee, N.Y.; Tabrizi, N.S. Kinetics of Heterogeneous Photocatalytic Degradation of Reactive Dyes in an Immobilized TiO2 Photocatalytic Reactor. J. Colloid Interface Sci. 2006, 295, 159–164. [Google Scholar] [CrossRef]
  88. Akpan, U.G.; Hameed, B.H. Parameters Affecting the Photocatalytic Degradation of Dyes Using TiO2-Based Photocatalysts: A Review. J. Hazard. Mater. 2009, 170, 520–529. [Google Scholar] [CrossRef]
  89. Zhang, H.; Li, Y.; Wang, J.; Wu, N.; Sheng, H.; Chen, C.; Zhao, J. An unprecedent hydride transfer pathway for selective photocatalytic reduction of CO2 to formic acid on TiO2. Appl. Catal. B Environ. 2021, 284, 119692. [Google Scholar] [CrossRef]
  90. Arifin, K.; Yunus, R.M.; Minggu, L.J.; Kassim, M.B. Improvement of TiO2 nanotubes for photoelectrochemical water splitting: Review. Int. J. Hydrogen Energy 2021, 46, 4998–5024. [Google Scholar] [CrossRef]
  91. Elghniji, K.; Ksibi, M.; Elaloui, E. Sol-gel reverse micelle preparation and characterization of n-doped Tio2: Efficient photocatalytic degradation of methylene blue in water under visible light. J. Ind. Eng. Chem. 2012, 18, 178–182. [Google Scholar] [CrossRef]
  92. Zimmerman, A.J.; Gutierrez, D.G.; Campos, V.M.; Weindorf, D.C.; Deb, S.K.; Chacón, S.U.; Landrot, G.; Flores, N.G.G.; Siebecker, M.G. Arsenic speciation in titanium dioxide (TiO2) waste produced via drinking water filtration: Potential environmental implications for soils, sediments, and human health. Environ. Adv. 2021, 3, 100036. [Google Scholar] [CrossRef]
  93. Anwar, D.I.; Mulyadi, D. Synthesis of Fe-TiO2 Composite as a photocatalyst for degradation of methylene blue. Procedia Chem. 2015, 17, 49–54. [Google Scholar] [CrossRef]
Figure 1. Particle size distribution for CeO2 and TiO2 (a) and ζ-potential versus pH for CeO2 (b).
Materials 15 05550 g001
Figure 2. Setup for the wear measurement.
Materials 15 05550 g002
Figure 3. SEM images of Ni (a), Ni-CeO2 (b), and Ni-TiO2 (c) coatings. Insets show images of surface contact angle measurements. The contact angle of steel substrate was 79.9 ± 1.0°.
Materials 15 05550 g003
Figure 4. High-resolution EDX elemental mapping of the main elements in Ni-TiO2 (a) and Ni-CeO2 (b) coatings.
Materials 15 05550 g004
Figure 5. Cross-sectional SEM images of Ni (a), Ni-CeO2 (b), and Ni-TiO2 (c) coatings.
Materials 15 05550 g005
Figure 6. XRD patterns of Ni and composite Ni-CeO2 and Ni-TiO2 coatings.
Materials 15 05550 g006
Figure 7. 3D optical surface profile images of Ni (a), Ni-CeO2 (b), and Ni-TiO2 (c) coatings after wear tests and corresponding profiles of the wear tracks (d).
Materials 15 05550 g007
Figure 8. Potentiodynamic polarization curves (a) and Nyquist EIS plots (b) of Ni, Ni-TiO2, and Ni-CeO2 coatings in 0.5 M NaCl solution and equivalent circuit, used for EIS data analyses.
Materials 15 05550 g008
Figure 9. Concentration of nickel ions released into the 0.5 M NaCl solution during exposure for 3.5 months.
Materials 15 05550 g009
Figure 10. High-resolution XPS spectra for Ni2p (ac), O1s (df) and Cl2p (gi) registered after 3.5 month of immersion in 0.5 M NaCl: (a,d,g) Ni, (b,e,h) Ni-TiO2, (c,f,i) Ni-CeO2.
Materials 15 05550 g010
Figure 11. High-resolution XPS spectra for Ti2p3 (a,b) and Ce3d5 (c,d) registered before corrosion tests (a,c) and after 3.5 month of immersion in 0.5 M NaCl (b,d).
Materials 15 05550 g011
Figure 12. Scheme of dissolution (a) Ni and Ni-CeO2 coatings, (b) Ni-TiO2.
Materials 15 05550 g012
Figure 13. SEM images of Ni (a), Ni-CeO2 (b), and Ni-TiO2 (c) coatings after 3.5 months of exposure to 0.5 M NaCl.
Materials 15 05550 g013
Figure 14. UV-Vis spectra of Ni-TiO2 in MB aqueous solution (a); Photocatalytic degradation of MB at Ni, Ni-CeO2, Ni-TiO2 (b).
Materials 15 05550 g014
Table 3. Chemicals and conditions of electrolysis.
Chemical/ParameterValuePuritySuppliers
NiSO4·7H2O0.8 mol/L99.0%Sigma-Aldrich
NiCl2·6H2O0.2 mol/L99.9%Sigma-Aldrich
KNaC4H4O6·4H2O.0.2 mol/L99.0%Sigma-Aldrich
CeO210 g/L≥99.0%Sigma-Aldrich
TiO210 g/L≥99.5%Sigma-Aldrich
Stirring Rate400 rpm
Current Density200 A/m2
pH3 ± 0.1
Temperature22 ± 1 °C
Table 4. Composition of nickel and composite nickel-based coatings based on the results of EDX analysis.
Element, wt.%NiNi-CeO2Ni-TiO2
Ni10098.996.7
O0.71.2
Ce0.4
Ti2.1
Table 5. Microhardness, microroughness, and wear rate of nickel and composite nickel-based coatings.
Type of CoatingNiNi-CeO2Ni-TiO2Ni (Watts Electrolyte)
Microhardness, HV191 ± 10230 ± 15270 ± 5270 ± 12 [14]
Microroughness Sa, μm0.26 ± 0.090.26 ± 0.020.86 ± 0.030.41 [63]
Specific wear rate × 1014, m3/m4.122.582.0150–80 [14]
Table 6. Electrochemical parameters extracted from potentiodynamic polarization curves.
Coating|bc|, V/decba V/decicorr, μA/cm2vcorr, mm/yearEcorr, V
Ni0.02290.03540.07 ± 0.0720.000750.019 ± 0.003
Ni-CeO20.02160.03260.23 ± 0.0950.002480.101 ± 0.023
Ni-TiO20.02580.02340.29 ± 0.0090.003130.066 ± 0.015
Table 7. Parameters obtained from the fitting of the impedance spectra after exposure to 0.5 M NaCl solution.
Type of Coating
NiNi-TiO2Ni-CeO2
Rs, Ohm∙cm265.3251.6254.50
Y1, sn/ (Ohm∙cm2)1.19 × 10−51.50 × 10−41.03 × 10⁻⁵
n10.790.740.74
Rp, k Ohm∙cm216.006.9014.41
Table 8. pH of 0.5 M NaCl solution * during 3.5 months of immersion of Ni, Ni-TiO2, and Ni-CeO2.
Time of ImmersionType of Coating
NiNi-TiO2Ni-CeO2
5 days6.66.66.5
10 days6.97.17.2
20 days7.27.47.2
3.5 month7.67.58.1
* initial pH of 0.5 M NaCl was 5.4.
Table 9. Composition (at.%) of Ni, Ni-CeO2 and Ni-TiO2 composite coatings after immersing in 0.5 M NaCl for 3.5 months by XPS analysis.
CoatingComposition (at.%)
Ni0NiOxNi(OH)2TiO2CeO2
Ni24.045.230.8
Ni-TiO22.464.333.30
Ni-CeO229.847.023.10.5
Publisher’s Note: MDPI stays neutral with regard to jurisdictional claims in published maps and institutional affiliations.

