
Removal of Pb(II), Cd(II) and Ni(II) Ions from Groundwater by Nonthermal Plasma


Abstract
:1. Introduction
2. Materials and Methods
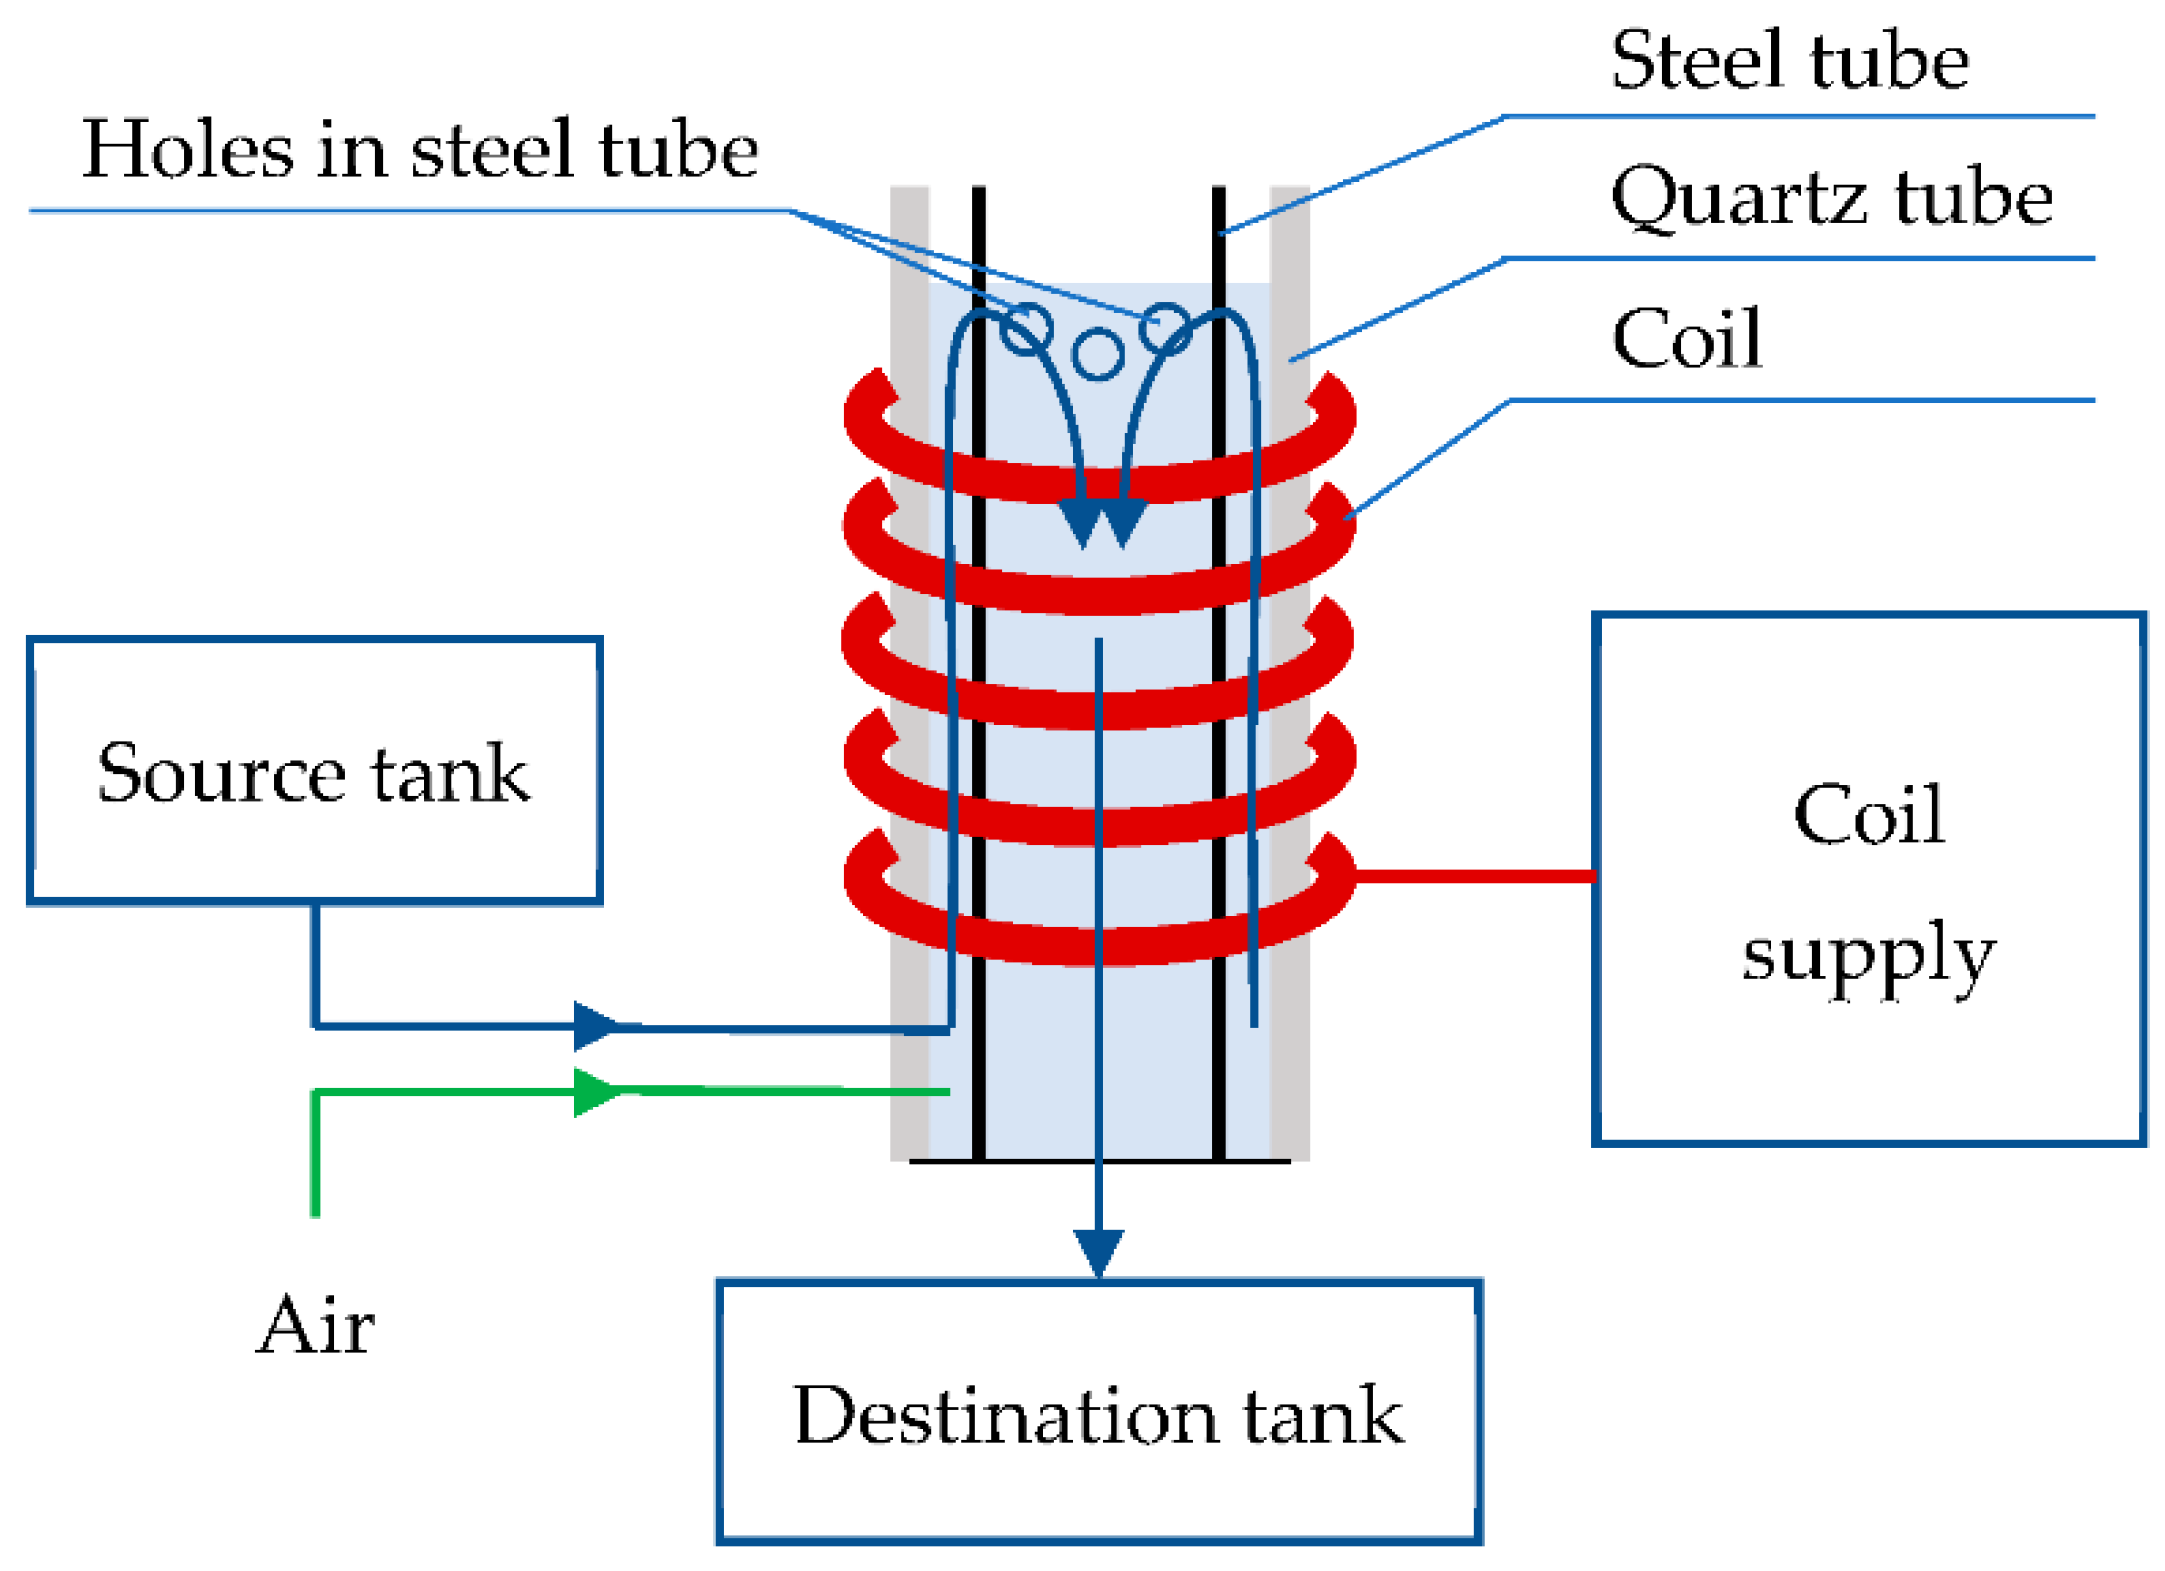
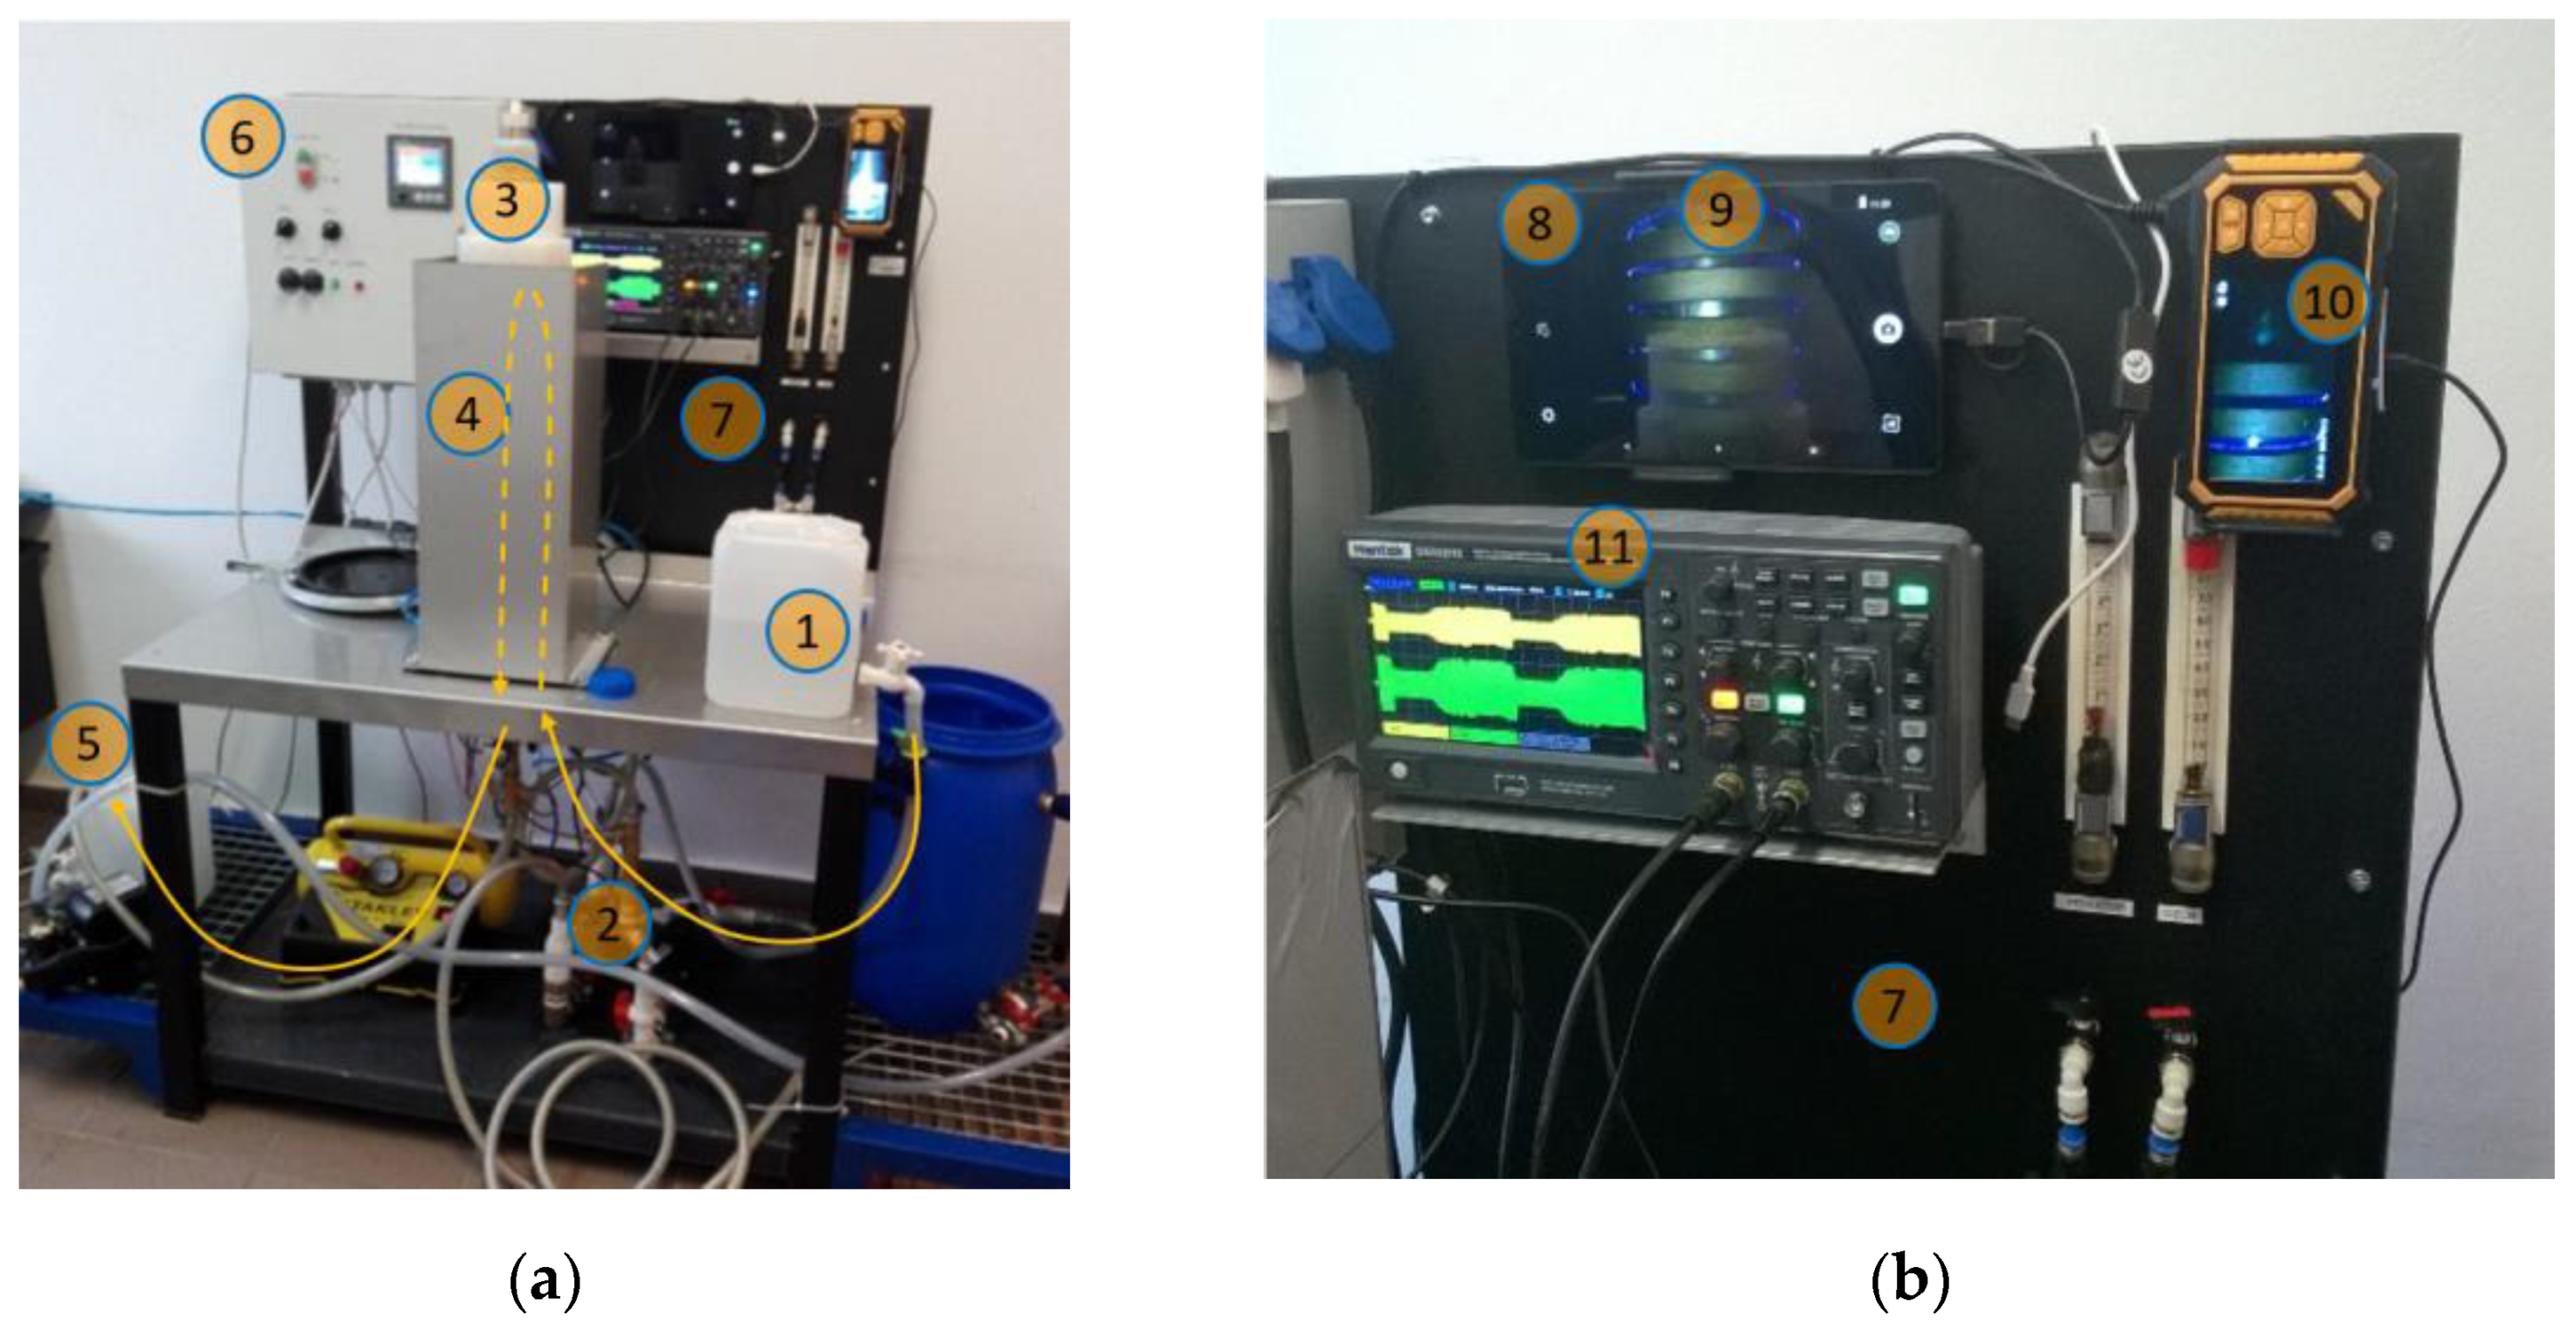
2.1. Lab Stand
2.2. Physical, Chemical and Biological Analyses
2.3. Removing Metal Ions
3. Results and Discussion
3.1. Characteristics of the Used Water
3.2. Optimization of the NTP Generator Settings
3.3. Physical, Chemical and Microbiological Parameters of the Tested Water
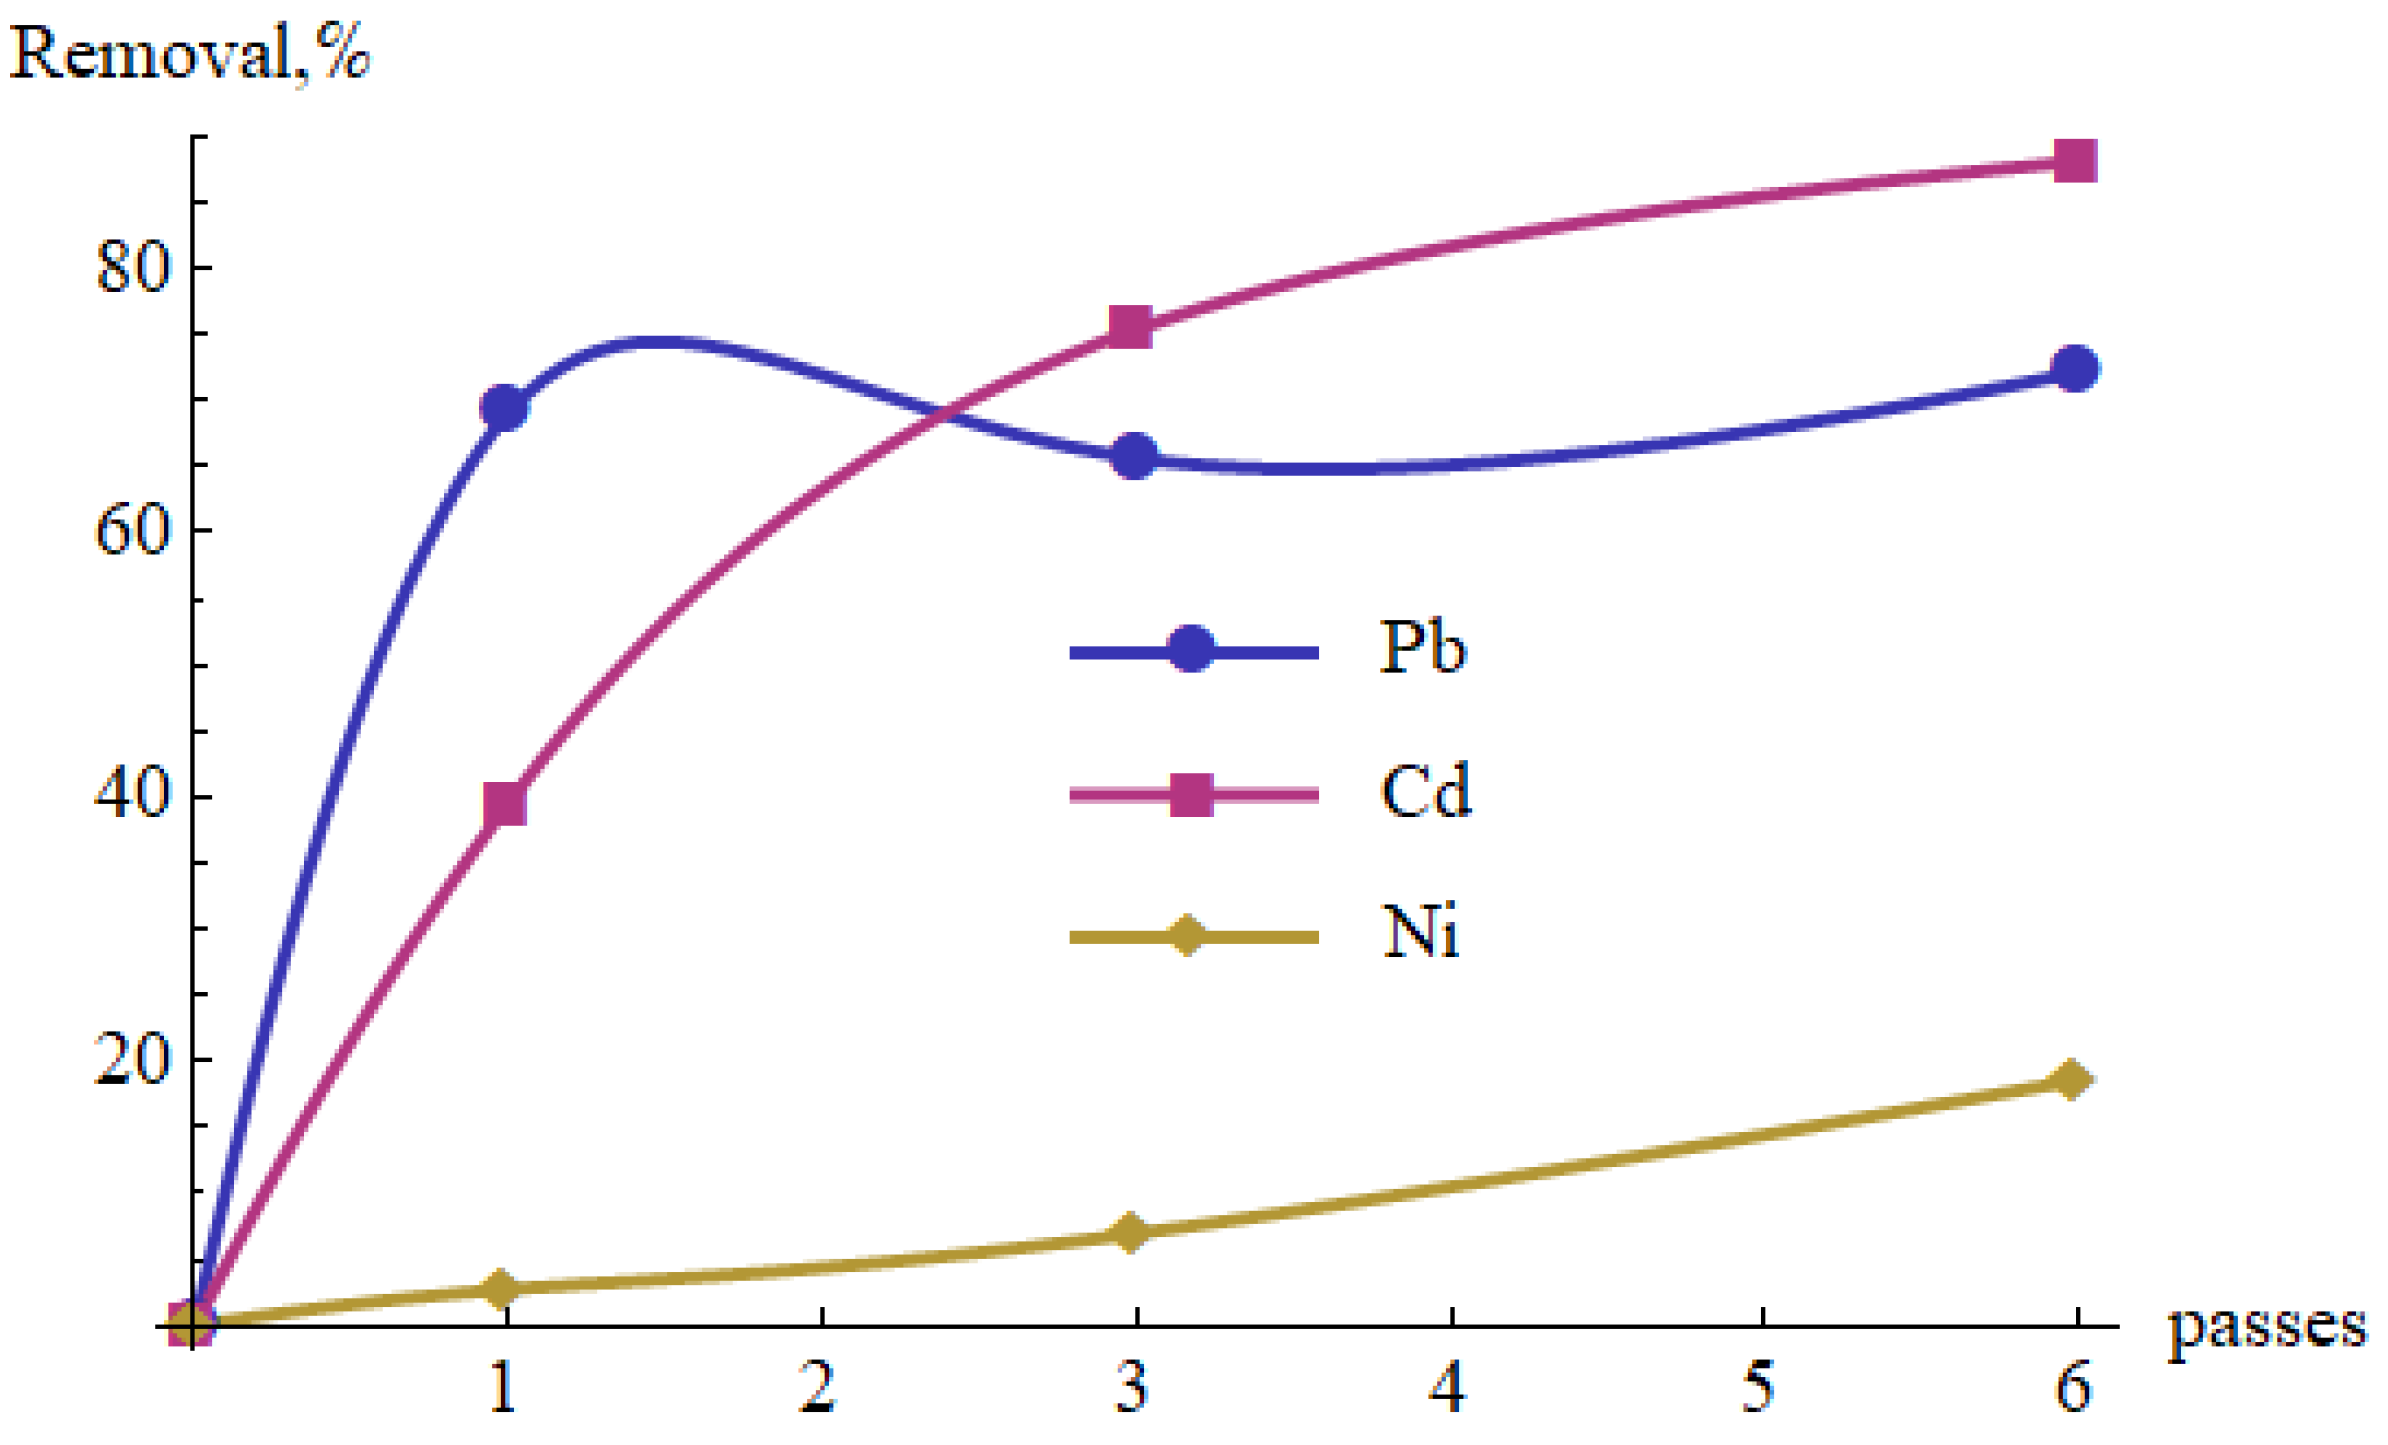
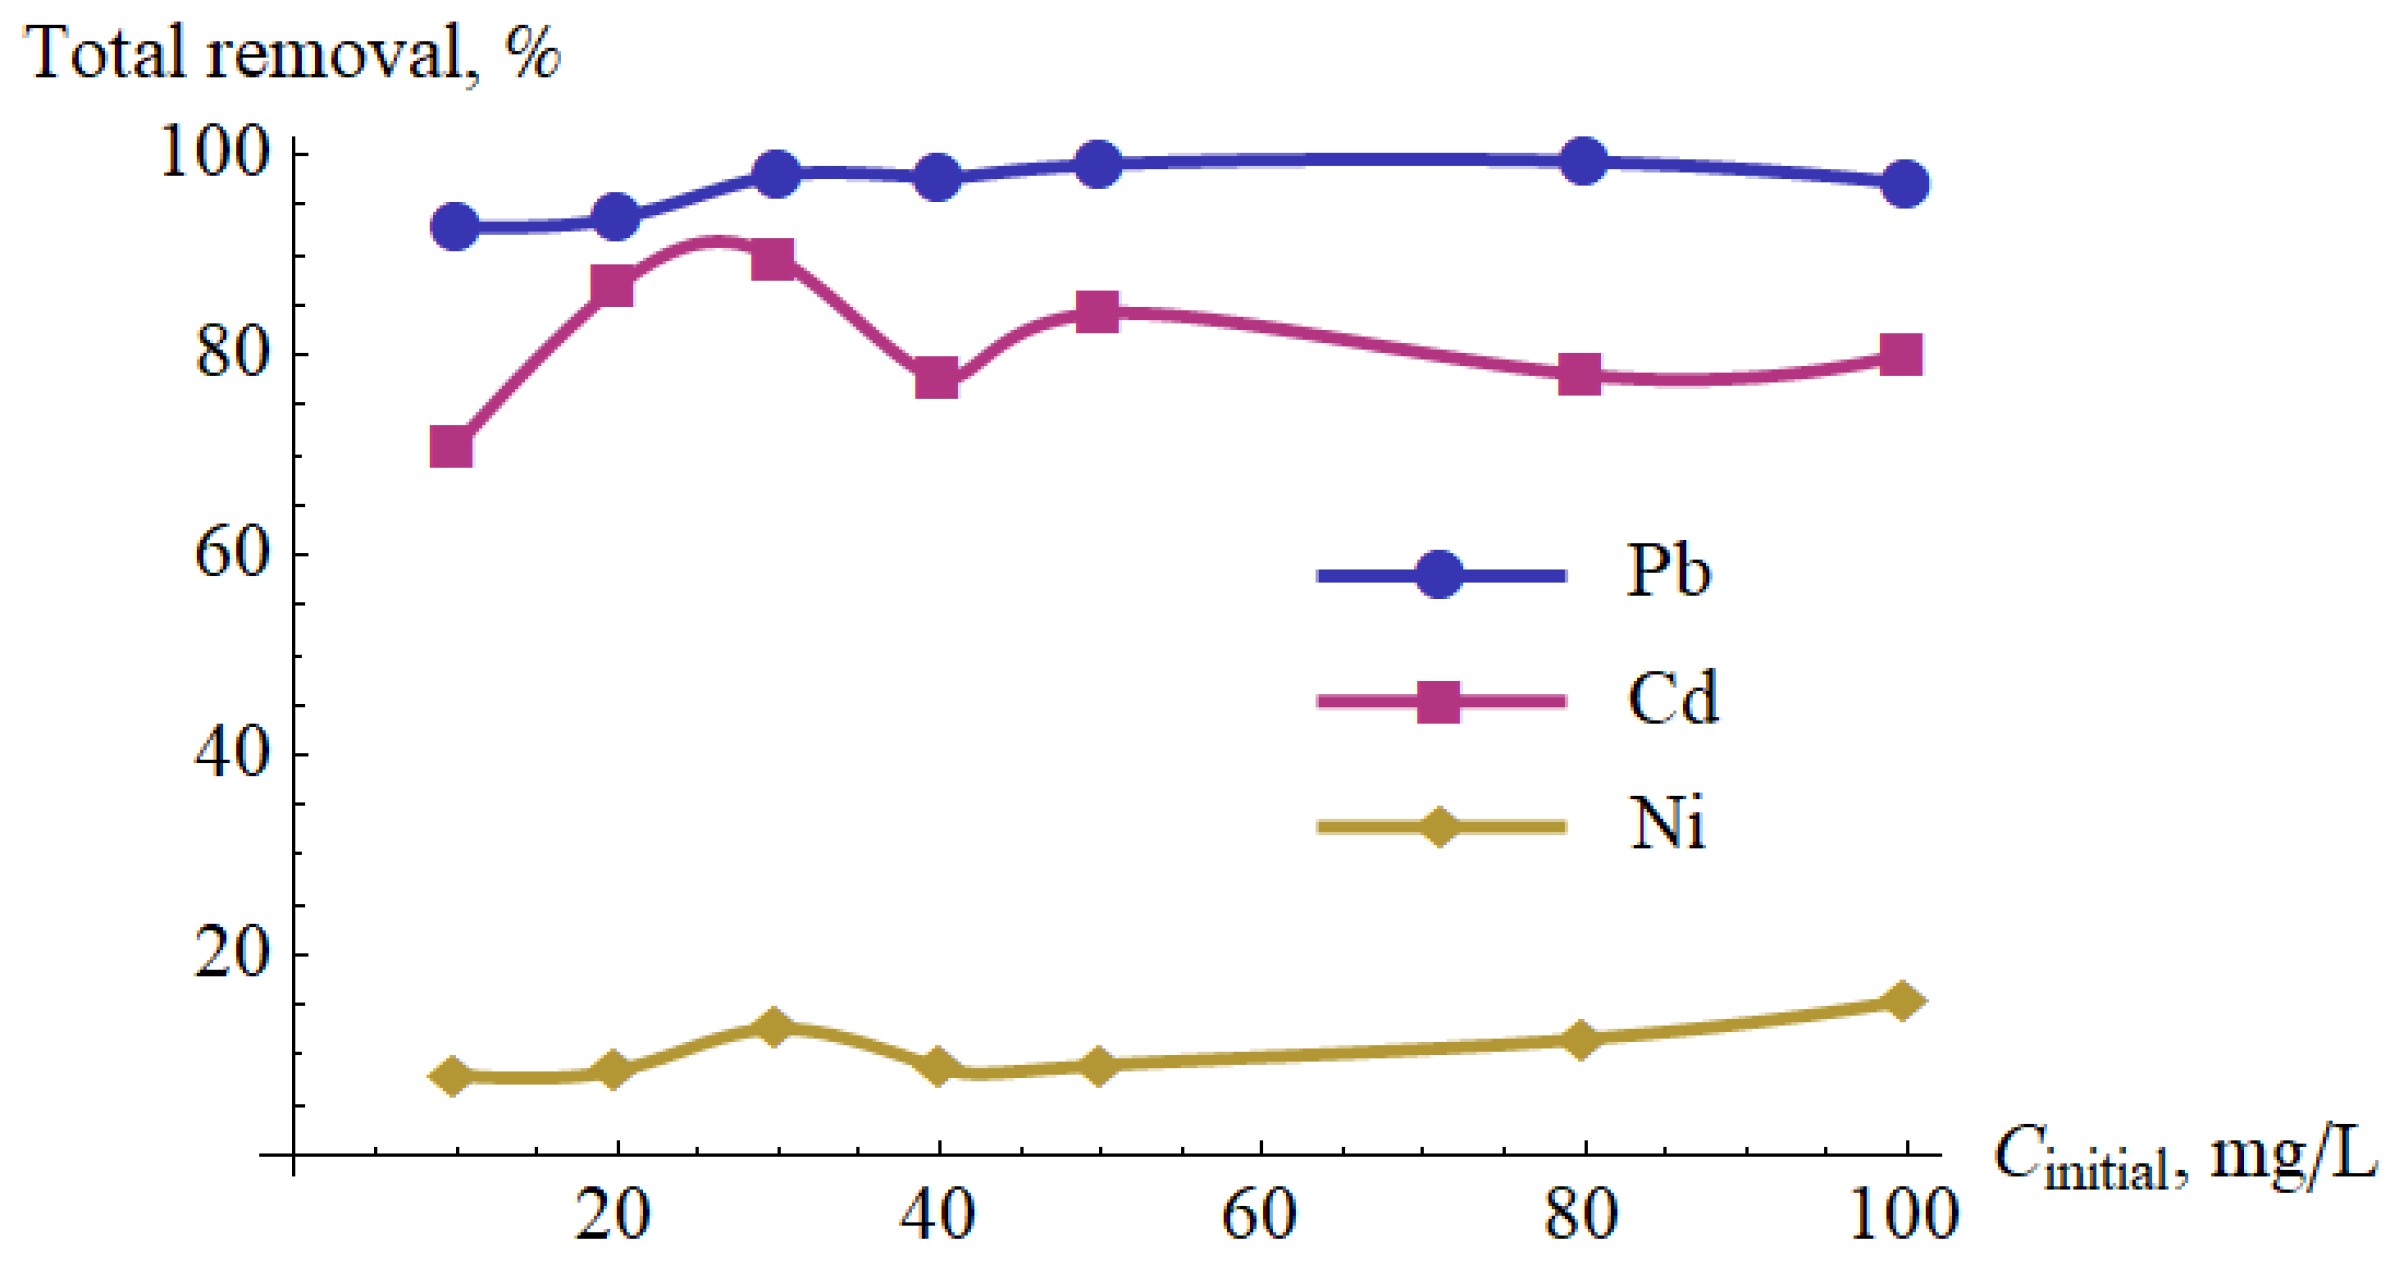
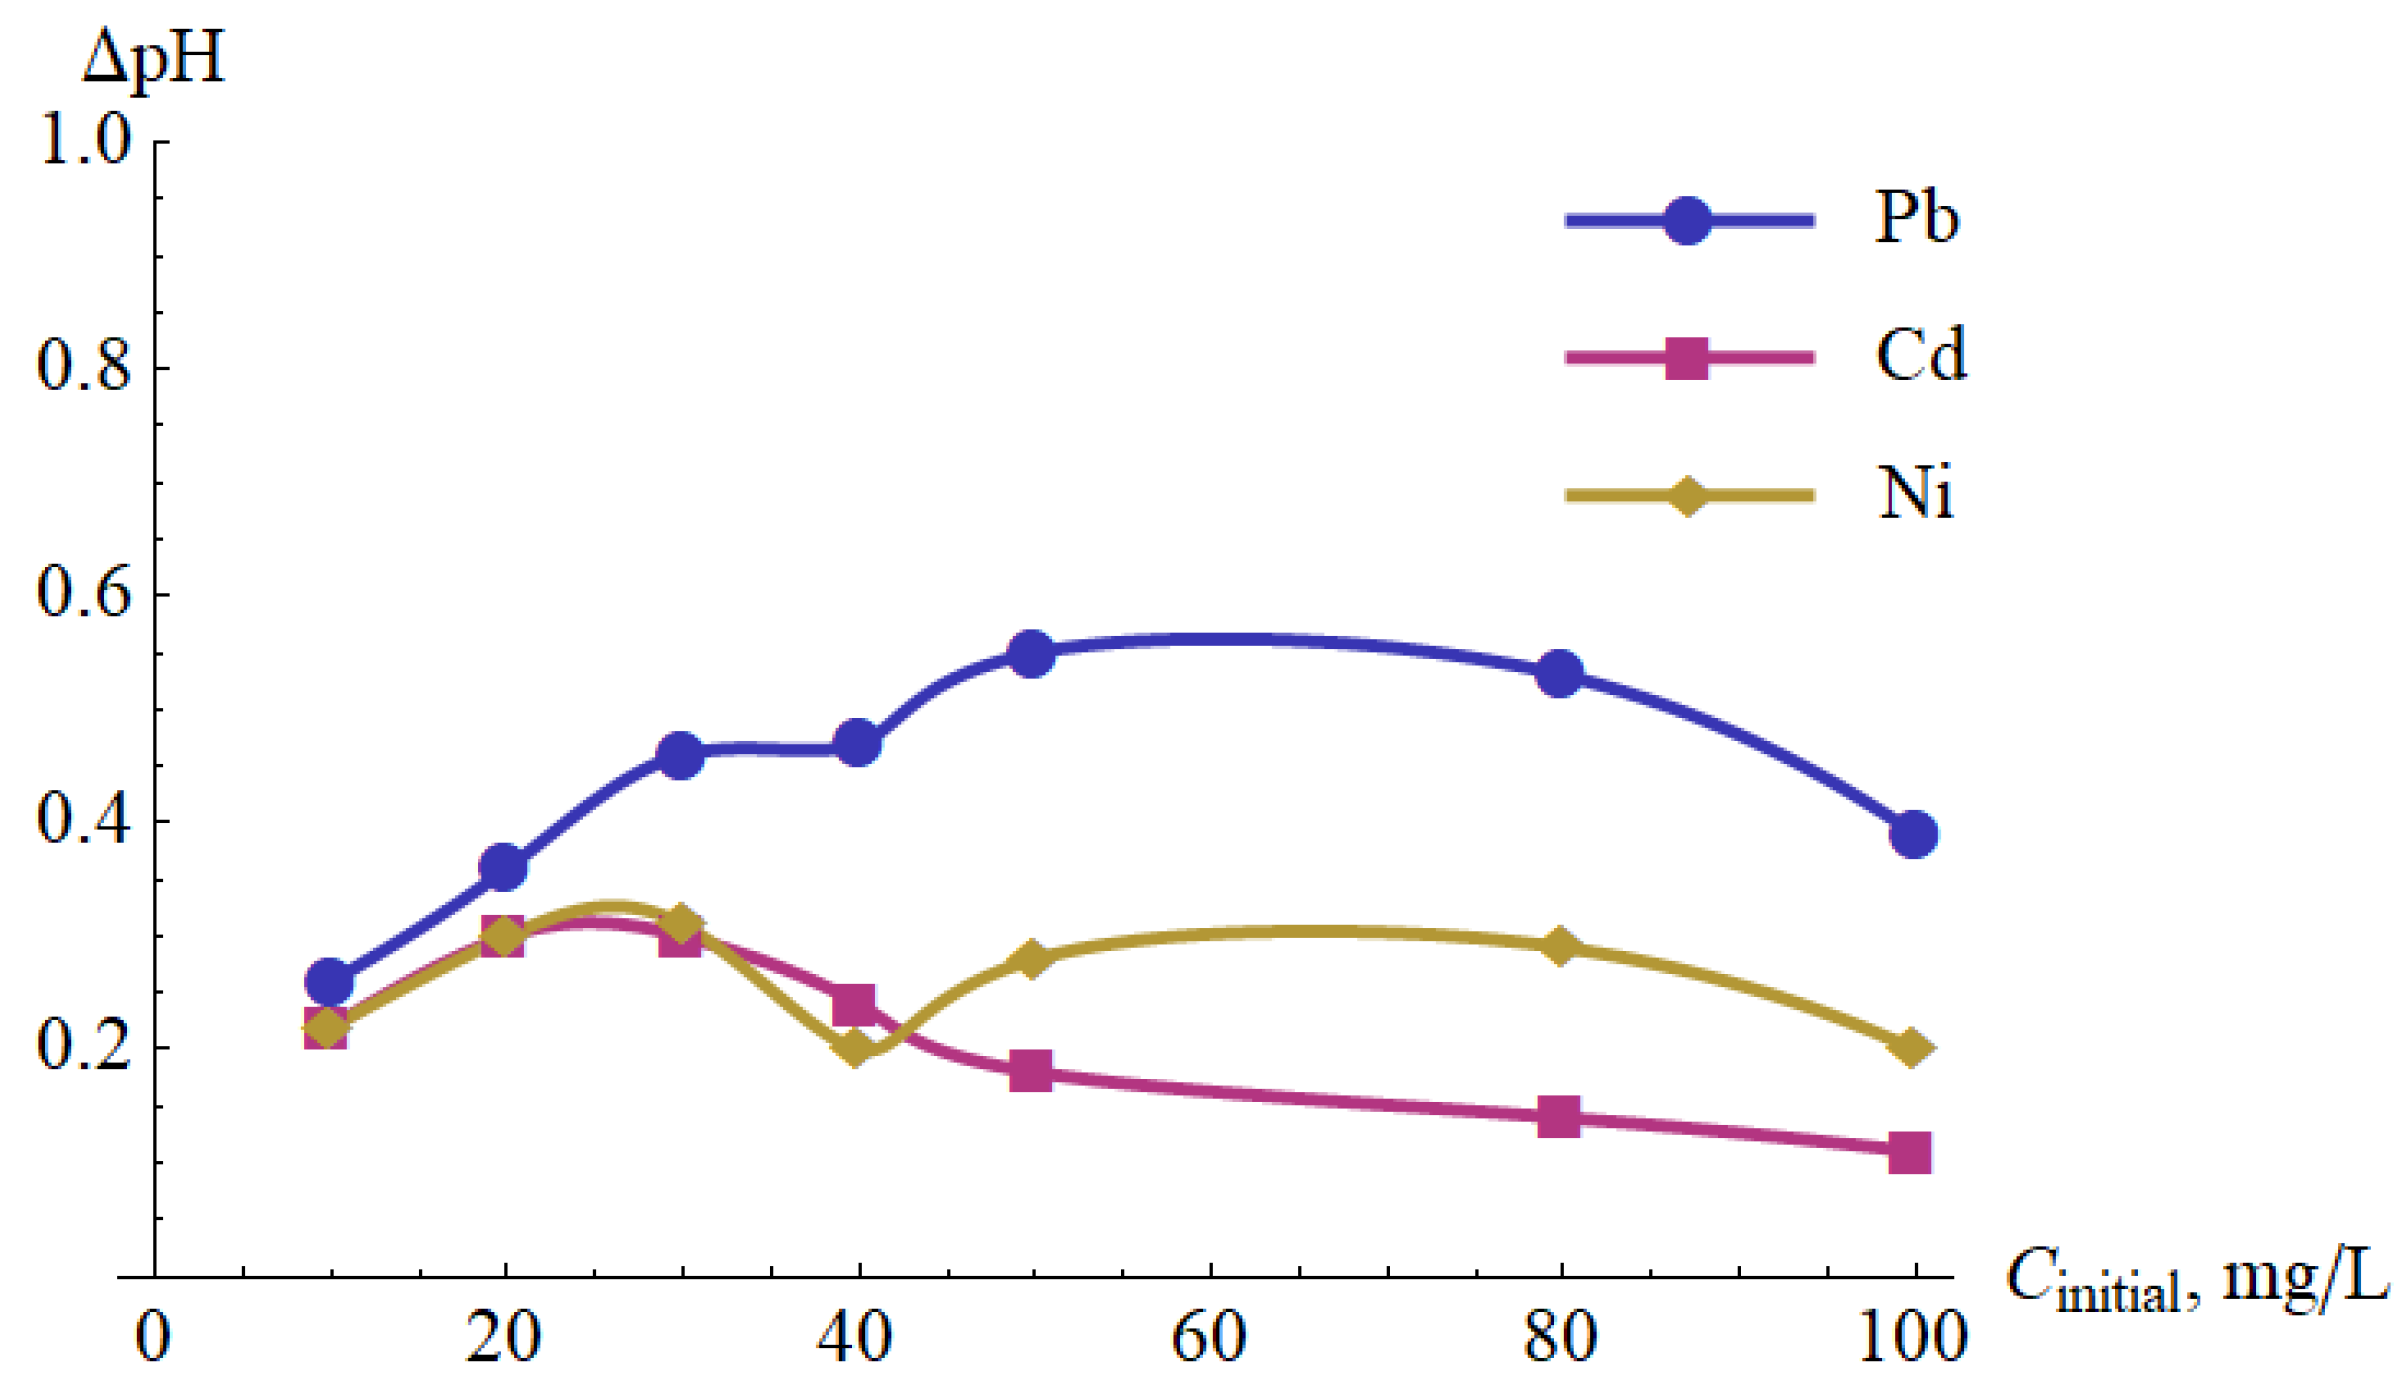
3.4. Studies on the Removal of Pb(II), Cd(II) and Ni(II)
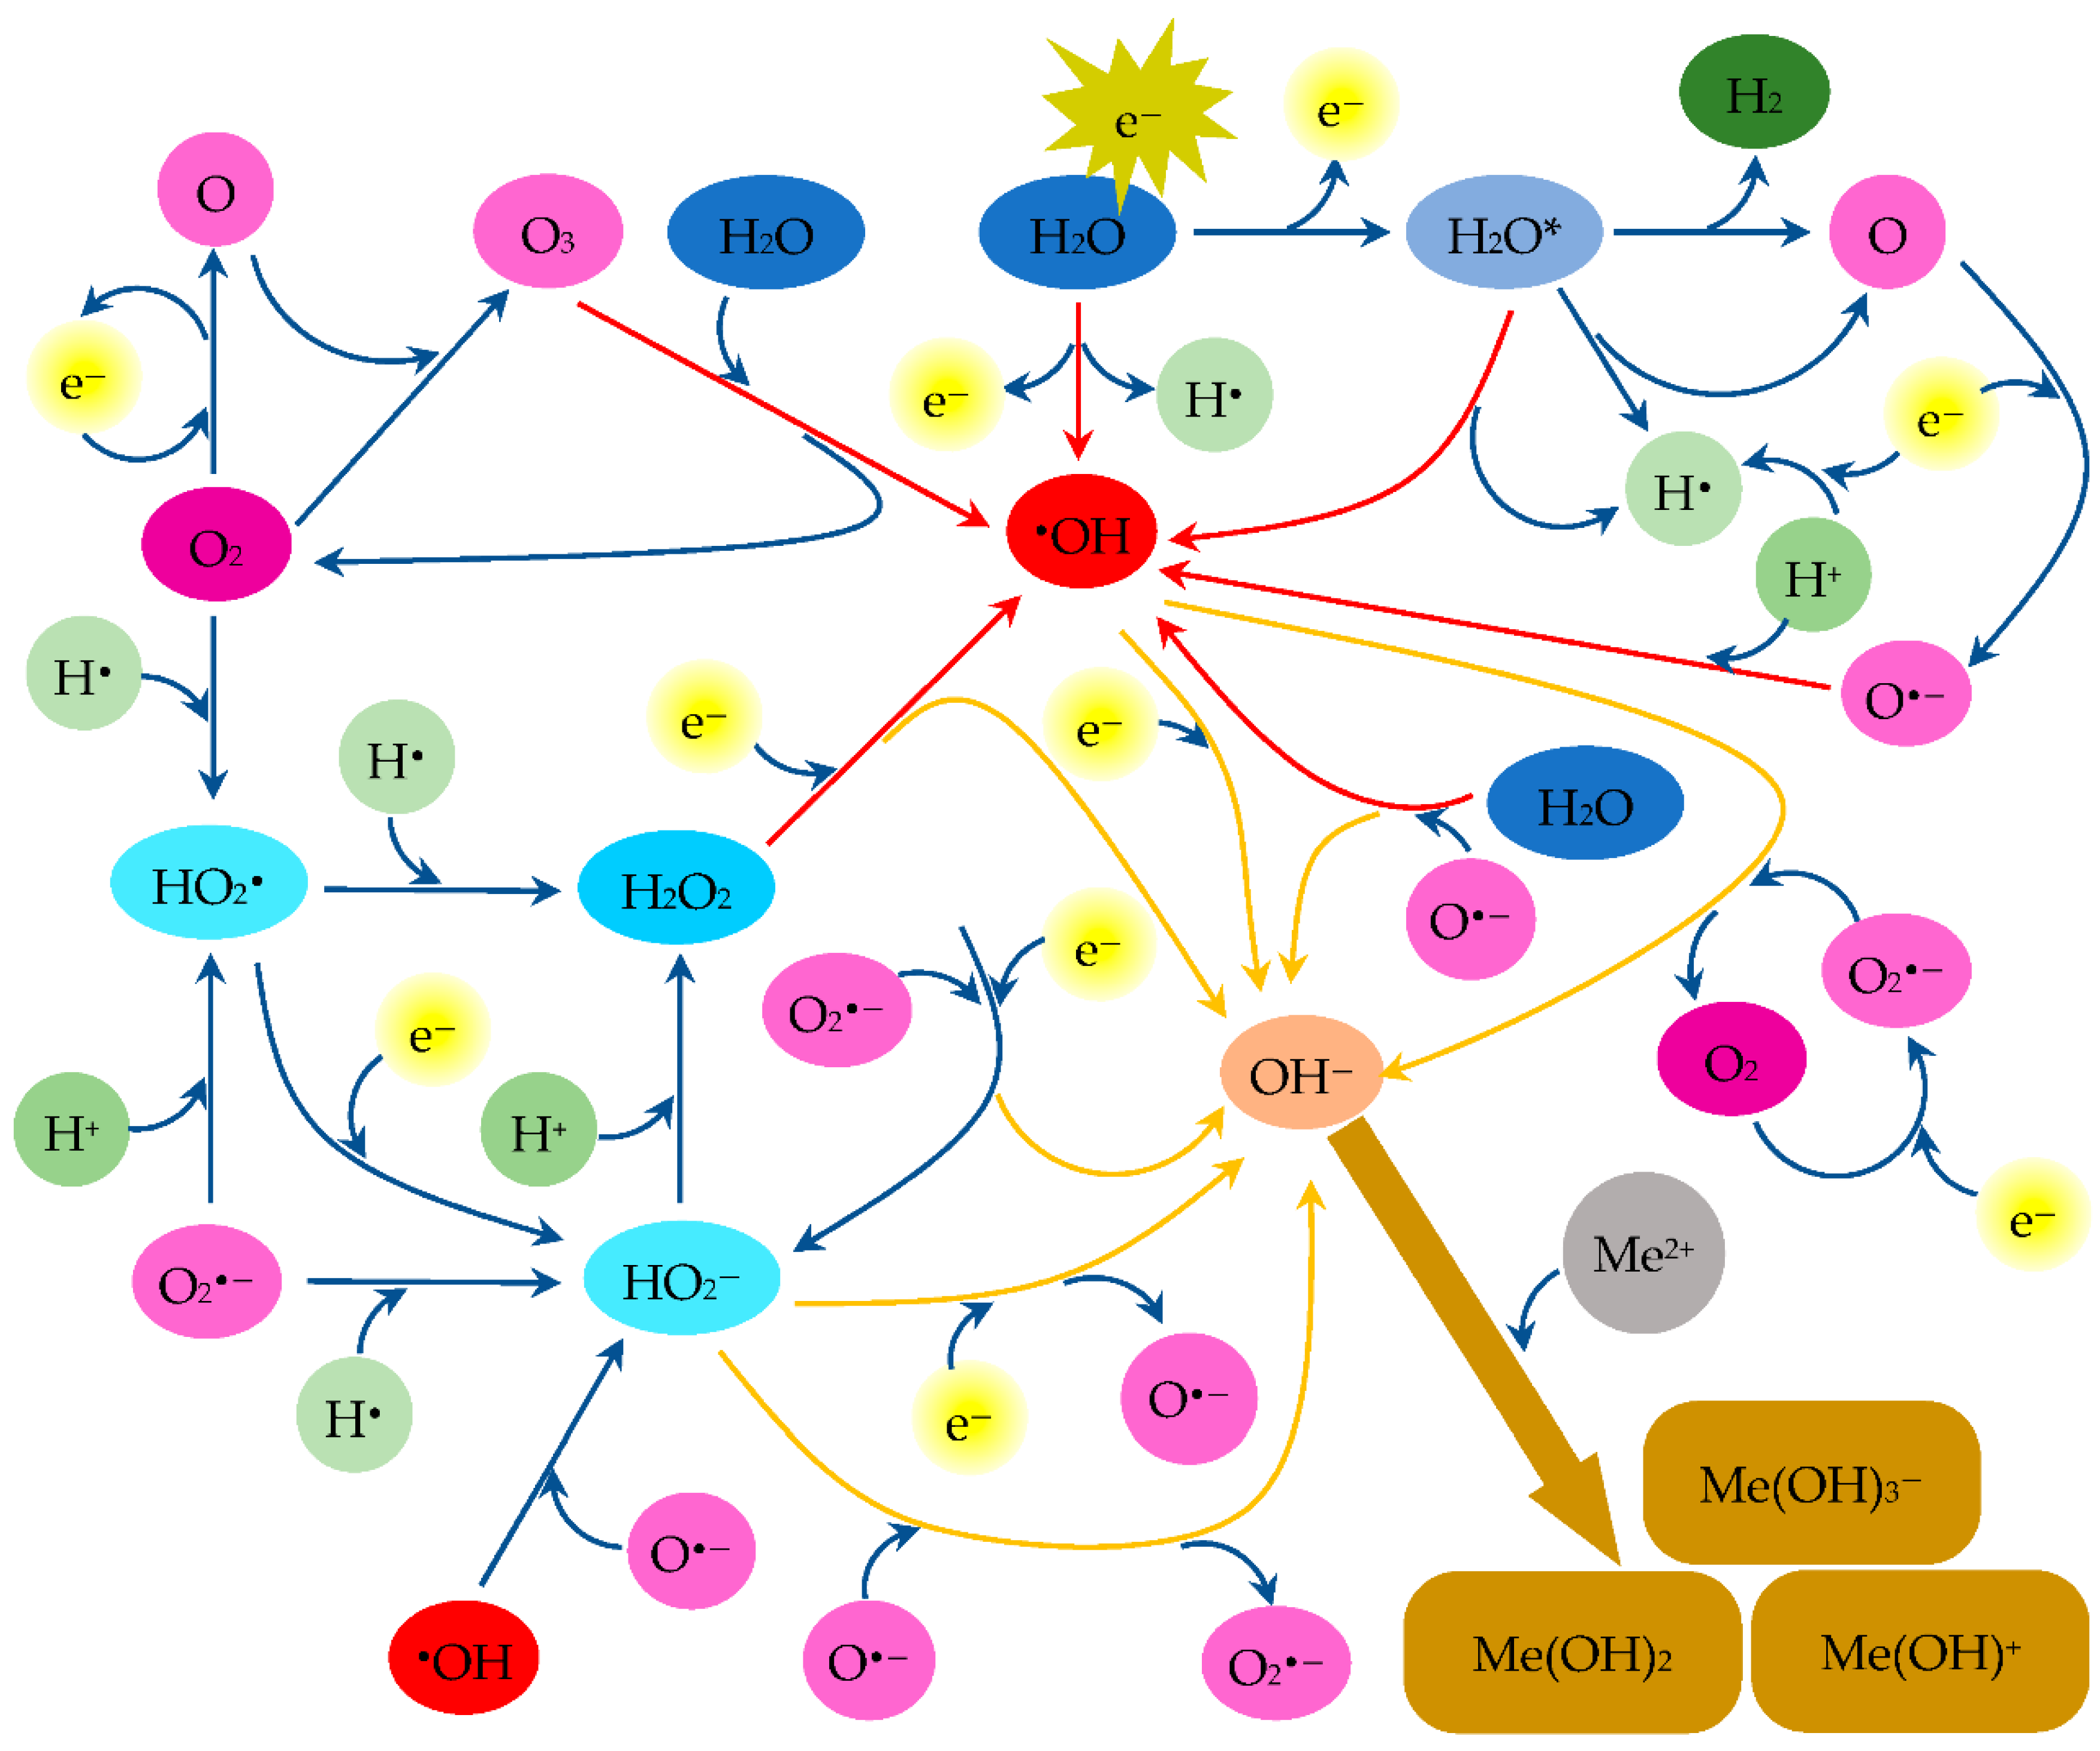
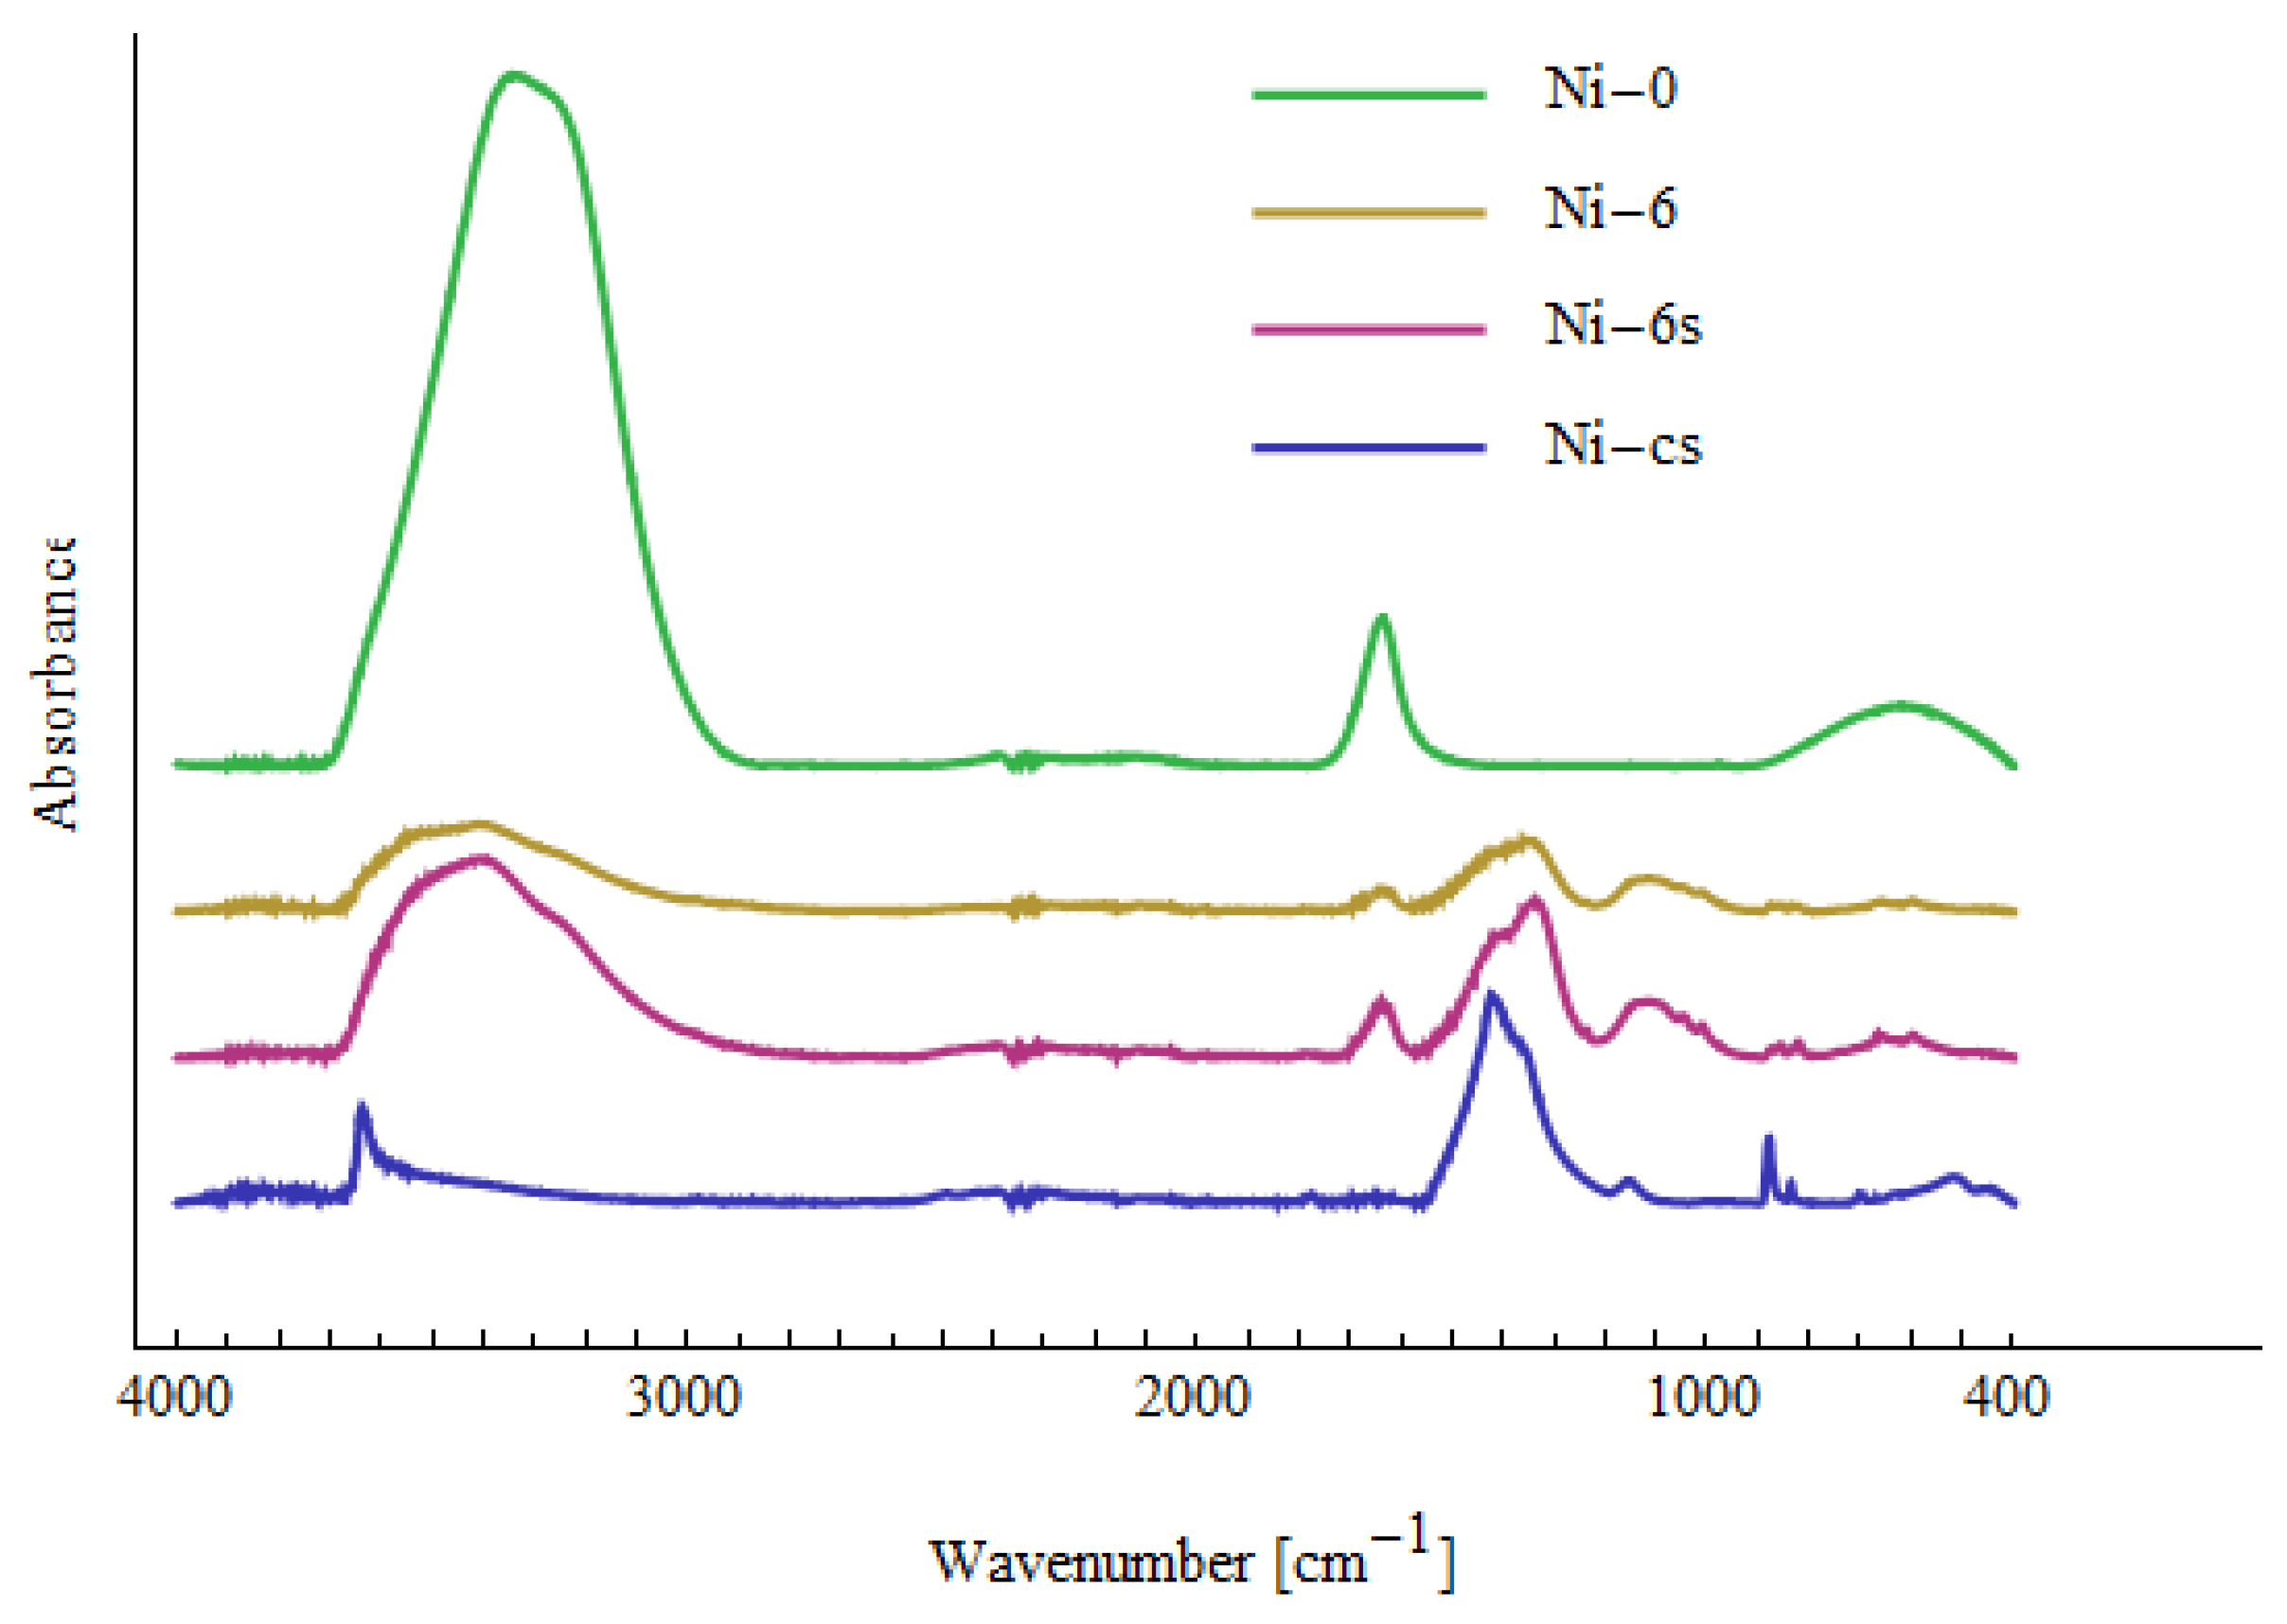
3.5. Discussion on the Mechanism of Metal Ion Removal
3.6. Comparison with Chemical Precipitation
4. Conclusions
- Cold plasma with a dielectric barrier discharge can be used to remove metal ions from aqueous solutions; in the considered case, the percentage removal was 72% for Pb(II), 88% for Cd(II) and 19% for Ni(II).
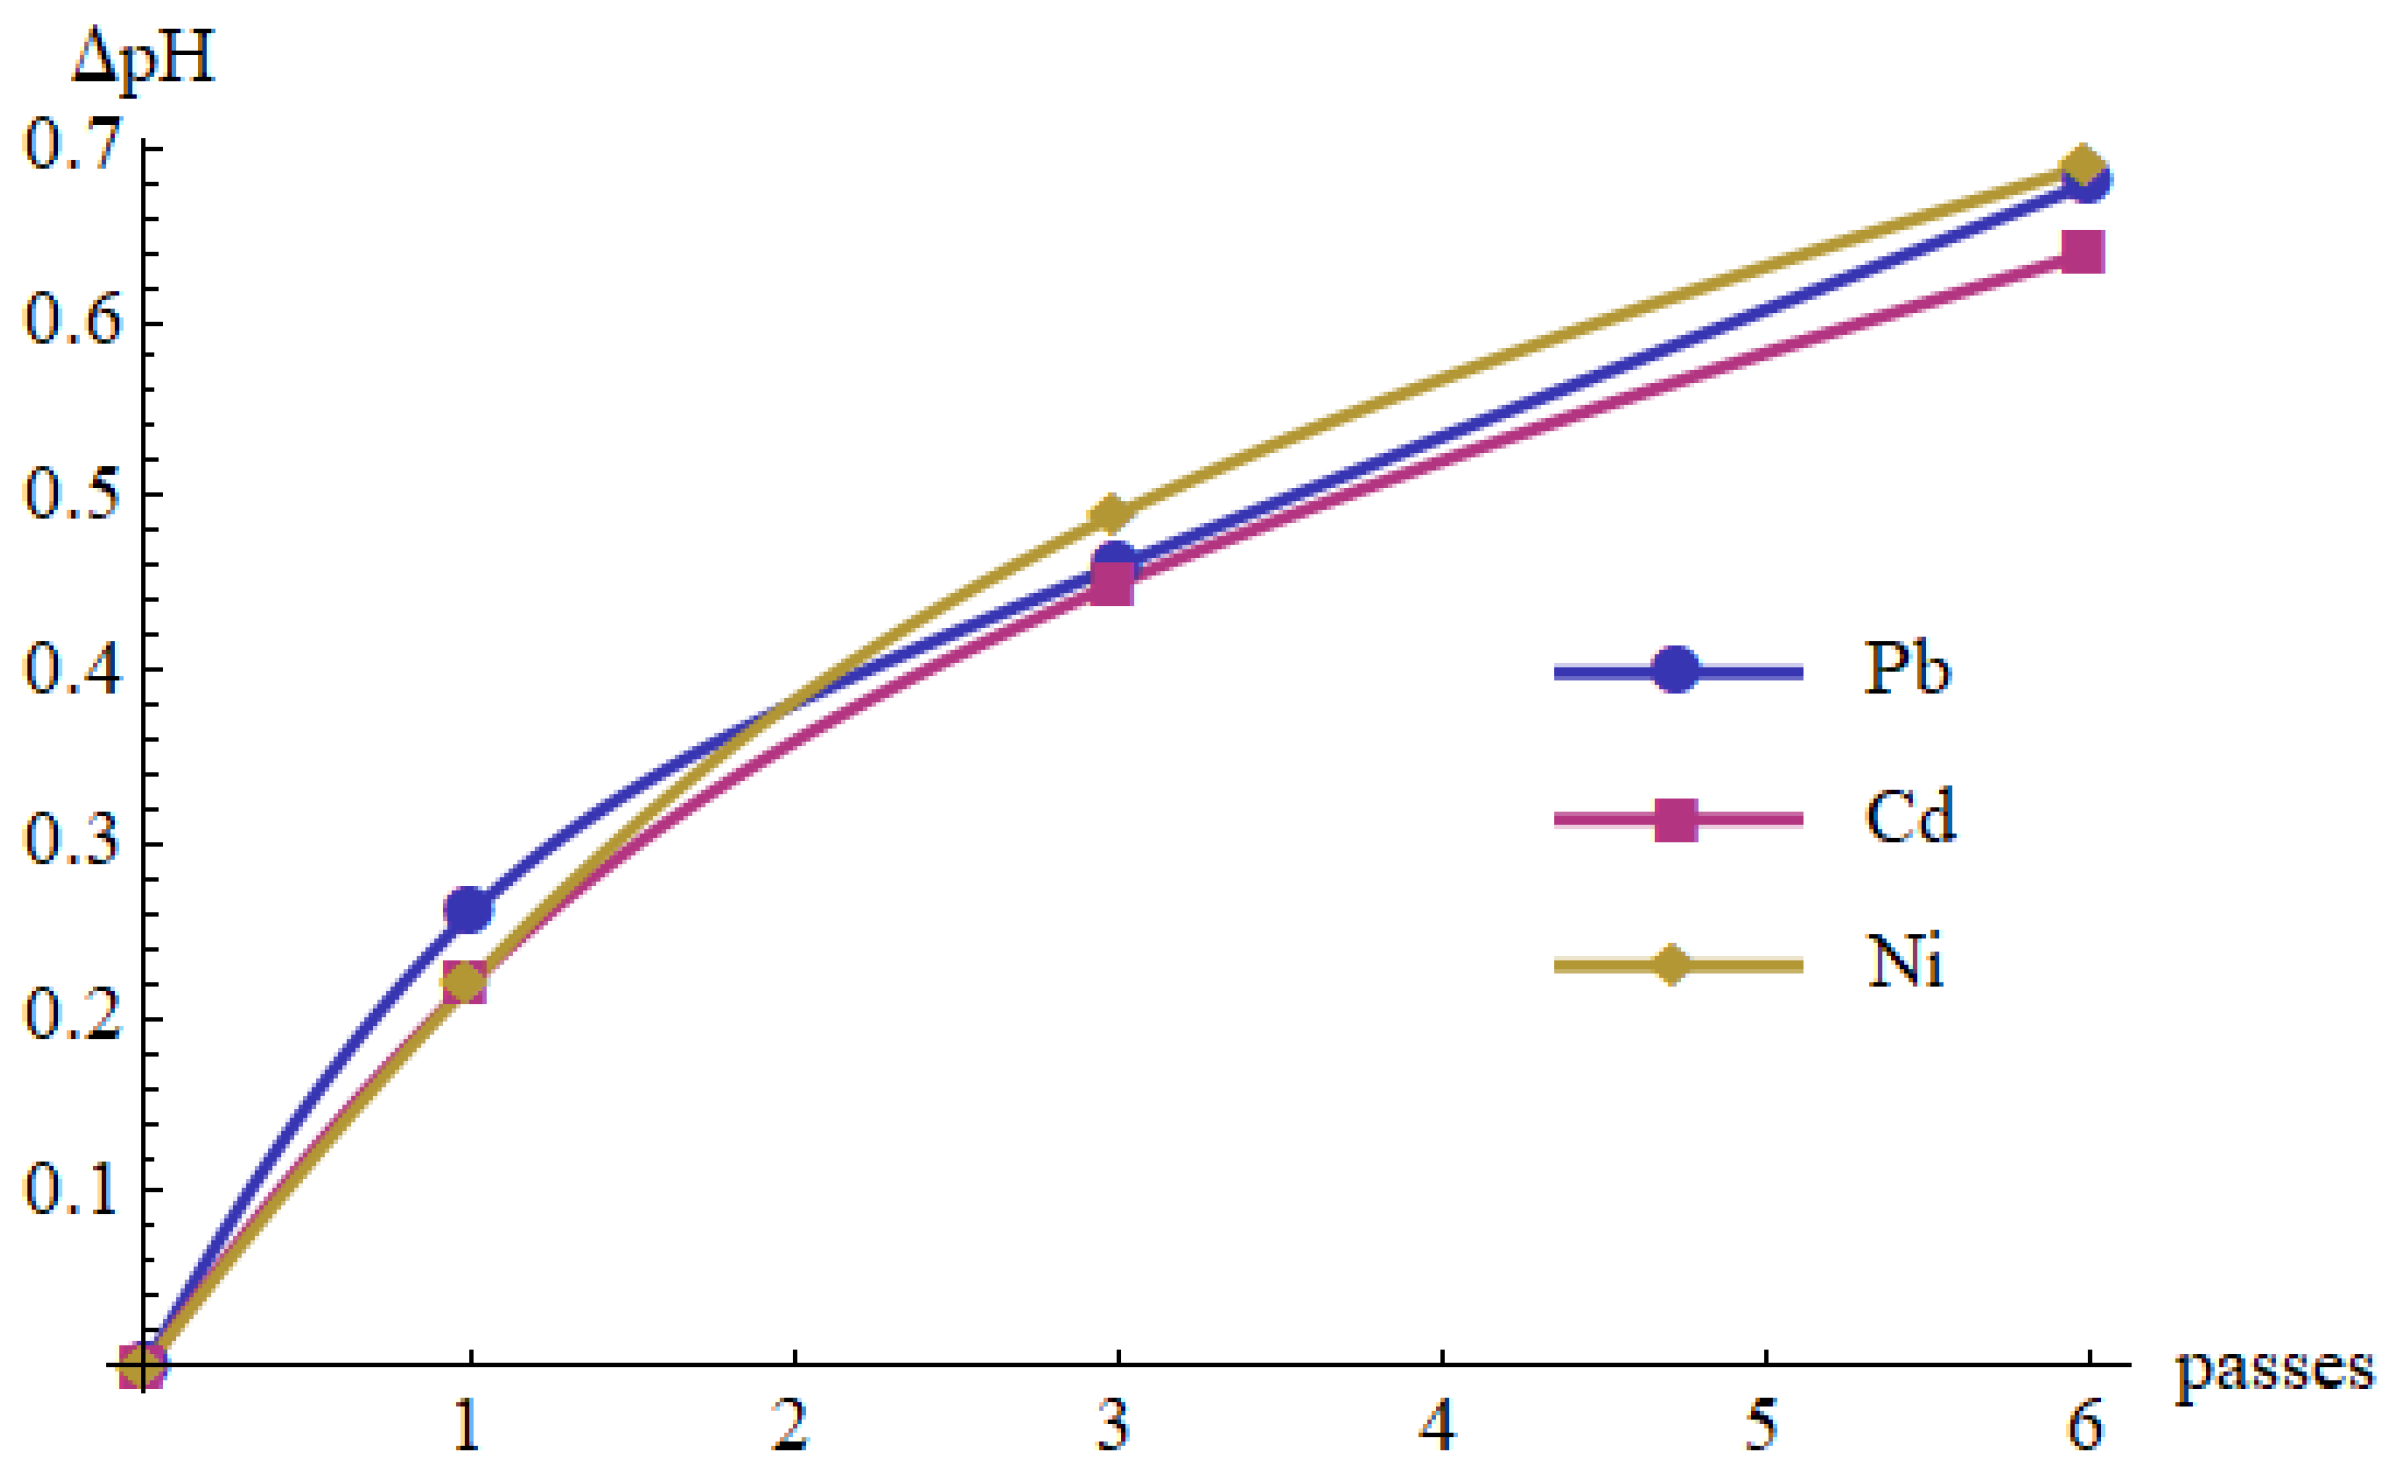
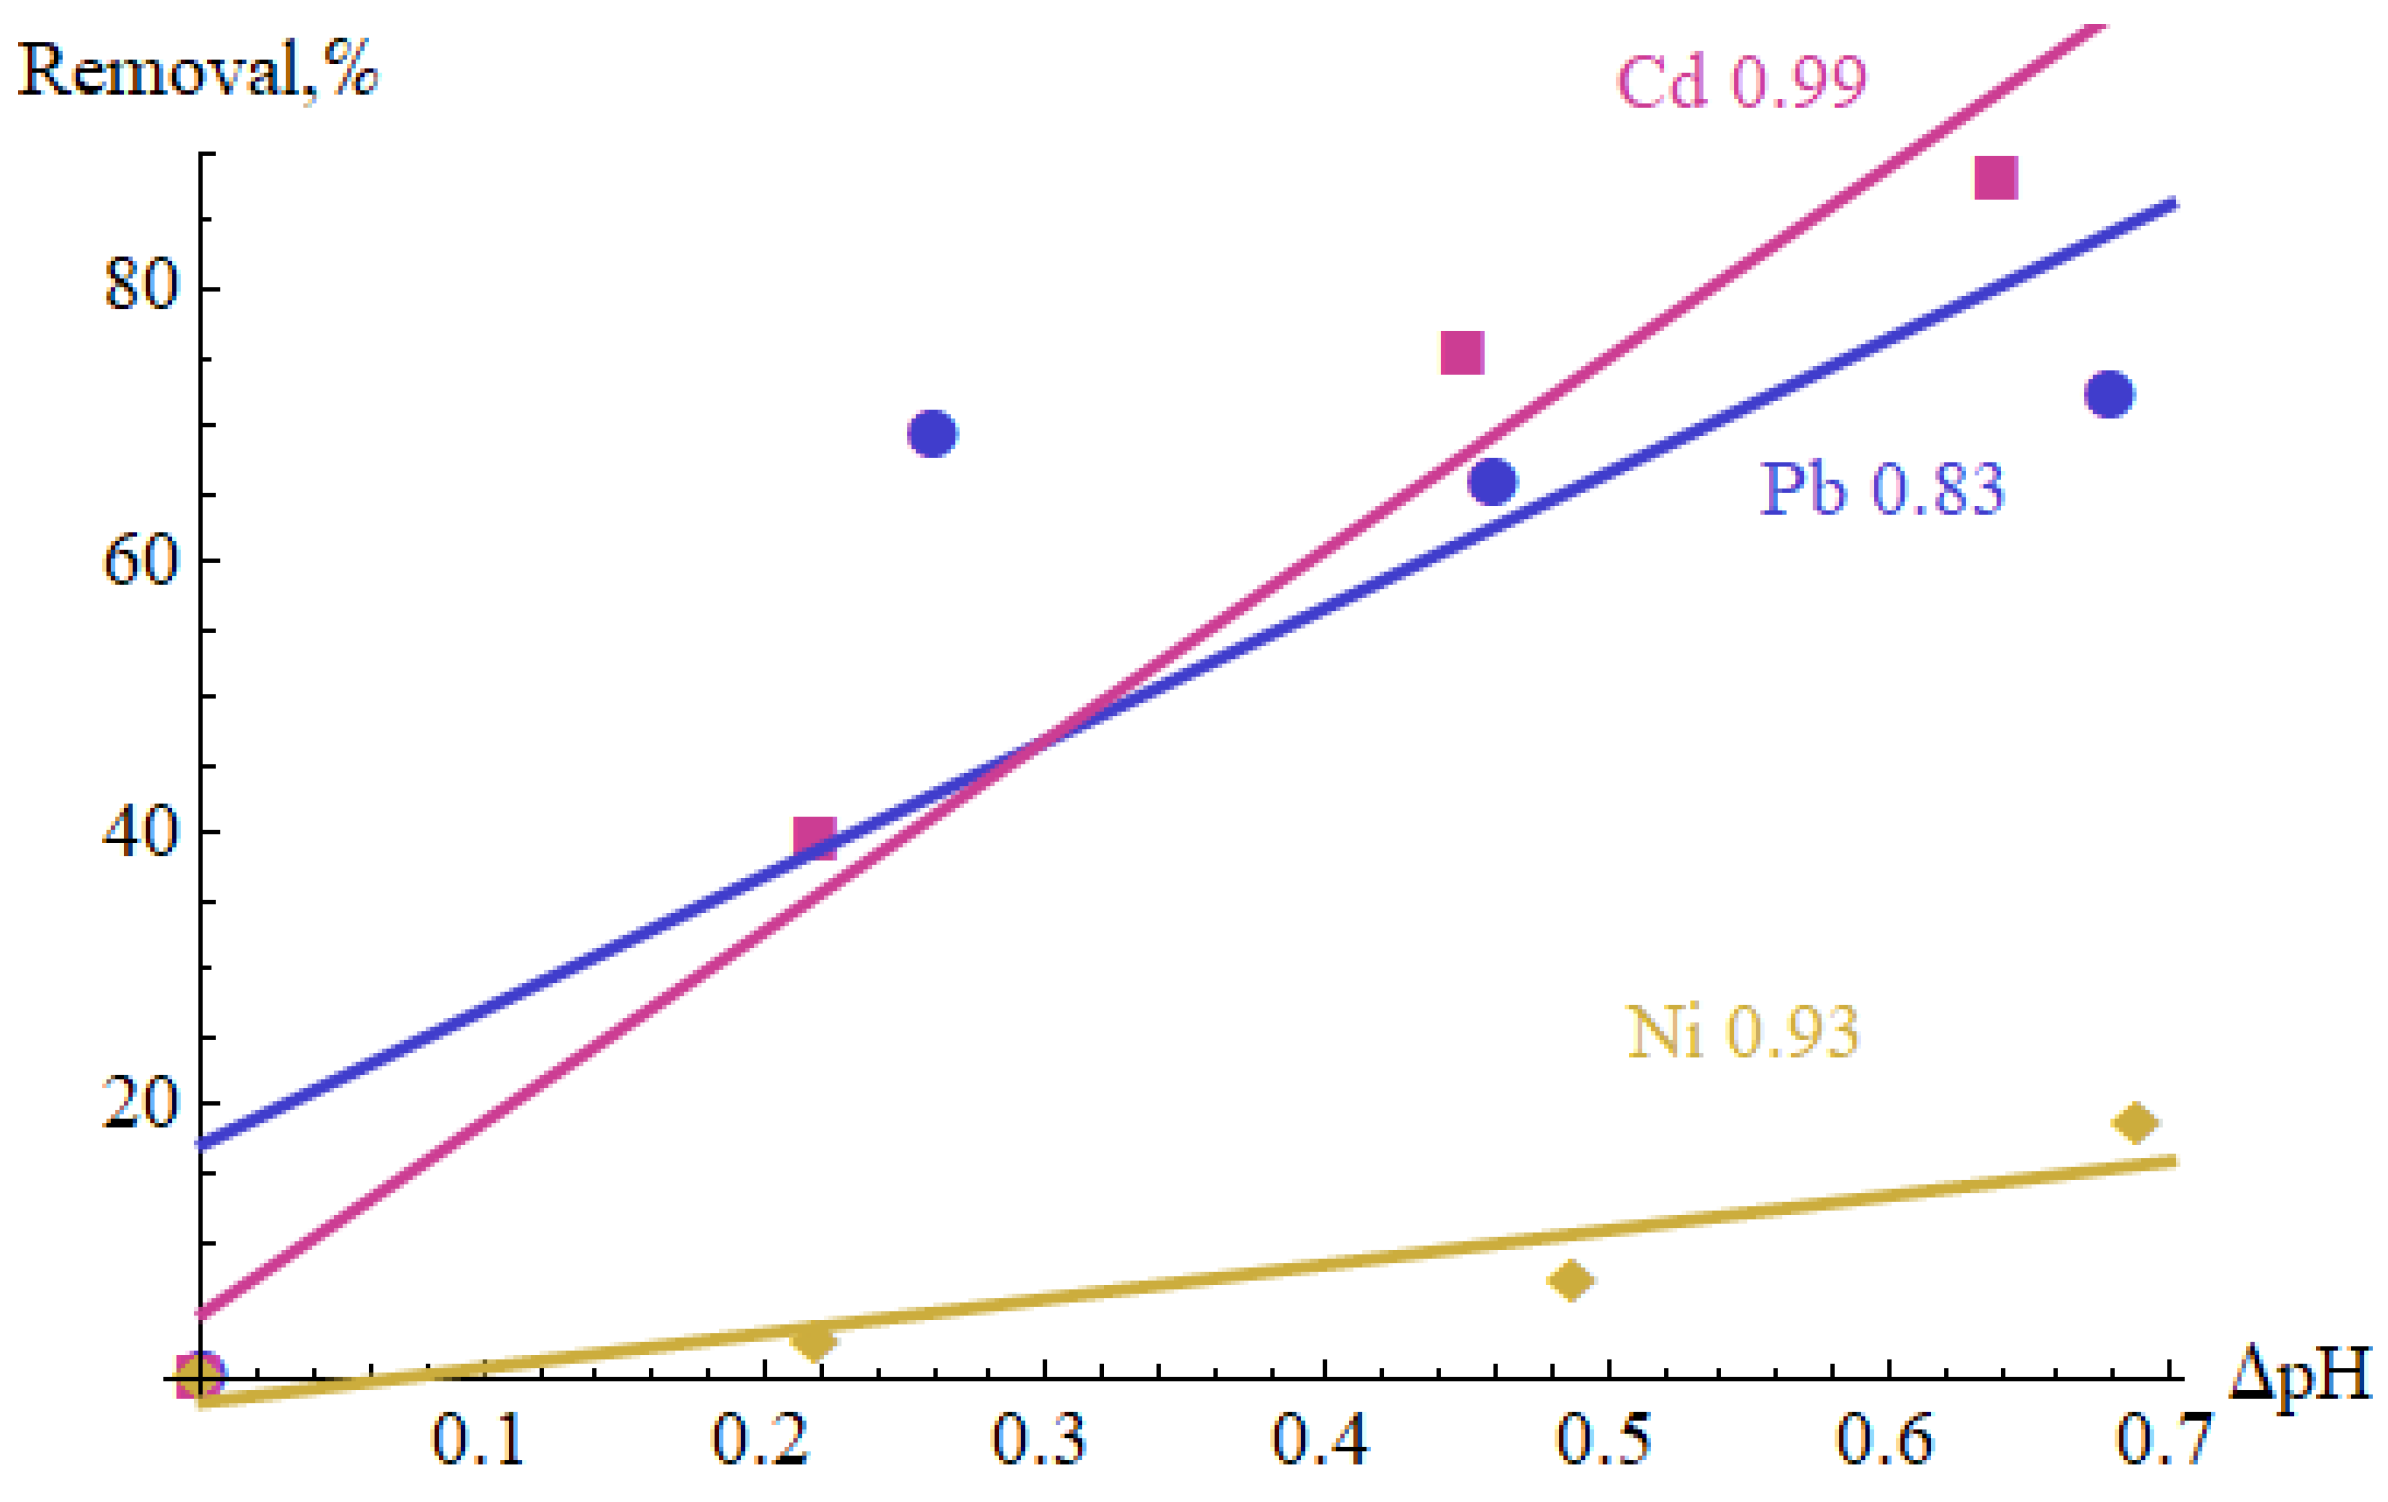
- The removal mechanism is based on an increase in pH of the solution affected by the cold plasma. Each pass of the solution through the cold plasma reactor increased pH by around 0.1–0.2; therefore, a significant effect on pH increase requires several passes (cycles) of the same solution through the cold plasma region. This may be changed by lowering the flow rate, enlarging the length of the active area or applying a cascade of several ionizers.
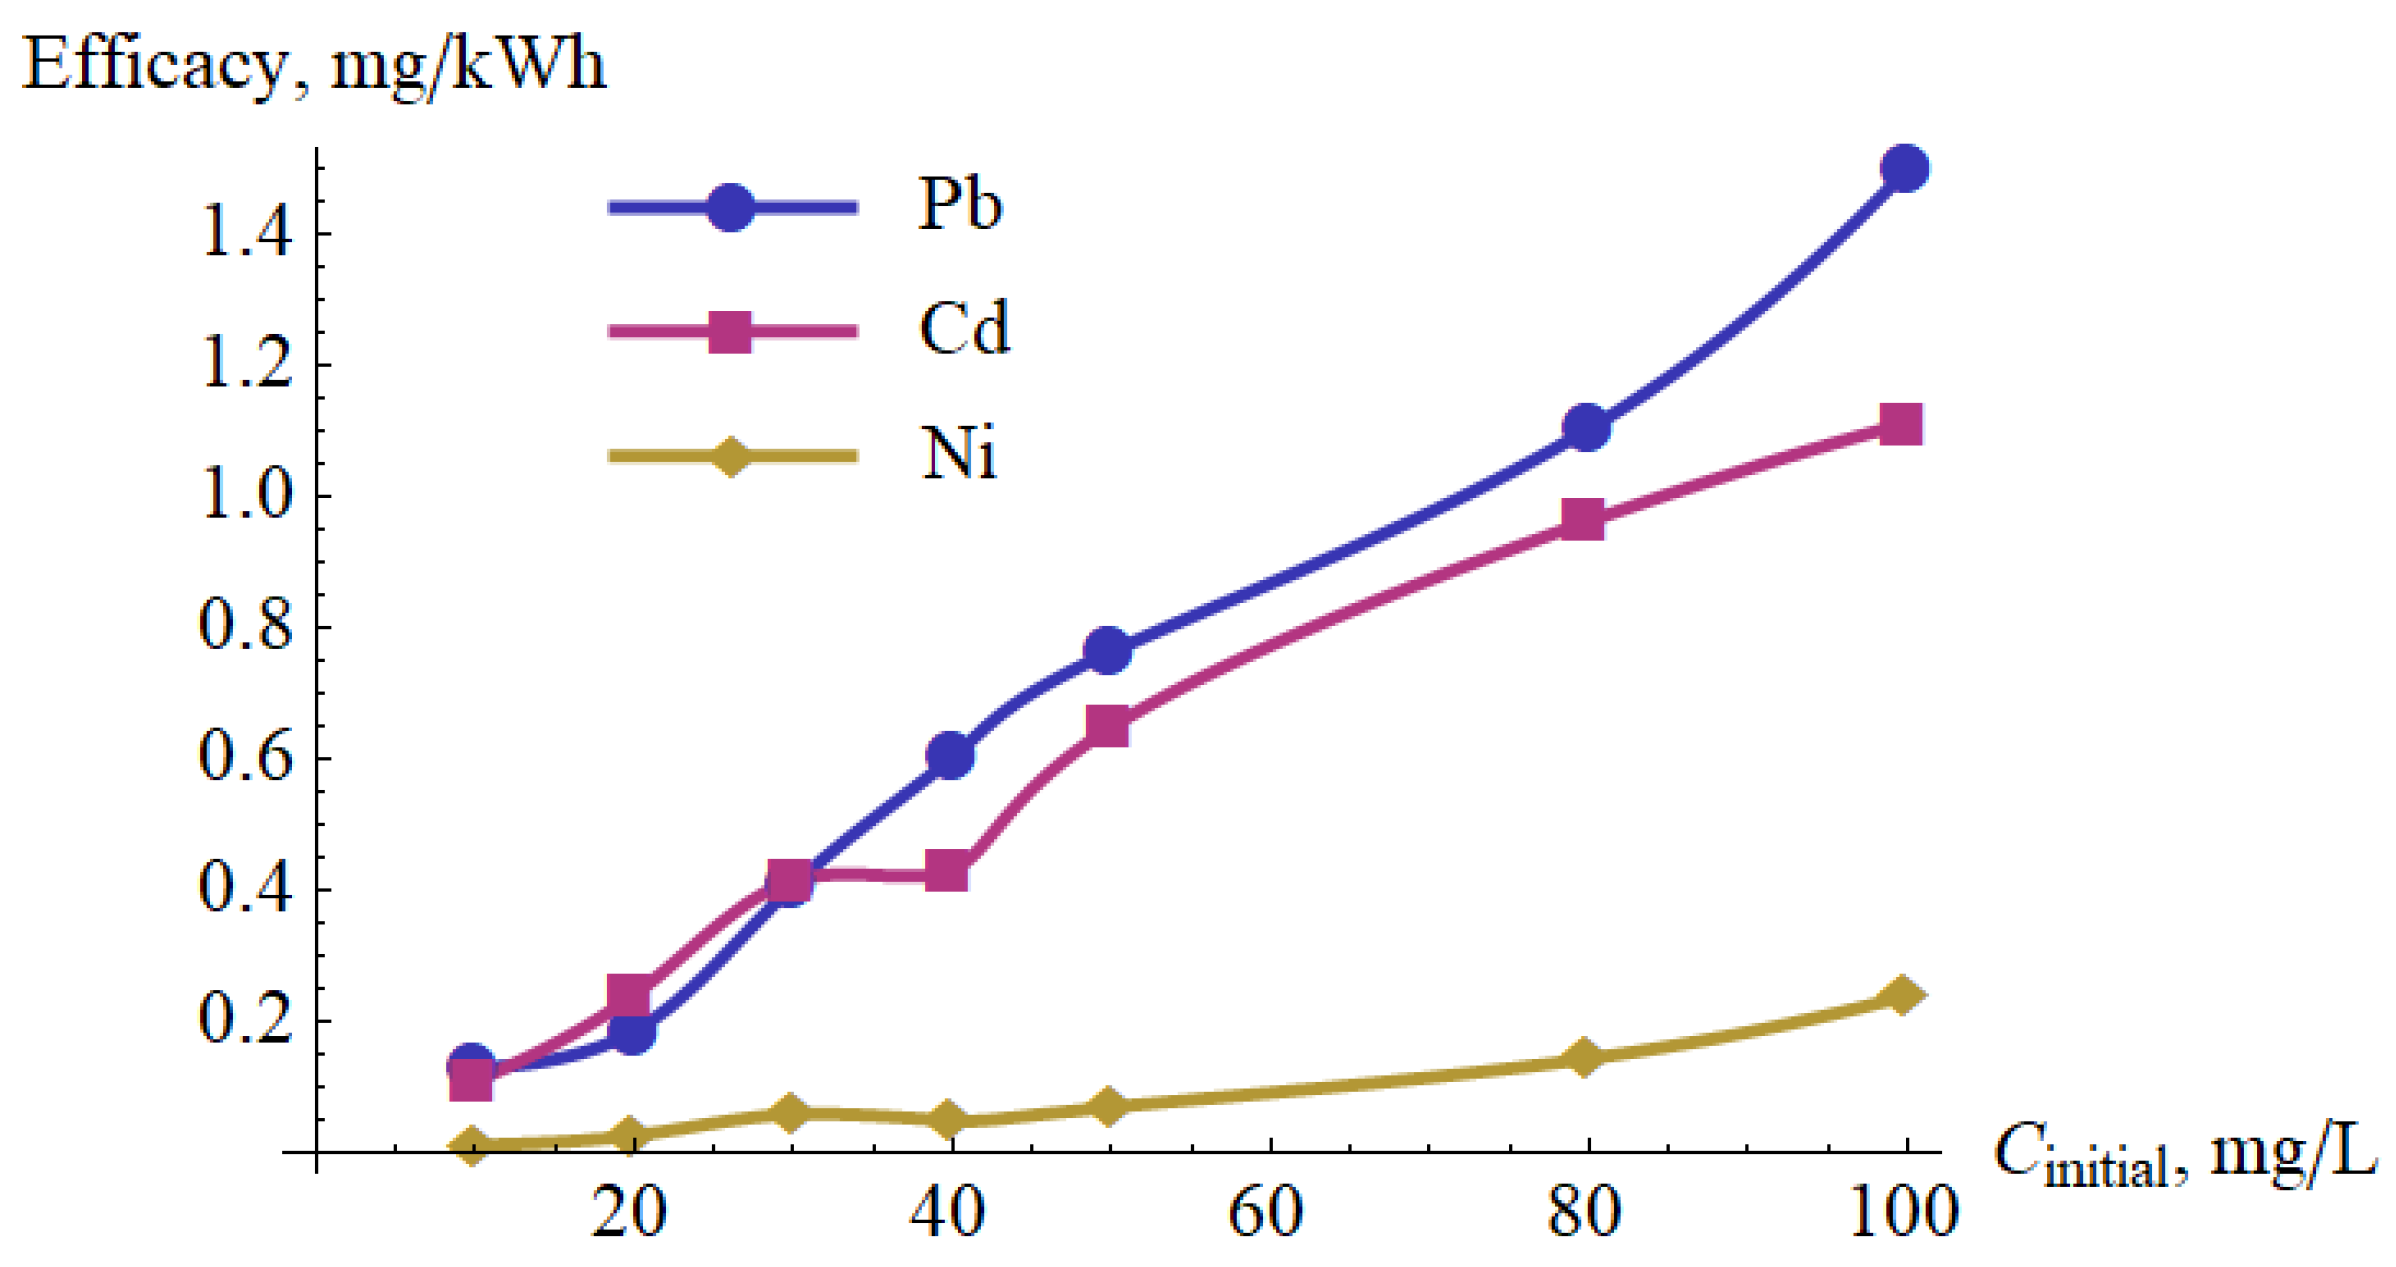
- The initial concentration of metal ions in the tested ranges had a small impact on the percentage removal of the metal ions—this method could be used for larger metal ions concentrations, because the energetical efficacy is largest.
- The optimization of the NTP generator settings confirmed that the most important is the flow rate, which should be as low as possible to increase the time of the impact of the cold plasma on the treated solution.
- The chemical indicators in the tested water mostly changed positively; in some cases, such as TOC, the change was undesired, but remained within the permissible limits.
- The total number of microorganisms dropped significantly after the cold plasma treatment, which is in agreement with the literature.
Author Contributions
Funding
Institutional Review Board Statement
Informed Consent Statement
Data Availability Statement
Conflicts of Interest
References
- Zamora-Ledezma, C.; Negrete-Bolagay, D.; Figueroa, F.; Zamora-Ledezma, E.; Ni, M.; Alexis, F.; Guerrero, V.H. Heavy metal water pollution: A fresh look about hazards, novel and conventional remediation methods. Environ. Technol. Innov. 2021, 22, 101504. [Google Scholar] [CrossRef]
- Zhang, J.H.; Xu, Y.N.; Wu, Y.G.; Hu, S.H.; Zhang, Y.J. Dynamic characteristics of heavy metal accumulation in the farmland soil over Xiaoqinling gold-mining region, Shaanxi, China. Environ. Earth Sci. 2019, 78, 25. [Google Scholar] [CrossRef]
- Carolin, C.F.; Kumar, P.S.; Saravanan, A.; Joshiba, G.J.; Naushad, M. Efficient techniques for the removal of toxic heavy metals from aquatic environment: A review. J. Environ. Chem. Eng. 2017, 5, 2782–2799. [Google Scholar] [CrossRef]
- Bislimi, K.; Halili, J.; Sahiti, H.; Bici, M.; Mazreku, I. Effect of Mining Activity in Accumulation of Heavy Metals in Soil and Plant (Urtica dioica L.). J. Ecol. Eng. 2021, 22, 1–7. [Google Scholar] [CrossRef]
- Jaishankar, M.; Tseten, T.; Anbalagan, N.; Mathew, B.B.; Beeregowda, K.N. Toxicity, mechanism and health effects of some heavy metals. Interdiscip. Toxicol. 2014, 7, 60–72. [Google Scholar] [CrossRef] [Green Version]
- Szarek-Gwiazda, E. Metale Ciężkie. In Zbiornik Wody Dobrzyce; Sądag, T., Banduła, T., Materek, E., Mazurkiewicz-Boroń, G., Słonka, R., Eds.; Regionalny Zarząd Gospodarki Wodnej: Kraków, Poland, 2016; pp. 153–158. (In Polish) [Google Scholar]
- Usman, K.; Al-Ghouti, M.A.; Abu-Dieyeh, M.H. The assessment of cadmium, chromium, copper, and nickel tolerance and bioaccumulation by shrub plant Tetraena qataranse. Sci. Rep. 2019, 9, 5658. [Google Scholar] [CrossRef] [Green Version]
- Kabata-Pendias, A.; Pendias, H. Biochemia Pierwiastków Śladowych; Wyd. Nauk. PWN: Warszawa, Poland, 1999. (In Polish) [Google Scholar]
- Gill, R.A.; Kanwar, M.K.; Rodrigues dos Reis, A.; Ali, B. Editorial: Heavy Metal Toxicity in Plants: Recent Insights on Physiological and Molecular Aspects. Front. Plant Sci. 2022, 12, 830682. [Google Scholar] [CrossRef]
- Migaszewski, Z.M.; Gałuszka, A. Podstawy Geochemii Środowiska; Wyd. Nauk-Tech.: Warszawa, Poland, 2007. (In Polish) [Google Scholar]
- Jabłońska, B. Optimization of Ni(II), Pb(II), and Zn(II) Ion Adsorption Conditions on Pliocene Clays from Post-Mining Waste. Minerals 2021, 11, 568. [Google Scholar] [CrossRef]
- Güyer, G.T.; Nadeem, K.; Dizge, N. Recycling of pad-batch washing textile wastewater through advanced oxidation processes and its reusability assessment for Turkish textile industry. J. Clean. Prod. 2016, 139, 488–494. [Google Scholar] [CrossRef]
- Jabłońska, B. Water consumption management in polyethylene terephthalate (PET) bottles washing process via wastewater pretreatment and reuse. J. Environ. Manag. 2018, 224, 215–224. [Google Scholar] [CrossRef]
- Azetsu-Scott, K.; Yeats, P.; Wohlgeschaffen, G.; Dalziel, J.; Niven, S.; Lee, K. Precipitation of heavy metals in produced water: Influence on contaminant transport and toxicity. Mar. Environ. Res. 2007, 63, 146–167. [Google Scholar] [CrossRef] [PubMed] [Green Version]
- Liang, S.; Cao, S.; Liu, C.; Zeb, S.; Cui, Y.; Sun, G. Heavy metal adsorption using structurally preorganized adsorbent. RSC Adv. 2020, 10, 7259–7264. [Google Scholar] [CrossRef] [PubMed]
- Jabłońska, B. Removing of Cr(III) and Cr(VI) compounds from aqueous solutions by shale waste rocks. Desalination Water Treat. 2020, 186, 234–246. [Google Scholar] [CrossRef]
- Zhao, X.; Yu, X.; Wang, X.; Lai, S.; Sun, Y.; Yang, D. Recent advances in metal-organic frameworks for the removal of heavy metal oxoanions from water. Chem. Eng. J. 2021, 407, 127221. [Google Scholar] [CrossRef]
- Bashir, A.; Malik, L.A.; Ahad, S.; Manzoor, T.; Bhat, M.A.; Dar, G.N.; Pandith, A.H. Removal of heavy metal ions from aqueous system by ion-exchange and biosorption methods. Environ. Chem. Lett. 2019, 17, 729–754. [Google Scholar] [CrossRef]
- Thaçi, B.S.; Gashi, S.T. Reverse Osmosis Removal of Heavy Metals from Wastewater Effluents Using Biowaste Materials Pretreatment. Pol. J. Environ. Stud. 2019, 28, 337–341. [Google Scholar] [CrossRef]
- Khulbe, K.C.; Matsuura, T. Removal of heavy metals and pollutants by membrane adsorption techniques. Appl. Water Sci. 2018, 8, 19. [Google Scholar] [CrossRef] [Green Version]
- Gering, K.L.; Scamehorn, J.F. Use of Electrodialysis to Remove Heavy Metals from Water. Sep. Sci. Technol. 1988, 23, 2231–2267. [Google Scholar] [CrossRef]
- Jiang, B.; Zheng, J.T.; Qiu, S.; Wu, M.B.; Zhang, W.H.; Yan, Z.F.; Xue, Q.H. Review on electrical discharge plasma technology for wastewater remediation. Chem. Eng. J. 2014, 236, 348–368. [Google Scholar] [CrossRef]
- Khanom, S.; Hayashi, N. Removal of metal ions from water using oxygen plasma. Sci. Rep. 2021, 11, 9175. [Google Scholar] [CrossRef]
- Rostami, R.; Moussavi, G.; Darbari, S.; Jafari, A.J. Non-thermal plasma by positive corona glow discharge using nano-structured Cu/CuO coated electrodes for benzene removal from air flow; removal enhancement and energy efficiency improvement. Sep. Purif. Technol. 2021, 275, 119156. [Google Scholar] [CrossRef]
- Barbusiński, K. Advanced Oxidation in the Treatment of Selected Industrial Wastewater; Wyd. Politechniki Śląskiej: Gliwice, Poland, 2013. (In Polish) [Google Scholar]
- Attri, P.; Arora, B.; Bhatia, R.; Venkatesu, P.; Choi, E.H. Plasma Technology: A New Remediation for Water Purification with or without Nanoparticles. In Application of Nanotechnology in Water Research; Mishra, A.K., Ed.; Wiley & Sons: Haboken, NJ, USA; Scrivener Publishing LLC: Salem, MA, USA, 2014; pp. 63–77. [Google Scholar] [CrossRef]
- Zeghioud, H.; Nguyen-Tri, P.; Khezami, L.; Amrane, A.; Assadi, A.A. Review on discharge plasma for water treatment: Mechanism, reactor geometries, active species and combined processes. J. Water Process Eng. 2020, 38, 101664. [Google Scholar] [CrossRef]
- Stryczewska, H.D. Technologie Plazmowe w Energetyce i Inżynierii Środowiska; Wyd. Politechniki Lubelskiej: Lublin, Poland, 2009. (In Polish) [Google Scholar]
- Locke, B.R.; Sato, M.; Sunka, P.; Hoffmann, M.R.; Chang, J.S. Electrohydraulic discharge and nonthermal plasma for water treatment. Ind. Eng. Chem. Res. 2006, 45, 882–905. [Google Scholar] [CrossRef]
- Lukes, P.; Locke, B.R.; Brisset, J.-L. Aqueous-Phase Chemistry of Electrical Discharge Plasma in Water and in Gas–Liquid Environments. In Plasma Chemistry and Catalysis in Gases and Liquids; Parvulescu, V.I., Magureanu, M., Lukes, P., Eds.; Wiley-VCH Verlag GmbH & Co. KGaA: Weinheim, Germany, 2012; pp. 243–308. [Google Scholar]
- Gubkin, J. Electrolytische metallabscheidung an der freien oberfläche einer salzlösung. Ann. Der Phys. 1887, 268, 114–115. [Google Scholar] [CrossRef] [Green Version]
- Fahmy, A.; Elzaref, A.; Youssef, H.; Shehata, H.; Wassel, M.; Friedrich, J.; Poncin-Epaillard, F.; Debarnot, D. Plasma O2 modifies the structure of synthetic zeolite-A to improve the removal of cadmium ions from aqueous solutions. Turk. J. Chem. 2019, 43, 172–184. [Google Scholar] [CrossRef]
- Moreau, E. Airflow control by non-thermal plasma actuators. J. Phys. D Appl. Phys. 2007, 40, 605–636. [Google Scholar] [CrossRef]
- Tao, X.; Wang, G.; Huang, L.; Ye, Q.; Xu, D. A novel two-level dielectric barrier discharge reactor for methyl orange degradation. J. Environ. Manag. 2016, 184, 480–486. [Google Scholar] [CrossRef]
- Aggelopoulos, C.A. Recent advances of cold plasma technology for water and soil remediation: A critical review. Chem. Eng. J. 2022, 428, 131657. [Google Scholar] [CrossRef]
- Fahmy, A.; El-Zomrawy, A.; Saeed, A.M.; Sayed, A.Z.; El-Arab, M.A.E.; Shehata, H.; Friedrich, J. Degradation of organic dye using plasma discharge: Optimization, pH and energy. Plasma Res. Express 2020, 2, 015009. [Google Scholar] [CrossRef]
- Tichonovas, M.; Krugly, E.; Racys, V.; Hippler, R.; Kauneliene, V.; Stasiulaitiene, I.; Martuzevicius, D. Degradation of various textile dyes as wastewater pollutants under dielectric barrier discharge plasma treatment. Chem. Eng. J. 2013, 229, 9–19. [Google Scholar] [CrossRef]
- Ma, S.; Lee, S.; Kim, K.; Im, J.; Jeon, H. Purification of organic pollutants in cationic thiazine and azo dye solutions using plasma-based advanced oxidation process via submerged multi-hole dielectric barrier discharge. Sep. Purif. Technol. 2021, 255, 117715. [Google Scholar] [CrossRef]
- Magureanu, M.; Mandache, N.B.; Parvulescu, V.I. Degradation of pharmaceutical compounds in water by non-thermal plasma treatment. Water Res. 2015, 81, 124–136. [Google Scholar] [CrossRef] [PubMed]
- Long, Y.; Nie, J.; Yuan, C.; Ma, H.; Chen, Y.; Cong, Y.; Wang, Q.; Zhang, Y. Preparation of CoFe2O4/MWNTs/sponge electrode to enhance dielectric barrier plasma discharge for degradation of phenylic pollutants and Cr(VI) reduction. App. Catal. B Environ. 2021, 283, 119604. [Google Scholar] [CrossRef]
- Iervolino, G.; Vaiano, V.; Palma, V. Enhanced removal of water pollutants by dielectric barrier discharge nonthermal plasma reactor. Sep. Purif. Technol. 2019, 215, 155–162. [Google Scholar] [CrossRef]
- Bae, G.T.; Kim, J.Y.; Kim, D.Y.; Jung, E.Y.; Jang, H.J.; Park, C.-S.; Jang, H.; Lee, D.H.; Lee, H.-K.; Tae, H.-S. Potential Application of Pin-to-Liquid Dielectric Barrier Discharge Structure in Decomposing Aqueous Phosphorus Compounds for Monitoring Water Quality. Materials 2021, 14, 7559. [Google Scholar] [CrossRef]
- Todorova, Y.; Benova, E.; Marinova, P.; Yotinov, I.; Bogdanov, T.; Topalova, Y. Non-Thermal Atmospheric Plasma for Microbial: Decontamination and Removal of Hazardous Chemicals: An Overview in the Circular Economy Context with Data for Test Applications of Microwave Plasma Torch. Processes 2022, 10, 554. [Google Scholar] [CrossRef]
- Jiang, B.; Guo, J.B.; Wang, Z.H.; Zheng, X.; Zheng, J.T.; Wua, W.T.; Wua, M.B.; Xue, Q.Z. A green approach towards simultaneous remediations of chromium(VI) and arsenic(III) in aqueous solution. Chem. Eng. J. 2015, 262, 1144–1151. [Google Scholar] [CrossRef]
- Rahimi, M.; Schoener, Z.; Zhu, X.; Zhang, F.; Gorski, C.A.; Logan, B.E. Removal of copper from water using a thermally regenerative electrodeposition battery. J. Hazard. Mater. 2017, 322, 551–556. [Google Scholar] [CrossRef] [Green Version]
- Clements, J.S.; Sato, M.; Davis, R.H. Preliminary investigation of prebreakdown phenomena and chemical reactions using a pulsed high-voltage discharge in water. IEEE Trans. Ind. Appl. 1987, IA-23, 224–235. [Google Scholar] [CrossRef]
- Regulation of the Minister of the Environment. Rozporządzenie Ministra Środowiska z dnia 18 listopada 2014 r. w sprawie warunków, jakie należy spełnić przy wprowadzaniu ścieków do wód lub do ziemi, oraz w sprawie substancji szczególnie szkodliwych dla środowiska wodnego. Dz.U. 2014, 1800. (In Polish) [Google Scholar]
- Standard. PN-EN 27888:1999; Jakość Wody. Oznaczanie Przewodności Elektrycznej Właściwej. Wydawnictwa Normalizacyjne: Warsaw, Poland, 1999. (In Polish)
- Standard ISO 6059:1984; Water Quality—Determination of the Sum of Calcium and Magnesium—EDTA Titrimetric Method. ISO: Geneva, Switzerland, 1984.
- Standard EN ISO 8467:1995; Water Quality—Determination of Permanganate Index. ISO: Geneva, Switzerland, 1995.
- Standard PN-C-04576-4:1994; Woda i Ścieki—Badania Zawartości Związków Azotu—Oznaczanie Azotu Amonowego w Wodzie Metodą Bezpośredniej Nessleryzacji. Wydawnictwa Normalizacyjne: Warsaw, Poland, 1994.
- Standard PN-C-04576-08:1982; Woda i Ścieki—Badania Zawartości Związków Azotu—Oznaczanie Azotu Azotanowego Metodą Kolorymetryczną z Salicylanem Sodowym. Wydawnictwa Normalizacyjne: Warsaw, Poland, 1982.
- Standard PN-EN 26777:1999; Jakość Wody—Oznaczanie Azotynów—Metoda Absorpcyjnej Spektrometrii Cząsteczkowej. Wydawnictwa Normalizacyjne: Warsaw, Poland, 1999.
- Hermanowicz, W.; Dojlido, J.; Dożańska, W.; Koziorowski, B.; Zerbe, J. Fizyczno-Chemiczne Badanie Wody i Ścieków; Arkady: Warszawa, Poland, 1999. [Google Scholar]
- Standard ISO 9964-1:1993; Water quality—Determination of Sodium and Potassium—Part 1: Determination of Sodium by Atomic Absorption Spectrometry. ISO: Geneva, Switzerland, 1993.
- Standard ISO 6222:1999; Water Quality—Enumeration of Culturable Micro-Organisms—Colony Count by Inoculation in a Nutrient Agar Culture Medium. ISO: Geneva, Switzerland, 1999.
- Standard ISO 7899-2:2000; Water Quality—Detection and Enumeration of Intestinal Enterococci—Part 2: Membrane Filtration Method. ISO: Geneva, Switzerland, 2000.
- Standard EN ISO 9308-2:2014; Water Quality—Enumeration of Escherichia Coli and Coliform Bacteria—Part 2: Most Probable Number Method. ISO: Geneva, Switzerland, 2014.
- Dojlido, J.R. Chemia Wód Powierzchniowych; Wyd. Ekonomia i Środowisko: Białystok, Poland, 1995. (In Polish) [Google Scholar]
- Regulation of the Minister of Health. Rozporządzenie Ministra Zdrowia z dnia 7.12.2017 r. w sprawie jakości wody przeznaczonej do spożycia przez ludzi. Dz.U. 2017, 2294. (In Polish) [Google Scholar]
- Jakubaszek, A.; Lechów, H.; Mazurek, M. Wpływ warunków przechowywania wody źródlanej w opakowaniach jednostkowych na jej jakość. Zesz. Nauk. Uniw. Zielonogórskiego 2016, 161, 96–106. [Google Scholar]
- Van Nguyen, D.; Ho, P.Q.; Van Pham, T.; Van Nguyen, T.; Kim, L. A study on treatment of surface water using cold plasma for domestic water supply. Environ. Eng. Res. 2019, 24, 412–417. [Google Scholar] [CrossRef]
- Lukes, P. Water Treatment by Pulsed Streamer Corona Discharge. Ph.D. Thesis, Institute of Chemical Technology, Prague, Czechia, 2001. [Google Scholar]
- Tseng, S.; Abramzon, N.; Jackson, J.O.; Lin, W.J. Gas discharge plasmas are effective in inactivating Bacillus and Clostridium spores. Appl. Microbiol. Biotechnol. 2012, 93, 2563–2570. [Google Scholar] [CrossRef]
- Karimi, H. Effect of pH and Initial Pb(II) Concentration on The Lead Removal Efficiency from Industrial Wastewater Using Ca(OH)2. Int. J. Water Wastewater Treat. 2017, 3, 2. [Google Scholar] [CrossRef]
- Monhemius, J. Precipitation diagrams for metal hydroxides, sulphides, arsenates and phosphates. Trans. Inst. Min. Metall. 1977, 86, C202–C206. [Google Scholar]
- Berber-Mendoza, M.S.; Leyva-Ramos, R.; Alonso-Davila, P.; Mendoza-Barron, J.; Diaz-Flores, P.E. Effect of pH and temperature on the ion-exchange isotherm of Cd(II) and Pb(II) on clinoptilolite. J. Chem. Technol. Biotechnol. 2006, 81, 966–973. [Google Scholar] [CrossRef]
- Kowal, A.L.; Świderska-Bróż, M. Oczyszczanie Wody; Wydawnictwo Naukowe PWN: Warszawa, Poland, 1996. (In Polish) [Google Scholar]
- pH Range for Precipitation of Metal Hydroxides and Oxides. Available online: https://hbcp.chemnetbase.com/faces/documents/08_69/08_69_0001.xhtml (accessed on 2 August 2022).
- Coates, J. Interpretation of Infrared Spectra, A Practical Approach. In Encyclopedia of Analytical Chemistry; Meyers, R.A., McKelvy, M.L., Eds.; John Wiley & Sons: Chichester, UK, 2006. [Google Scholar] [CrossRef]
- Prakash, T.; Arunkumar, T.; Raja, S.D.; Jayaprakash, R. Surfactant-liaised variation in CdO nanocomposites morphology. Phys. Procedia 2013, 49, 36–43. [Google Scholar] [CrossRef] [Green Version]
- Saghatforoush, L.A.; Sanati, S.; Mehdizadeh, R.; Hasanzadeh, M. Solvothermal synthesis of Cd(OH)2 and CdO nanocrystals and application as a new electrochemical sensor for simultaneous determination of norfloxacin and lomefloxacin. Superlattices Microstruct. 2012, 52, 885–893. [Google Scholar] [CrossRef]
- Song, Q.; Tang, Z.; Guo, H.; Chan, S.L.I. Structural characteristics of nickel hydroxide synthesized by a chemical precipitation route under different pH values. J. Power Sources 2002, 112, 428–434. [Google Scholar] [CrossRef]
- Dubal, D.P.; Jagadale, A.D.; Patil, S.V.; Lokhande, C.D. Simple route for the synthesis of supercapacitive Co–Ni mixed hydroxide thin films. Mater. Res. Bull. 2012, 47, 1239–1245. [Google Scholar] [CrossRef]
- Asran, A.S.; Henning, S.; Michler, G.H. Polyvinyl alcohol–collagen–hydroxyapatite biocomposite nanofibrous scaffold: Mimicking the key features of natural bone at the nanoscale level. Polymer 2010, 51, 868–876. [Google Scholar] [CrossRef]
- Lutz, H.D.; Weckler, B. Near-infrared spectra of M(OH)C1 (M = Ca, Cd, Sr), Zn(OH)F, γ-Cd(OH)2, Sr(OH)2, and brucite-type hydroxides M(OH)2 (M = Mg, Ca, Mn, Fe, Co, Ni, Cd). Spectrochim. Acta Part A Mol. Biomol. Spectrosc. 1996, 52, 1507–1513. [Google Scholar] [CrossRef]
- Zhang, J.; Chen, J.; Li, X. Remove of Phenolic Compounds in Water by Low-Temperature Plasma: A Review of Current Research. J. Water Resour. Prot. 2009, 1, 99–109. [Google Scholar] [CrossRef] [Green Version]
- Wang, W.; Hua, Y.; Li, S.; Yan, W.; Zhang, W.X. Removal of Pb(II) and Zn(II) using lime and nanoscale zero-valent iron (nZVI): A comparative study. Chem. Eng. J. 2016, 304, 79–88. [Google Scholar] [CrossRef]
- Kavak, D. Removal of lead from aqueous solutions by precipitation: Statistical analysis and modeling. Desalination Water Treat. 2013, 51, 1720–1726. [Google Scholar] [CrossRef]
- Junuzović, H.; Selimović, A.; Begić, S.; Salkić, M.; Osmić, S. Removal of lead and zinc ions from their monocomponent and two-component aqueous solutions using sodium hydroxide. Technol. Acta 2019, 12, 1–6. [Google Scholar] [CrossRef]
- Byambaa, M.; Dolgor, E.; Shiomori, K.; Suzuki, Y. Removal and Recovery of Heavy Metals from Industrial Wastewater by Precipitation and Foam Separation Using Lime and Casein. J. Environ. Sci. Technol. 2018, 11, 1–9. [Google Scholar] [CrossRef] [Green Version]
- Habte, L.; Shiferaw, N.; Thriveni, T.; Mulatu, D.; Lee, M.H.; Jung, S.H.; Ahn, J.W. Removal of Cd(II) and Pb(II) from wastewater via carbonation of aqueous Ca(OH)2 derived from eggshell. Process. Saf. Environ. Prot. 2020, 141, 278–287. [Google Scholar] [CrossRef]
- Chen, Q.; Luo, Z.; Hills, C.; Xue, G.; Tyrer, M. Precipitation of heavy metals from wastewater using simulated flue gas: Sequent additions of fly ash, lime and carbon dioxide. Water Res. 2009, 43, 2605–2614. [Google Scholar] [CrossRef]
- Alvarez, M.T.; Crespo, C.; Mattiasson, B. Precipitation of Zn(II), Cu(II) and Pb(II) at bench-scale using biogenic hydrogen sulfide from the utilization of volatile fatty acids. Chemosphere 2007, 66, 1677–1683. [Google Scholar] [CrossRef] [PubMed]
- Islamoglu, S.; Yilmaz, L.; Ozbelge, H.O. Development of a Precipitation Based Separation Scheme for Selective Removal and Recovery of Heavy Metals from Cadmium Rich Electroplating Industry Effluents. Sep. Sci. Technol. 2006, 41, 3367–3385. [Google Scholar] [CrossRef]
- Surianti; Utami, A.N.; Permatasari, M.A.; Bendiyasa, I.M.; Astuti, W.; Petrus, H.T.B.M. Valuable Metals Precipitation of Low Grade Nickel Ore Leachate Using Sodium Hydroxide. In IOP Conference Series: Materials Science and Engineering, Proceedings of the International Conference on Chemical Engineering UNPAR 2019, Bandung, Indonesia, 28–29 November 2019; IOP Publishing: Bristol, UK, 2019; Volume 742, p. 012043. [Google Scholar] [CrossRef]


| Variable | Unit | Normalized Variable | −α | −1 | 0 | 1 | α |
|---|---|---|---|---|---|---|---|
| Flow rate | dm3/min | 0.5 | 0.9 | 1.5 | 2.1 | 2.5 | |
| Modulation frequency | Hz | 100 | 161 | 250 | 339 | 400 | |
| Duty cycle | % | 10 | 26 | 50 | 74 | 90 |
| Indicator | Unit | Determined Values | Reference Value * |
|---|---|---|---|
| pH | - | 7.7 ± 0.1 ÷ 7.8 ± 0.1 | 6.5–9.5 |
| Turbidity | NTU | 0.13 ± 0.03 ÷ 0.48 ± 0.11 | <1.0 |
| Electrolytic conductivity | µS/cm | 587 ± 66 ÷ 603 ± 66 | 2500 |
| Total hardness | mg/dm3 CaCO3 | 282 ± 34 ÷ 285 ± 34 | 60–500 |
| Permanganate index (oxidizability) | mg/dm3 O2 | 0.81 ± 0.25 ÷ 1.47 ± 0.41 | 5 |
| Total organic carbon (TOC) | mg/dm3 | 1.68 ± 0.2 ÷ 1.98 ± 0.2 | No unacceptable changes ** |
| Ammonium ions | mg/dm3 | <0.1 | 0.5 |
| Nitrites | mg/dm3 | <0.01 ± 0.002 | 0.5 |
| Nitrates | mg/dm3 | 30.9 ± 3.5 ÷ 34.4 ± 3.9 | 50 |
| Chlorides | mg/dm3 | 68 ± 11 ÷ 74 ± 11 | 250 |
| Sodium | mg/dm3 | 7 ± 1 ÷ 5 ± 1 | 200 |
| Calcium | mg/dm3 | 4.92 | – |
| Magnesium | mg/dm3 | 0.83 | 125 *** |
| Total iron | µg/dm3 | <40 | 200 |
| Manganese | µg/dm3 | <15 | 50 |
| Cadmium | µg/dm3 | <0.6 | 5 |
| Lead | µg/dm3 | <2.2 | 10 |
| Copper | µg/dm3 | <0.26 | 2 |
| Nickel | µg/dm3 | <5.9 | 20 |
| Total chromium | µg/dm3 | <15 | 50 |
| Indicator | Unit/Sample Volume in mL | Value [Uncertainty] | Reference Value *** |
|---|---|---|---|
| Coliform bacteria | MPN */100 | 0 [0 ÷ 4] | 0 |
| Escherichia coli | MPN */100 | 0 [0 ÷ 4] | 0 |
| Enterococcus | CFU **/100 | 0 | 0 |
| Total number of microorganisms in 22 ± 2 °C after 72 h | CFU/1 | >300 | 100 CFU/1 mL in the water entering the water supply network 200 CFU/1 mL at the consumer’s tap |
| No. | Final | Final Concentration | |||||||
|---|---|---|---|---|---|---|---|---|---|
| Pb(II) | Cd(II) | Ni(II) | Pb(II) | Cd(II) | Ni(II) | ||||
| 0 | - | - | - | 7.47 | 7.46 | 7.50 | 2.30 | 4.80 | 10.0 |
| 1 | −1 | −1 | −1 | 7.57 | 7.57 | 7.82 | 1.24 | 2.35 | 9.91 |
| 2 | 1 | −1 | −1 | 7.50 | 7.55 | 7.83 | 1.12 | 1.63 | 9.95 |
| 3 | −1 | 1 | −1 | 7.95 | 7.51 | 7.90 | 0.76 | 3.64 | 9.33 |
| 4 | 1 | 1 | −1 | 7.87 | 7.55 | 7.98 | 0.92 | 2.13 | 9.65 |
| 5 | −1 | −1 | 1 | 7.59 | 7.59 | 7.75 | 1.51 | 1.07 | 9.10 |
| 6 | 1 | −1 | 1 | 7.58 | 7.59 | 7.86 | 1.20 | 1.52 | 8.98 |
| 7 | −1 | 1 | 1 | 7.70 | 7.67 | 7.78 | 1.10 | 2.56 | 9.44 |
| 8 | 1 | 1 | 1 | 7.72 | 7.47 | 7.91 | 0.99 | 3.34 | 9.31 |
| 9 | −α | 0 | 0 | 7.64 | 7.61 | 7.82 | 1.56 | 0.90 | 9.46 |
| 10 | α | 0 | 0 | 7.56 | 7.61 | 7.71 | 1.11 | 0.85 | 9.77 |
| 11 | 0 | −α | 0 | 7.74 | 7.63 | 7.99 | 0.72 | 1.34 | 9.66 |
| 12 | 0 | α | 0 | 7.74 | 7.63 | 8.00 | 0.89 | 1.72 | 9.51 |
| 13 | 0 | 0 | −α | 7.69 | 7.54 | 7.83 | 0.95 | 2.72 | 9.76 |
| 14 | 0 | 0 | α | 7.71 | 7.61 | 7.92 | 0.54 | 2.45 | 9.57 |
| 15 | 0 | 0 | 0 | 7.6 | 7.48 | 7.74 | 0.95 | 3.34 | 9.49 |
| 16 | 0 | 0 | 0 | 7.56 | 7.52 | 7.74 | 0.96 | 3.68 | 9.64 |
| 17 | 0 | 0 | 0 | 7.62 | 7.49 | 7.70 | 1.01 | 3.75 | 9.39 |
| 18 | 0 | 0 | 0 | 7.60 | 7.48 | 7.72 | 1.11 | 3.89 | 9.70 |
| 19 | 0 | 0 | 0 | 7.60 | 7.49 | 7.71 | 1.13 | 3.44 | 9.57 |
| 20 | 0 | 0 | 0 | 7.59 | 7.51 | 7.75 | 0.97 | 3.48 | 9.44 |
| Term | pH Change, | Removal [%] | ||||
|---|---|---|---|---|---|---|
| Pb(II) | Cd(II) | Ni(II) | Pb(II) | Cd(II) | Ni(II) | |
| 0.1264 | 0.0366 | 0.2330 | 90.21 | 64.27 | 4.67 | |
| −0.0201 | −0.0132 | - | 0.83 | - | −0.46 | |
| 0.0732 | - | 0.0239 | 0.74 | −4.20 | - | |
| −0.0195 | 0.0189 | - | - | - | 1.71 | |
| - | 0.0303 | - | −1.46 | 8.07 | - | |
| 0.0511 | 0.0374 | 0.0871 | - | 5.76 | - | |
| 0.0369 | 0.0179 | 0.0447 | 0.61 | 2.03 | - | |
| - | −0.0175 | - | - | - | - | |
| - | −0.0275 | - | - | −4.33 | 0.76 | |
| −0.0625 | - | - | - | −1.90 | −1.94 | |
| adjusted R2 | 0.5994 | 0.5267 | 0.6952 | 0.3967 | 0.7596 | 0.6039 |
| Variable | Pb(II) | Cd(II) | Ni(II) | |||
|---|---|---|---|---|---|---|
| Removal | Removal | Removal | ||||
| flow rate | −0.15 | 0.30 | −0.19 | 0.06 | 0.09 | −0.15 |
| modulation frequency | 0.56 | 0.26 | −0.10 | −0.34 | 0.21 | 0.12 |
| duty cycle | −0.15 | −0.02 | 0.27 | 0.10 | −0.05 | 0.59 |
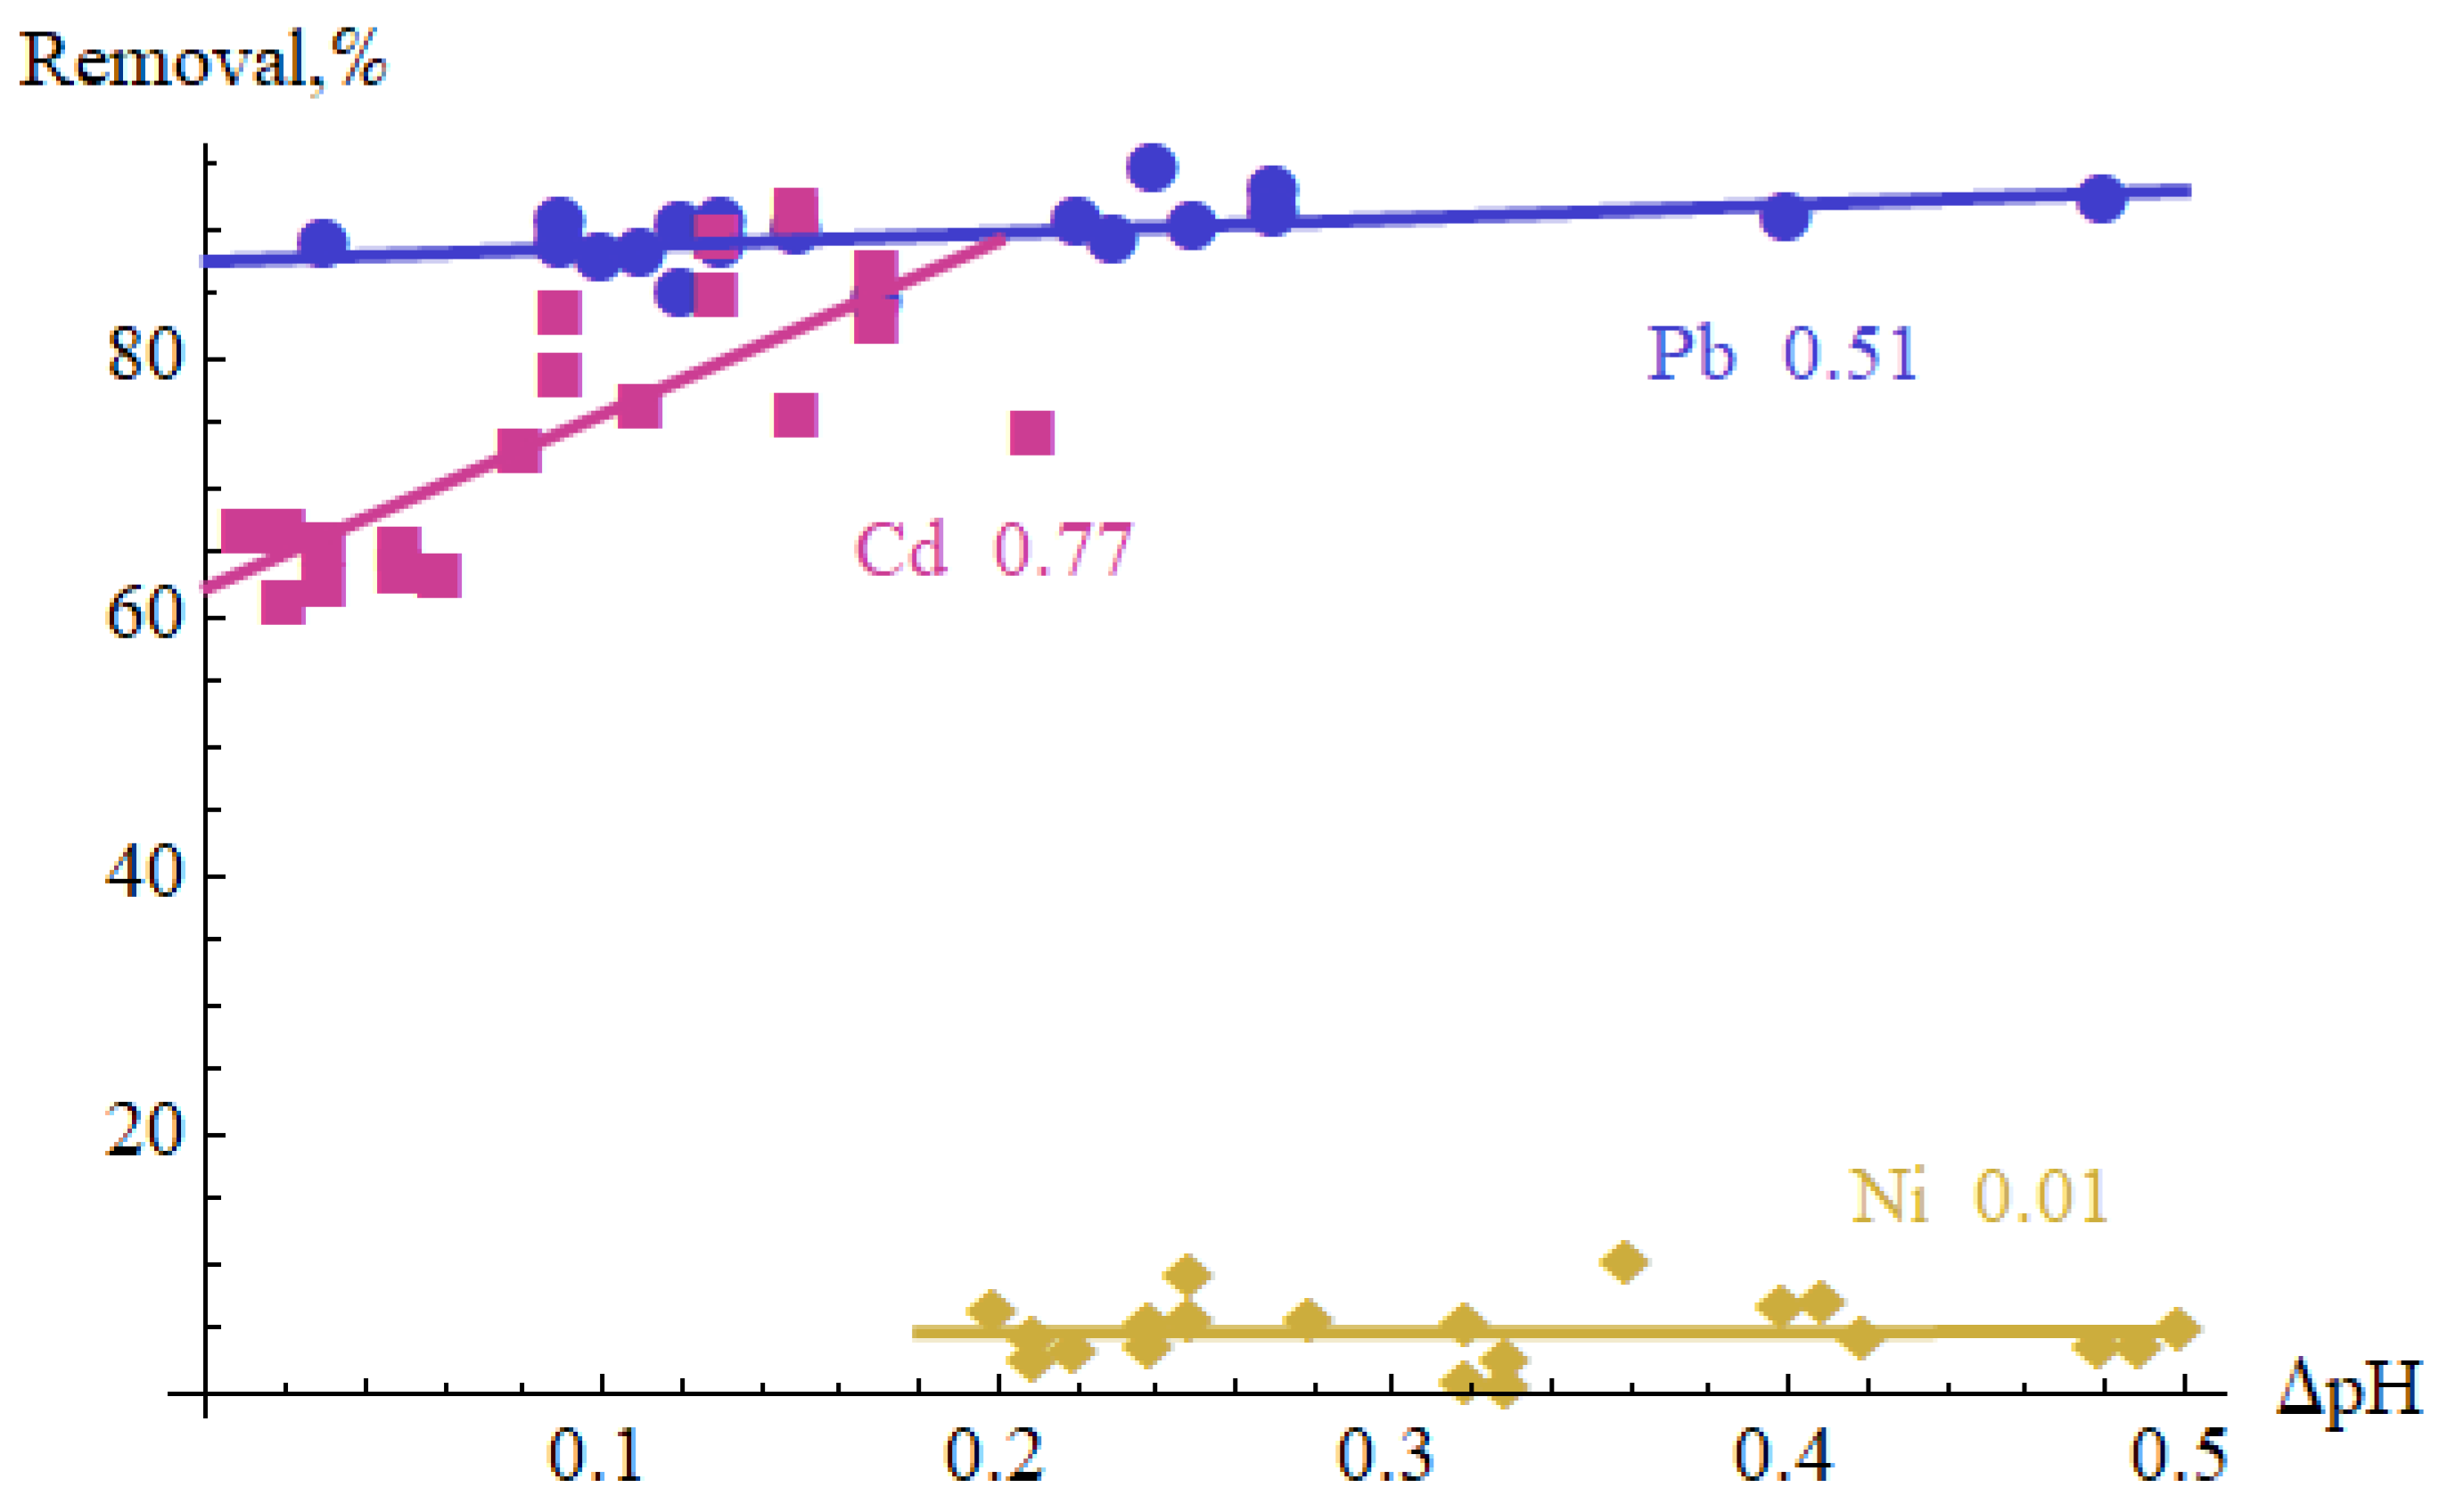
| 1.00 | 0.51 | 1.00 | 0.77 | 1.00 | 0.01 | |
| Indicator | Unit | Value | |||
|---|---|---|---|---|---|
| Untreated Water | After 1 Pass | After 3 Passes | After 6 Passes | ||
| pH | - | 7.7 ± 0.1 | 7.72 ± 0.1 | 7.99 ± 0.1 | 8.19 ± 0.1 |
| Turbidity | NTU | 0.13 ± 0.3 | 0.48 ± 0.11 | 0.30 ± 0.07 | 0.23 ± 0.05 |
| Electrolytic conductivity | µS/cm | 605 ± 66 | 620 ± 68 | 618 ± 68 | 616 ± 68 |
| Total hardness | mg/dm3 CaCO3 | >600 ± 34 | >600 | >600 | 531 ± 61 |
| Permanganate index | mg/dm3 O2 | 0.87 ± 0.25 | 0.91 ± 0.26 | 1.43 ± 0.41 | 0.81 ± 0.23 |
| TOC | mg/dm3 | 1.81 ± 0.2 | 5.78 | 6.31 | 8.16 |
| Ammonium ions | mg/dm3 | <0.1 | <0.1 | <0.1 | <0.1 |
| Nitrites | mg/dm3 | <0.01 | <0.01 | <0.01 | <0.01 |
| Nitrates | mg/dm3 | 33.6 ± 3.8 | 33.5 ± 3.8 | 30.9 ± 3.5 | 34.9 ± 3.9 |
| Chlorides | mg/dm3 | 74 ± 11 | 72 ± 11 | 72 ± 11 | 72 ± 11 |
| Sodium | mg/dm3 | 6.5 | 5.41 | 5.29 | 5.26 |
| Calcium | mg/dm3 | 4.92 | 3.62 | 2.94 | 2.74 |
| Magnesium | mg/dm3 | 0.83 | 0.77 | 0.64 | 0.57 |
| Total iron | mg/dm3 | 0.19 | 0.097 | 0.067 | 0.05 |
| Manganese | mg/dm3 | 0.015 | 0.011 | 0.009 | 0.009 |
| Total number of microorganisms in 22 ± 2 °C after 72 h | CFU */1 | >300 | 40 [20–80] | 16 [8–34] | 5 [2–12] |
| Number of Passes | pH | Concentration, mg/dm3 | Temperature, °C | ||||||
|---|---|---|---|---|---|---|---|---|---|
| Pb(II) | Cd(II) | Ni(II) | Pb(II) | Cd(II) | Ni(II) | Pb(II) | Cd(II) | Ni(II) | |
| 0 | 7.47 | 7.46 | 7.50 | 2.3 | 4.8 | 9.5 | 21.5 | 21.0 | 21.4 |
| 1 | 7.73 | 7.68 | 7.72 | 0.71 | 2.9 | 9.2 | 24.0 | 23.5 | 23.4 |
| 3 | 7.94 | 7.91 | 7.99 | 0.79 | 1.18 | 8.8 | 27.2 | 26.3 | 27.5 |
| 6 | 8.15 | 8.10 | 8.19 | 0.64 | 0.57 | 7.7 | 30.0 | 29.1 | 29.6 |
| Me-0 | Cd-6 | Cd-6s | Cd-cs | Ni-6 | Ni-6s | Ni-cs | Pb-6 | Pb-6s | Assignment |
|---|---|---|---|---|---|---|---|---|---|
| 430 | Cd-O [71] | ||||||||
| 455 | 457 | 457 | 442 | ν(Ni-O) [73], Cd-O [72] | |||||
| 475 | Cd-O [72] | ||||||||
| 510 | 513 | Cd-O [72], Ni-OH [74] | |||||||
| 596 | 595 | 571 | 594 | out-of-plane OH bending [70] | |||||
| 623 | 620 | 620 | 623 | 620 | 620 | δ(OH) [70] | |||
| 664 | 662 | 658 | 660 | 659 | 661 | out-of-plane OH bending [70] | |||
| 685 | 678 | out-of-plane OH bending [70] | |||||||
| 822 | 823 | 822 | 820 | 820 | COO [70] | ||||
| 835 | 836 | 836 | 835 | 837 | 839 | CH2 rocking [75], COO [70] | |||
| 854 | 857 | 856 | 853 | COO [70] | |||||
| 872 | 875 | 874 | 873 | COO [70] | |||||
| 880 | 879 | COO [70] | |||||||
| 1010 | 1002 | 1006 | 1008 | C-O [70] | |||||
| 1045 | 1048 | 1045 | 1044 | 1037 | 1051 | C-O [70] | |||
| 1133 | 1118 | 1103 | 1111 | 1123 | 1103 | C-O [70,71] | |||
| 1153 | 1150 | C-O stretching [70,75] | |||||||
| 1236 | 1236 | 1285 | OH in-plane bending [70] | ||||||
| 1333 | 1327 | 1354 | 1324 | 1327 | 1340 | 1352 | 1361 | CO32− [73], CH2 wagging [75] | |
| 1397 | 1420 | 1426 | 1404 | 1401 | 1418 | 1456 | 1397, 1443 | O-H, C-H bending, γ(CH2), δ(OH) [70,75] | |
| 1639 | 1642 | 1633 | 1641 | 1640 | 1640 | 1636 | H2O bending [75] | ||
| 1733 | C=O stretching [71] | ||||||||
| ~2900 | ~2900 | ~2900 | ~2900 | CH2 stretching [75] | |||||
| ~3300 | ~3300 | ~3300 | ~3300 | ~3300 | ~3300 | ~3300 | ~3300 | OH stretching H2O [70,75] | |
| 3600 | Cd(OH)2 [70] | ||||||||
| 3639 | Ni(OH)2 [70,76] |
| Initial Concentration, mg/dm3 | Final Concentration, g/dm3 | Initial pH | Final pH | ||||||
|---|---|---|---|---|---|---|---|---|---|
| Pb(II) | Cd(II) | Ni(II) | Pb(II) | Cd(II) | Ni(II) | Pb(II) | Cd(II) | Ni(II) | |
| 10 | 0.71 | 2.90 | 9.20 | 7.47 | 7.46 | 7.50 | 7.73 | 7.68 | 7.72 |
| 20 | 1.26 | 2.61 | 18.3 | 7.29 | 7.49 | 7.51 | 7.65 | 7.79 | 7.81 |
| 30 | 0.61 | 3.13 | 26.2 | 7.19 | 7.52 | 7.52 | 7.65 | 7.82 | 7.83 |
| 40 | 0.89 | 8.92 | 36.5 | 7.14 | 7.49 | 7.53 | 7.61 | 7.73 | 7.73 |
| 50 | 0.47 | 7.91 | 50.5 | 6.95 | 7.47 | 7.51 | 7.50 | 7.65 | 7.79 |
| 80 | 0.52 | 17.6 | 70.7 | 6.87 | 7.50 | 7.49 | 7.40 | 7.64 | 7.78 |
| 100 | 2.86 | 19.9 | 84.5 | 6.93 | 7.45 | 7.47 | 7.32 | 7.56 | 7.67 |
| Metal | Precipitant | Metal Concentration | Conditions | Efficiency | Reference |
|---|---|---|---|---|---|
| Pb(II) | Ca(OH)2 | >2 mg/dm3 | pH 11–13, >2 h, 2–3 g/dm3 | 90% | [78] |
| Ca(OH)2 | 100 mg/dm3 | pH 12 | 99.4% | [79] | |
| Ca(OH)2 | 100–600 mg/dm3 | pH 11 | 75.5–95.0% | [65] | |
| NaOH | 500 mg/dm3 | dosed up to pH 10/11.4 | 90/99.9% | [80] | |
| Ca(OH)2 | 10 mg/dm3 | pH 9, +casein (15 mg/dm3) | 96% | [81] | |
| Ca(OH)2 | 100 mg/dm3 | pH 12.5, 25 °C, 3 g/L, +CO2 (1 dm3/min) | 100% | [82] | |
| CaO | 100 mg/dm3 | pH 7–11 | >99% | [83] | |
| H2S | 0.018–2.3 mM | pH 3.0 | 100–92% | [84] | |
| Cold plasma | 10 mg/dm3 | 1 pass, flow rate 0.5 1 dm3/min | 72% | This study | |
| Cd(II) | Ca(OH)2 | 100 mg/dm3 | pH 12.5, 25 °C, 3 g/L, +CO2 (1 dm3/min) | 100% | [82] |
| Ca(OH)2 | 10 mg/dm3 | pH 9, +casein (15 mg/dm3) | 96% | [81] | |
| NaOH | ~24 g/dm3 | dosed up to pH 12 | ~70% | [85] | |
| Na2S | 7.5 g/dm3 | pH 12, 25 g/dm3 | 99.9% | [85] | |
| Cold plasma | 10 mg/dm3 | 6 passes, flow rate 0.5 dm3/min | 88% | This study | |
| Ni(II) | NaOH | 160 mg/dm3 | dosed up to pH 12, 85 °C | 84% | [86] |
| NaOH | ~40 mg/dm3 | dosed up to pH 12 | ~62% | [85] | |
| Na2S | 6 mg/dm3 | pH 12, 25 g/dm3 | 17% | [85] | |
| Cold plasma | 10 mg/dm3 | 6 passes, flow rate 0.5 dm3/min | 19% | This study |
Publisher’s Note: MDPI stays neutral with regard to jurisdictional claims in published maps and institutional affiliations. |
© 2022 by the authors. Licensee MDPI, Basel, Switzerland. This article is an open access article distributed under the terms and conditions of the Creative Commons Attribution (CC BY) license (https://creativecommons.org/licenses/by/4.0/).
Share and Cite
Jabłońska, B.; Dróżdż, T.; Jabłoński, P.; Kiełbasa, P. Removal of Pb(II), Cd(II) and Ni(II) Ions from Groundwater by Nonthermal Plasma. Materials 2022, 15, 5426. https://doi.org/10.3390/ma15155426
Jabłońska B, Dróżdż T, Jabłoński P, Kiełbasa P. Removal of Pb(II), Cd(II) and Ni(II) Ions from Groundwater by Nonthermal Plasma. Materials. 2022; 15(15):5426. https://doi.org/10.3390/ma15155426
Chicago/Turabian StyleJabłońska, Beata, Tomasz Dróżdż, Paweł Jabłoński, and Paweł Kiełbasa. 2022. "Removal of Pb(II), Cd(II) and Ni(II) Ions from Groundwater by Nonthermal Plasma" Materials 15, no. 15: 5426. https://doi.org/10.3390/ma15155426
APA StyleJabłońska, B., Dróżdż, T., Jabłoński, P., & Kiełbasa, P. (2022). Removal of Pb(II), Cd(II) and Ni(II) Ions from Groundwater by Nonthermal Plasma. Materials, 15(15), 5426. https://doi.org/10.3390/ma15155426