
Modeling of Internal Geometric Variability and Statistical Property Prediction of Braided Composites


Abstract
:1. Introduction
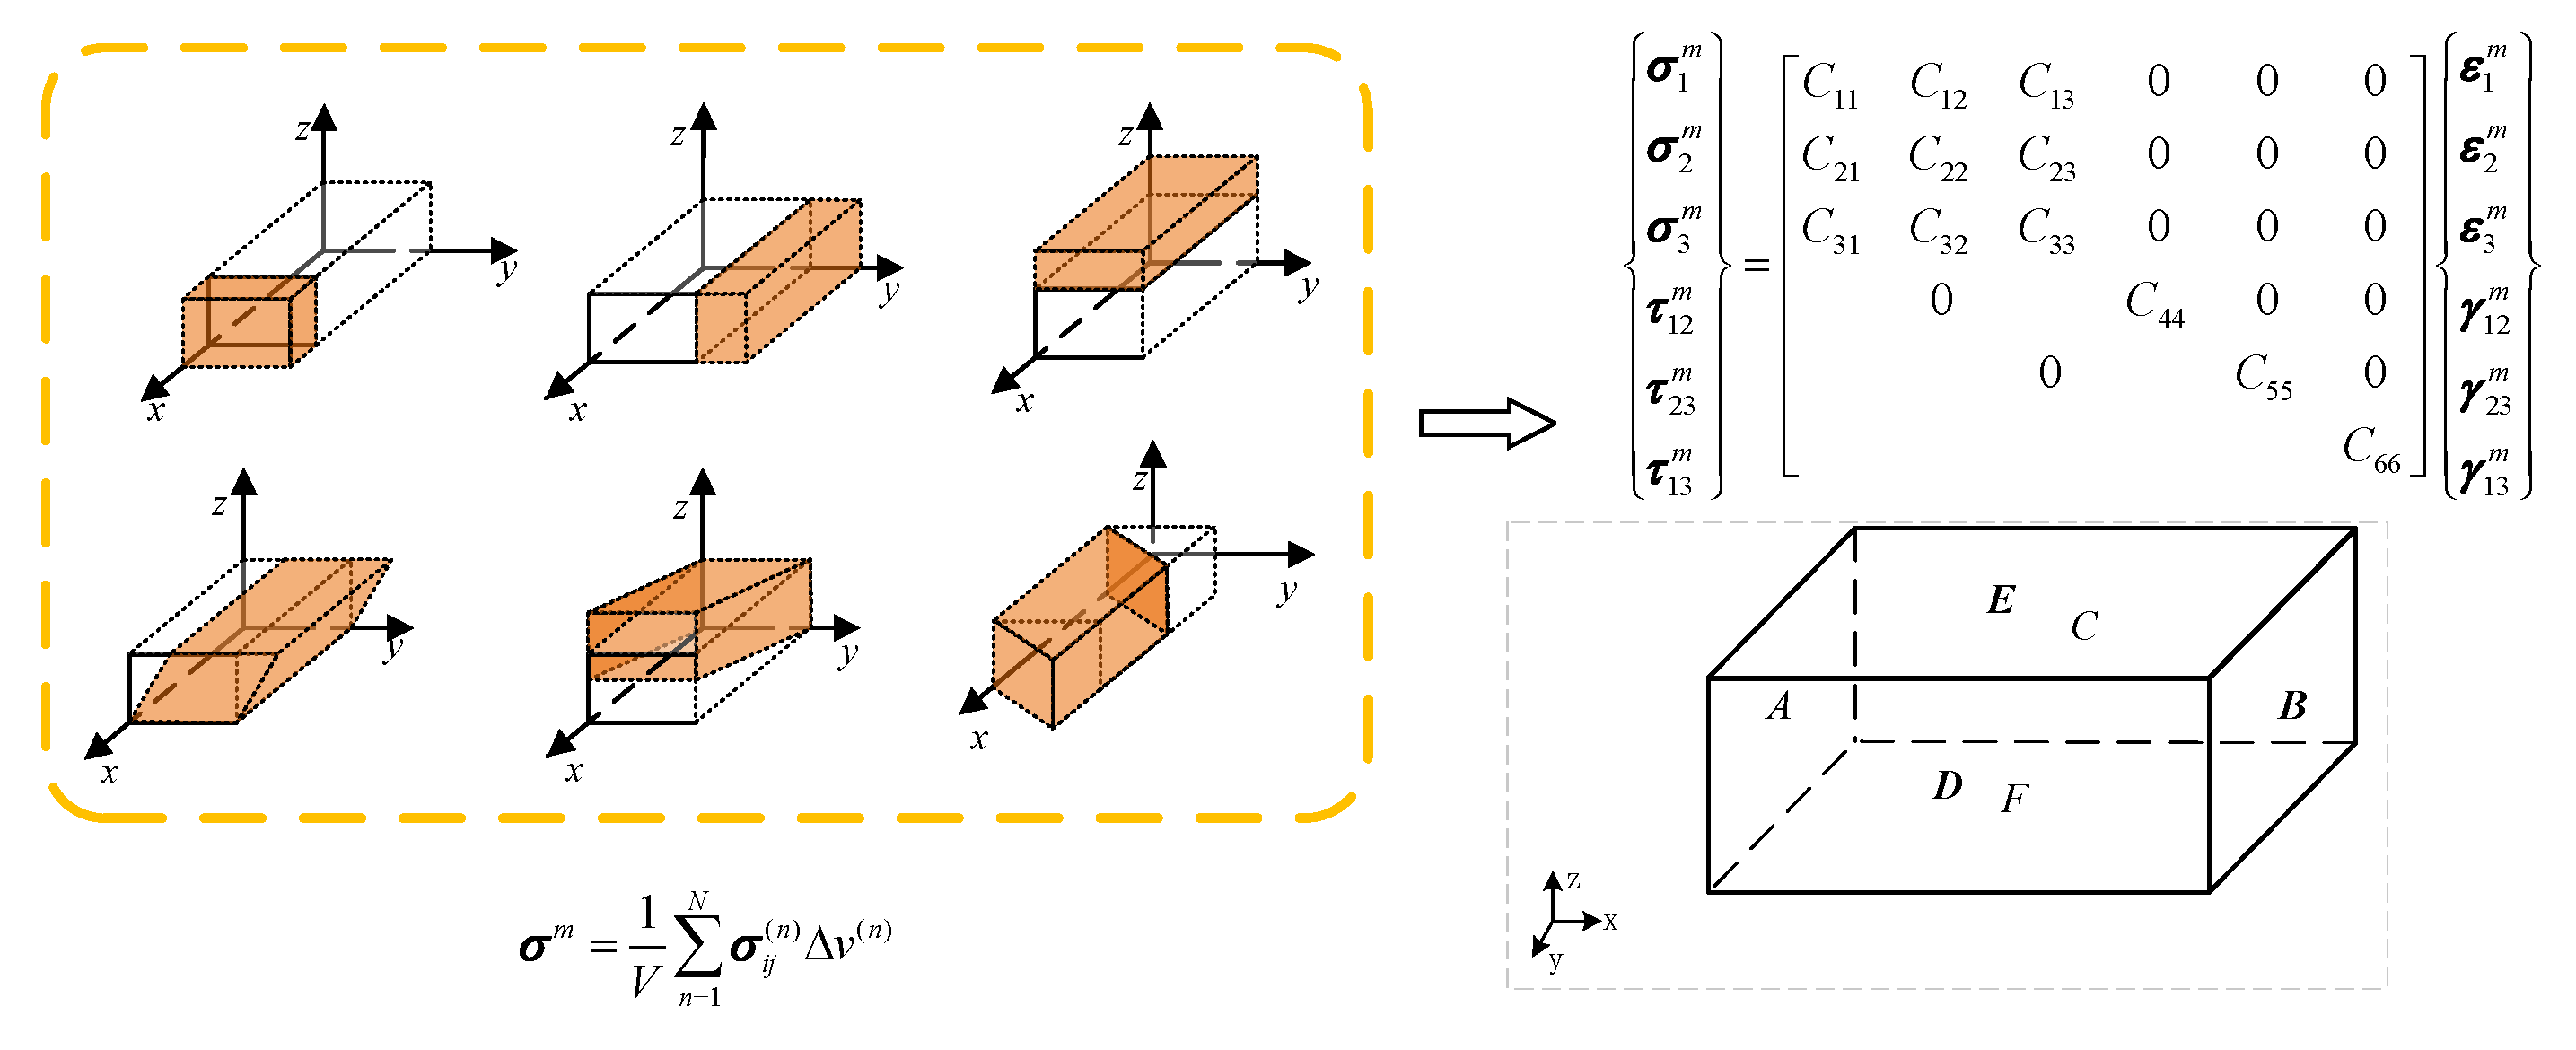
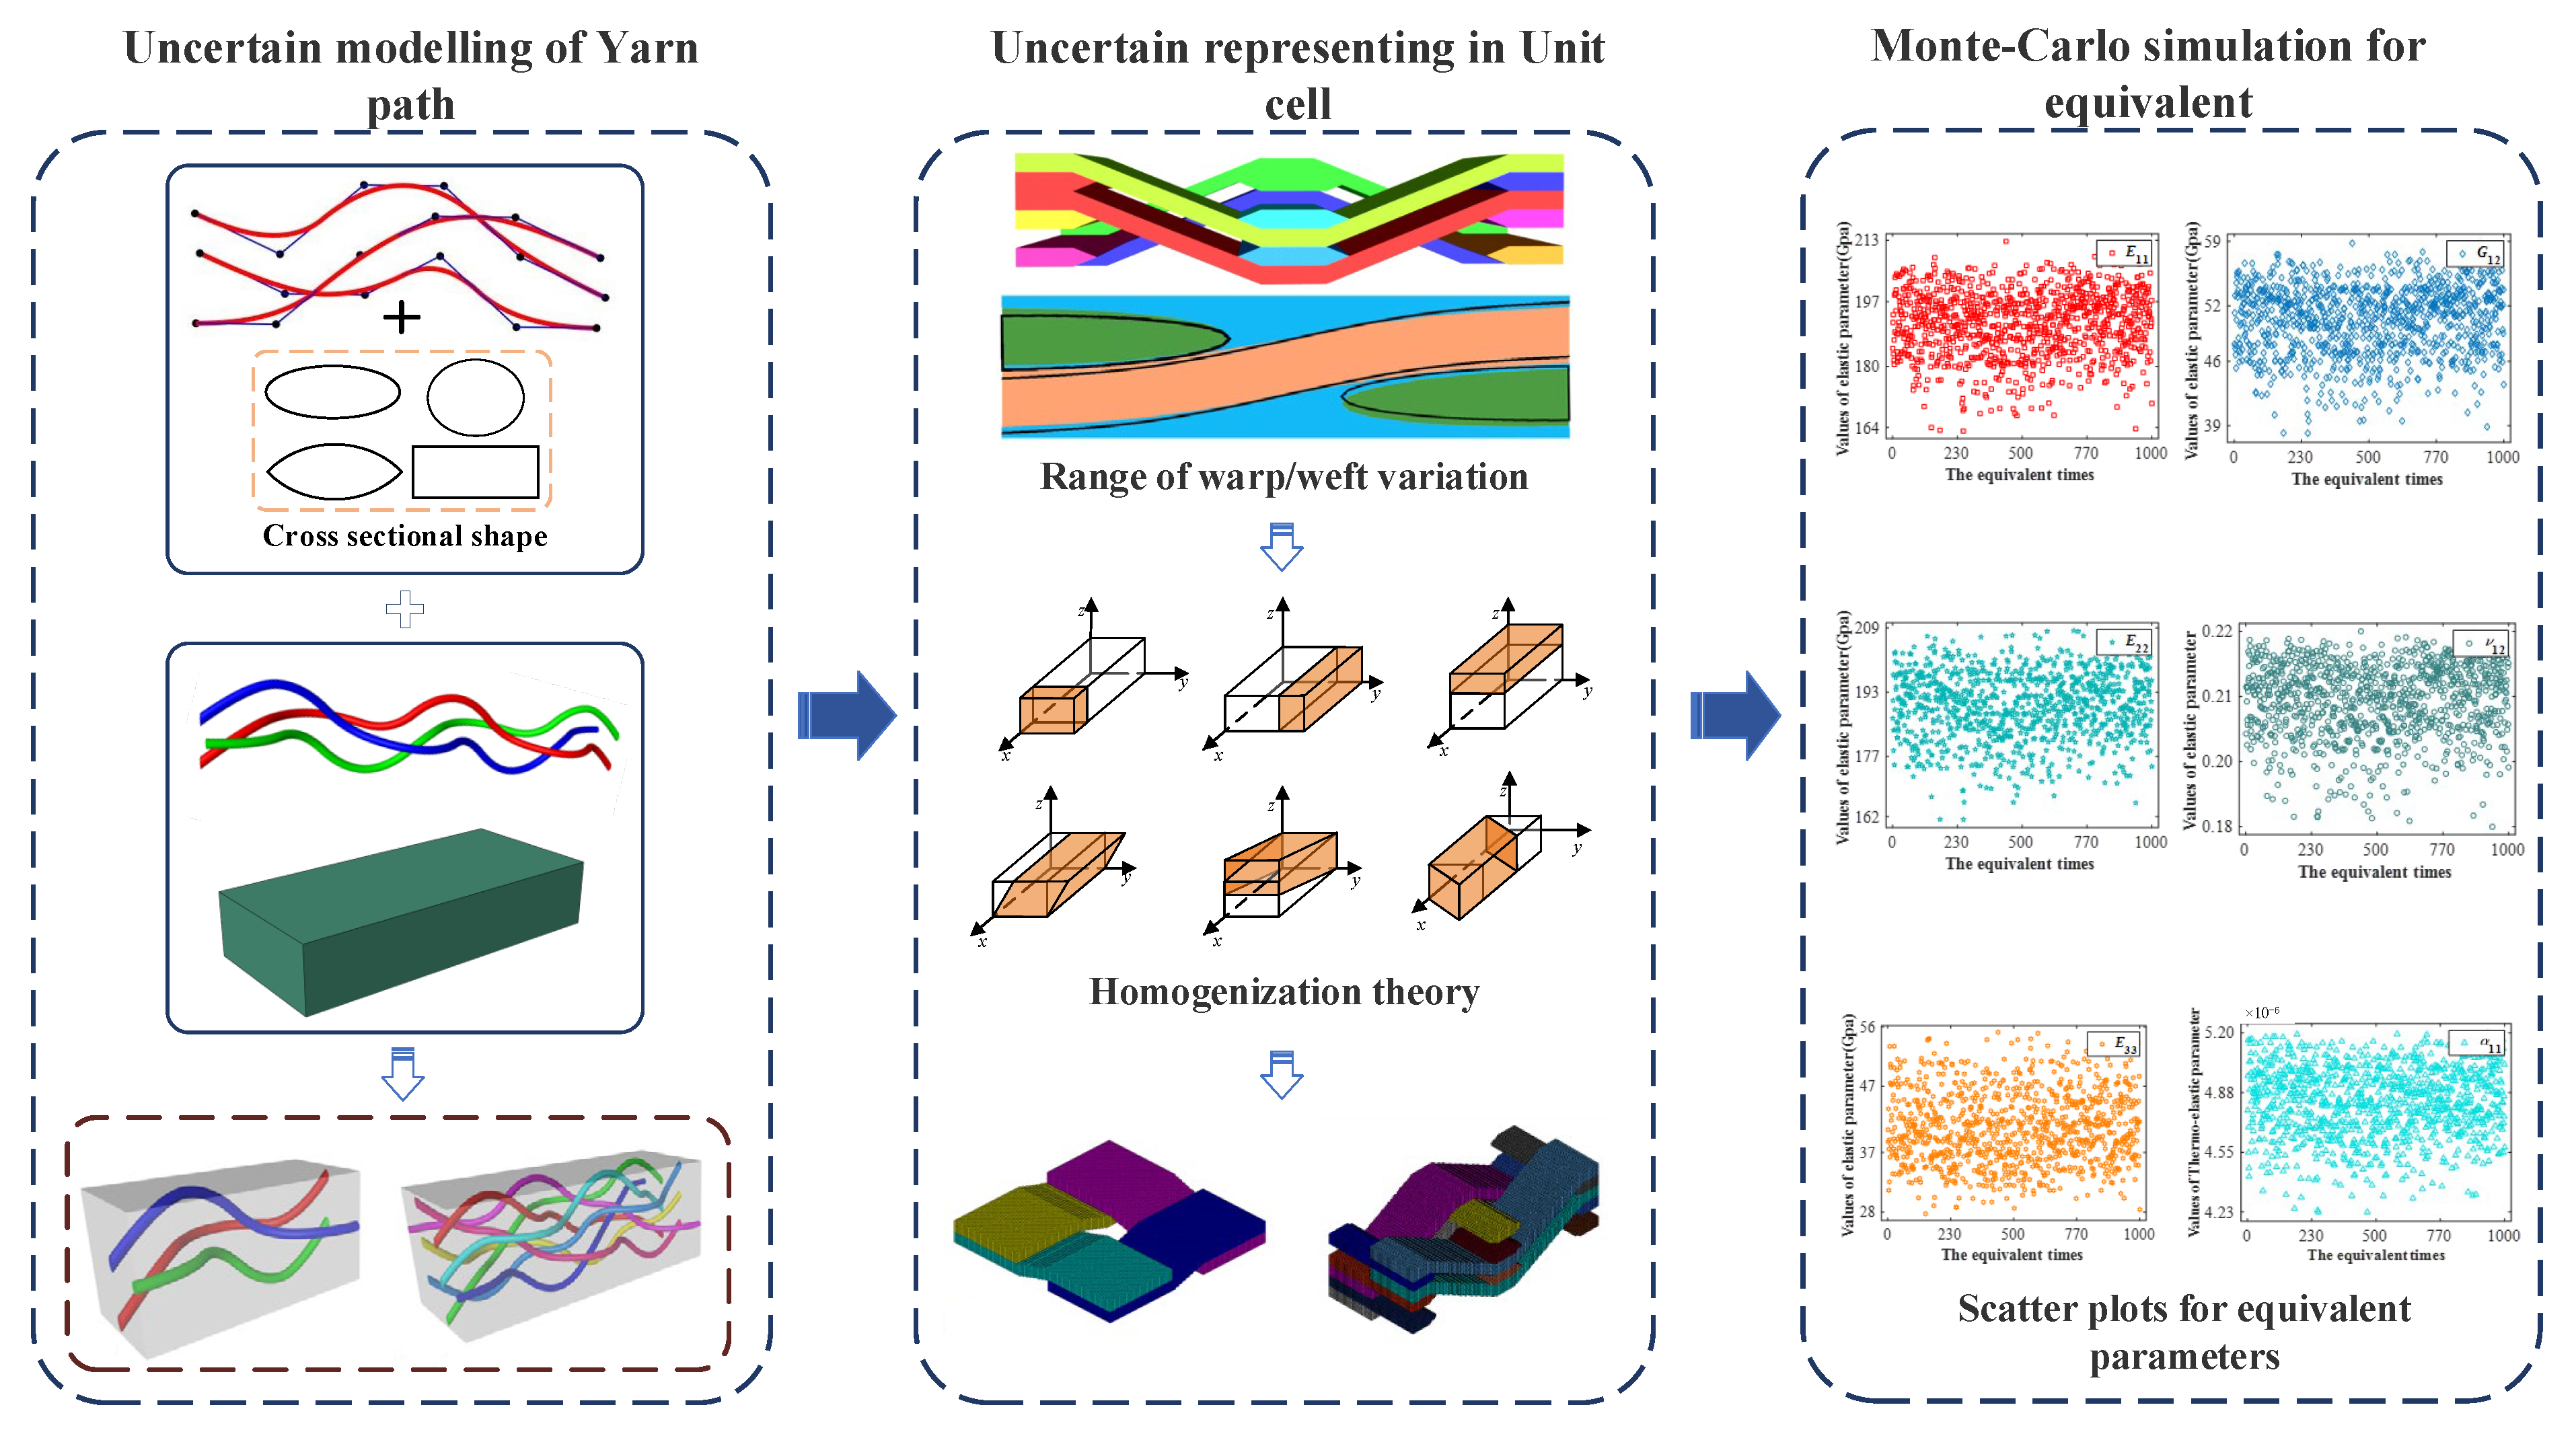
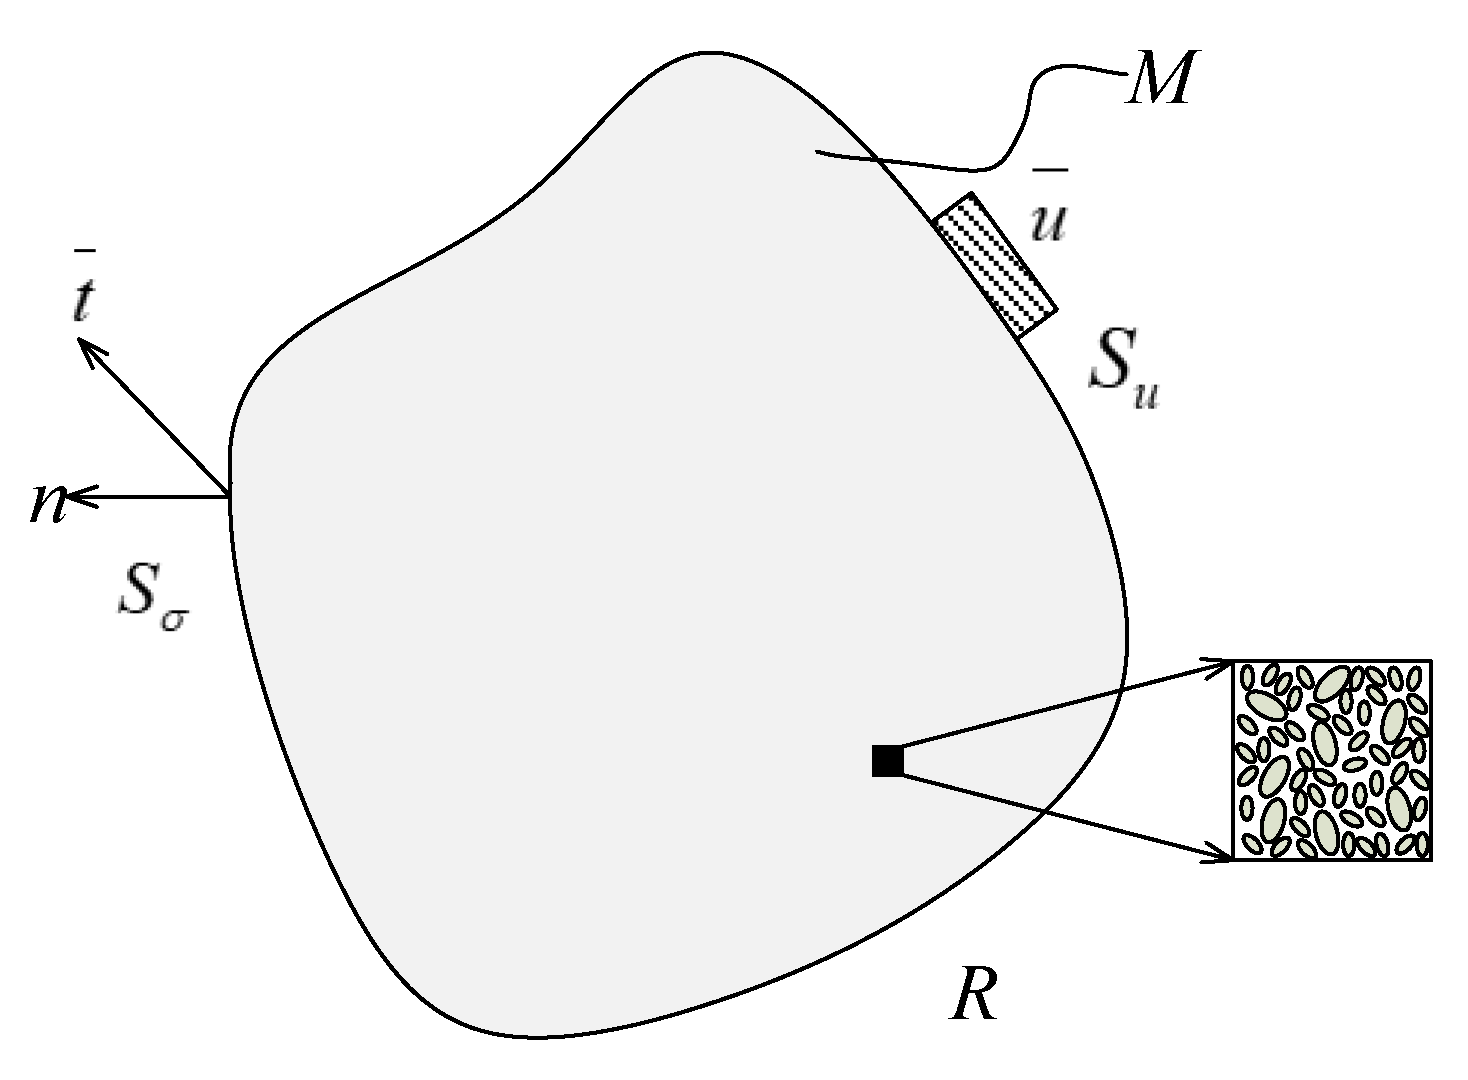
2. Methodology
Obtaining Equivalent Parameters by Loading Boundary Conditions
3. Case Study
3.1. Mesoscopic Uncertainty Modeling of 2D Braided Composites
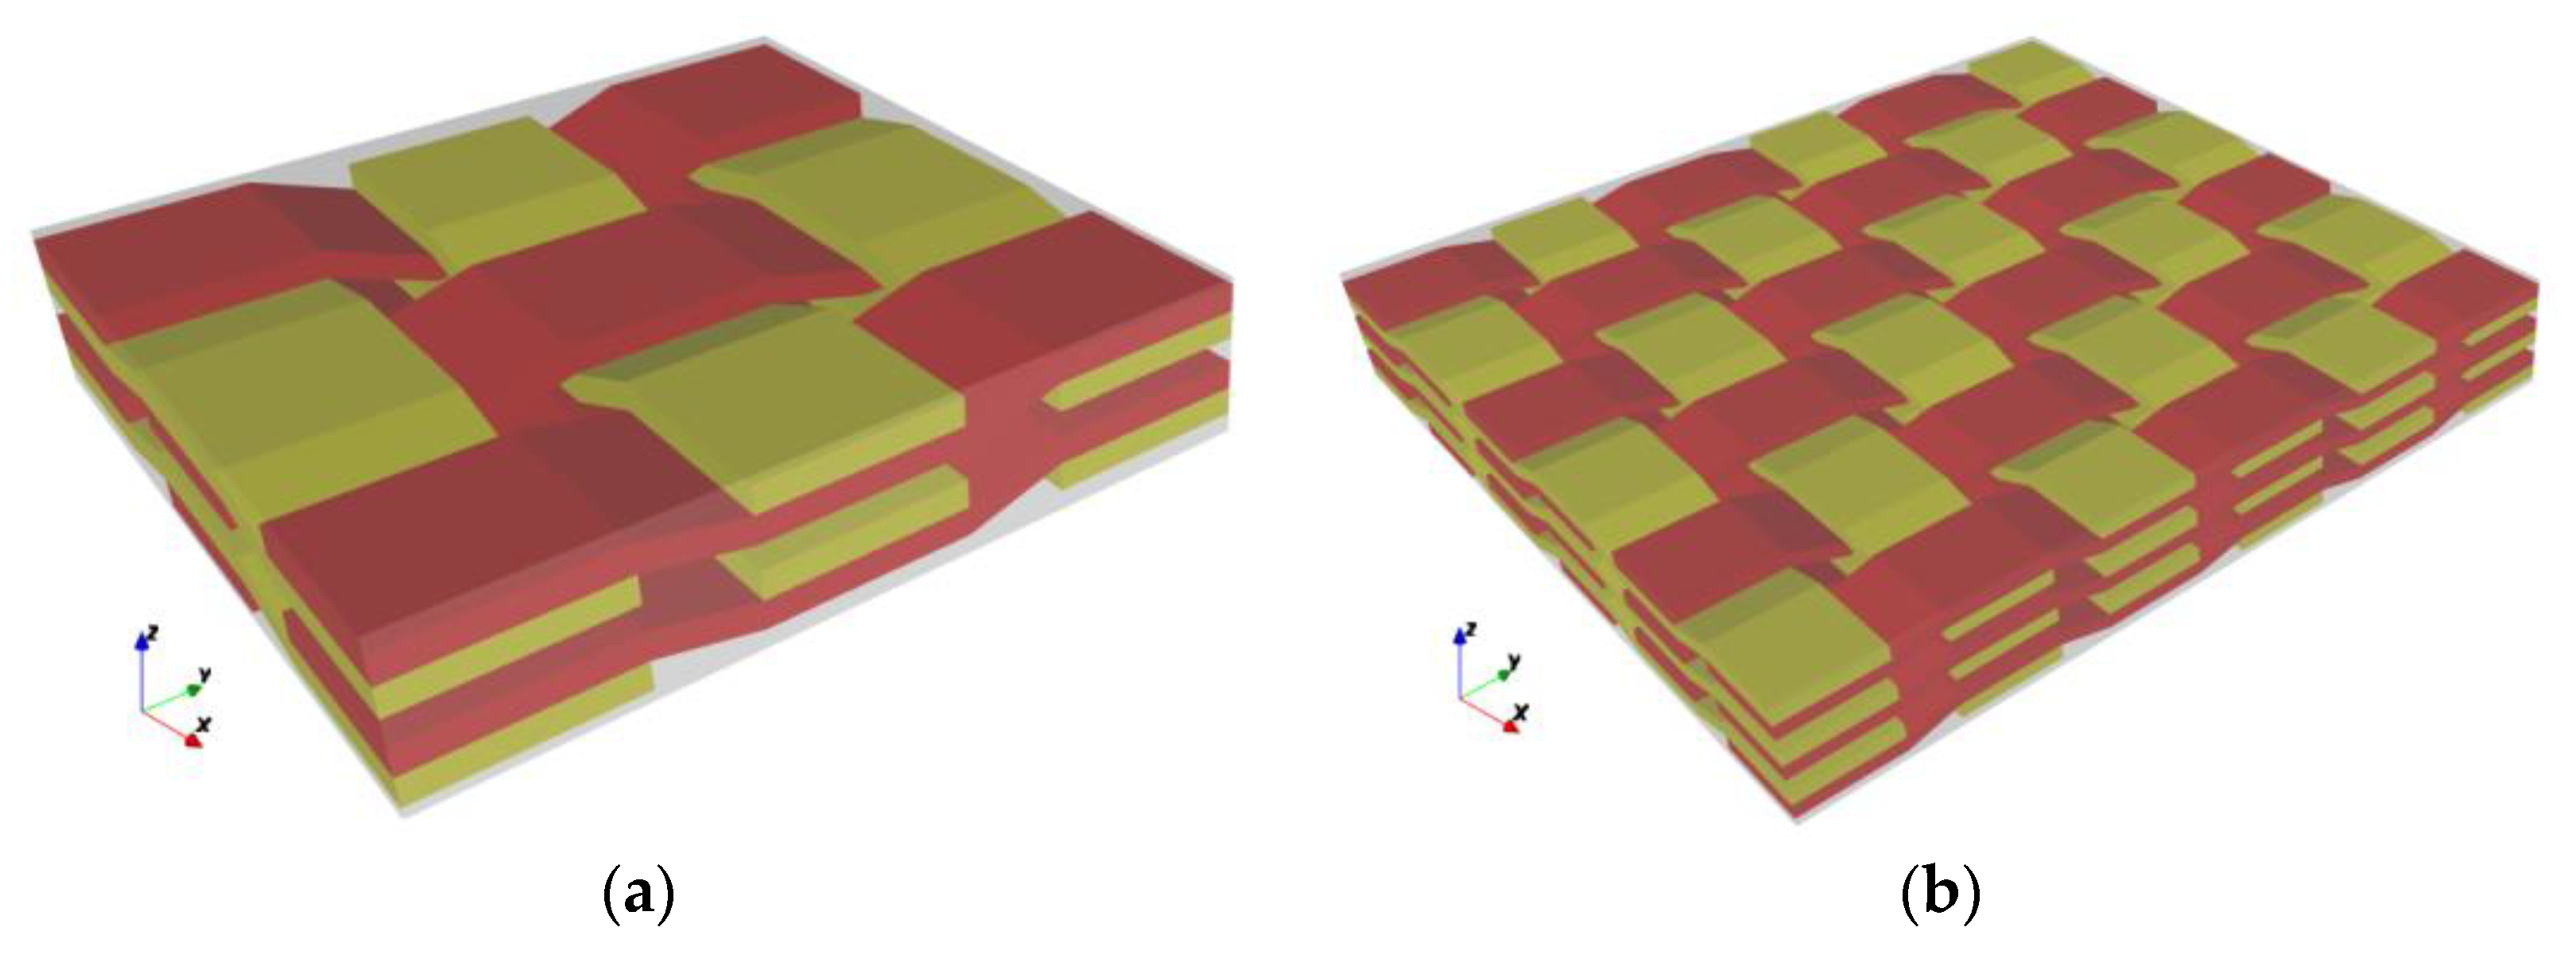
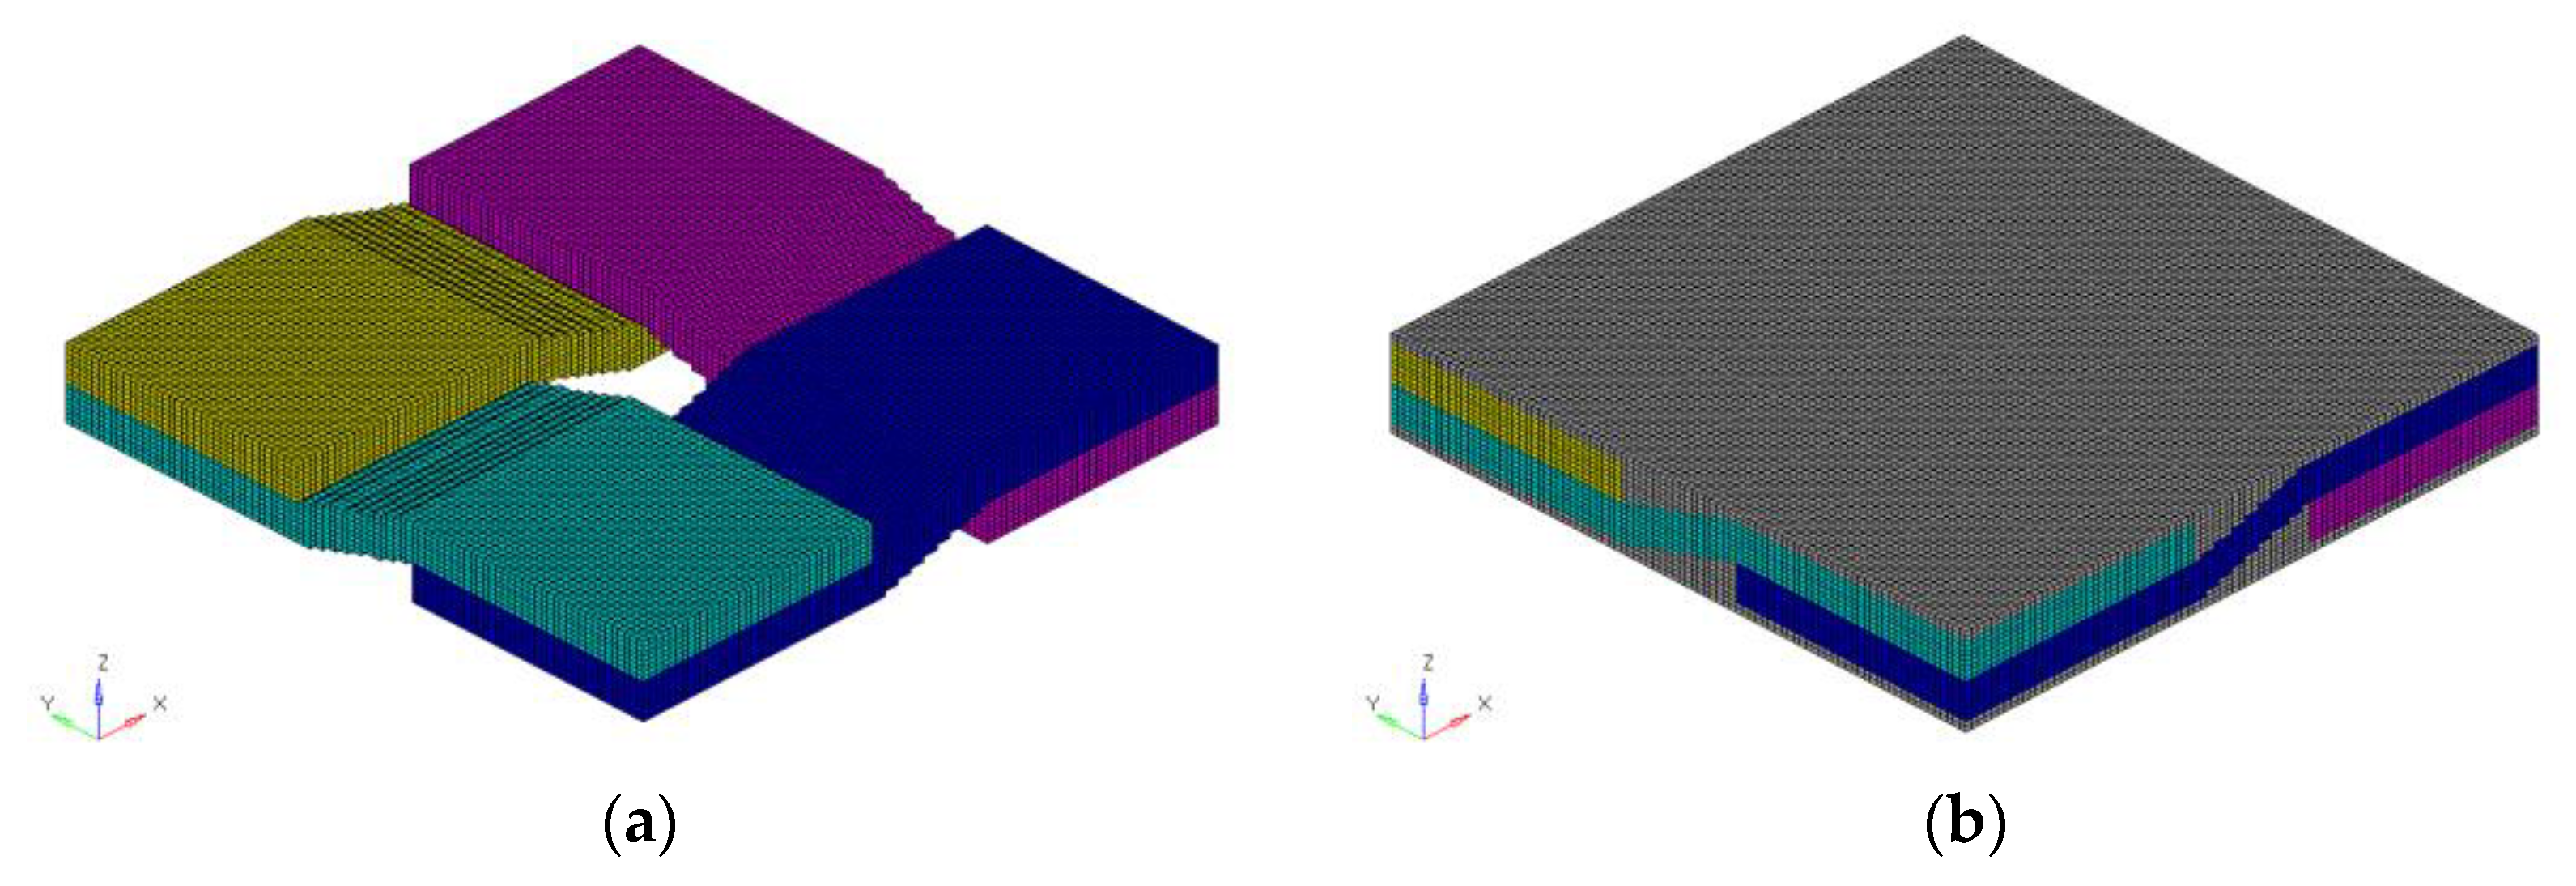
3.1.1. Meso-Geometric Model of Plain Weave Composites
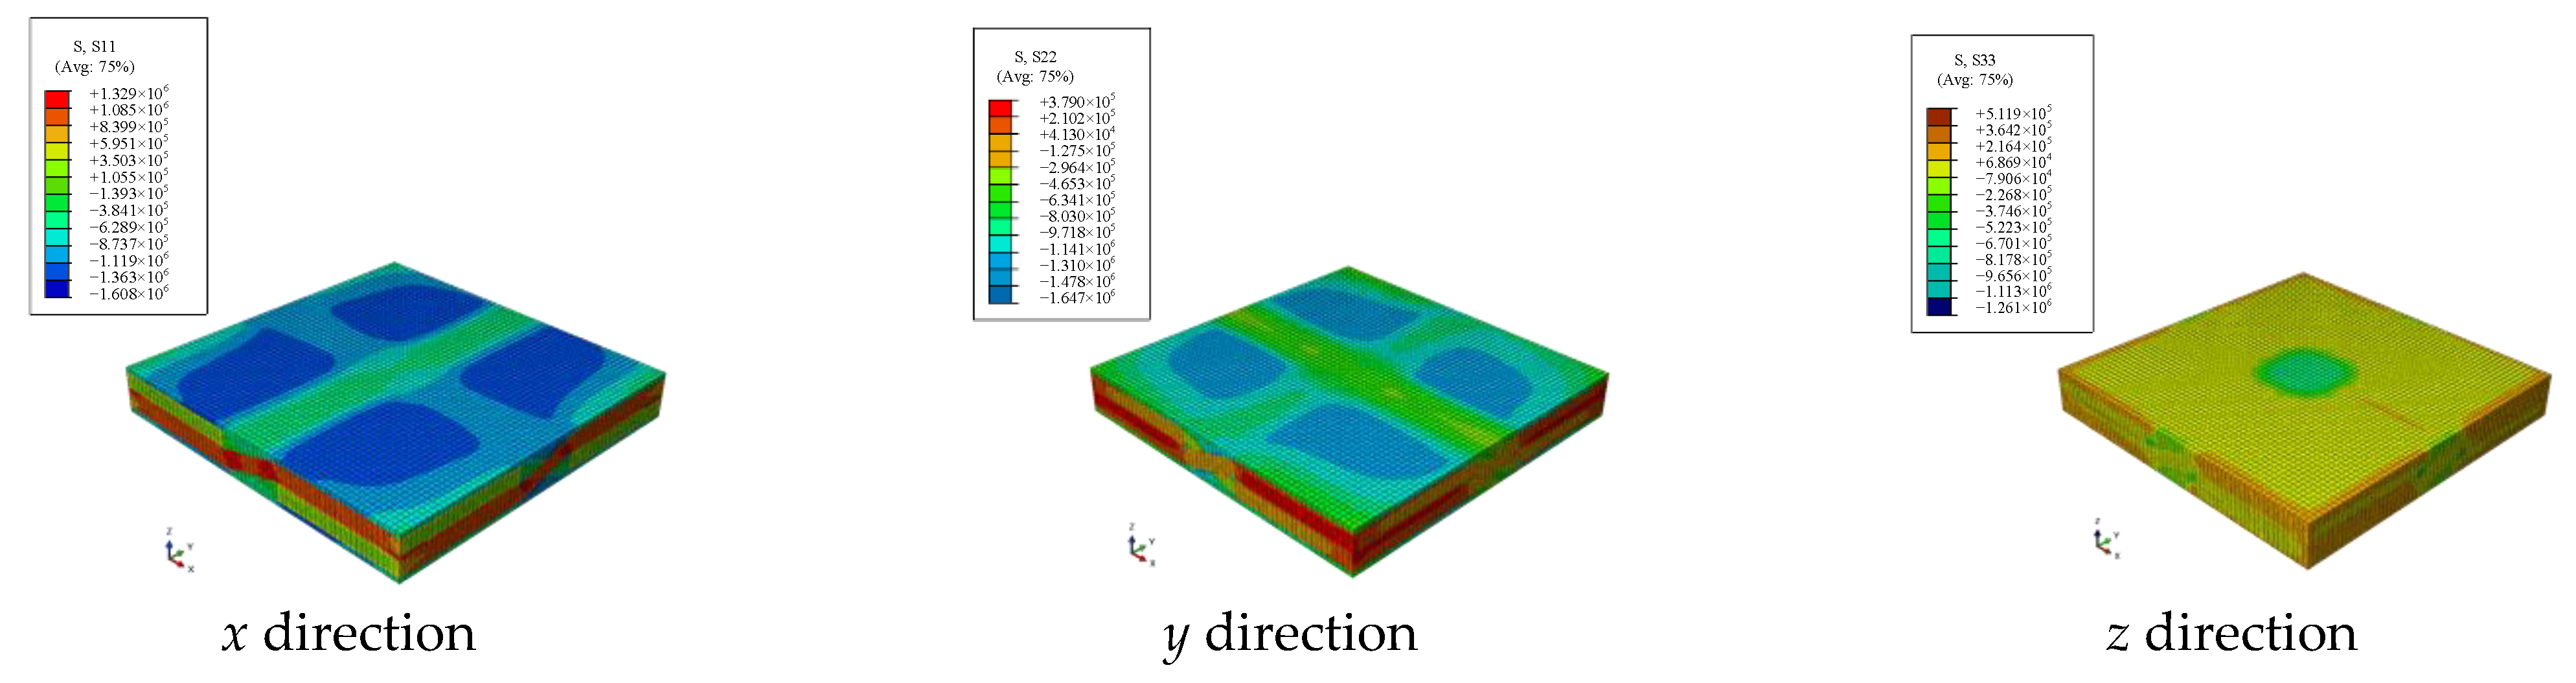
3.1.2. Equivalent Results
3.1.3. Equivalent Results of Yarn Path Uncertainty
3.2. Meso-Uncertainty Modeling of 2.5D Braided Composites
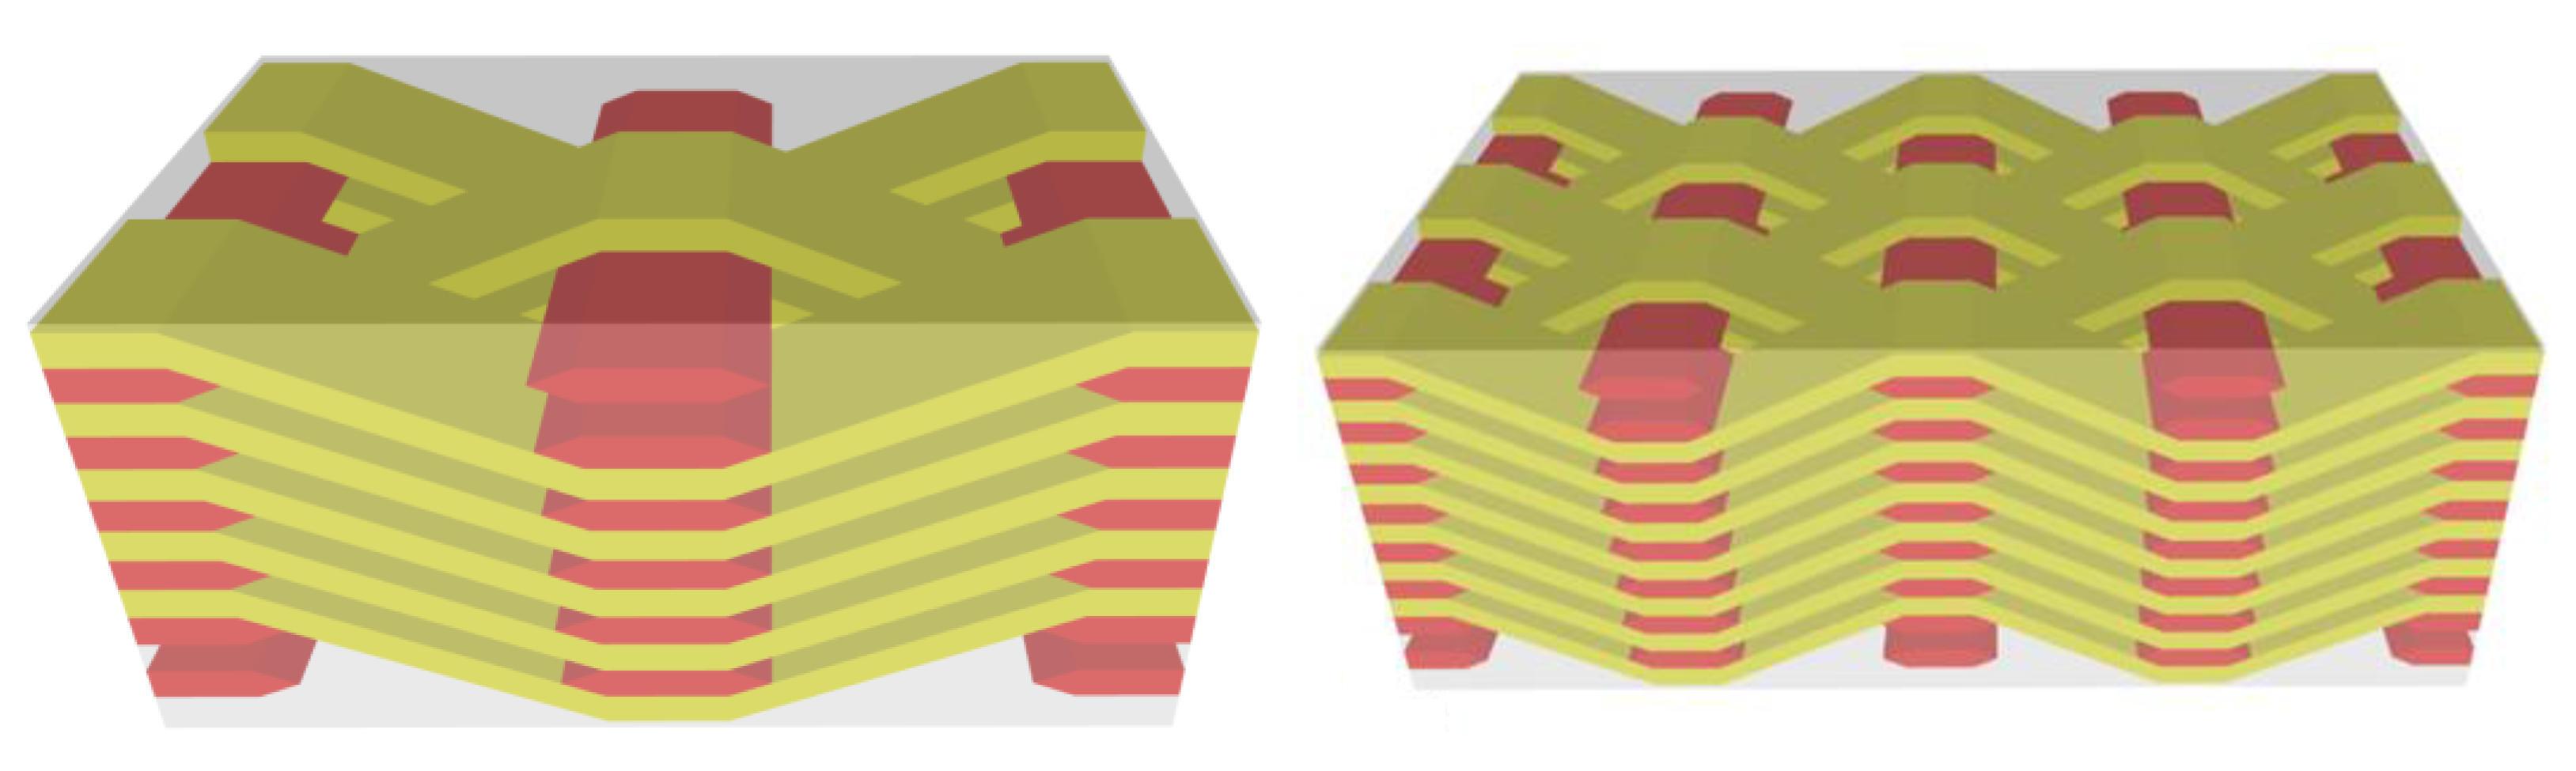
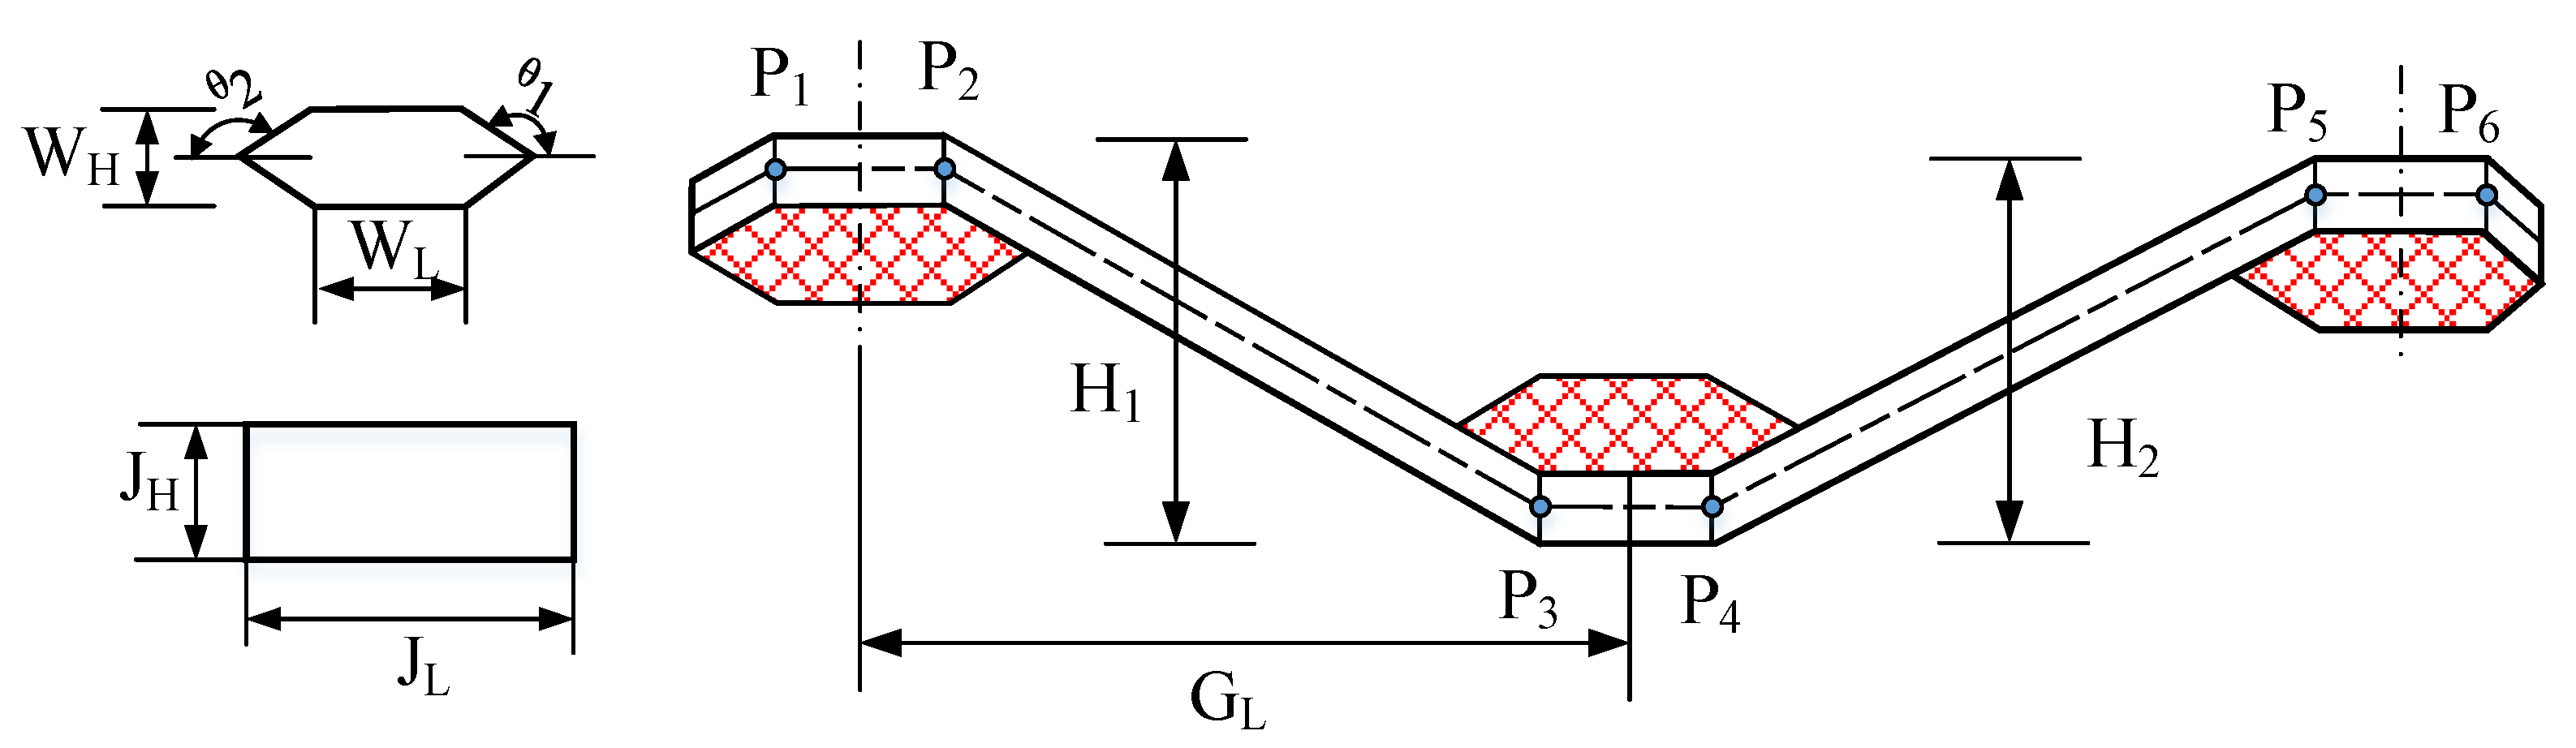
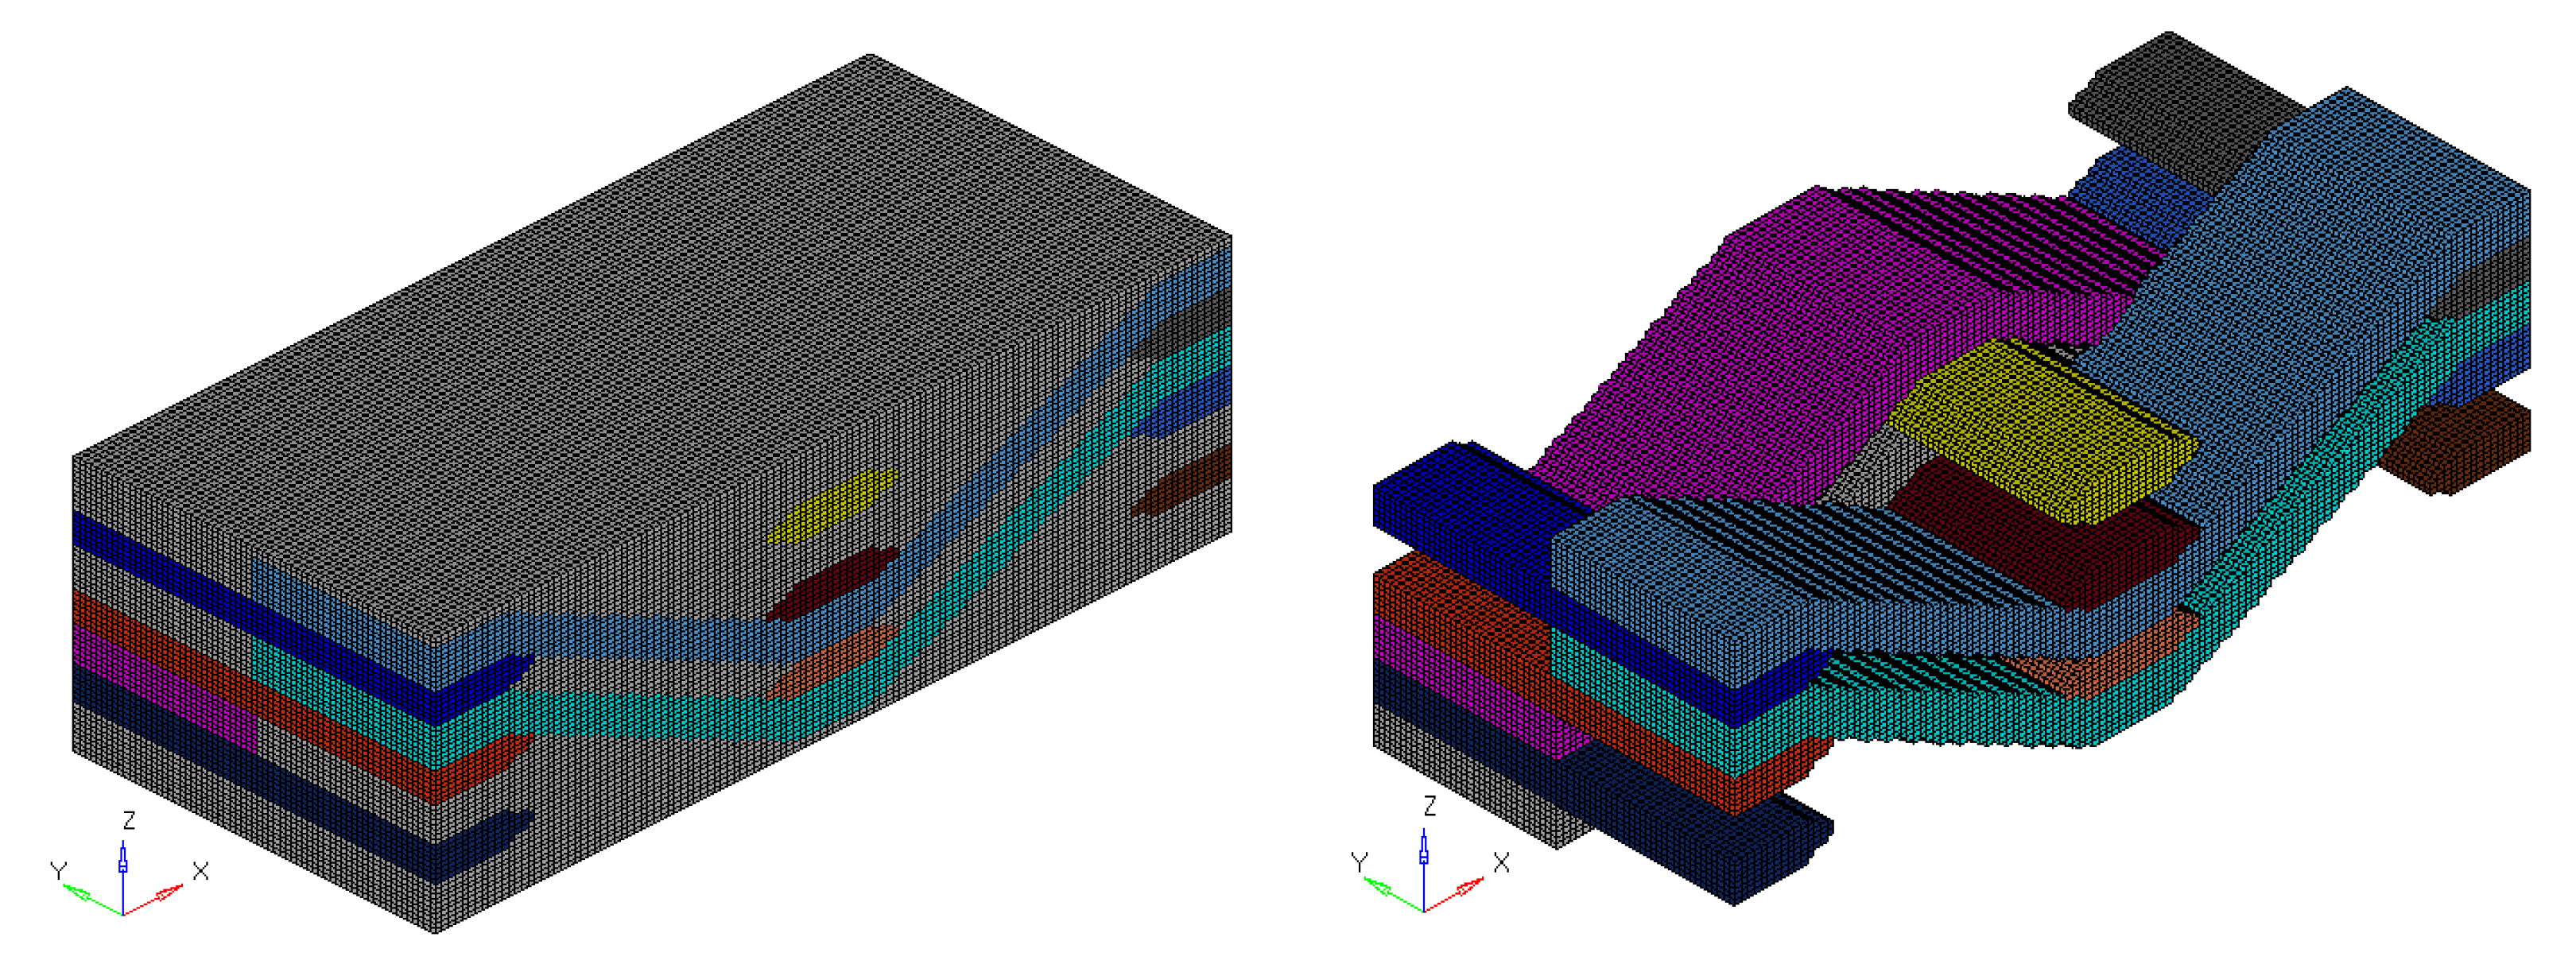
3.2.1. 2.5D Meso-Geometric Model of Braided Composite Materials
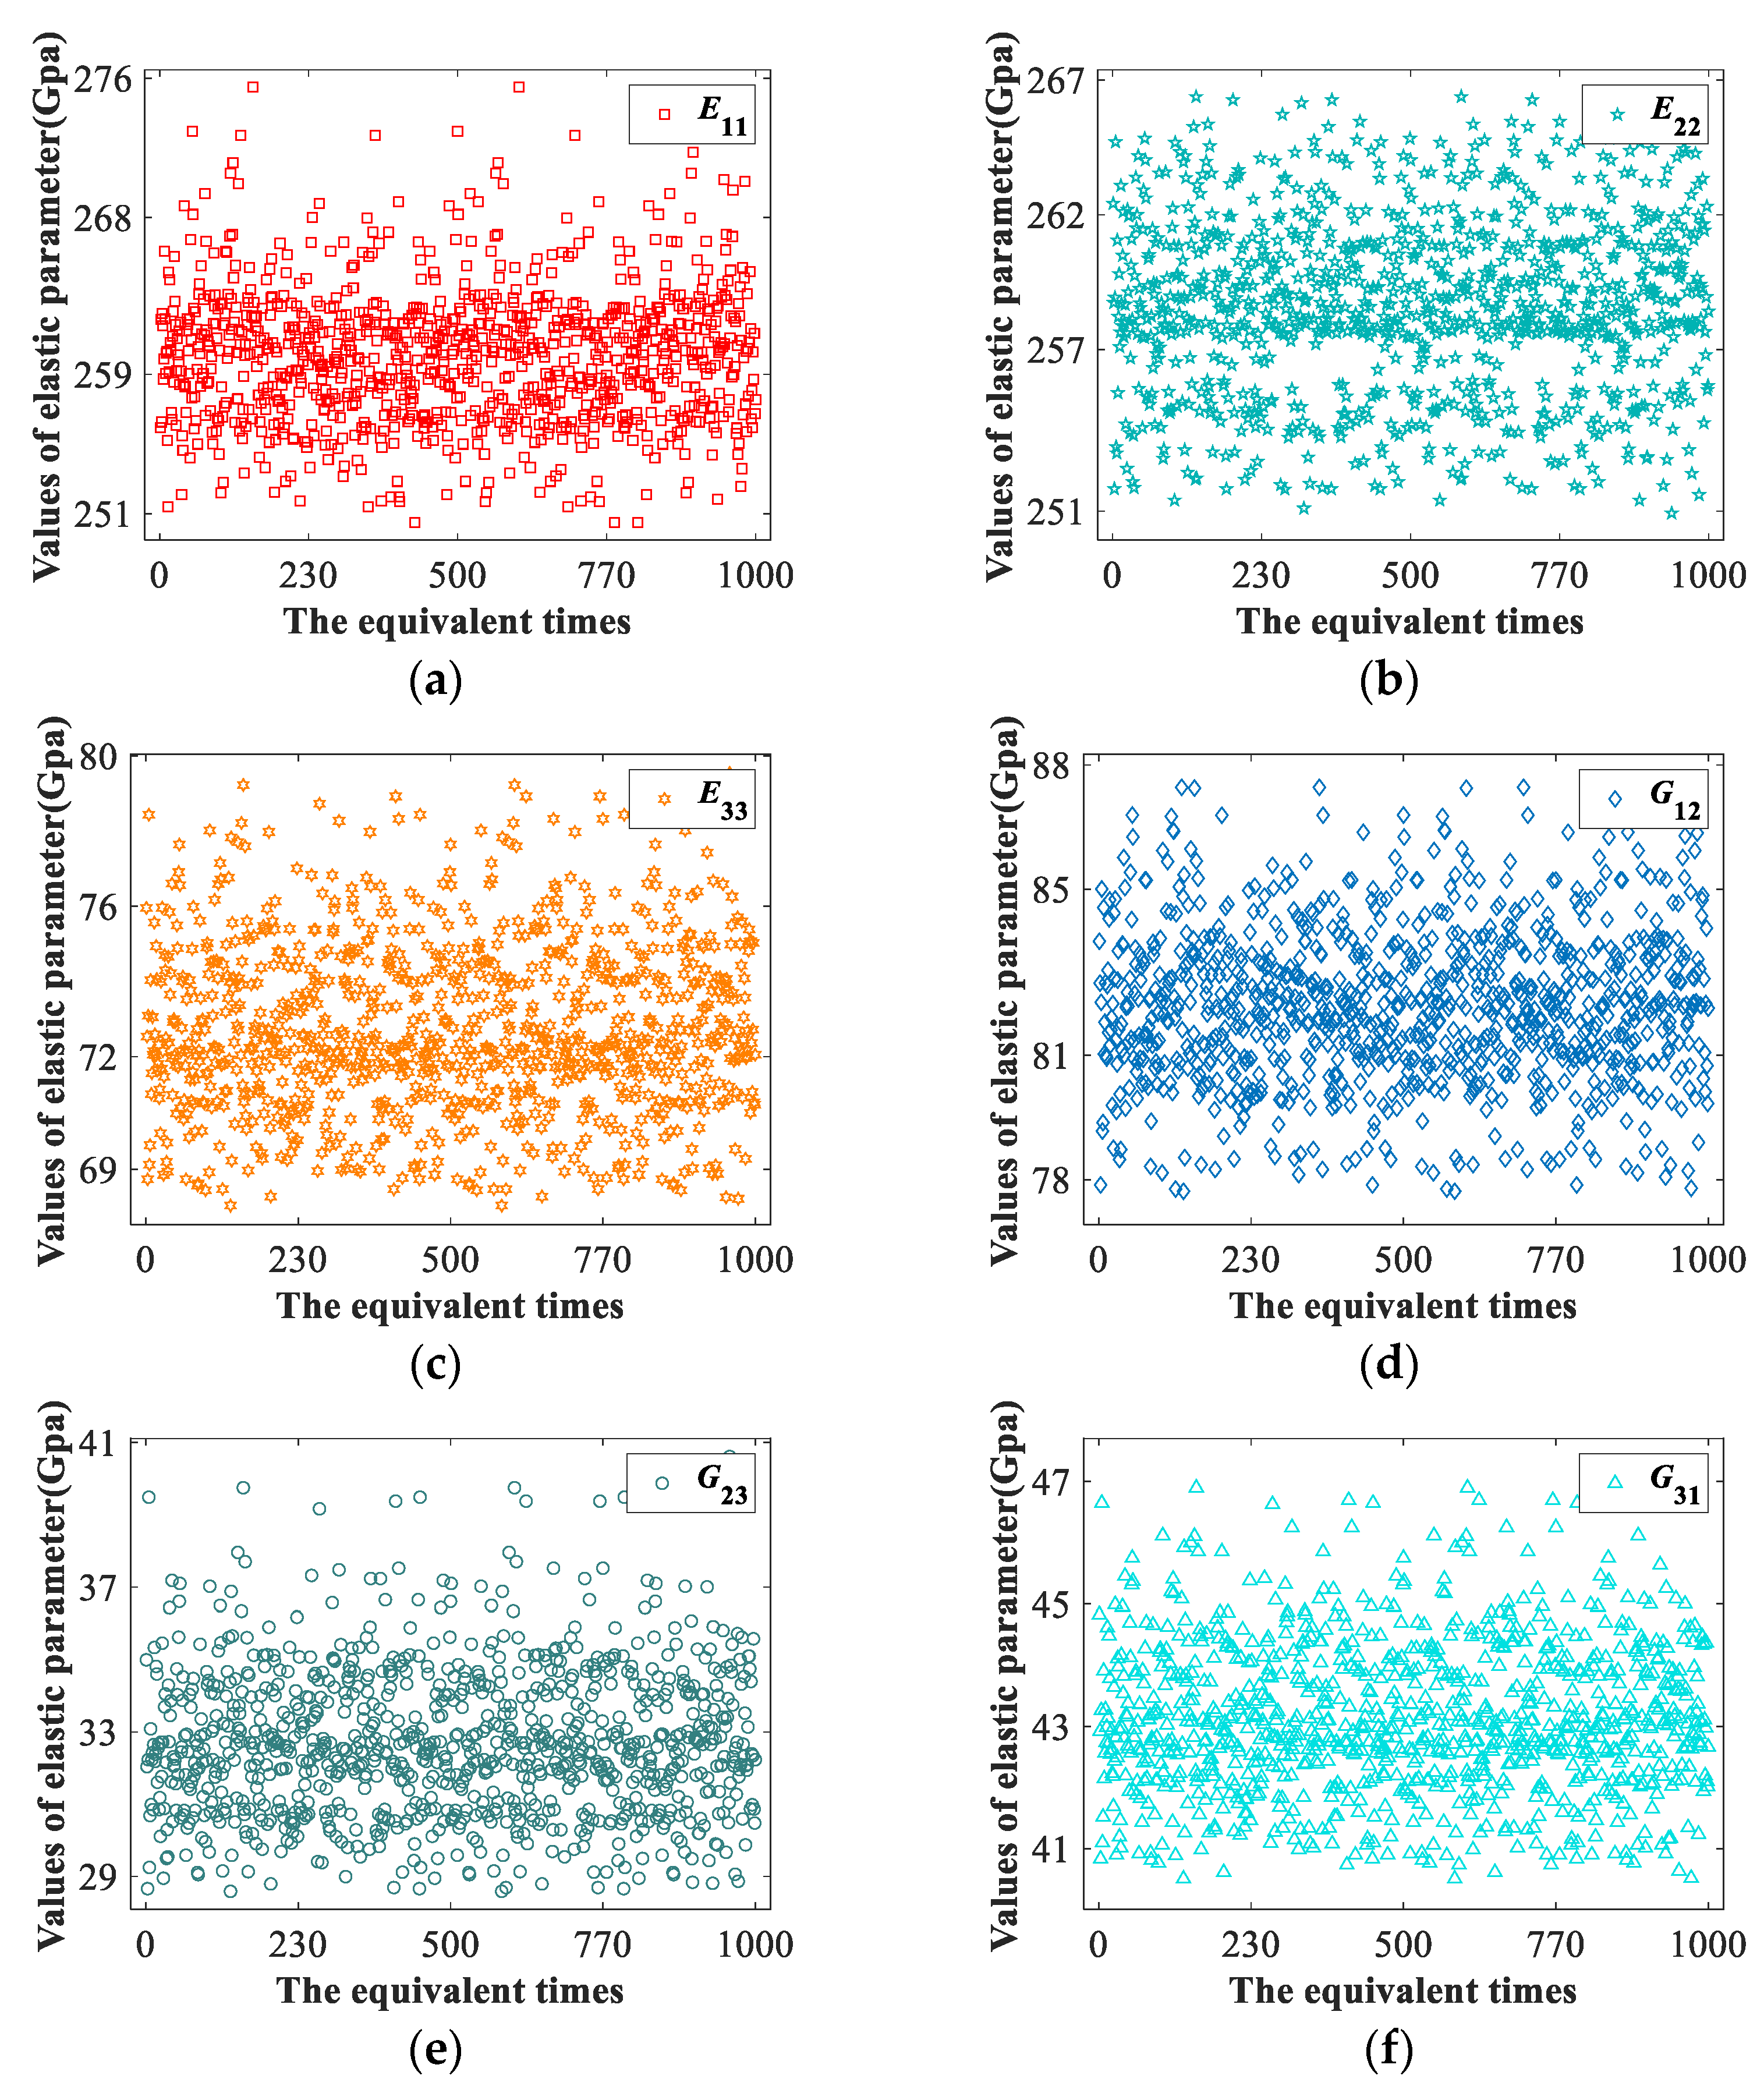
3.2.2. Equivalent Results
3.2.3. Equivalent Results of Yarn Path Uncertainty
4. Conclusions
Author Contributions
Funding
Institutional Review Board Statement
Informed Consent Statement
Data Availability Statement
Conflicts of Interest
References
- Carrere, N.; Rollet, Y.; Retel, V.; Boubakar, L.; Maire, J.-F. Composites structural modelling with uncertain data. Compos. Sci. Technol. 2009, 69, 60–66. [Google Scholar] [CrossRef] [Green Version]
- Carrere, N.; Rollet, Y.; Leroy, F.H.; Maire, J.F. Efficient structural computations with parameters uncertainty for composite applications. Compos. Sci. Technol. 2009, 69, 1328–1333. [Google Scholar] [CrossRef]
- Zhang, S.; Jiang, H.; Ren, Y.; Qian, Z.; Lin, Z. Multi-Scale Progressive Damage Model for Analyzing the Failure Mechanisms of 2D Triaxially Braided Composite under Uniaxial Compression Loads. Appl. Compos. Mater. 2018, 25, 921–938. [Google Scholar] [CrossRef]
- Midani, M.; Seyam, A.-F.; Pankow, M. A generalized analytical model for predicting the tensile behavior of 3D orthogonal woven composites using finite deformation approach. J. Text. Inst. 2018, 109, 1465–1476. [Google Scholar] [CrossRef]
- Sun, R.; Perera, R.; Sevillano, E.; Gu, J. Parameter Identification of Composite Materials Based on Spectral Model by Using Model Updating Method. Int. J. Polym. Sci. 2018, 2018, 7310846. [Google Scholar] [CrossRef] [Green Version]
- Vanaerschot, A.; Cox, B.N.; Lomov, S.V.; Vandepitte, D. Stochastic multi-scale modelling of textile composites based on internal geometry variability. Comput. Struct. 2013, 122, 55–64. [Google Scholar] [CrossRef]
- Jiang, D.; Li, Y.; Fei, Q.; Wu, S. Prediction of uncertain elastic parameters of a braided composite. Compos. Struct. 2015, 126, 123–131. [Google Scholar] [CrossRef]
- Wang, B.; Fang, G.; Wang, H.; Liang, J.; Dai, F.; Meng, S. Uncertainty modelling and multiscale simulation of woven composite twisted structure. Compos. Sci. Technol. 2022, 217, 109118. [Google Scholar] [CrossRef]
- Bei, G.; Ma, C.; Sun, J.; Ni, X.; Ma, Y. A Porous Media Leakage Model of Contact Mechanical Seals Considering Surface Wettability. Coatings 2021, 11, 1338. [Google Scholar]
- Hu, X.B.; Cui, X.Y.; Feng, H.; Li, G. Stochastic analysis using the generalized perturbation stable node-based smoothed finite element method. Eng. Anal. Bound. Elem. 2016, 70, 40–55. [Google Scholar] [CrossRef]
- Wan, Y.; Sun, B.; Gu, B. Multi-scale structure modeling of damage behaviors of 3D orthogonal woven composite materials subject to quasi-static and high strain rate compressions. Mech. Mater. 2016, 94, 1–25. [Google Scholar] [CrossRef] [Green Version]
- Bostanabad, R.; Liang, B.; Gao, J.; Liu, W.K.; Cao, J.; Zeng, D.; Su, X.; Xu, H.; Li, Y.; Chen, W. Uncertainty quantification in multiscale simulation of woven fiber composites. Comput. Methods Appl. Mech. Eng. 2018, 338, 506–532. [Google Scholar] [CrossRef]
- Tsai, K.H.; Hwan, C.L.; Chen, W.L.; Chiu, C.H. A parallelogram spring model for predicting the effective elastic properties of 2D braided composites. Compos. Struct. 2008, 83, 273–283. [Google Scholar] [CrossRef]
- Dong, K.; Zhang, J.; Jin, L.; Gu, B.; Sun, B. Multi-scale finite element analyses on the thermal conductive behaviors of 3D braided composites. Compos. Struct. 2016, 143, 9–22. [Google Scholar] [CrossRef] [Green Version]
- Wang, C.; Zhang, C. Discussions on extension of traditional cohesive element for delamination modeling of laminates used in combination with phantom node intraply elements. Compos. Struct. 2021, 261, 113588. [Google Scholar] [CrossRef]
- Wang, C. Transverse crack evolution modeling of cross-ply laminates with a single layer of phantom node intraply elements for identically-oriented ply groups. Compos. Struct. 2020, 254, 112842. [Google Scholar] [CrossRef]
- Chen, E.J.; Ding, L.; Liu, Y.; Ma, X.; Skibniewski, M.J. On spectral representation method and Karhunen-Loeve expansion in modelling construction material properties. Arch. Civ. Mech. Eng. 2018, 18, 768–783. [Google Scholar] [CrossRef]
- Peng, X.; Li, D.; Wu, H.; Liu, Z.; Li, J.; Jiang, S.; Tan, J. Uncertainty analysis of composite laminated plate with data-driven polynomial chaos expansion method under insufficient input data of uncertain parameters. Compos. Struct. 2019, 209, 625–633. [Google Scholar] [CrossRef]
- Thapa, M.; Mulani, S.B.; Walters, R.W. Stochastic multi-scale modeling of carbon fiber reinforced composites with polynomial chaos. Compos. Struct. 2019, 213, 82–97. [Google Scholar] [CrossRef]
- Hill, R. Elastic properties of reinforced solids: Some theoretical principles. J. Mech. Phys. Solids 1963, 11, 357–372. [Google Scholar] [CrossRef]
- Gibanica, M.; Abrahamsson, T.J. Data-driven modal surrogate model for frequency response uncertainty propagation. Probabilistic Eng. Mech. 2021, 66, 103142. [Google Scholar] [CrossRef]
- Xia, Z.; Zhou, C.; Yong, Q.; Wang, X. On selection of repeated unit cell model and application of unified periodic boundary conditions in micro-mechanical analysis of composites. Int. J. Solids Struct. 2006, 43, 266–278. [Google Scholar] [CrossRef] [Green Version]
- Okada, H.; Fukui, Y.; Kumazawa, N. Homogenization method for heterogeneous material based on boundary element method. Comput. Struct. 2001, 79, 1987–2007. [Google Scholar] [CrossRef]
- Chen, S.; Fei, Q.; Jiang, D.; Cao, Z. Determination of thermo-elastic parameters for dynamical modeling of 2.5D C/SiC braided composites. J. Mech. Sci. Technol. 2018, 32, 231–243. [Google Scholar] [CrossRef]
- Xiao, X.; Kia, H.G.; Gong, X.-J. Strength prediction of a triaxially braided composite. Compos. Part A-Appl. Sci. Manuf. 2011, 42, 1000–1006. [Google Scholar] [CrossRef]
- Tang, L.; Wu, W.; He, L.; Xu, T.; Dong, H.; Zhang, L.; Shi, L.; Sun, L. In situ observation of the solid solution-induced sublimation of CuAg Janus nanoparticles. J. Alloys Compd. 2021, 877, 160168. [Google Scholar] [CrossRef]
- Li, J.; Zhu, Z.; Arshad, A.; Zhang, S.; Shi, L.; Yan, Y. Magnetic Field-induced Enhancement of Phase Change Heat Transfer via Biomimetic Porous Structure for Solar-thermal Energy Storage. J. Bionic Eng. 2021, 18, 1215–1224. [Google Scholar] [CrossRef]
- Lin, H.; Sherburn, M.; Crookston, J.; Long, A.C.; Clifford, M.J.; Jones, I.A. Finite element modelling of fabric compression. Model. Simul. Mater. Sci. Eng. 2008, 16, 035010. [Google Scholar] [CrossRef]
- Lin, H.; Long, A.C.; Sherburn, M.; Clifford, M.J. Modelling of mechanical behaviour for woven fabrics under combined loading. Int. J. Mater. Form. 2008, 1, 899–902. [Google Scholar] [CrossRef]
- Stig, F.; Hallstrom, S. Spatial modelling of 3D-woven textiles. Compos. Struct. 2012, 94, 1495–1502. [Google Scholar] [CrossRef]
- Jiang, D.; Nie, W.; Fei, Q.; Wu, S. Free vibration analysis of composite panels considering correlations of spatially distributed uncertain parameters. Appl. Math. Model. 2021, 98, 747–757. [Google Scholar] [CrossRef]
- Zhang, Y.; Ni, X.; Pan, C. Finite element simulation and optimization of mechanical performance of the magnesium-alloy biliary stent. Int. J. Numer. Methods Biomed. Eng. 2022, 38, e3592. [Google Scholar] [CrossRef]
- Sevenois, R.D.B.; Garoz, D.; Gilabert, F.A.; Spronk, S.W.F.; Fonteyn, S.; Heyndrickx, M.; Pyl, L.; Van Hemelrijck, D.; Degrieck, J.; Van Paepegem, W. Avoiding interpenetrations and the importance of nesting in analytic geometry construction for Representative Unit Cells of woven composite laminates. Compos. Sci. Technol. 2016, 136, 119–132. [Google Scholar] [CrossRef]
- Ma, J.; Xu, Y.; Zhang, L.; Cheng, L.; Nie, J.; Dong, N. Microstructure characterization and tensile behavior of 2.5D C/SiC composites fabricated by chemical vapor infiltration. Scr. Mater. 2006, 54, 1967–1971. [Google Scholar] [CrossRef]


| Stiffness Coefficient | The Boundary of a Hexahedral Cell | ||||||
|---|---|---|---|---|---|---|---|
| A | B | C | D | E | F | ||
| The first column | [ε1m, 0, 0, 0, 0, 0] | (0, 0, 0) | (x1, 0, 0) | (_, 0, 0) | (_, 0, 0) | (_, 0, 0) | (_, 0, 0) |
| The second column | [0, ε2m, 0, 0, 0, 0] | (0, _, 0) | (0, _, 0) | (0, 0, 0) | (0, y2, 0) | (0, _, 0) | (0, _, 0) |
| The third column | [0, 0, ε3m, 0, 0, 0] | (0, 0, _) | (0, 0, _) | (0, 0, _) | (0, 0, _) | (0, 0, z3) | (0, 0, 0) |
| The fourth column | [0, 0, 0, 𝛾12m, 0, 0] | (_, 0, 0) | (_, 0, 0) | (_, 0, 0) | (_, 0, 0) | (y2, 0, 0) | (0, 0, 0) |
| The fifth column | [0, 0, 0, 0, 𝛾23m, 0] | (0, _, 0) | (0, _, 0) | (0, 0, 0) | (0, z3, 0) | (0, _, 0) | (0, _, 0) |
| The sixth column | [0, 0, 0, 0, 0, 𝛾13m] | (0, 0, 0) | (0, 0, x1) | (0, 0, _) | (0, 0, _) | (0, 0, _) | (0, 0, _) |
| Parameter | Design Specification | Value |
|---|---|---|
| JL | Length of warp cross section | 0.4 |
| WL | Length of weft cross section | 0.4 |
| GL | Distance between warp and weft | [0.1,0.3] |
| JH, WH | Cross section thickness | 0.056 |
| Hr1, Hr2 | Weft height changes | [0.082,0.111] |
| Hm | Outer matrix height | 0.04 |
| Elastic Modulus (E/Gpa) | Poisson’s Ratio | Shear Modulus (G/Gpa) | ||||
|---|---|---|---|---|---|---|
| E11 | E22 | ν12 | ν23 | G12 | G23 | |
| Carbon fiber | 220 | 138 | 0.2 | 0.25 | 9 | 4.8 |
| Matrix | 350 | 0.3 | 140 | |||
| Thermal Expansion (10−6 k−1) | α11 | α22 | α33 |
|---|---|---|---|
| Carbon fiber | −2 × 10⁻⁷ | 3 × 10⁻⁶ | 3 × 10⁻⁶ |
| Matrix | 6.5 × 10⁻⁶ | ||
| E11 (Gpa) | E22 (Gpa) | E33 (Gpa) | ν12 | ν23 | ν31 | G12 (Gpa) | G23 (Gpa) | G31 (Gpa) | α11 (10−6) | α22 (10−6) | α33 (10−6) |
|---|---|---|---|---|---|---|---|---|---|---|---|
| 196.4 | 195.3 | 44.2 | 0.2 | 0.2 | 0.1 | 52.9 | 14.5 | 12.9 | 4.93 × 10⁻⁶ | 4.99 × 10⁻⁶ | 5.62 × 10⁻⁶ |
| Statistic | E11 (E/Gpa) | E22 (E/Gpa) | E33 (E/Gpa) | ν12 | ν23 | ν31 | G12 (G/Gpa) | G23 (G/Gpa) | G31 (G/Gpa) |
|---|---|---|---|---|---|---|---|---|---|
| Mean value | 191.113 | 189.543 | 40.703 | 0.208 | 0.253 | 0.054 | 50.380 | 13.566 | 12.465 |
| Standard deviation | 8.498 | 8.367 | 5.440 | 0.007 | 0.006 | 0.005 | 3.704 | 1.031 | 0.982 |
| Statistic | α11 (10−6) | α22 (10−6) | α33 (10−6) |
|---|---|---|---|
| Mean value | 4.823 × 10⁻⁶ | 4.885 × 10⁻⁶ | 5.456 × 10⁻⁶ |
| Standard deviation | 1.924 × 10⁻⁷ | 1.912 × 10⁻⁷ | 2.370 × 10⁻⁷ |
| Coefficient | E11 | E22 | E33 | ν12 | ν23 | ν31 | G12 | G23 | G31 |
|---|---|---|---|---|---|---|---|---|---|
| E11 | 1 | 0.864 | 0.715 | 0.924 | 0.309 | 0.539 | 0.952 | 0.865 | 0.893 |
| E22 | 1 | 0.717 | 0.742 | 0.194 | 0.651 | 0.952 | 0.884 | 0.874 | |
| E33 | 1 | 0.467 | −0.274 | 0.954 | 0.652 | 0.818 | 0.833 | ||
| ν12 | 1 | 0.443 | 0.251 | 0.908 | 0.684 | 0.734 | |||
| ν23 | sym | 1 | −0.469 | 0.328 | −0.018 | 0.237 | |||
| ν31 | 1 | 0.515 | 0.765 | 0.706 | |||||
| G12 | 1 | 0.859 | 0.874 | ||||||
| G23 | 1 | 0.806 | |||||||
| G31 | 1 |
| Parameter | Design Specification | Value |
|---|---|---|
| JH | Height of warp section | 0.169 |
| JL | Total length of warp section | 1.015 |
| WH | Height of weft cross section | 0.169 |
| WL | Length of weft cross section | 0.6 |
| GL | Distance between warp yarns | [1.535,1.835] |
| H1, H2 | Weft height changes | [0.516,0.836] |
| Hm | Outer matrix height | 0.04 |
| E11 (Gpa) | E22 (Gpa) | E33 (Gpa) | ν12 | ν23 | ν31 | G12 (Gpa) | G23 (Gpa) | G31 (Gpa) | α11 (10−6) | α22 (10−6) | α33 (10−6) |
|---|---|---|---|---|---|---|---|---|---|---|---|
| 261.1 | 255.1 | 66.5 | 0.25 | 0.37 | 0.07 | 80.6 | 30.8 | 41.3 | 5.74 × 10⁻⁶ | 5.80 × 10⁻⁶ | 6.27 × 10⁻⁶ |
| Statistic | E11 (E/Gpa) | E22 (E/Gpa) | E33 (E/Gpa) | ν12 | ν23 | ν31 | G12 (G/Gpa) | G23 (G/Gpa) | G31 (G/Gpa) |
|---|---|---|---|---|---|---|---|---|---|
| Mean value | 260.083 | 258.625 | 72.725 | 0.244 | 0.360 | 0.079 | 82.194 | 32.677 | 43.121 |
| Standard deviation | 3.864 | 3.223 | 2.238 | 0.003 | 0.003 | 0.002 | 1.860 | 2.015 | 1.229 |
| Statistic | α11 (10−6 k−1) | α22 (10−6 k−1) | α33 (10−6 k−1) |
|---|---|---|---|
| Mean value | 5.734 × 10⁻⁶ | 5.804 × 10⁻⁶ | 6.265 × 10⁻⁶ |
| Standard deviation | 4.118 × 10⁻⁸ | 3.797 × 10⁻⁸ | 1.326 × 10⁻⁸ |
| Coefficient | E11 | E22 | E33 | ν12 | ν23 | ν31 | G12 | G23 | G31 |
|---|---|---|---|---|---|---|---|---|---|
| E11 | 1 | 0.126 | 0.113 | 0.994 | −0.018 | −0.179 | 0.438 | 0.038 | 0.096 |
| E22 | 1 | 0.958 | 0.126 | −0.949 | 0.887 | 0.934 | 0.931 | 0.945 | |
| E33 | 1 | 0.093 | −0.910 | 0.937 | 0.893 | 0.968 | 0.997 | ||
| ν12 | 1 | −0.020 | −0.204 | 0.435 | 0.015 | 0.074 | |||
| ν23 | sym | 1 | −0.863 | −0.839 | −0.902 | −0.897 | |||
| ν31 | 1 | 0.734 | 0.959 | 0.948 | |||||
| G12 | 1 | 0.860 | 0.877 | ||||||
| G23 | 1 | 0.975 | |||||||
| G31 | 1 |
Publisher’s Note: MDPI stays neutral with regard to jurisdictional claims in published maps and institutional affiliations. |
© 2022 by the authors. Licensee MDPI, Basel, Switzerland. This article is an open access article distributed under the terms and conditions of the Creative Commons Attribution (CC BY) license (https://creativecommons.org/licenses/by/4.0/).
Share and Cite
Li, W.; Zhu, D.; Shao, W.; Jiang, D. Modeling of Internal Geometric Variability and Statistical Property Prediction of Braided Composites. Materials 2022, 15, 5332. https://doi.org/10.3390/ma15155332
Li W, Zhu D, Shao W, Jiang D. Modeling of Internal Geometric Variability and Statistical Property Prediction of Braided Composites. Materials. 2022; 15(15):5332. https://doi.org/10.3390/ma15155332
Chicago/Turabian StyleLi, Wenli, Donghui Zhu, Wenqi Shao, and Dong Jiang. 2022. "Modeling of Internal Geometric Variability and Statistical Property Prediction of Braided Composites" Materials 15, no. 15: 5332. https://doi.org/10.3390/ma15155332
APA StyleLi, W., Zhu, D., Shao, W., & Jiang, D. (2022). Modeling of Internal Geometric Variability and Statistical Property Prediction of Braided Composites. Materials, 15(15), 5332. https://doi.org/10.3390/ma15155332