Article

Tunable Luminescence and Energy Transfer of Sr3B2O6:Ce3+, Sm3+ Phosphors with Potential Anti-Counterfeiting Applications

MOE Key Laboratory of Bioinorganic and Synthetic Chemistry, KLGHEI of Environment and Energy Chemistry, School of Chemistry, Sun Yat-sen University, Guangzhou 510006, China
*
Author to whom correspondence should be addressed.
Materials 2022, 15(15), 5189; https://doi.org/10.3390/ma15155189
Submission received: 1 July 2022 / Revised: 19 July 2022 / Accepted: 22 July 2022 / Published: 26 July 2022
(This article belongs to the Special Issue Glasses and Ceramics for Luminescence Applications)

Abstract

:
Sm3+ and Ce3+ singly doped and Sm3+ and Ce3+ co-doped Sr3B2O6 phosphors are prepared via a high-temperature solid-state reaction method. The crystal structure and phase purity are characterized by X-ray diffraction (XRD) analyses. The Sm3+-doped sample displays an emission in the orange-red region, with the strongest emission line at about 648 nm and possessing a good luminescence thermal stability between 78 and 500 K. With the increase in the Sm3+ content, the concentration quenching is observed due to the cross-relaxation (CR) processes among the Sm3+ ions. Upon 340 nm excitation, the Ce3+-doped phosphor presents a broad emission band in the blue region with a maximum at about 420 nm, which overlaps well with the 6H5/26P3/2 excitation line of Sm3+ and implies the possible energy transfer from Ce3+ to Sm3+. The spectral and decay measurements of the Ce3+ and Sm3+ co-doped samples are conducted and the Inokuti–Hirayama (I-H) model is adopted to analyze the luminescence decay dynamics of the donor Ce3+. Owing to the evident sensitization of the Sm3+ by the Ce3+ ions, the co-doped samples exhibit color variation under different wavelength excitations, endowing them with potential applications in optical anti-counterfeiting.

1. Introduction

Lanthanide-activated luminescence materials with stimuli-responsive emission outputs have attracted increasing attention due to their potential applications in optical anti-counterfeiting and information security fields [1,2,3,4,5,6]. To pursue the superior performances of feasibility and reliability for applications, there is a necessity for the constant exploration of novel phosphors with an easy trigger and an abundant color evolution. Recently, the excitation-wavelength-responsive lanthanide-activated phosphors including upconversion [1] and downshifted phosphors [2] have emerged as important alternatives owing to the feature of a convenient excitation trigger [7,8], when compared to other stimuli methods such as temperature [9], pressure [10], and so on. With the merit of high emission efficiency, the downshifted lanthanide-activated phosphors significantly promote the performances of optical anti-counterfeiting and information security applications. To further expand their color evolution range with the trigger of excitation wavelength, a feasible way is by simply co-doping two or more different lanthanide ions with distinct emission colors into a suitable host compound. Thus, the emission color and the excitation wavelength may be tuned and expanded by virtue of the possible energy transfer among these lanthanide ions.
Sm3+ ions usually display strong 4f-4f absorption lines at about 400 nm in most compounds, which match well with the commercially available light-emitting diode (LED) chips. Meanwhile, Sm3+-doped phosphors usually exhibit an intense emission in the orange-red region. Therefore, it is easy to achieve monochromatic anti-counterfeiting with a commercial 400 nm LED chip by choosing Sm3+ ions as activators.
In addition, the energy of the parity-allowed 4f-5d transition of Ce3+ is evidently affected by the host crystal field and electron–phonon coupling, due to its outer-lying 5d orbitals. The emission of Ce3+ is found to vary from UV to the red region [11,12,13] in different types of host compounds. It can be deduced that if Ce3+ ions display a blue-violet emission around 400 nm in a well-selected host compound, then Ce3+–Sm3+ energy transfer (ET) may occur, and it is possible to realize a wide range of luminescence tuning from a blue-violet emission of Ce3+ to an orange-red emission of Sm3+ under different excitation conditions, by utilizing their different emission colors and the potential ET effect.
Based on the above considerations, we chose Sr3B2O6 (abbreviated as SBO hereafter) as a host compound in this paper due to its simple synthesis condition, good physicochemical stability [14] and one kind of Sr2+ site for lanthanide occupation. The influence of temperature and concentration on Sm3+ luminescence and the energy transfer dynamics between the Ce3+ and the Sm3+ in the SBO host were studied. The results reveal the emission color-tunability of the co-doped samples upon different excitation wavelengths and demonstrate their potential applications in optical anti-counterfeiting. This work provides a simple strategy and a candidate material towards excitation-wavelength-responsive optical anti-counterfeiting.

2. Materials and Methods

A series of Sm3+ and Ce3+ singly doped (Sr3−2xSmxNaxB2O6, x = 0.005, 0.01, 0.02, 0.03, 0.05, 0.10, SBO:xSm3+; Sr2.98Ce0.01Na0.01B2O6, SBO:0.01Ce3+) and Ce3+ and Sm3+ co-doped samples (Sr2.98−2yCe0.01SmyNa0.01+yB2O6, y = 0.005, 0.01, 0.02, 0.03, 0.05, 0.10, SBO:0.01Ce3+, ySm3+) were prepared via a high-temperature solid-state reaction method using SrCO3 (Analytical Reagent, A. R.), H3BO3 (A. R.), Na2CO3 (A. R.), Sm2O3 (99.99%) and/or CeO2 (99.99%) with stoichiometric ratios as reactants. The raw materials were fully ground in agate mortars, then transferred into corundum crucibles and heated at 1423 K for 6 h in a reductive H2-N2 (5–95%) ambience. After cooling down to room temperature (RT) naturally in the furnace, the products were re-ground for further characterizations.
The phase purity of the powder samples was checked by X-ray diffraction (XRD) measurements on a RIGAKU D-MAX 2200 VPC X-ray diffractometer (Tokyo, Japan) with Cu Kα radiation (λ = 1.5418 Å) at an operating condition of 40 kV and 26 mA. The XRD data were collected over a 2θ range of 10–80° with a scanning rate of 10°/min. The high-quality XRD data of the SBO:0.005Sm3+ for Rietveld refinement were recorded over a 2θ range from 10° to 110° at an interval of 0.02° using a Bruker D8 ADVANCE X-ray diffractometer (Billerica, MA, USA) with Cu Kα radiation (λ = 1.5418 Å) at 35 kV and 35 mA. Rietveld refinement was performed with the TOPAS-academic V4.1 program [15]. The morphology of the SBO:0.005Sm3+ sample was characterized with an FEI Quanta 400 FEG scanning electron microscope (SEM) (Lincoln, NE, USA). The photoluminescence (PL) spectra and luminescence decay curves at RT and varied temperatures were measured on an Edinburgh FLS 1000 combined spectrometer equipped with a PMT detector (Livingston, UK). A 450 W Xe900 xenon lamp was used as an excitation source of steady-state PL measurements; a 340 nm pulsed light-emitting diode (EPLED, Edinburgh Instruments) was used to collect the luminescence decay curves of Ce3+, while a 60 W μF900 flash lamp with a pulse width of 1.5–3.0 μs and a pulse repetition rate of 20 Hz was used to record the luminescence decay curves of the Sm3+ in a microsecond range. The temperature-dependent luminescence measurements in 78–500 K were performed with an Oxford Optistat DN cryostat (Abingdon, UK), and the sample temperature was controlled by a MercuryiTC temperature controller. Sample images upon UV excitation were taken with an Apple iPhone 8 Plus mobile phone at a normal condition.

3. Results and Discussion

3.1. Crystal Structure, Morphology and Phase Purity

The SBO crystallizes in a trigonal system with a space group of R-3c (No. 167) [16]. There is only one kind of Sr2+ site in the SBO, which coordinates with eight oxygen ions to form a dodecahedron geometry with C2 symmetry, as shown in Figure 1a. Each B3+ ion coordinates with three oxygen ions to form a [BO3]3− planar triangle. Due to the similar ion radii of Sr2+ and lanthanide dopants, as well as the charge compensator Na+ (coordination number, C. N. = 8, r(Sr2+) = ~1.26 Å, r(Ce3+) = ~1.14 Å, r(Sm3+) = ~1.08 Å, r(Na+) = ~1.18 Å) [17], the Ce3+, Sm3+ and Na+ ions are expected to occupy the Sr2+ sites. Rietveld refinement of the SBO:0.005Sm3+ sample is performed and shown in Figure 1b. The values of Rp (~6.58%), Rwp (~4.66%) and RB (~3.50%) indicate a reliable refinement result. The refined lattice parameters are a = b = 9.044(1) Å, c = 12.572(1) Å, γ = 120°, V = 890.6(1) Å3 and Z = 6, and other related parameters are listed in Table 1. The average Sr2+/Sm3+-O2− bond length is about 2.634(4) Å, while the adjacent distance of the nearest Sr2+ ions is evaluated at about 3.594 Å. Figure 1c display the SEM image of the SBO:0.005Sm3+ sample. Agglomerate particles with irregular shapes and an average size of several microns are observed. Some representative XRD patterns of the host compound and the singly or doubly doped samples are displayed in Figure 1d. The patterns of the un-doped host and doped samples match well with that of the theoretical result calculated with the Crystallographic Information File (CIF) of the SBO [16]. Furthermore, the lattice parameters of the representative samples are also calculated via Rietveld refinement as tabulated in Table 2. They clearly show the lattice shrinkages with different degrees, which depends on the doping ionic size and concentration. These results imply the successful doping of lanthanides into the SBO host lattice.

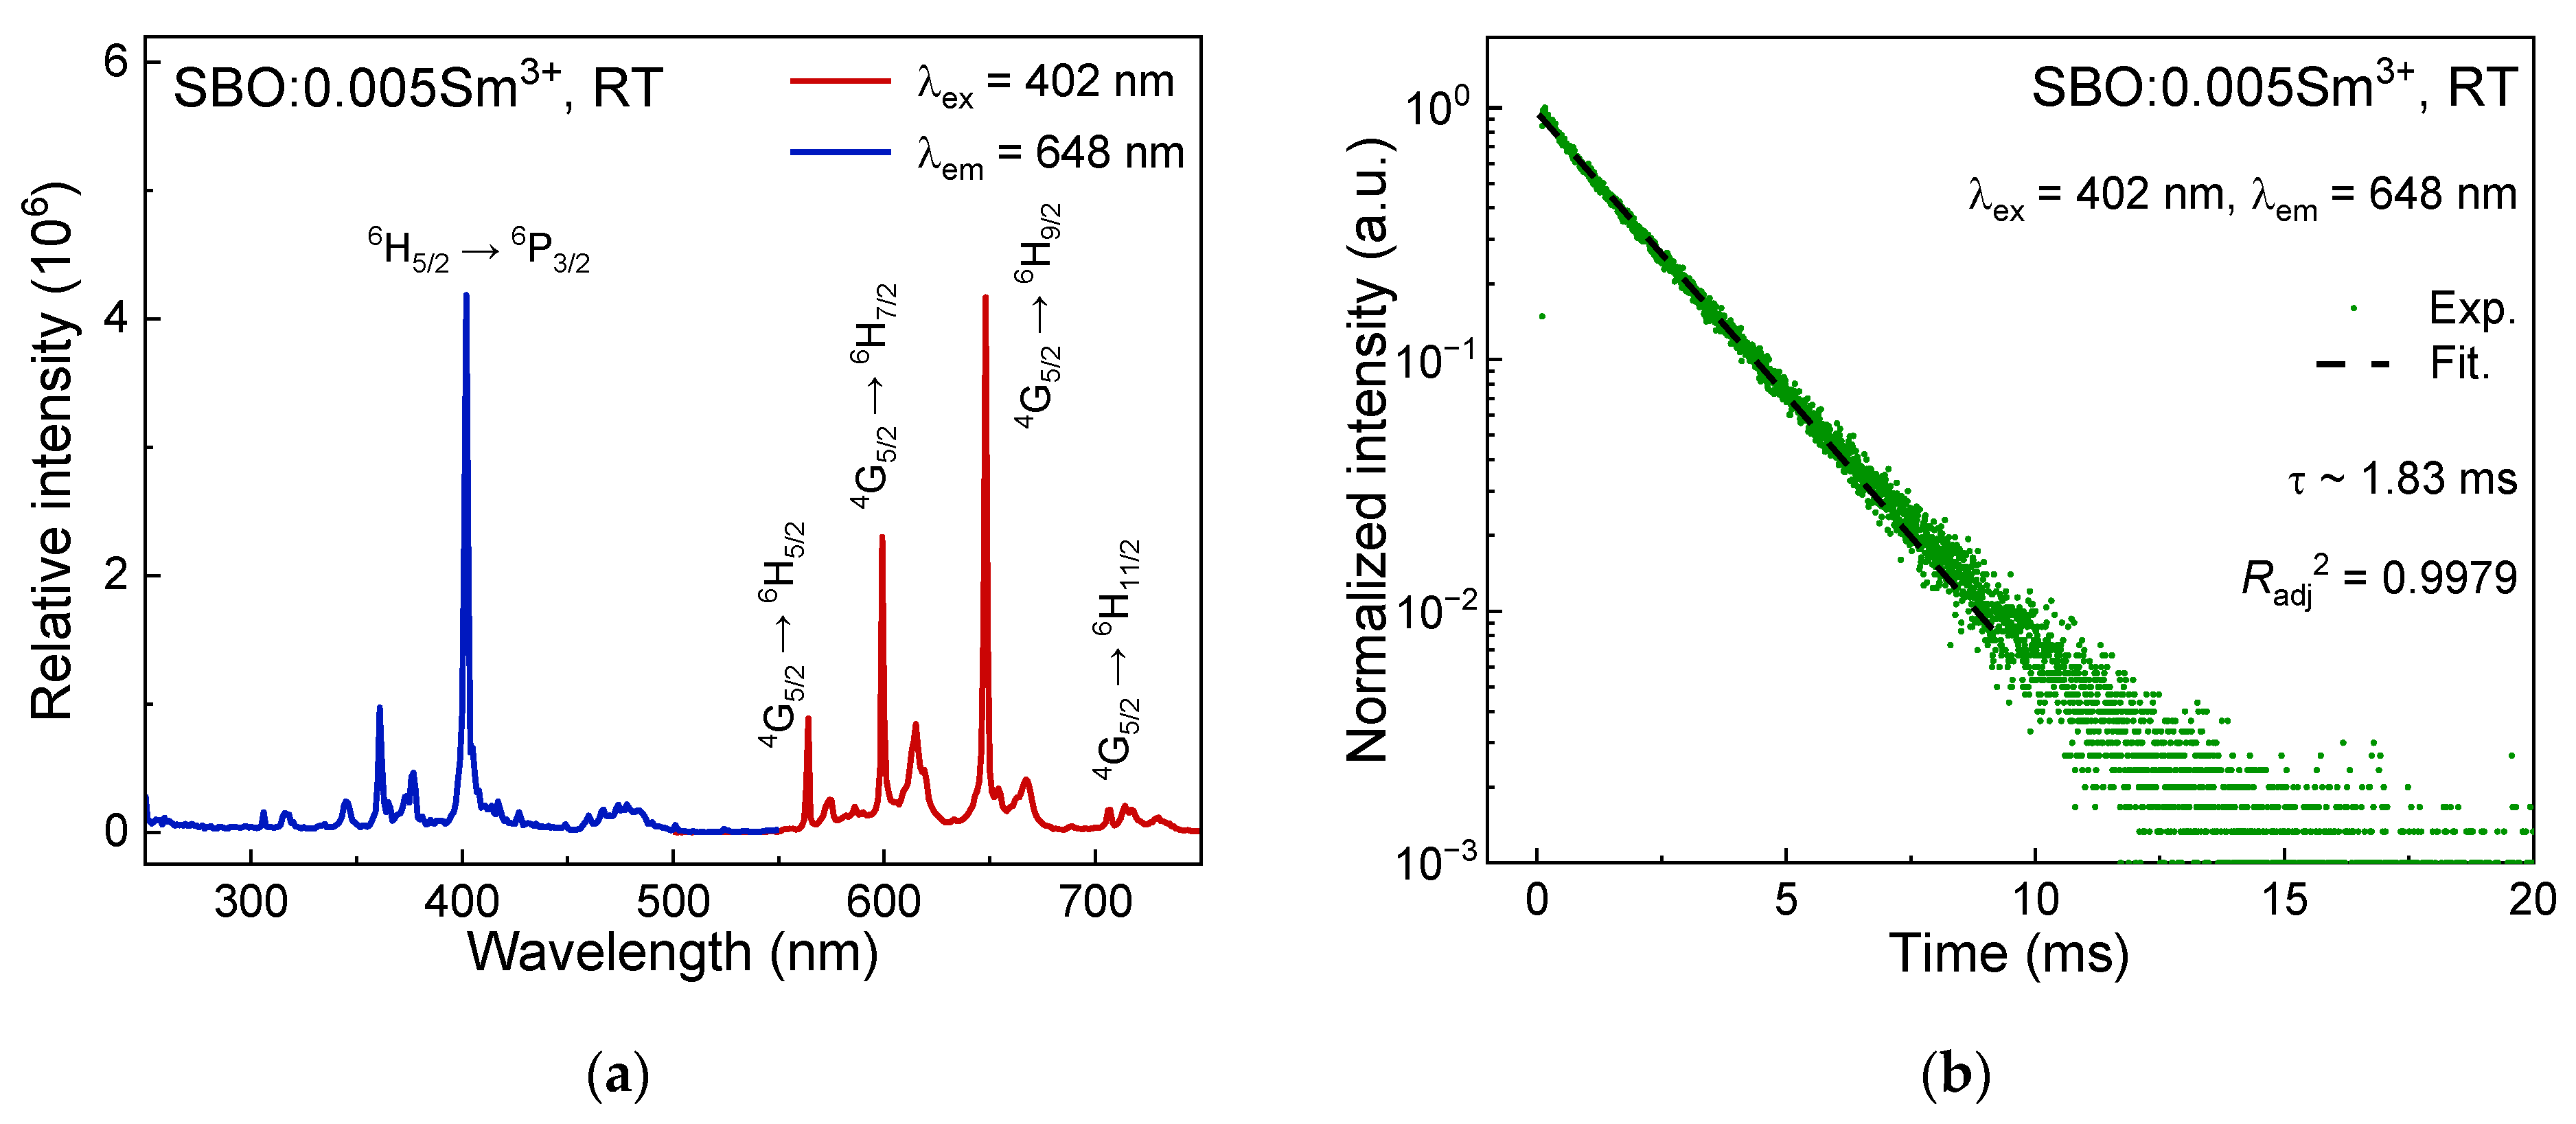
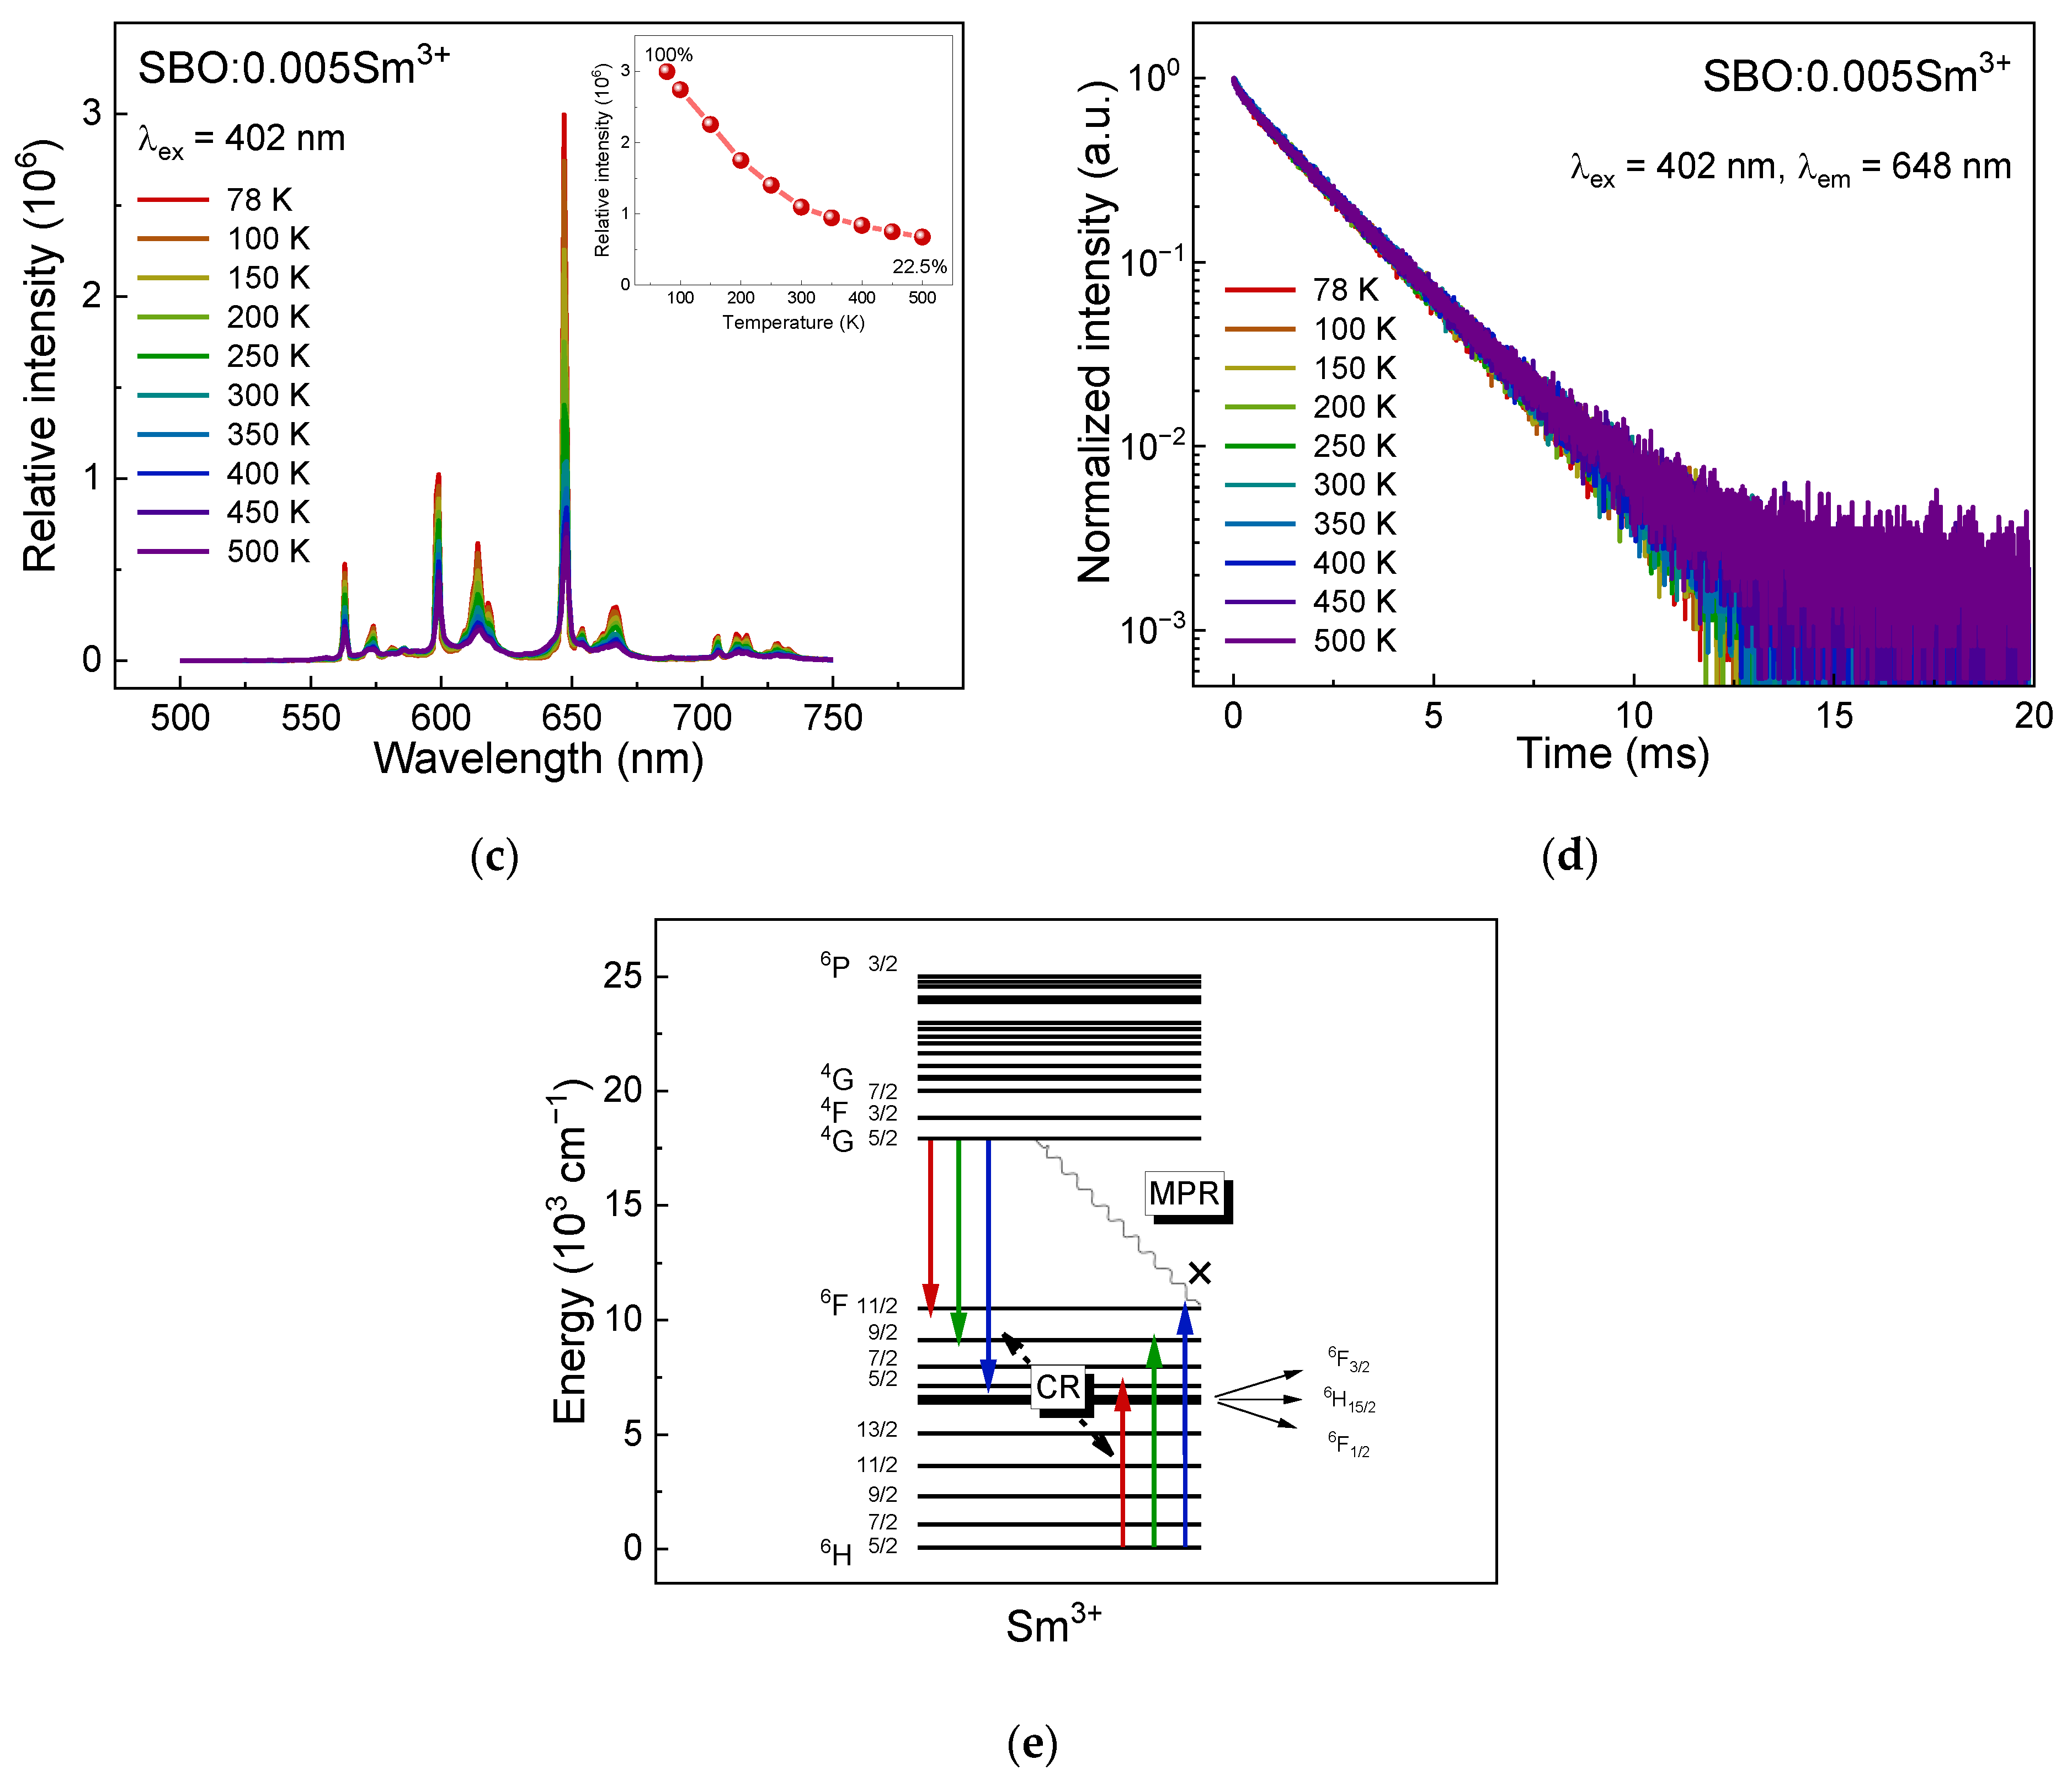
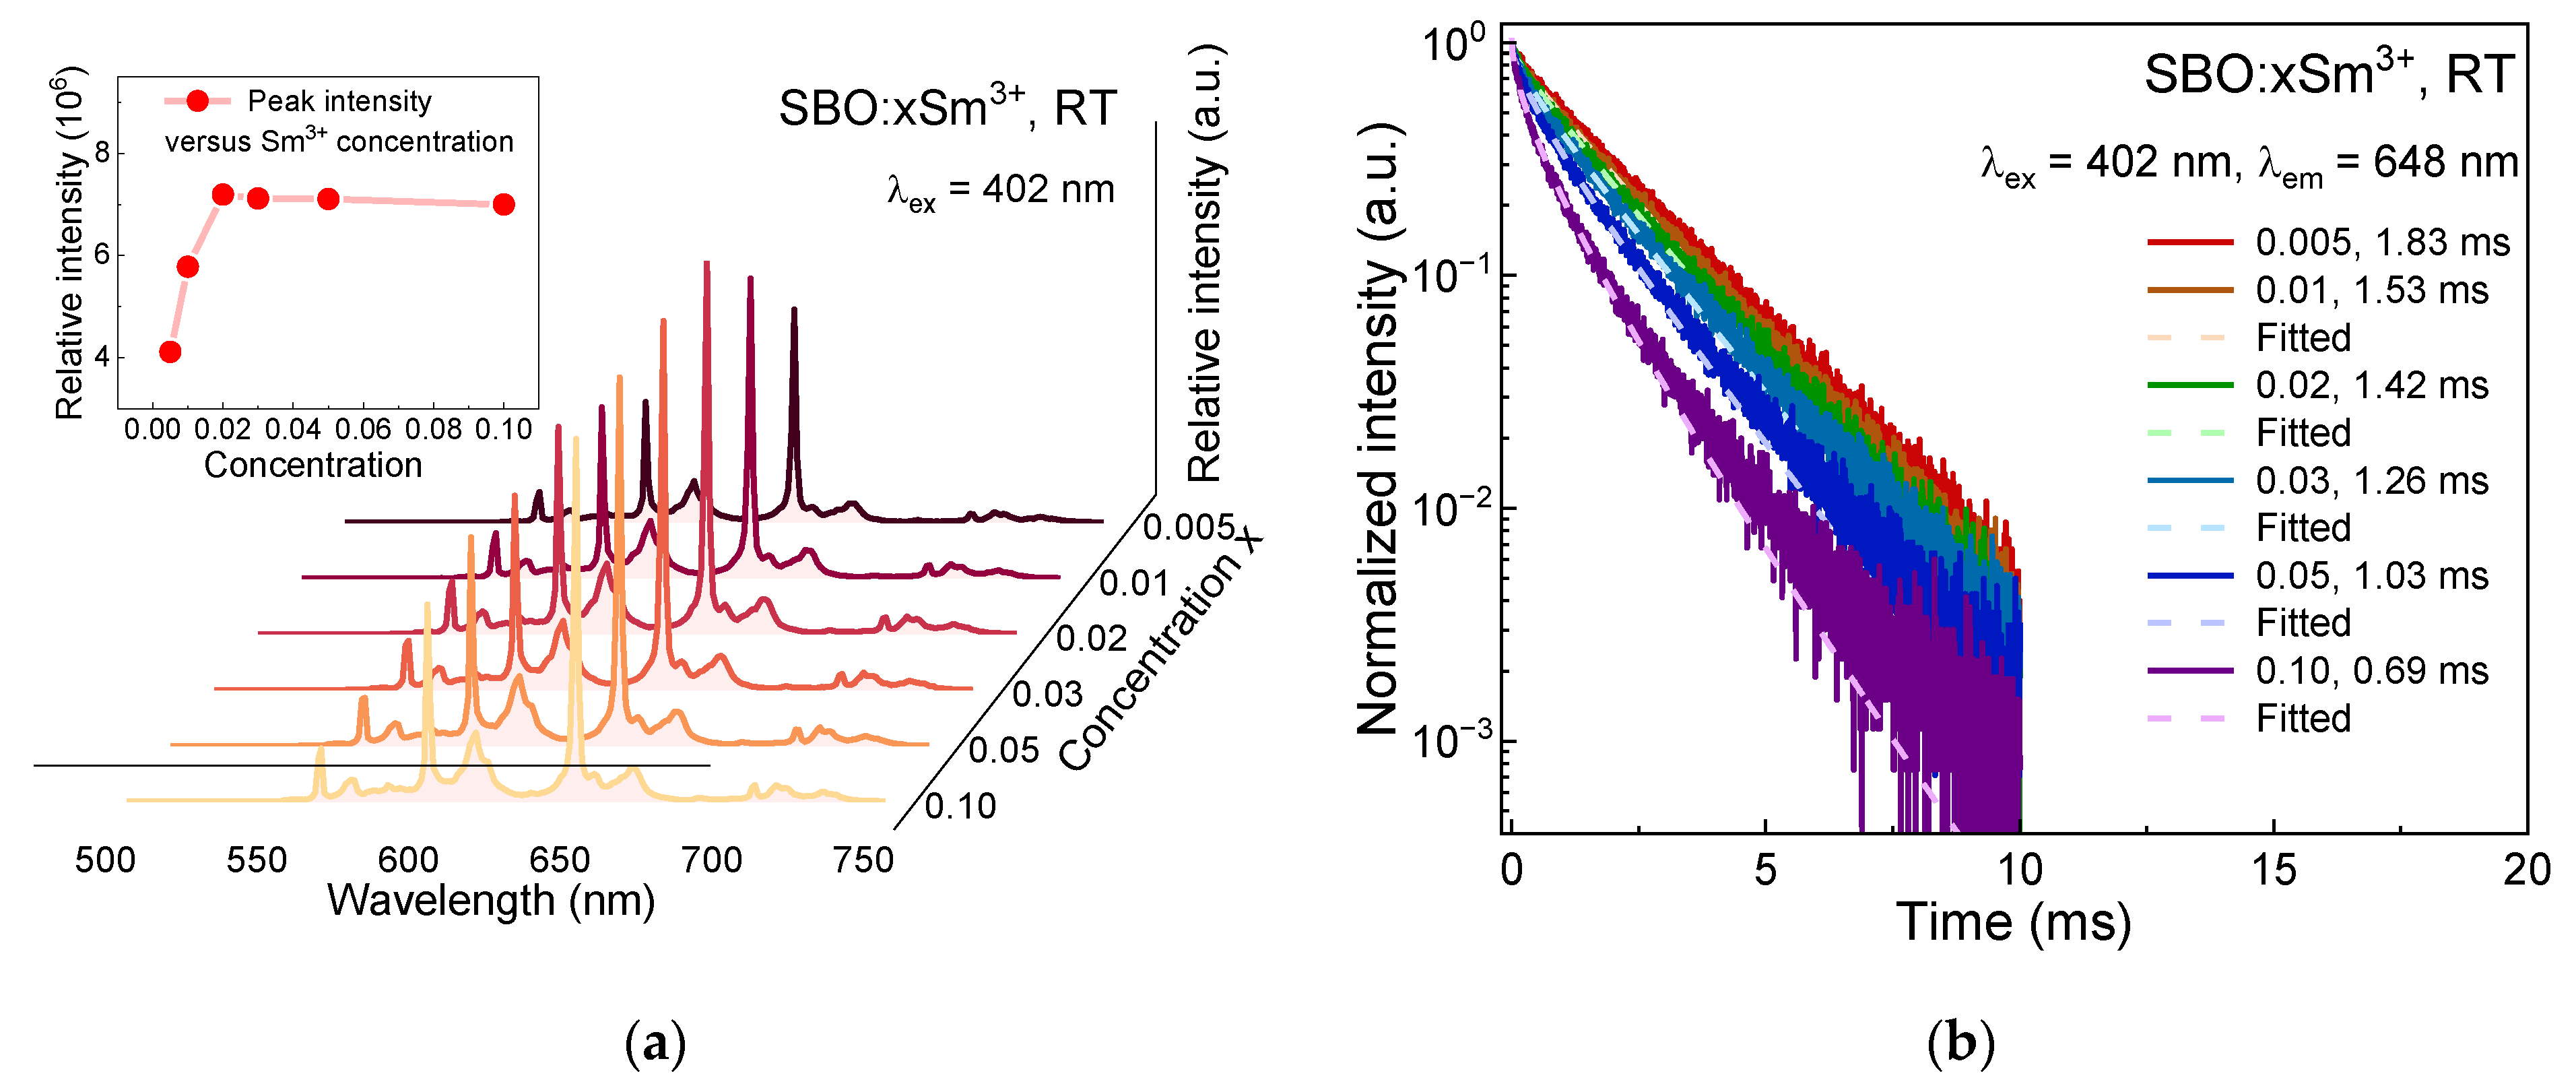
3.2. Luminescence Properties of Sm3+ in SBO Host

Figure 2a displays the excitation and emission spectra of the SBO:0.005Sm3+ at RT. When monitoring the emission wavelength at 648 nm, some sharp line-like excitation peaks can be observed in the range of 250–480 nm, which are attributed to the transitions from the 6H5/2 ground state to higher 4f levels of Sm3+. The dominant peak at about 402 nm is assigned to the 6H5/26P3/2 transition of the Sm3+ ion [18]. Upon 402 nm excitation, one can identify about three relatively intensive sharp peaks in the emission spectra in Figure 2a, which can be aligned as 4G5/26HJ transitions of the Sm3+ for J = 5/2 (~564 nm), 7/2 (~599 nm) and 9/2 (~648 nm), respectively [19]. The strongest emission peak of the Sm3+ in our case is located at 648 nm originating from the 4G5/26H9/2 electric–dipole transition, similar to the results in YVO4 [20,21], Sr2CaMoO6 [22] and Ca2GdNbO6 [23] with asymmetric cationic environments, but is different with some cases where the Sm3+ sits at high-symmetrical sites [24,25,26]. The luminescence of the SBO:0.005Sm3+ displays exponential decay with a lifetime of about 1.83 ms, as shown in Figure 2b.
In order to study the temperature-related luminescence properties of Sm3+, we measured the emission spectra as well as the decay curves of the SBO:0.005Sm3+ at 78–500 K as given in Figure 2c,d. The spectral profiles at different temperatures nearly remain identical, although a slight thermal broadening is observed. The peak intensity (relative height) at 648 nm in the inset of Figure 2c shows a decline from 78 to 500 K, where the peak intensity at 500 K remains at 22.5% of that at 78 K. However, the overlapped exponential decay curves in Figure 2d manifest the good thermal stability of the Sm3+ 4f-4f luminescence. The discrepancy between the results obtained from luminescence intensity and luminescence decay measurements is mainly due to the complicated factors attributed to the spectral measurements, such as the temperature-dependence of absorption strength, energy migration and reabsorption [27]. Decay measurement seems to provide a more reasonable insight into the thermal-quenching behavior. The thermal quenching of Sm3+ is mainly related to the multi-phonon relaxation (MPR) process [28] where several phonons synergistically depopulate the higher-lying excited electrons of the Sm3+, as depicted in Figure 2e. The MPR process of Sm3+ depends on the energy gap (ΔE) between 4G5/2 and 6F11/2 (~7400 cm−1), as well as the effective phonon energy (ℏω ~ 900 cm−1 in Sr3B2O6 in [29]. The number of phonons (p) is derived by p = ΔE/ℏω. The good thermal stability of Sm3+ in our case indicates the ineffective MPR process that requires too many phonons (~8) to bridge the energy gap between the two energy levels.
The concentration-dependent emission spectra of the SBO:xSm3+ (x = 0.005, 0.01, 0.02, 0.03, 0.05, 0.10) are presented in Figure 3a. The emission profile does not change with increasing dopants, while the intensity comes to a maximum when x = 0.02 and slightly decreases above this concentration as shown in the inset. The luminescence decay curves of the SBO:xSm3+ are also measured and shown in Figure 3b. At a low concentration (x = 0.005, 0.01), the decay curves stay mono-exponential but they deviate gradually from the exponential form at higher concentrations, indicating that concentration quenching happens in the concentrated samples. The average lifetime values of the samples are then obtained via the following equation [30]:
τ = 0 I ( t ) I ( 0 ) d t
where I(0) and I(t) denote the luminescence intensity when time is 0 and t, respectively. The average lifetime values are listed in the legend of Figure 3b and are shortened with the increase of the Sm3+ concentration. When dopants increase, the Sm3+-Sm3+ interaction distance is shortened, and the dense energy levels of the Sm3+ endow them with some resonant non-radiative channels to quench the luminescence of the Sm3+ via a cross-relaxation (CR) process. Some CR channels of the Sm3+, such as [4G5/2, 6H5/2] → [6F11/2, 6F5/2], [4G5/2, 6H5/2] → [6F5/2, 6F11/2], [4G5/2, 6H5/2] → [6F9/2, 6F9/2], and so on, have been reported and schematized in Figure 2e [22,24,31,32].
To further study the CR mechanism of Sm3+ in the SBO host, we applied the Inokuti–Hirayama (I-H) model to analyze the luminescence decay curves of the Sm3+-doped samples as shown in the following equation [33]:
I ( t ) I ( 0 ) = e x p [ ( t τ 0 ) 4 π 3 C A Γ ( 1 3 S ) ( C DA ) 3 / S t 3 / S ]
where I(t) denotes the intensity at a given time t, I(0) is the initial intensity, τ0 is the intrinsic lifetime of Sm3+ (~1.83 ms), and CA is doping concentration of Sm3+. CDA is the ET microparameter. Γ(x) is the gamma function and S expresses the multipolar interaction (6 for electric dipole-dipole (EDD) interaction, 8 for electric dipole-quadrupole (EDQ) and 10 for electric quadrupole-quadrupole (EQQ)). The energy transfer probability PDA can be expressed with the following equation:
P DA = C DA ( S ) / R S
where R is denoted as the distance between ions. When PDA = 1/τ0, where the ET rate of donor ion equals to its own radiation rate, the obtained R is defined as ET critical distance (Rc). The fitted results are compiled in Table 3. When S is set to be 6, the best fitting quality can be obtained, indicating that the main interaction type of CR in Sm3+ ions is EDD interaction, similar to the result in [34,35]. The averaged CDA value is ~3.730 × 10−53 m6/s, and the corresponding Rc is calculated to be about 6.40 Å.

3.3. Luminescence Properties of SBO:0.01Ce3+ Sample

Figure 4a shows the highest-height normalized excitation and emission spectra of a diluted sample SBO:0.01Ce3+ at RT. Monitoring 420 nm emission, one can observe three broad bands over a range of 250–380 nm, which are assigned as the transitions from 4f ground state to 5di (i = 1, 2, 3) excited states of Ce3+ in descending order in wavelength. Upon 340 nm excitation, Ce3+ exhibits a broad emission band with a maximum at ~420 nm, consistent with the reported result in [36,37]. The Commission Internationale de l’Eclairage (CIE) chromaticity coordinates are calculated as (0.157, 0.031), lying in the blue-violet region as shown in the inset of Figure 4a. The luminescence decay curve in Figure 4b displays an exponential feature, and the lifetime of the Ce3+ emission is fitted to be ~38.2 ns.

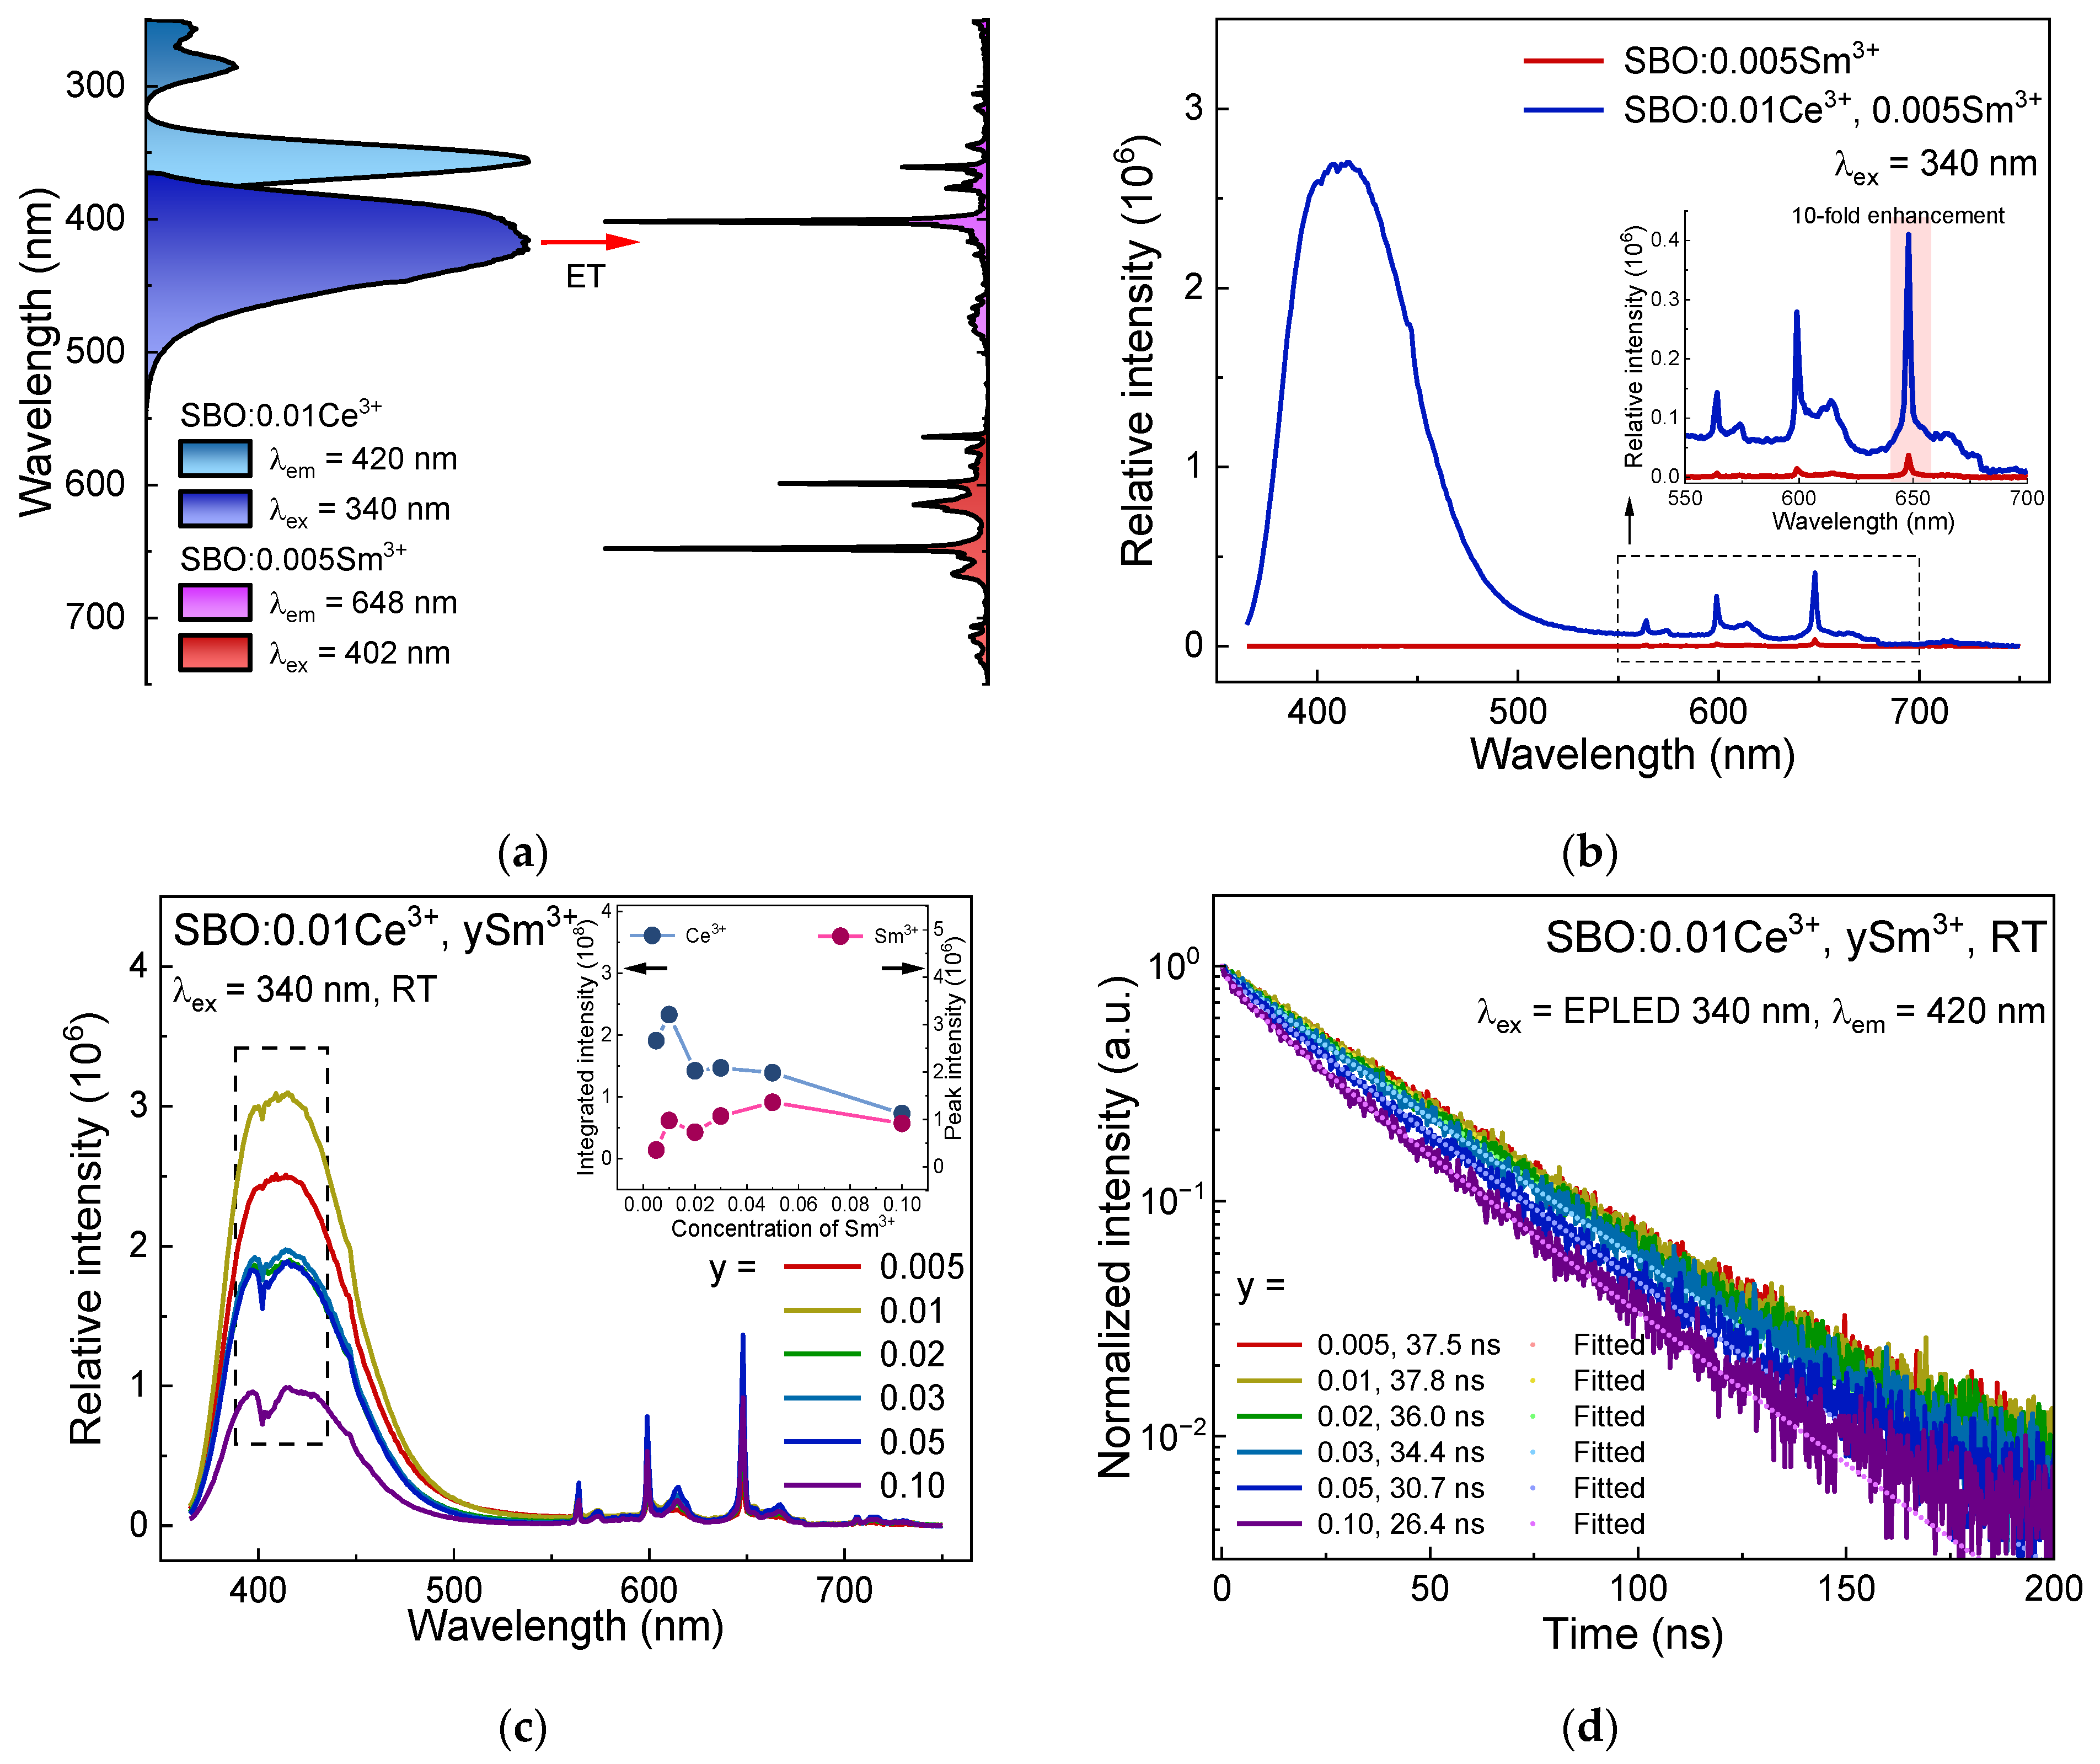
3.4. Luminescence of Sm3+, Ce3+ Co-Doped Samples and Ce3+-Sm3+ ET Dynamics

Figure 5a shows the highest-height normalized excitation and emission spectra of SBO:0.01Ce3+ and SBO:0.005Sm3+ at RT. A spectral overlap of the Ce3+ emission and the Sm3+ excitation over a range of 365–550 nm can be observed, suggesting the possibility of ET from Ce3+ to Sm3+. Figure 5b displays the spectral difference of the Sm3+ singly doped and the Ce3+ and Sm3+ co-doped sample. Upon excitation at 340 nm where Ce3+ can be efficiently excited but the absorption of Sm3+ is very weak, the Sm3+ singly doped sample has a similar emission spectrum, but an evidently weaker signal compared to that in Figure 2a. In the Ce3+ and Sm3+ co-doped case, both the emission of Ce3+ and Sm3+ can be observed. Under 340 nm excitation, the intensity of Sm3+ shows a 10-fold enhancement compared to the singly doped one, indicating the ET from Ce3+ to Sm3+ greatly sensitizes the luminescence of Sm3+.
When further increasing the Sm3+ concentration in the SBO:0.01Ce3+, ySm3+ (y = 0.005–0.10) samples, Ce3+ emission decreases with increasing y values except for the outlier SBO:0.01Ce3+, 0.01Sm3+, which may be due to an experimental error, as shown in Figure 5c. One can also notice that there is a V-shaped notch in the Ce3+ emission spectra at 402 nm, as marked with a dashed rectangle because of the absorption of Sm3+ [18]. The reduction in Ce3+ intensity is mainly due to the ET from Ce3+ to Sm3+. This can be also confirmed by the Ce3+ decay curves in Figure 5d after ruling out the concentration quenching of Ce3+ in the SBO host, which was studied in our previous work [37].
The Sm3+ emission intensity in Figure 5c shows an increase when y = 0.005–0.05, and then decreases. Two opposite effects, the Ce3+-Sm3+ ET and the Sm3+-Sm3+ CR, jointly affect the luminescence intensity of Sm3+ in the co-doped samples. The ET enhances the Sm3+ luminescence while the CR weakens it. At low concentrations, the ET effect plays a more important role, so the Sm3+ emission intensity increases with the increasing doping contents. Then, the CR becomes dominant in highly-doped samples where the ET seems insufficient to offset the CR, thus leading to a decline in Sm3+ emission. The luminescence decay curves of Ce3+ in co-doped samples (Figure 5d) gradually deviate from exponential, and their average lifetime values obtained via Equation (1) are also shortened from 37.5 ns (y = 0.005) to 26.4 ns (y = 0.10) (see the legends in Figure 5d), indicating that the ET from Ce3+ to Sm3+ accelerates the depopulation process of the Ce3+ excited electrons. The I-H model is also utilized to analyze the decay properties of the Ce3+. The fitted result and relevant parameters are displayed in Figure 5d and Table 4. When S is set to be 6, we obtain the best fitting, showing that the main multipolar interaction in the Ce3+-Sm3+ ET process is EDD type [38,39]. The average CDA in the Ce3+-Sm3+ ET process is ~2.268 × 10−49 m6/s.

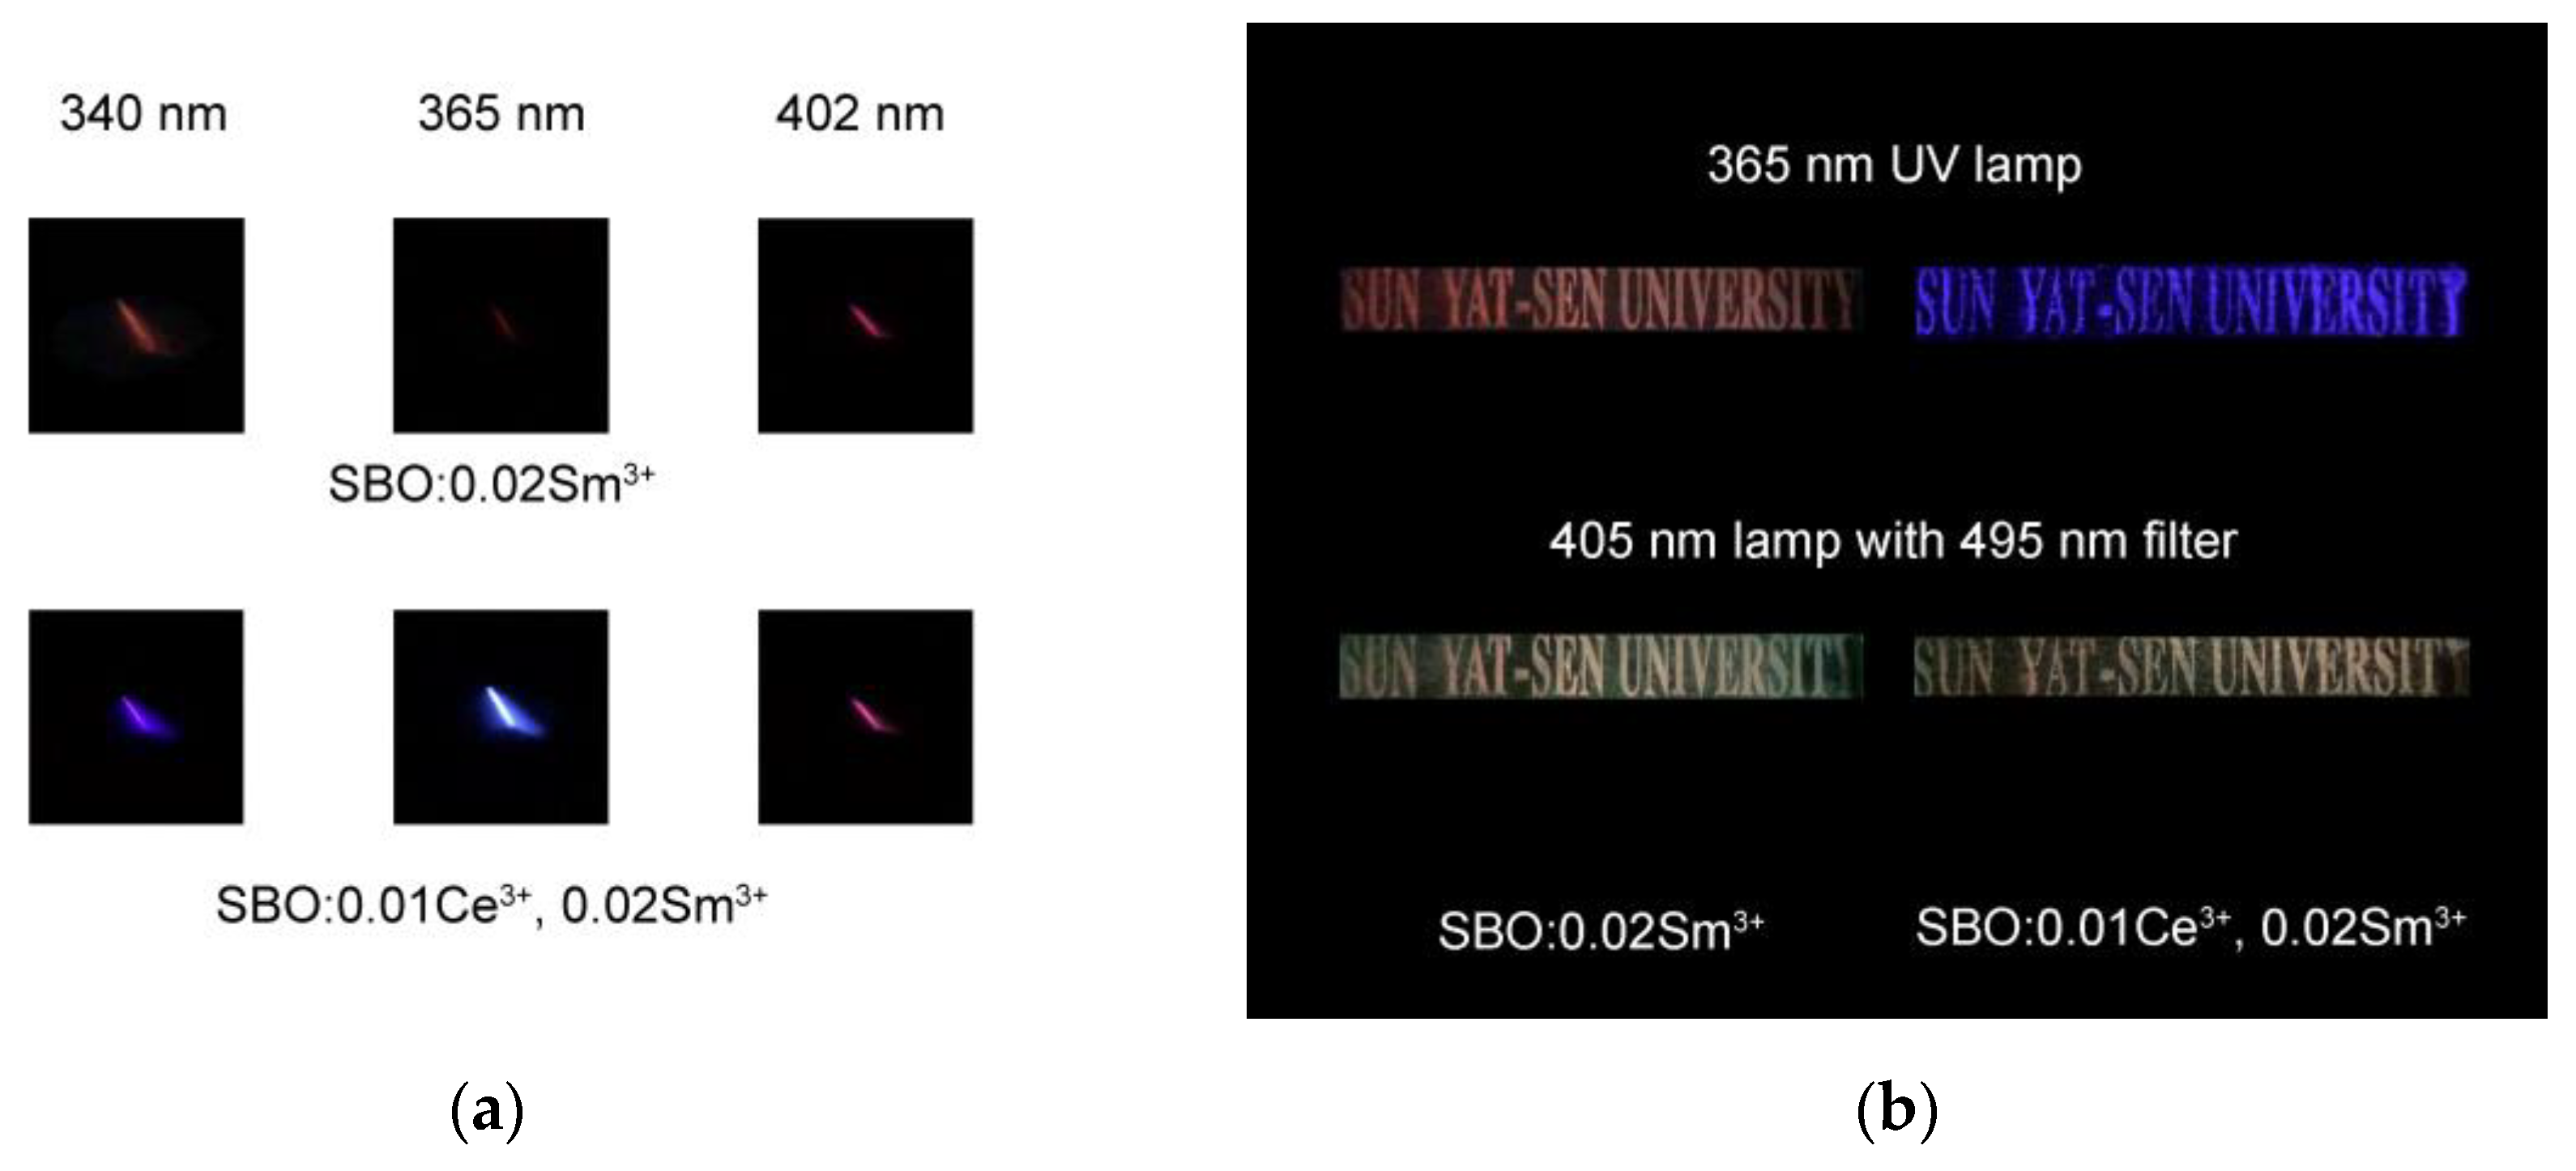
3.5. Color Variation under Different Excitation Conditions of Samples and Their Potential Anti-Counterfeiting Applications

With the distinguished emission colors of the Ce3+ and the Sm3+ as well as their ET effect, color variation under different excitation wavelengths in the co-doped samples can be anticipated. Figure 6a exhibits luminescent images of the SBO:0.02Sm3+ and the SBO:0.01Ce3+, 0.02Sm3+ upon 340, 365 and 402 nm excitation of xenon lamp at RT. Monochromatic emission from Sm3+ is observed in the SBO:0.02Sm3+ sample with different excitation wavelengths. For the SBO:0.01Ce3+,0.02Sm3+ sample, one can observe a color evolution from violet-blue, sky-blue to orange-reddish color under 340, 365 and 402 nm excitation, respectively. At 340 and 365 nm excitation, Ce3+ can be efficiently excited and the Sm3+ orange-reddish emission can be greatly enhanced in virtue of the ET. Hence, the sample display is a mixed color of Ce3+ and Sm3+. When exciting at 402 nm where Sm3+ has a strong excitation peak but Ce3+ shows no absorption, only the characteristic red emission of Sm3+ is observed. The color tunability of the co-doped samples upon different excitation conditions may be applied in optical anti-counterfeiting. Figure 6b shows the anti-counterfeiting application demonstration using the SBO:0.02Sm3+ and the SBO:0.01Ce3+, 0.02Sm3+ samples. A patterned quartz glass substrate was first prepared via a laser printing and corrosion procedure, as introduced in our previous works [40,41]. The corresponding sample powders are filled into the substrate to form the pattern. Upon 365 nm commercial UV lamp excitation, the two samples display a red and violet-blue pattern of “SUN YAT-SEN UNIVERSITY”, respectively, resembling the result in Figure 6a. Furthermore, when we used a commercial 405 nm LED lamp and a 495 nm filter to eliminate the intensive excitation light, and both the two samples exhibited an orange-reddish pattern originating from the Sm3+ luminescence. These results manifest their potential applications in optical anti-counterfeiting.

4. Conclusions

The Sm3+ and Ce3+ singly doped and Sm3+ and Ce3+ co-doped SBO samples were prepared via a conventional high-temperature solid-state reaction method. XRD patterns of the doped samples reveal their single phase of the SBO. Upon 402 nm excitation, the Sm3+ singly doped sample exhibits an orange-reddish emission at about 648 nm, which is assigned as the 4G5/26F9/2 transition and possesses a radiative lifetime of ~1.83 ms. The Sm3+ luminescence maintains good thermal stability up to 500 K with identical temperature-dependent decay curves. Concentration quenching occurs in samples with high dopants, which is due to the CR process of Sm3+ ions. I-H model analysis reveals that the main mechanism of the CR is EDD interaction with CDA ~3.730 × 10−53 m6/s and a critical interaction distance of ~6.40 Å. The Ce3+ doped sample SBO:0.01Ce3+ displays a broad emission band in the blue region at ~420 nm with a lifetime of ~38.2 ns. A spectral overlap between Ce3+ emission and Sm3+ excitation is observed, manifesting a possible ET from Ce3+ to Sm3+. Upon 340 nm of the Ce3+ 4f-5d transition in the co-doped samples, the Sm3+ luminescence is remarkably enhanced, and the decay curves of the Ce3+ in co-doped samples deviate from exponential features, which verify the Ce3+-Sm3+ ET. The I-H analysis on decay curves of the Ce3+ luminescence indicates the main EDD interaction type in the ET process from Ce3+ to Sm3+. With tunable luminescence upon different wavelength conditions, the Ce3+ and Sm3+ co-doped SBO samples are regarded as promising candidates for optical anti-counterfeiting.

Author Contributions

Conceptualization, Y.O. and H.L.; formal analysis, Y.O. and J.W.; investigation, Y.O. and J.W.; writing—original draft preparation, Y.O.; writing—review and editing, Y.O., J.W. and H.L.; visualization, Y.O.; supervision, H.L.; funding acquisition, H.L. All authors have read and agreed to the published version of the manuscript.

Funding

This research was funded by the National Natural Science Foundation of China (grant number 22171290, 52161135110) and the National Natural Science Foundation of Guangdong Province (grant number 2022A1515011376).

Institutional Review Board Statement

Not applicable.

Informed Consent Statement

Not applicable.

Data Availability Statement

Data sharing is not applicable to this article.

Conflicts of Interest

The authors declare no conflict of interest.

References

  1. Lu, Y.; Zhao, J.; Zhang, R.; Liu, Y.; Liu, D.; Goldys, E.M.; Yang, X.; Xi, P.; Sunna, A.; Lu, J.; et al. Tunable lifetime multiplexing using luminescent nanocrystals. Nat. Photon. 2014, 8, 32–36. [Google Scholar] [CrossRef] [Green Version]
  2. Zhang, J.-C.; Pan, C.; Zhu, Y.-F.; Zhao, L.-Z.; He, H.-W.; Liu, X.; Qiu, J. Achieving thermo-mechano-opto-responsive bitemporal colorful luminescence via multiplexing of dual lanthanides in piezoelectric particles and its multidimensional anticounterfeiting. Adv. Mater. 2018, 30, 1804644. [Google Scholar] [CrossRef]
  3. Feng, A.; Smet, P.F. A review of mechanoluminescence in inorganic solids: Compounds, mechanisms, models and applications. Materials 2018, 11, 484. [Google Scholar] [CrossRef] [Green Version]
  4. Abdallah, A.; Freslon, S.; Fan, X.; Rojo, A.; Daiguebonne, C.; Suffren, Y.; Bernot, K.; Calvez, G.; Roisnel, T.; Guillou, O. Lanthanide-based coordination polymers with 1,4-carboxyphenylboronic ligand: Multiemissive compounds for multisensitive luminescent thermometric probes. Inorg. Chem. 2019, 58, 462–475. [Google Scholar] [CrossRef]
  5. Wang, J.; Suffren, Y.; Daiguebonne, C.; Freslon, S.; Bernot, K.; Calvez, G.; Le Pollès, L.; Roiland, C.; Guillou, O. Multi-emissive lanthanide-based coordination polymers for potential application as luminescent bar-codes. Inorg. Chem. 2019, 58, 2659–2668. [Google Scholar] [CrossRef] [PubMed]
  6. de Rohello, E.L.; Suffren, Y.; Merdrignac-Conanec, O.; Guillou, O.; Cheviré, F. Effect of cationic substitutions on the photoluminescence properties of Eu2+ doped SrCN2 prepared by a facile C3N4 based synthetic approach. J. Eur. Ceram. Soc. 2020, 40, 6316–6321. [Google Scholar] [CrossRef]
  7. Tian, S.; Zhang, H.; Yang, X.; Yang, L.; Min, Q.; Ma, H.; Yu, X.; Qiu, J.; Xu, X. A dynamic three-path authenticating model for anti-counterfeiting in a single host of CaAl2Si2O8. Chem. Eng. J. 2021, 412, 128695. [Google Scholar] [CrossRef]
  8. Wu, Y.; Zhao, X.; Zhang, Z.; Xiang, J.; Suo, H.; Guo, C. Dual-mode dichromatic SrBi4Ti4O15: Er3+ emitting phosphor for anti-counterfeiting application. Cerac. Int. 2021, 47, 15067–15072. [Google Scholar] [CrossRef]
  9. Wang, Y.; Lei, L.; Ye, R.; Jia, G.; Hua, Y.; Deng, D.; Xu, S. Integrating positive and negative thermal quenching effect for ultrasensitive ratiometric temperature sensing and anti-counterfeiting. ACS Appl. Mater. Interfaces 2021, 13, 23951–23959. [Google Scholar] [CrossRef]
  10. Lv, S.; Shanmugavelu, B.; Wang, Y.; Mao, Q.; Zhao, Y.; Yu, Y.; Hao, J.; Zhang, Q.; Qiu, J.; Zhou, S. Transition metal doped smart glass with pressure and temperature sensitive luminescence. Adv. Opt. Mater. 2018, 6, 1800881. [Google Scholar] [CrossRef]
  11. Liang, H.; Lin, H.; Zhang, G.; Dorenbos, P.; Su, Q. Luminescence of Ce3+ and Pr3+ doped Sr2Mg(BO3)2 under VUV–UV and X-ray excitation. J. Lumin. 2011, 131, 194–198. [Google Scholar] [CrossRef]
  12. Zhu, Q.-Q.; Wang, L.; Hirosaki, N.; Hao, L.Y.; Xu, X.; Xie, R.-J. Extra-broad band orange-emitting Ce3+-doped Y3Si5N9O phosphor for solid-state lighting: Electronic, crystal structures and luminescence properties. Chem. Mater. 2016, 28, 4829–4839. [Google Scholar] [CrossRef]
  13. Zhou, Y.; Zhuang, W.; Hu, Y.; Liu, R.; Xu, H.; Chen, M.; Liu, Y.; Li, Y.; Zheng, Y.; Chen, G. Cyan-green phosphor (Lu2M)(Al4Si)O12:Ce3+ for high-quality LED lamp: Tunable photoluminescence properties and enhanced thermal stability. Inorg. Chem. 2019, 58, 1492–1500. [Google Scholar] [CrossRef] [PubMed]
  14. Filatov, S.K.; Krzhizhanovskaya, M.G.; Bubnova, R.S.; Shablinskii, A.P.; Belousova, O.L.; Firsova, V.A. Thermal expansion and structural complexity of strontium borates. Struct. Chem. 2016, 27, 1663–1671. [Google Scholar] [CrossRef]
  15. Coelho, A.A. Coelho Software, Version 4; TOPAS Academic: Brisbane, Australia, 2005.
  16. Wei, Z.F.; Chen, X.L.; Wang, F.M.; Li, W.C.; He, M.; Zhang, Y. Phase relations in the ternary system SrO-TiO2-B2O3. J. Alloys Compd. 2001, 327, L10–L13. [Google Scholar] [CrossRef]
  17. Shannon, R.D. Revised effective ionic radii and systematic studies of interatomic distances in halides and chalcogenides. Acta Cryst. 1976, A32, 751–767. [Google Scholar] [CrossRef]
  18. Shi, R.; Xu, J.; Liu, G.; Zhang, X.; Zhou, W.; Pan, F.; Huang, Y.; Tao, Y.; Liang, H. Spectroscopy and luminescence dynamics of Ce3+ and Sm3+ in LiYSiO4. J. Phys. Chem. C 2016, 120, 4529–4537. [Google Scholar] [CrossRef]
  19. Pekgözlü, İ. A novel reddish orange luminescent material Sr3B2O6:Sm3+. J. Appl. Spectrosc. 2019, 85, 1136–1139. [Google Scholar] [CrossRef]
  20. Cavalli, E.; Angiuli, F.; Belletti, A.; Boutinaud, P. Luminescence spectroscopy of YVO4:Ln3+, Bi3+ (Ln3+ = Eu3+, Sm3+, Dy3+). Opt. Mater. 2014, 36, 1642–1648. [Google Scholar] [CrossRef]
  21. Kolesnikov, I.E.; Golyeva, E.V.; Kurochkin, M.A.; Kolesnikov, E.Y.; Lähderanta, E. Concentration series of Sm3+-doped YVO4 nanoparticles: Structural, luminescence and thermal properties. J. Lumin. 2020, 219, 116946. [Google Scholar] [CrossRef]
  22. Wang, L.; Noh, H.M.; Moon, B.K.; Park, S.H.; Kim, K.H.; Shi, J.; Jeong, J.H. Dual-mode luminescence with broad near UV and blue excitation band from Sr2CaMoO6:Sm3+ phosphor for white LEDs. J. Phys. Chem. C 2015, 119, 15512–15525. [Google Scholar] [CrossRef]
  23. Hua, Y.; Yu, J.S. Synthesis and luminescence properties of reddish-orange-emitting Ca2GdNbO6:Sm3+ phosphors with good thermal stability for high CRI white applications. Ceram. Int. 2021, 47, 6059–6067. [Google Scholar] [CrossRef]
  24. Han, B.; Zhang, J.; Li, P.; Shi, H. Photoluminescence properties of novel yellowish orange emitting phosphor KBaBP2O8:Sm3+. Mater. Lett. 2014, 126, 113–115. [Google Scholar] [CrossRef]
  25. Cao, S.; Chen, Q.; Li, Y.; Wu, C.; Xu, J.; Cheng, G.; Gao, F. Novel strategy for the enhancement of anti-counterfeiting ability of photochromic ceramics: Sm3+ doped KSr2Nb5O15 textured ceramics with anisotropic luminescence modulation behavior. J. Eur. Ceram. Soc. 2021, 41, 4924–4933. [Google Scholar] [CrossRef]
  26. Ningombam, G.S.; Singh, N.R.; Ningthoujam, R.S. Controlled synthesis of CaWO4:Sm3+ microsphere particles by a reverse-micelle method and their energy transfer rate in luminescence. Colloid. Surface A 2017, 518, 249–262. [Google Scholar] [CrossRef]
  27. Bachmann, V.; Ronda, C.; Meijerink, A. Temperature quenching of yellow Ce3+ luminescence in YAG:Ce. Chem. Mater. 2009, 21, 2077–2084. [Google Scholar] [CrossRef]
  28. Riseberg, L.A.; Moos, H.W. Multiphonon orbit-lattice relaxation of excited states of rare-earth ions in crystals. Phys. Rev. 1968, 174, 429–438. [Google Scholar] [CrossRef]
  29. Wang, X.; Qi, H.; Li, Y.; Yu, F.; Wang, H.; Chen, F.; Liu, Y.; Wang, Z.; Xu, X.; Zhao, X. Synthesis and characterization of new Sr3(BO3)2 crystal for stimulated Raman scattering applications. Crystals 2017, 7, 125. [Google Scholar] [CrossRef] [Green Version]
  30. Zatryb, G.; Klak, M.M. On the choice of proper average lifetime formula for an ensemble of emitters showing non-single exponential photoluminescence decay. J. Phys. Condens. Matter 2020, 32, 415902. [Google Scholar] [CrossRef]
  31. Zhang, X.; Seo, H.J. Luminescence properties of novel Sm3+, Dy3+ doped LaMoBO6 phosphors. J. Alloys Compd. 2011, 509, 2007–2010. [Google Scholar] [CrossRef]
  32. Suhasini, T.; Kumar, J.S.; Sasikala, T.; Jang, K.; Lee, H.S.; Jayasimhadri, M.; Jeong, J.H.; Yi, S.S.; Moorthy, L.R. Absorption and fluorescence properties of Sm3+ ions in fluoride containing phosphate glasses. Opt. Mater. 2009, 31, 1167–1172. [Google Scholar] [CrossRef]
  33. Inokuti, M.; Hirayama, F. Influence of energy transfer by the exchange mechanism on donor luminescence. J. Chem. Phys. 1965, 43, 1978–1989. [Google Scholar] [CrossRef]
  34. Zhang, Z.; Jiang, X.; Li, Z.; Wu, P.; Xu, S. Interaction of Sm3+ ions in borate glass. J. Lumin. 1988, 40–41, 657–658. [Google Scholar] [CrossRef]
  35. Zhou, W.; Gu, M.; Ou, Y.; Zhang, C.; Zhang, X.; Zhou, L.; Liang, H. Concentration-driven selectivity of energy transfer channels and color tunability in Ba3La(PO4)3:Tb3+, Sm3+ for warm white LEDs. Inorg. Chem. 2017, 56, 7433–7442. [Google Scholar] [CrossRef] [PubMed]
  36. Sekar, S.; Arunkumar, P.; Jeyakumar, D.; Lakshminarasimhan, N. White light emission in alkali metal ion co-doped single host lattice phosphor Sr3B2O6:Ce3+, Eu2+, A+ [A = Li, Na and K]. Ceram. Int. 2015, 41, 497–3501. [Google Scholar] [CrossRef]
  37. Ou, Y.; Zhou, W.; Yang, Y.; Ma, F.; Qi, Z.; Brik, M.G.; Liang, H. Concentration palette enabling temperature-responsive luminescence co-modulations of inorganic phosphors for thermally-triggered security tag. to be submitted.
  38. Wan, Y.; Abudouwufu, T.; Yusufu, T.; He, J.; Sidike, A. Photoluminescence properties and energy transfer of a single-phased white-emitting NaAlSiO4:Ce3+, Sm3+ phosphor. J. Rare Earths 2017, 35, 850–856. [Google Scholar] [CrossRef]
  39. Benrejeb, H.; Soler-Carracedo, K.; Hraiech, S.; Martin, I.R. Photoluminescence and energy transfer studies in Ce3+-Sm3+ co-doped phosphate glasses. J. Lumin. 2022, 241, 118471. [Google Scholar] [CrossRef]
  40. Su, F.; Zhou, W.; Yang, Y.; Ou, Y.; Qi, Z.; Duan, C.-K.; Brik, M.G.; Dorenbos, P.; Liang, H. Structure, luminescence of Eu2+ and Eu3+ in CaMgSi2O6 and their co-existence for the excitation-wavelength/temperature driven colour evolution. Dalton. Trans. 2021, 50, 10050–10058. [Google Scholar] [CrossRef] [PubMed]
  41. Su, F.; Yang, Y.; Ou, Y.; Zhou, W.; Ma, F.; Zhang, J.; Brik, M.G.; Liang, H. Site occupancies, electron-vibration interaction and energy transfer of CaMgSi2O6:Eu2+, Mn2+ phosphors for potential temperature-sensing and anti-counterfeiting applications. Chem. Eur. J. 2022, 28, e202200381. [Google Scholar] [CrossRef] [PubMed]
Figure 1. (a) Crystal structure along c-axis of Sr3B2O6 host as well as [SrO8] polyhedron and [BO3] triangle; (b) Rietveld refinement of SBO:0.005Sm3+ XRD data at RT; (c) Scanning electron microscope (SEM) image of SBO:0.005Sm3+ sample; (d) XRD patterns of some typical samples.
Materials 15 05189 g001
Figure 2. (a) Excitation (λem = 648 nm) and emission spectra (λex = 402 nm) of SBO:0.005Sm3+ at RT; (b) Luminescence decay curve (λex = 402 nm, λem = 648 nm) of SBO:0.005Sm3+ at RT; (c) Temperature-dependent emission spectra (λex = 402 nm) of SBO:0.005Sm3+ from 78 to 500 K; (d) Temperature-dependent decay curves (λex = 402 nm, λem = 648 nm) of SBO:0.005Sm3+; (e) Partial energy levels and non-radiative processes of Sm3+.
Materials 15 05189 g002aMaterials 15 05189 g002b
Figure 3. (a) Concentration-dependent emission spectra (λex = 402 nm) of SBO:0.005Sm3+ at RT, the inset shows the peak intensity at 648 nm as a function of doping concentration; (b) The corresponding concentration-dependent decay curves (λex = 402 nm, λem = 648 nm) and fitted results via Inokuti-Hirayama (I-H) model of SBO:xSm3+ (x = 0.005, 0.01, 0.02, 0.03, 0.05, 0.10) at RT.
Materials 15 05189 g003
Figure 4. (a) The highest-height normalized excitation (λem = 420 nm) and emission (λex = 340 nm) spectra of SBO:0.01Ce3+ at RT. The inset displays the CIE chromaticity coordinates of the sample; (b) Luminescence decay curve (λex = EPLED 340 nm, λem = 420 nm) of SBO:0.01Ce3+ at RT.
Materials 15 05189 g004
Figure 5. (a) Normalized excitation (λem = 420 for Ce3+, 648 nm for Sm3+) and emission spectra (λex = 340 for Ce3+, 402 nm for Sm3+) of SBO:0.01Ce3+ and SBO:0.005Sm3+ at RT; (b) Emission spectra (λex = 340 nm) of SBO:0.01Ce3+ and SBO:0.01Ce3+, 0.005Sm3+ at RT; (c) Emission spectra (λex = 340 nm) of SBO:0.01Ce3+, ySm3+ (y = 0.005, 0.01, 0.02, 0.03, 0.05, 0.10) at RT, the inset display the integrated intensity of Ce3+ emission and peak intensity of Sm3+ emission as a function of y; (d) Luminescence decay curves (λex = EPLED 340 nm, λem = 420 nm) of SBO:0.01Ce3+, ySm3+ (y = 0.005, 0.01, 0.02, 0.03, 0.05, 0.10) and corresponding fitted results via I-H model.
Materials 15 05189 g005
Figure 6. (a) Luminescent images of SBO:0.02Sm3+ and SBO:0.01Ce3+, 0.02Sm3+ upon 340, 365 and 402 nm excitation of xenon lamp at RT; (b) Luminescent patterns of “SUN YAT-SEN UNIVERSITY” under 365 nm and 405 nm commercial lamp excitations based on SBO:0.02Sm3+ and SBO:0.01Ce3+, 0.02Sm3+ samples.
Materials 15 05189 g006
Table 1. Refined parameters of SBO:0.005Sm3+ sample.
AtomxyzOcc.Biso
Sr0.3554(1)00.25000.99661.1227(13)
Sm0.3554(1)00.25000.00171.3435(13)
Na0.3554(1)00.25000.00170.9375(21)
B000.1185(8)11.3979(20)
O0.1601(4)0.0118(5)0.1156(2)11.1704(42)
Table 2. Calculated lattice parameters of doped samples.
SamplesSBO:0.01Ce3+SBO:0.10Sm3+SBO:0.01Ce3+, 0.10Sm3+
a (Å)9.042(1)9.039(2)9.038(2)
c (Å)12.570(3)12.567(3)12.565(3)
V3)890.3(2)889.5(1)889.2(3)
Table 3. Relevant parameters in I-H model analysis.
Sm3+ ConcentrationCA (×1025 m−3)CDA (×10−53 m6/s)Radj2
0.016.7422.7400.9975
0.0213.483.3380.9978
0.0320.233.8560.9974
0.0533.714.5420.9973
0.1067.424.1750.9973
average-3.730-
Table 4. Relevant parameters in I-H model analysis in Ce3+ and Sm3+ co-doped samples.
Sm3+ ConcentrationCA (×1025 m−3)CDA (×10−49 m6/s)Radj2
0.0053.3710.87910.9978
0.016.7422.4240.9983
0.0213.481.3930.9983
0.0320.232.3590.9978
0.0533.714.0890.9984
0.1067.422.4640.9982
average-2.268-
Publisher’s Note: MDPI stays neutral with regard to jurisdictional claims in published maps and institutional affiliations.

