Abstract
Uranium-238 (238U) and potassium-40 (40K) are important naturally occurring radionuclides. Gamma spectroscopy is a direct, non-destructive method used to determine radionuclide concentrations, but it suffers from the interference of gamma lines. 40K gamma spectroscopy is affected by background interference, which leads to a reduction in the minimum detectable activity. The energy dispersive X-ray analytical technique is quick, with fewer interference problems or background effects. However, it is an indirect method for calculating and deducing the concentrations of isotopes. The aim of the present study was to compare and evaluate both techniques so that they can be utilized efficiently. The results of 238U and 40K were measured by well-calibrated gamma spectroscopy and energy dispersive X-ray techniques. the results indicated that Halayeb White granite is the most environmentally safe compared to the other two types because it contains a very low concentration of uranium 238 and potassium 40.
1. Introduction
Radiation exposure from natural and artificial sources is a persistent and unavoidable hazard. The major effects on humankind come from natural radiation sources, and the global average effective dose per person is 2.4 mSv per year. Natural sources comprise 80% of the total dose that humans receive [1]. The primary contribution is due to naturally occurring radioisotopes in the Earth’s crust, such as 232Th, 238U, and 40K. These radioisotopes exist extensively in the lithosphere and are found in mineral ores, soils, rocks, etc. Due to the break-down and weathering of rocks, 40K can be transferred to food pathways.
The average worldwide specific activity values of 40K, 238U, and 232Th in soil are 400, 37, and 33 Bq/kg, respectively. Cancer is one of the most detrimental radiation adverse health effects. Hence, the accurate determination of naturally occurring isotopes is essential for determining the radiation health hazard indices to estimate the risk level due to potential exposure to background radiation [2,3].
Previous studies have demonstrated various detection and measuring techniques to determine the concentration of 40K and 238U in different environmental matrices [4,5,6]. Gamma spectroscopy is the standard method used to measure the specific concentration of 40K in soil or natural rock due to the 40K gamma line at 1460.8 keV, with a considerable intensity of 10.66% [7]. On the other hand, alpha spectroscopy is a suitable method for directly determining specific 238U concentrations, but it suffers from complex chemical preparation and tracing methods prior to measuring. Hence, gamma spectroscopy dominates the detection process of 40K and 238U if the secular equilibrium between 226Ra (the last nongaseous daughter of 238U) is expected, as in the case of natural minerals and rocks such as granite [8].
Gamma spectroscopy is a simple and direct method that does not require chemical preparation and tracing complexities. However, it has the disadvantage of gamma line interference, as in the case of 235U and 226Ra at 185.7 and 186.2 keV, respectively. Furthermore, to obtain accurate results, gamma spectroscopy takes a long time to achieve sufficient counts to reduce uncertainty and statistical error, especially in the case of very low-concentration environmental tracing radioisotopes [9,10,11].
Using an energy dispersive X-ray (EDX) spectrometer to determine the elemental composition is very common during the analysis of environmental and geological samples. Deducing the radioisotope weight ratios from the elemental composition is theoretically possible by assuming that isotopic natural abundance ratios are preserved. The EDX technique is rapid, reliable, and does not require complicated sample preparation [12,13].
In this study, the gamma spectroscopy and EDX methods are discussed and compared in terms of detection limits, uncertainty, and accuracy. We illustrate the limitations of each analytical method and their most efficient uses to determine 40K and 238U concentrations in natural rocks, minerals, and environmental samples under the secular equilibrium of 238U and 226Ra by investigating three different types of granites rocks with expected various concentrations of 40K and 238U. The expected achievement of this comparative study is to determine when the technique is most efficient and what its limitations are.
2. Materials and Methods
2.1. Samples
Three different natural granite types are shown in Table 1: Gandola, Red Aswani, and White Halayeb. The samples were collected from various places in Egypt, as shown in Figure 1. Five samples were obtained from each kind of granite rock. Small pieces of each type of granite were ground, and then the produced powder was stirred and mixed thoroughly until achieving a homogenous fine powder.

Table 1.
Sample markings, descriptions, and locations.
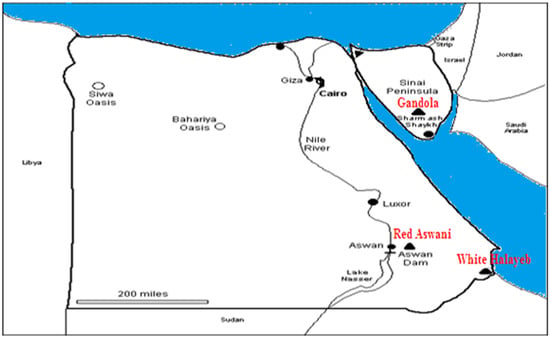
Figure 1.
Map of the sample locations.
2.2. Gamma Spectrometer Method
The radiation measurements were performed by using a high-resolution gamma spectroscopy system. It consisted of a high-purity germanium detector, the “HPGe” (see Figure 2) model CS20-A31CL, with a multi-channel analyzer (MCA) of 4022 channels at the Institute of Graduate Studies and Research, Alexandria University, Egypt. The detection system’s relative efficiency is 24.5% for 1333 keV of 60Co-line for the efficiency of the (3″ × 3″) NaI scintillation detector at 25 cm from the radiation source. The achieved energy resolution was 0.93 keV at the 122 keV gamma line and 1.95 keV at the 1333 keV gamma line of 60Co.
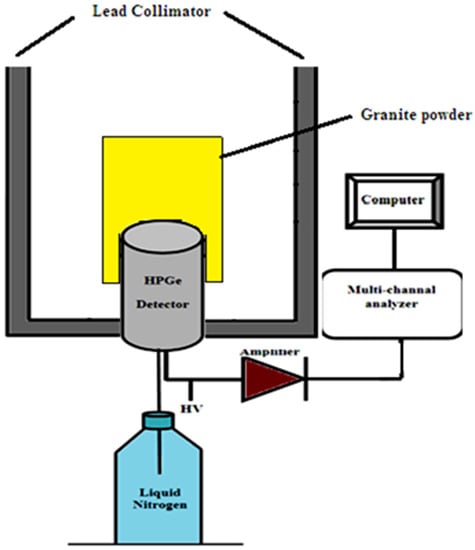
Figure 2.
Illustration of the gamma spectrometer technique.
The secular equilibrium between 238U and 226Ra was utilized to determine the 238U concentration by using the 186.2 keV gamma line of 226Ra after correction to remove 235U interference. The specific activity (Bq Kg−1) for dry mass (M) was calculated by [14]:
where NT, , and are the total count rate, efficiency of the HPGe detector, and relative intensity of peak energy E, respectively. The total count rate of the 186.2 keV line includes 226Ra (186.2 keV, 3.555%) and 235U (185.7 keV, 57%), where and the relation between the total count rate and count rate of 226Ra is given by [15]:
Thus, we can calculate the specific activity of 238U using Equation (3) [16,17]:
The minimum detectable activity (MDA) is related to detector sensitivity and can be defined as the smallest amount of activity distinguishable from the background, which can be quantified at a given confidence level (usually 95%). The minimum detectable activity was automatically calculated using the Genie 2000 data acquisition and analysis software [14], as follows:
Proper detector energy and efficiency calibrations were conducted before the measurement. The acquisition time was chosen to obtain sufficient counts under each photopeak so that the statistical uncertainty was below 1% (with a measuring time of 12 h). The spectrum was analyzed by using the Genie 2000 data acquisition and analysis software (made by Canberra), which is an integrated set for counting and analyzing spectra to calculate the net count rate at 186.2 keV and 1460 keV, as shown in Figure 3.
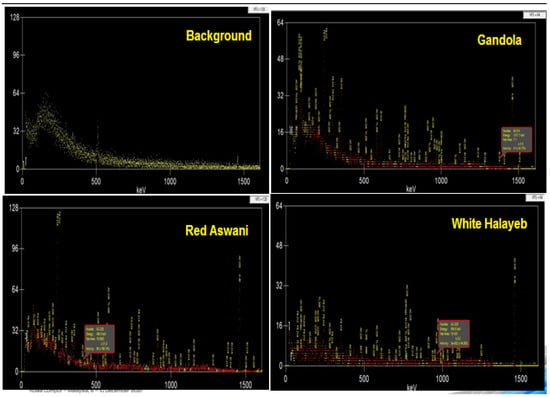
Figure 3.
Experimental spectrums using the HPGe detector for background radiation and the three discussed granite samples.
A 0.5 kg powder sample was enclosed in a 0.5 L Marinelli beaker to acquire the 4Π counting geometry. It was placed inside lead shielding to reduce the background and obtain a lower minimum detectable activity. The background was determined by allowing the detector to count a blank sample of an empty 0.5 L Marinelli beaker for long enough to acquire a good statistical result of the background measurement. Then, the background spectra were subtracted from the gross sample spectrum under each photo-peak of interest to obtain the net count of each photo-peak [18,19].
2.3. EDX Method
The elemental potassium and uranium concentrations of the investigated samples were determined through the energy dispersion X-ray (EDX) unit of the electron scanning microscope (SEM) at the city of scientific research in Alexandria, Egypt. Uranium is a trace element in granites, making accurate detection with EDX difficult. Therefore, each sample was scanned by the electron microscope for multiple scans (with repeated measurements), targeting different regions of one sample to perform a comprehensive scan for each sample. The measuring time was selected to be the maximum time allowed by the instrument (30 min), while increasing the beam current as much as possible to ensure the accurate determination of the elemental concentration inside the sample. A schematic diagram of an EDX micro-analysis method is shown in Figure 4 [20].
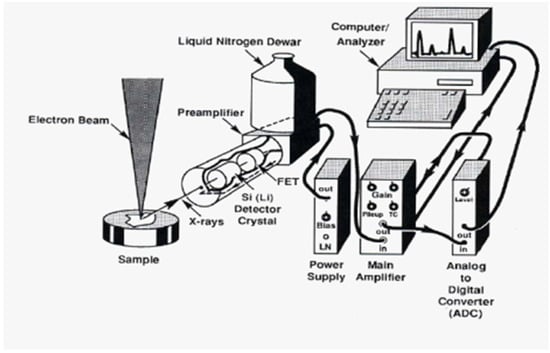
Figure 4.
Schematic diagram of an EDX system.
The detection limit of an EDX system is affected by bremsstrahlung radiation—with lower concentrations, statistical errors and uncertainties are higher. Further, the detection limits for heavy elements (using the L or M lines) such as uranium tend to increase because the peak-to-background ratio is lower than it is for K lines [21]. The detection limit of the EDX system can be estimated from the following equation [22]:
where N(B) is the average background count, N(S) is the average count of the standard, and Cs is the concentration of the standard. The specific activity concentration of the radionuclides can be estimated theoretically from the elemental concentration given by EDX [23,24]:
where λ is the decay constant of the radionuclide and N is the number of radionuclides in a 1 kg granite sample, which can be given by [25]:
where C is the elemental concentration of mass percentage in the granite sample estimated from EDX, R is the isotopic abundance, NA is the Avogadro’s number, and W is the atomic weight of the radionuclide.
As = λ × N
3. Results and Discussion
First, the HPGe detector was calibrated (energy and efficiency calibration) using three point sources for the energy calibration—241Am (59.54 keV), 137Cs (661.65 keV), and 60Co (1173 and 1333 keV)—while the 152Eu volumetric source (121.8, 244.7, 344.3, 444, 778.9, 867.4, 964.0, 1112.1, and 1408.0 keV) for the efficiency calibration was as shown in Figure 5. From the efficiency calibration curve, as shown in Figure 5b, the equation for the efficiency as a function of energy was obtained. From this equation, the detector’s efficiency was calculated at 186.2 keV (226Ra) and 1460 keV (40K).
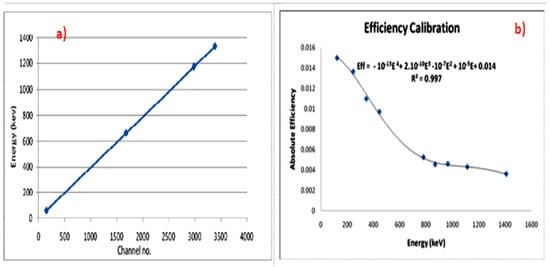
Figure 5.
Calibration of HPGe detector. (a) Energy calibration. (b) Efficiency calibration.
Calculating the count rate and corresponding efficiency of each energy and substituting this into Equation (1), the specific activity of the different radionuclide (AS) samples and the average values were calculated. The values were determined for each site based on the gamma ray spectrometer method for U-238 and K-40 (Figure 6 and Figure 7, respectively).
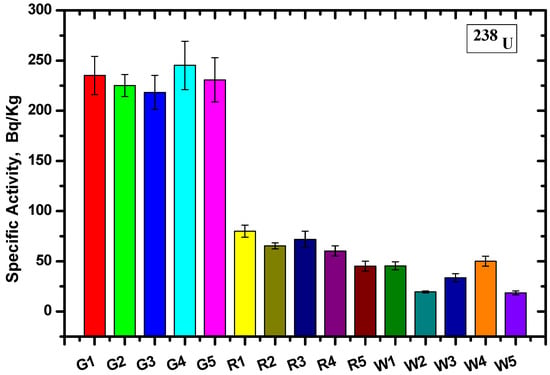
Figure 6.
The specific activity for 238U using the Ra-226 γ-line at 186.2 keV for the different granite samples.
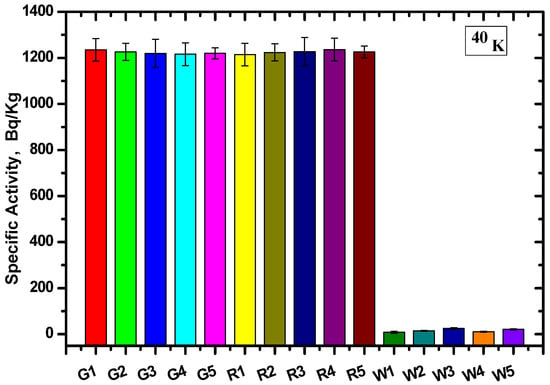
Figure 7.
The specific activity for 40K at 1406 keV for the different granite samples.
The specific activity was calculated for five samples of each type, and the specific activity of U-238 for all Gandola samples was higher than the Red Aswani granite, while the lowest specific activity resulted from the white Halayeb granite. On the other hand, the specific activity was nearly equal for the K-40 for the Gandola and Red Aswani samples, and the activity was almost non-existent in the white Halayeb granite.
The results are tabulated in Table 2, including the average value for each granite type and the standard deviation. The results showed that the Gandola granite had the highest 238U concentration compared with the other two types of granite, while White Halayeb had the lowest concentration. Furthermore, the 40K concentration was nearly constant in both Gandola and Red Aswani, while the 40K concentration for White Halayeb was insignificant compared to Gandola and Red Aswani. The standard deviations (SDs) in the U-238 radionuclide were 10.2, 13.1, and 14.5 for Gandola, Red Aswani, and White Halayeb, respectively. Meanwhile, in K-40, the SDs were 8, 7.9, and 6.9 for Gandola, Red Aswani, and White Halayeb, respectively.

Table 2.
Radionuclide specific activity (Bq/Kg) for the different samples by the gamma ray spectrometer method.
The minimum detectable activities of the radionuclides under study are listed in Table 3. The minimum detectable activity (MDA) of 40K was lower than the MDA of 226Ra. This might be due to the intensity of the 40K gamma line at 1460 (10.6%), which is higher than 226Ra at 186.2 keV (3.64%).

Table 3.
The minimum detectable activity of the radionuclides of interest.
The absolute efficiency calibration of the gamma spectroscopy was validated using radioactive mixed standard sets in a soil matrix in 1000 mL Marinelli beakers. The quality control soil samples (supplied through the proficiency testing Mixed Analytic Performance Evaluator Program (MAPEP), organized by the Department of Energy in the United States) were measured in parallel with the analyzed samples to keep a bias of <5%, as in the laboratory criteria. Table 4 lists the most recent participation in the MAPEP program, which coincided with the sample measuring. Meanwhile, the EDX measurement accuracy was evaluated using the IAEA-312 soil matrix reference material for U determination and a high-analytical-purity potassium chloride for potassium measurement. The bias of the laboratory value was 3.6% for uranium and 1.5% for potassium.

Table 4.
The most recent participation in the MAPEP program.
According to Section 2.3, the specific activity was calculated for the same samples and compared with the gamma spectroscopic results, as shown in Figure 8. The relative deviation was calculated between the two results and tabulated in Table 5. The relative deviation between the EDX analysis and gamma ray spectroscopy was determined as:
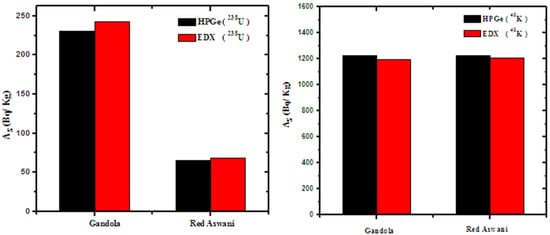
Figure 8.
The specific activity by the two methods for Gandola and Red Aswani.

Table 5.
The elemental contents and equivalent specific activity for the three types of granites, as well as the relative deviation between the two presented methods.
The results in Table 5 showed good agreement between the two methods, where the R.D in all types of rocks was ≤ 6%. This indicates the correctness of using the EDX analysis method without exposure to gamma rays when calibrating the device. The results indicated that EDX is an effective and reliable method for high concentrations, while gamma ray spectroscopy is more effective for low radionuclide contents, but with a high degree of uncertainty.
4. Conclusions
The concentrations of uranium-238 (238U) and potassium-40 (40K) in the three different types of granite (Gandola, Aswani Red, and White Halayeb) were determined for each type of the five samples using gamma ray spectroscopy and EDX analysis, and the average value was calculated. The results of the two methods showed a good agreement between the radionuclide concentration measurements. The results show that the EDX analysis method is fast, and it is recommended in the case of high concentrations, while gamma spectroscopy is more suitable in the case of low radionuclide content, but with a high degree of uncertainty. Finally, the results indicated that Halayeb White granite is the most environmentally safe compared to the other two types because it contains a very low concentration of uranium 238 and potassium 40.
Author Contributions
Conceptualization, M.E. and M.A.E.-N.; methodology, M.I.S.; software, H.A.-G.; validation, A.H.A., I.H.S. and M.E.; formal analysis, M.A.E.-N.; investigation, A.H.A.; resources, H.A.-G.; data curation, A.H.A.; writing—original draft preparation, M.A.E.-N.; writing—review and editing, M.E.; visualization, H.A.-G.; supervision, I.H.S.; project administration, M.I.S.; funding acquisition, H.A.-G. All authors have read and agreed to the published version of the manuscript.
Funding
The authors express their gratitude to Princess Nourah bint Abdulrahman University Researchers Supporting Project number (PNURSP2022R28), Princess Nourah bint Abdulrahman University, Riyadh, Saudi Arabia.
Institutional Review Board Statement
Not applicable.
Informed Consent Statement
Not applicable.
Data Availability Statement
Not applicable.
Acknowledgments
The authors express their gratitude to Princess Nourah bint Abdulrahman University Researchers Supporting Project number (PNURSP2022R28), Princess Nourah bint Abdulrahman University, Riyadh, Saudi Arabia.
Conflicts of Interest
The authors declare no conflict of interest.
References
- Mohanty, A.K.; Sengupta, D.; Das, S.K.; Saha, S.K.; Van, K.V. Natural radioactivity and radiation exposure in the high background area at Chhatarpur beach placer deposit of Orissa, India. J. Environ. Radioact. 2004, 75, 15–33. [Google Scholar] [CrossRef] [PubMed]
- World Health Organization (WHO). WHO Handbook on Indoor Radon: A Public Health Perspective; World Health Organization: Geneva, Switzerland, 2009. [Google Scholar]
- UNSCEAR United Nations Scientific Committee on the Effects of Atomic Radiation. United Nations Scientific Committee on the Sources and Effects of Ionizing Radiation, 2008 Report to the General Assembly, with Scientific Annexes. Annexes C, D and E; UNSCEAR United Nations Scientific Committee on the Effects of Atomic Radiation: Vienna, Austria, 2008; Volume 80527, p. 1180527. [Google Scholar]
- Alshahri, F. Radioactivity of 226Ra, 232Th, 40Kand 137Cs in beach sand and sediment near to desalination plant in eastern Saudi Arabia: Assessment of radiological impacts. J. King Saud Univ. Sci. 2017, 29, 174–181. [Google Scholar] [CrossRef]
- Shaban, S.; El-Mongy, S.A. Validation of scanning electron microscope (SEM), energy dispersive X-ray (EDX) and gamma spectrometry to verify source nuclear material for safeguards purposes. J. Radioanal. Nucl. Chem. 2013, 296, 1219–1224. [Google Scholar] [CrossRef]
- Vesterbacka, P.; Klemola, S.; Salahel-Din, K.; Saman, M. Comparison of analytical methods used to determine 235U, 238U and 210Pb from sediment samples by alpha beta and gamma spectrometry. J. Radioanal. Nucl. Chem. 2009, 281, 441–448. [Google Scholar] [CrossRef]
- Fernández, A.; Martínez, T.; Navarrete, M.; Zúñiga, M.A. Validation of the Quantification Method for Potassium by Means of 40K γ-Radiation. INCS News 2012, 9, 4–8. [Google Scholar]
- Khater, A.E. Polonium-210 budget in cigarettes. J. Environ. Radioact. 2004, 71, 33–41. [Google Scholar] [CrossRef]
- Ahmed, N.K. Measurement of natural radioactivity in building materials in Quena City, Upper Egypt. In Proceedings of the Fourth Radiation Physics Conference, Alexandria, Egypt, 15–19 November 1999. [Google Scholar]
- Beretaka, J.; Mathew, P.J. Measurements of radionuclides in food and the environment. In Technical Reports Series 295; IAEA: Vienna, Austria, 1985. [Google Scholar]
- Diab, H.; El-Tahawy, M.; El-Mongy, S. Evaluation of the natural and man-made radioactivity levels around the Egyptian nuclear facilities. Radiochim. Acta 2001, 89, 179–185. [Google Scholar] [CrossRef]
- Liritzis, I.; Mavrikis, D.; Zacharias, N.; Sakalis, A.; Tsirliganis, N.; Polymeris, G.S. Potassium determination using SEM, FAAS and XRF: Some experimental notes. Mediterr. Archaeol. Archaeom. 2011, 11, 169–179. [Google Scholar]
- Goldstein, J.; Newbury, D.E.; Joy, D.C.; Lyman, C.E.; Echlin, P.; Lifshin, E.; Sawyer, L.; Michael, J.R. Scanning Electron Microscopy and X-ray Microanalysis, 3rd ed.; Springer: Berlin/Heidelberg, Germany, 2003. [Google Scholar]
- Papp, Z.; Dezso, Z.; Daroczy, S. Measurement of the radioactivity of 238U, 232Th, 226Ra, 137Cs and 40K in soil using direct Ge(Li) g-ray spectroscopy. J. Radioanal. Nucl. Chem. 1997, 222, 171–176. [Google Scholar] [CrossRef]
- Ebaid, Y.Y.; El-Mongy, S.A.; Allam, K.A. 235U gamma emission contribution to the 186 keV energy transition of 226Ra in environmental samples activity calculations. In International Congress Series; Elsevier: Amsterdam, The Netherlands, 2005; Volume 1276, pp. 409–411. [Google Scholar]
- Delgado, J.U.; Morel, J.; Etcheverry, M. Measurements of photon emission probabilities from the decay of 226Ra and daughters. Appl. Radiat. Isot. 2002, 56, 137–143. [Google Scholar] [CrossRef]
- Knoll, G.F. Radiation Detection and Measurement; John Wiley and Sons: New York, NY, USA, 1979; pp. 233–268. [Google Scholar]
- Ebaid, Y.Y.; El-Tahawy, M.S.; El-Lakany, A.A.; Garcia, S.R.; Brooks, G.H. Environmental radioactivity measurements of Egyptian soils. J. Radioanal. Nucl. Chem. 2000, 243, 543–550. [Google Scholar] [CrossRef]
- Khater, A.E.M.; Ebaid, Y.Y. A simplified gamma-ray self-attenuation correction in bulk samples. Appl. Radiat. Isot. 2008, 66, 407–413. [Google Scholar] [CrossRef] [PubMed]
- Scott, V.D.; Love, G. Quantitative Electron Probe Microanalysis, 2nd ed.; Ellis Horwood: Chichester, UK, 1994. [Google Scholar]
- Wakisaka, T.; Morita, N.; Wakasa, M.; Terada, S.; Nishihagi, K.; Taniguchi, K. Development of energy dispersive X-ray fluorescence spectrometer with monochromatic excitation the direct determination of trace elements in organic matrices. Bunseki Kagaku 1996, 45, 933–939. [Google Scholar] [CrossRef][Green Version]
- Gürol, A. Measurements of the K X-ray intensity ratios by using energy-dispersive X-ray fluorescence spectrometry. Appl. Radiat. Isot. 2008, 66, 372–376. [Google Scholar] [CrossRef] [PubMed]
- Sitko, R.; Zawisza, B.; Malicka, E. Energy-dispersive X-ray fluorescence spectrometer for analysis of conventional and micro-samples: Preliminary assessment. Spectrochim. Acta Part B At. Spectrosc. 2009, 64, 436–441. [Google Scholar] [CrossRef]
- Ghoshal, N.S. Nuclear Physics; S.Chand & Company Ltd.: New Delhi, India, 1994; Volume 11055, pp. 156–165. [Google Scholar]
- Firestone, R.B.; Shirley, V.S. Table of Isotopes; John Willey & Sons, NC.: New York, NY, USA, 1996; Volume 1–2. [Google Scholar]
Publisher’s Note: MDPI stays neutral with regard to jurisdictional claims in published maps and institutional affiliations. |
© 2022 by the authors. Licensee MDPI, Basel, Switzerland. This article is an open access article distributed under the terms and conditions of the Creative Commons Attribution (CC BY) license (https://creativecommons.org/licenses/by/4.0/).