
A Novel Micromechanics-Model-Based Probabilistic Analysis Method for the Elastic Properties of Unidirectional CFRP Composites

Abstract
:1. Introduction
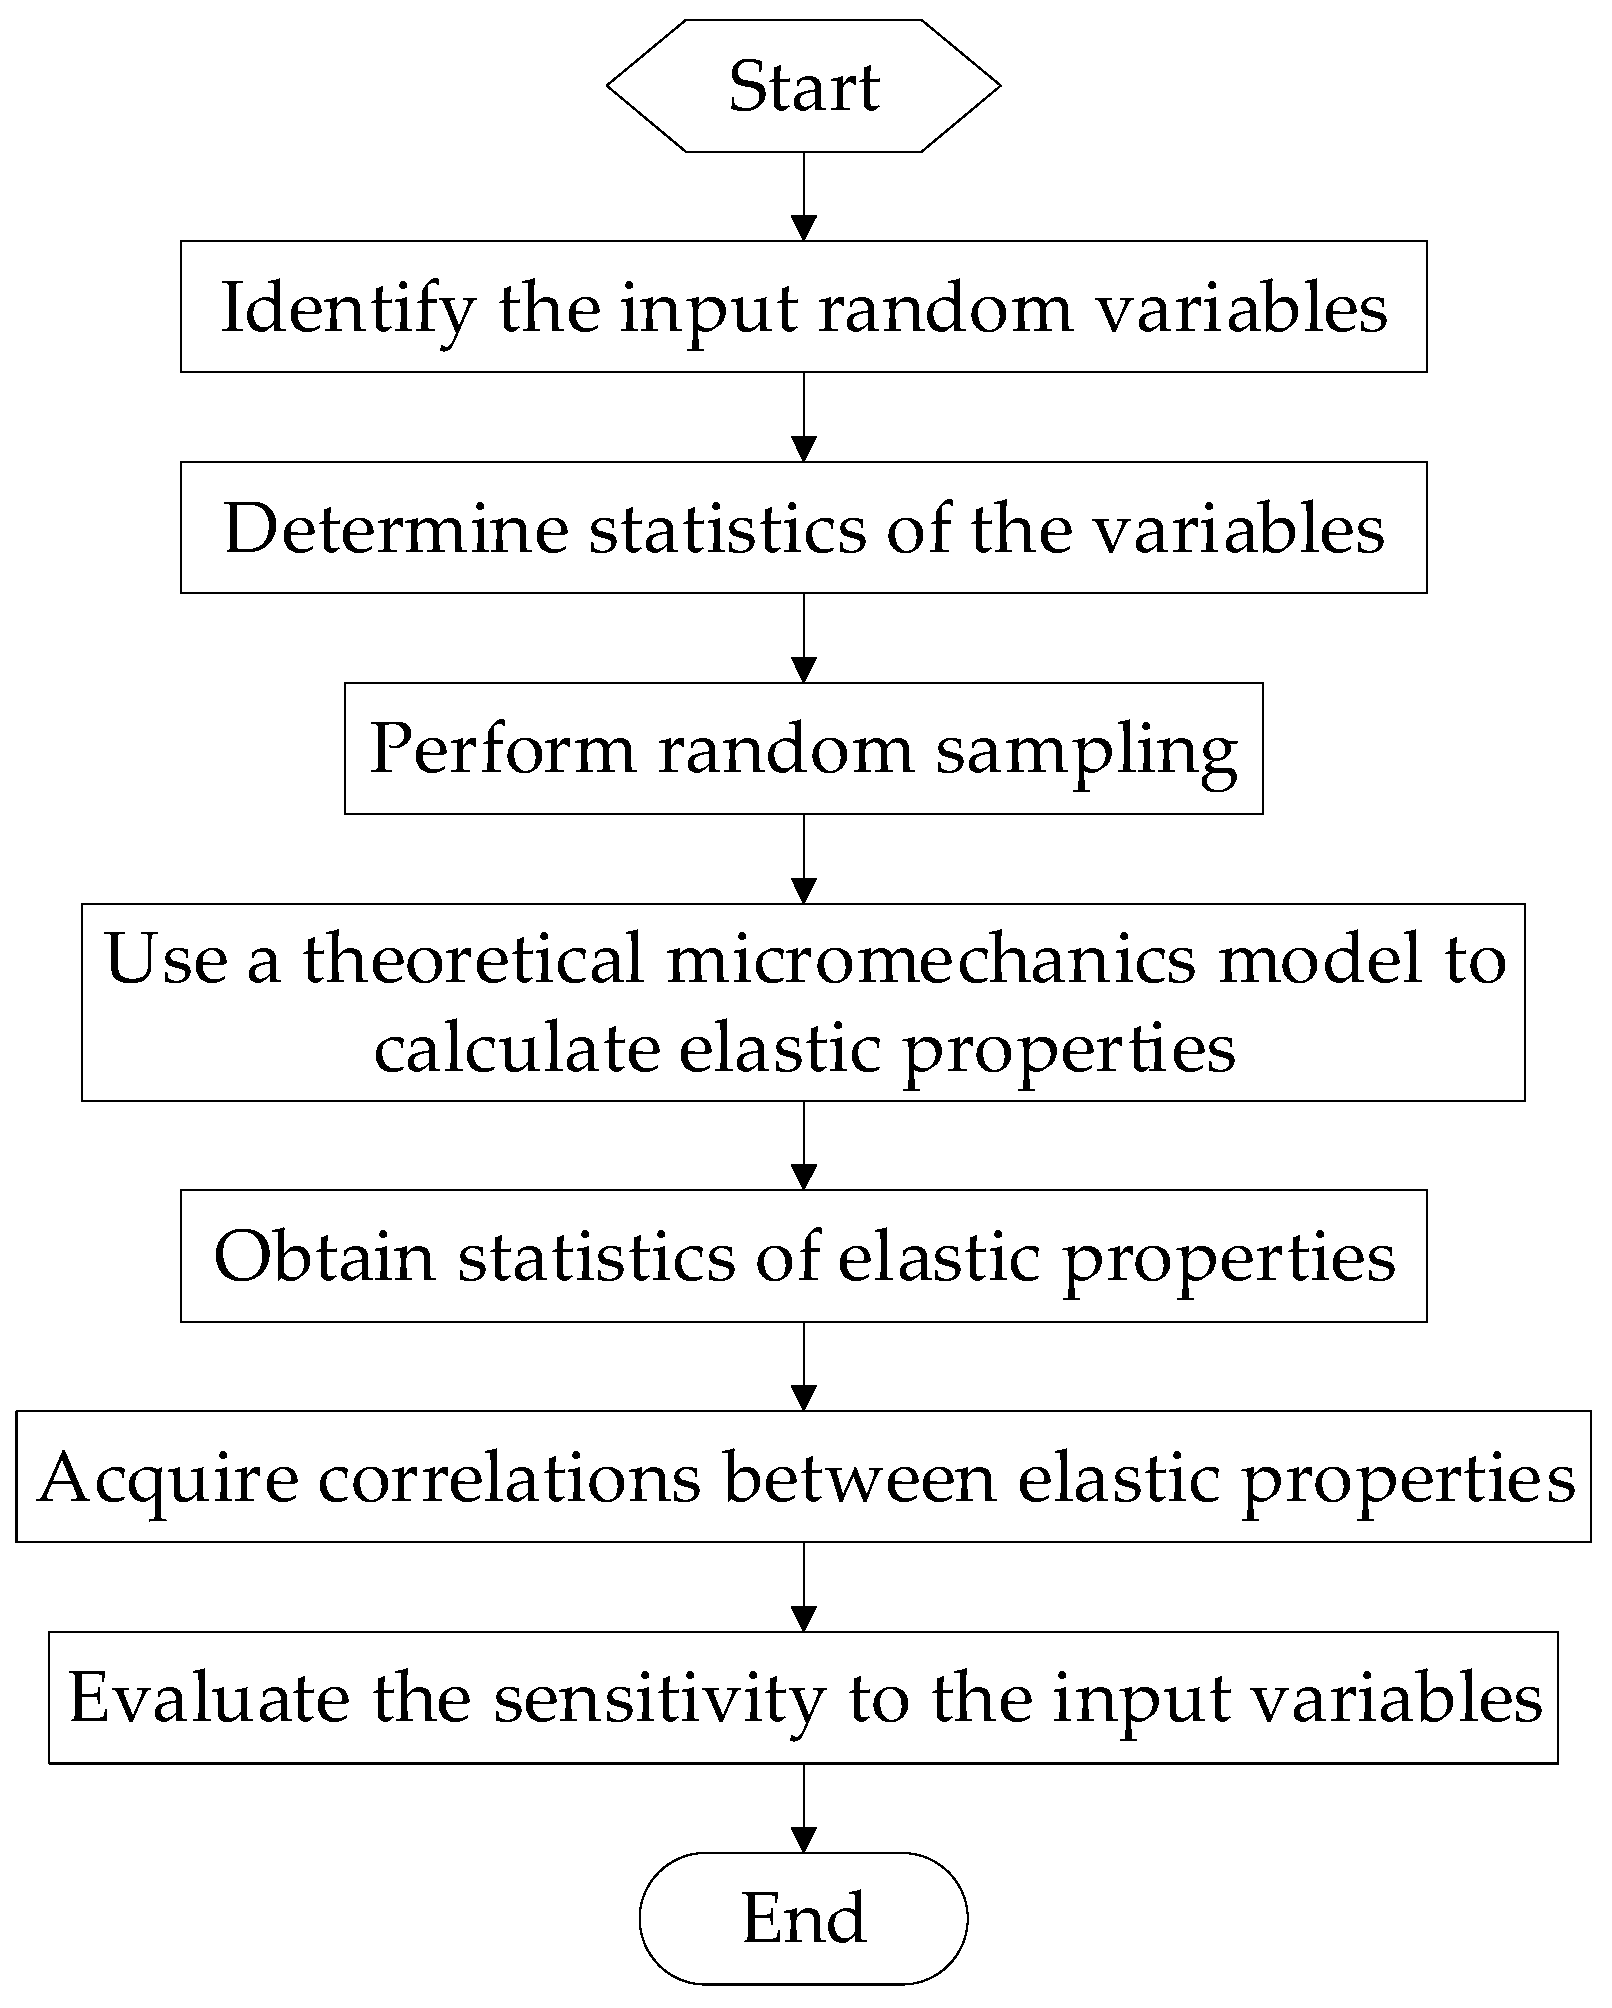
2. Methodology
- Step 1:
- Identify the input random variables, namely, the material properties of the constituent.
- Step 2:
- Determine the statistics of the input random variables, including the probability distribution type and the distribution parameters.
- Step 3:
- Perform random sampling using the Monte Carlo simulation.
- Step 4:
- Use an accurate theoretical micromechanics model to calculate the elastic properties.
- Step 5:
- Obtain the statistics of the elastic properties based on the output data.
- Step 6:
- Acquire the correlations between the elastic properties.
- Step 7:
- Evaluate the sensitivity of the elastic properties to the input constituent’s properties.
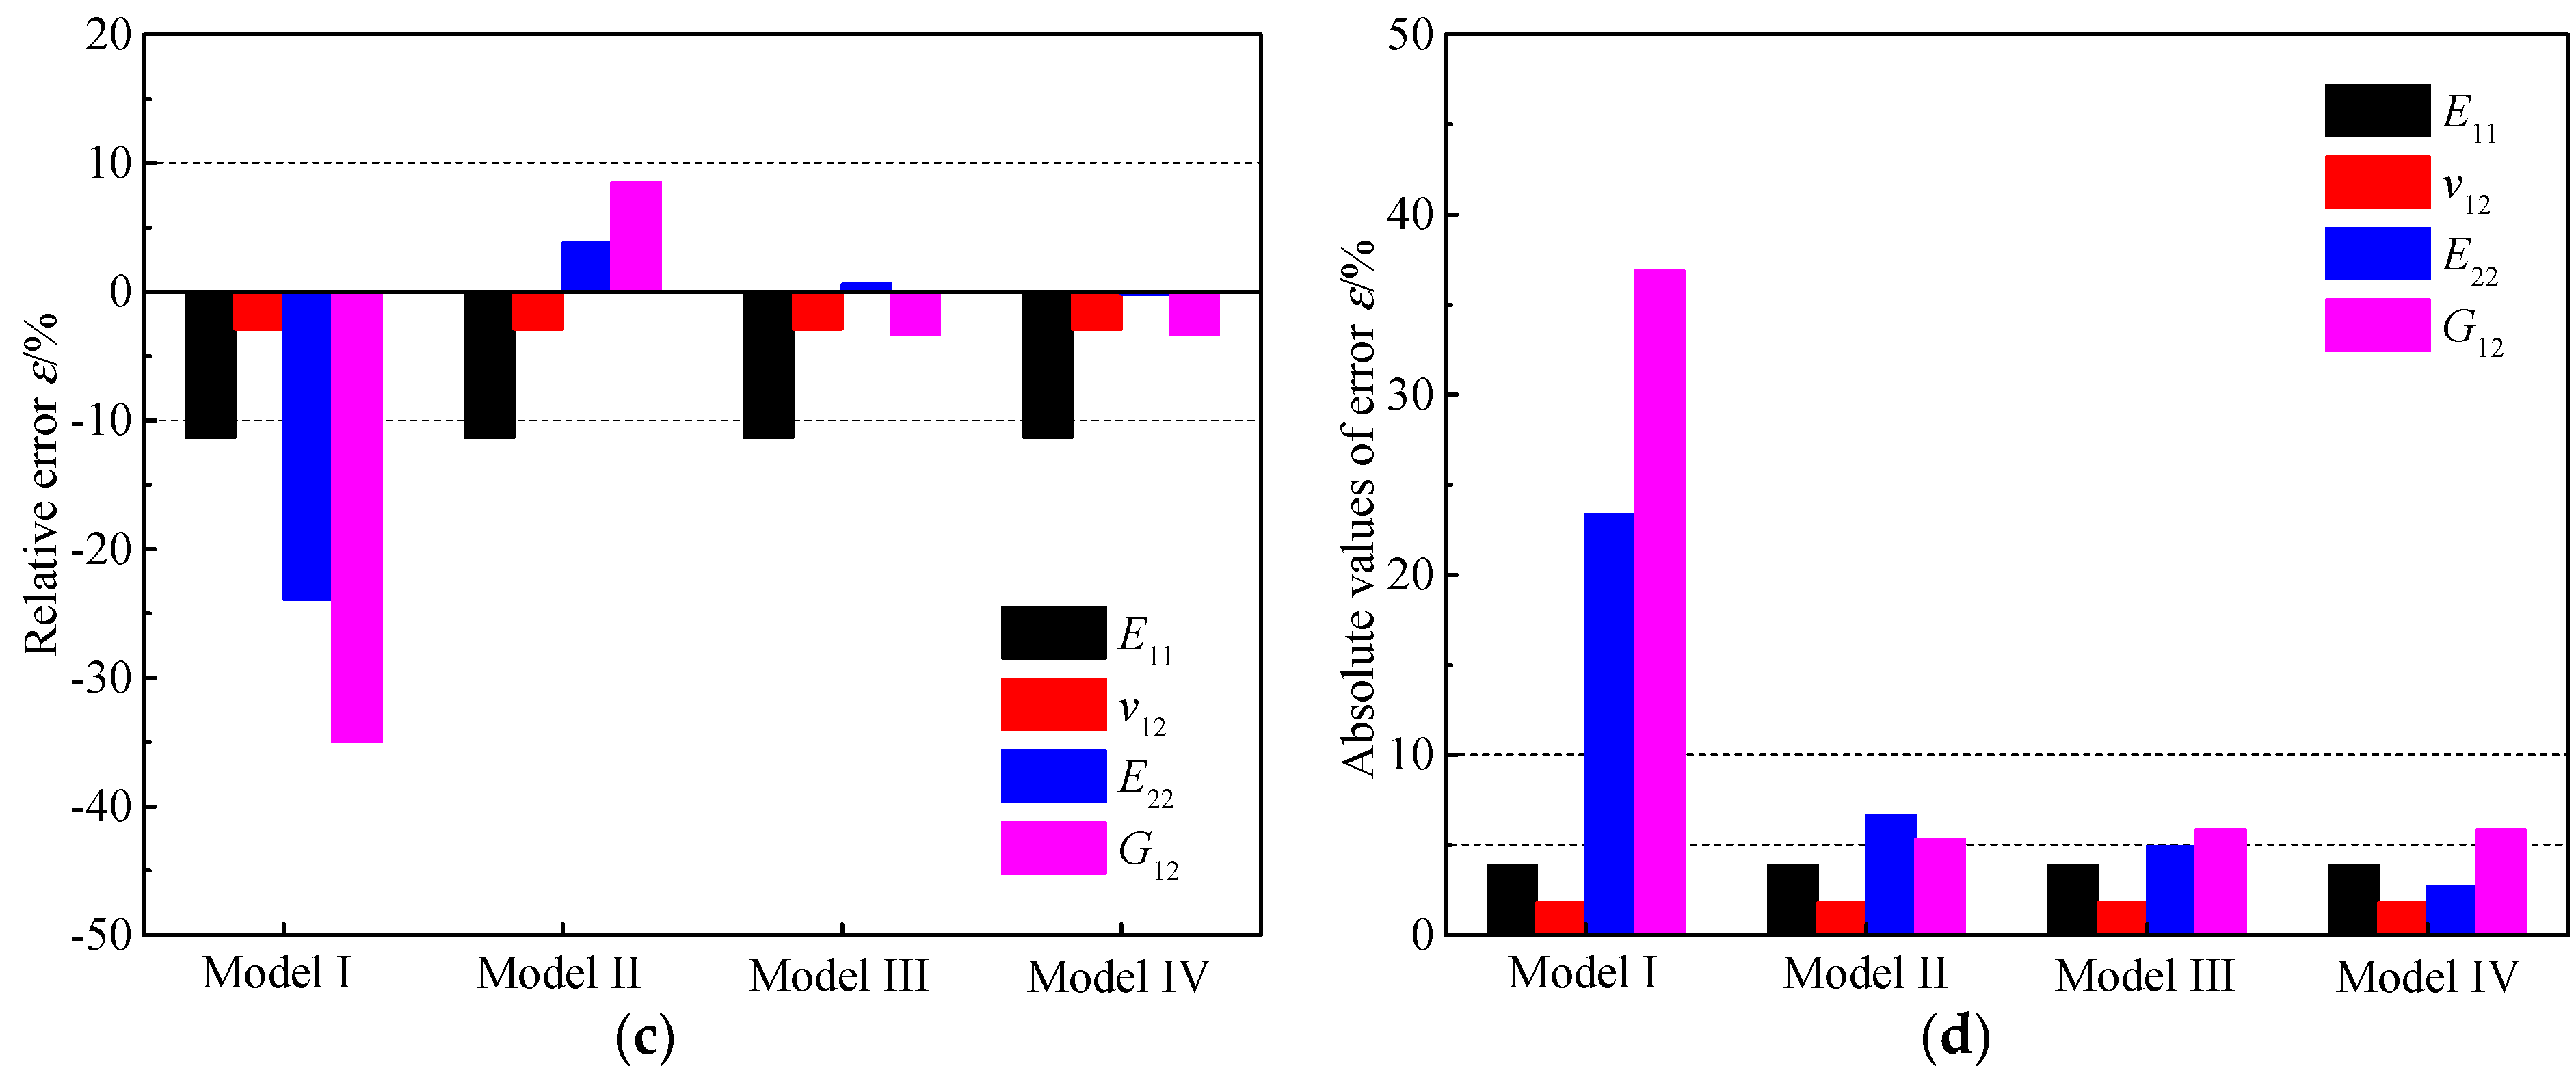
3. Comparisons of Micromechanics Models
3.1. Descriptions of the Micromechanics Models
- Rule of mixture (numbered as Model I).
- Chamis model (numbered as Model II).
- Halpin–Tsai model (numbered as Model III).
- Bridging model (numbered as Model IV).
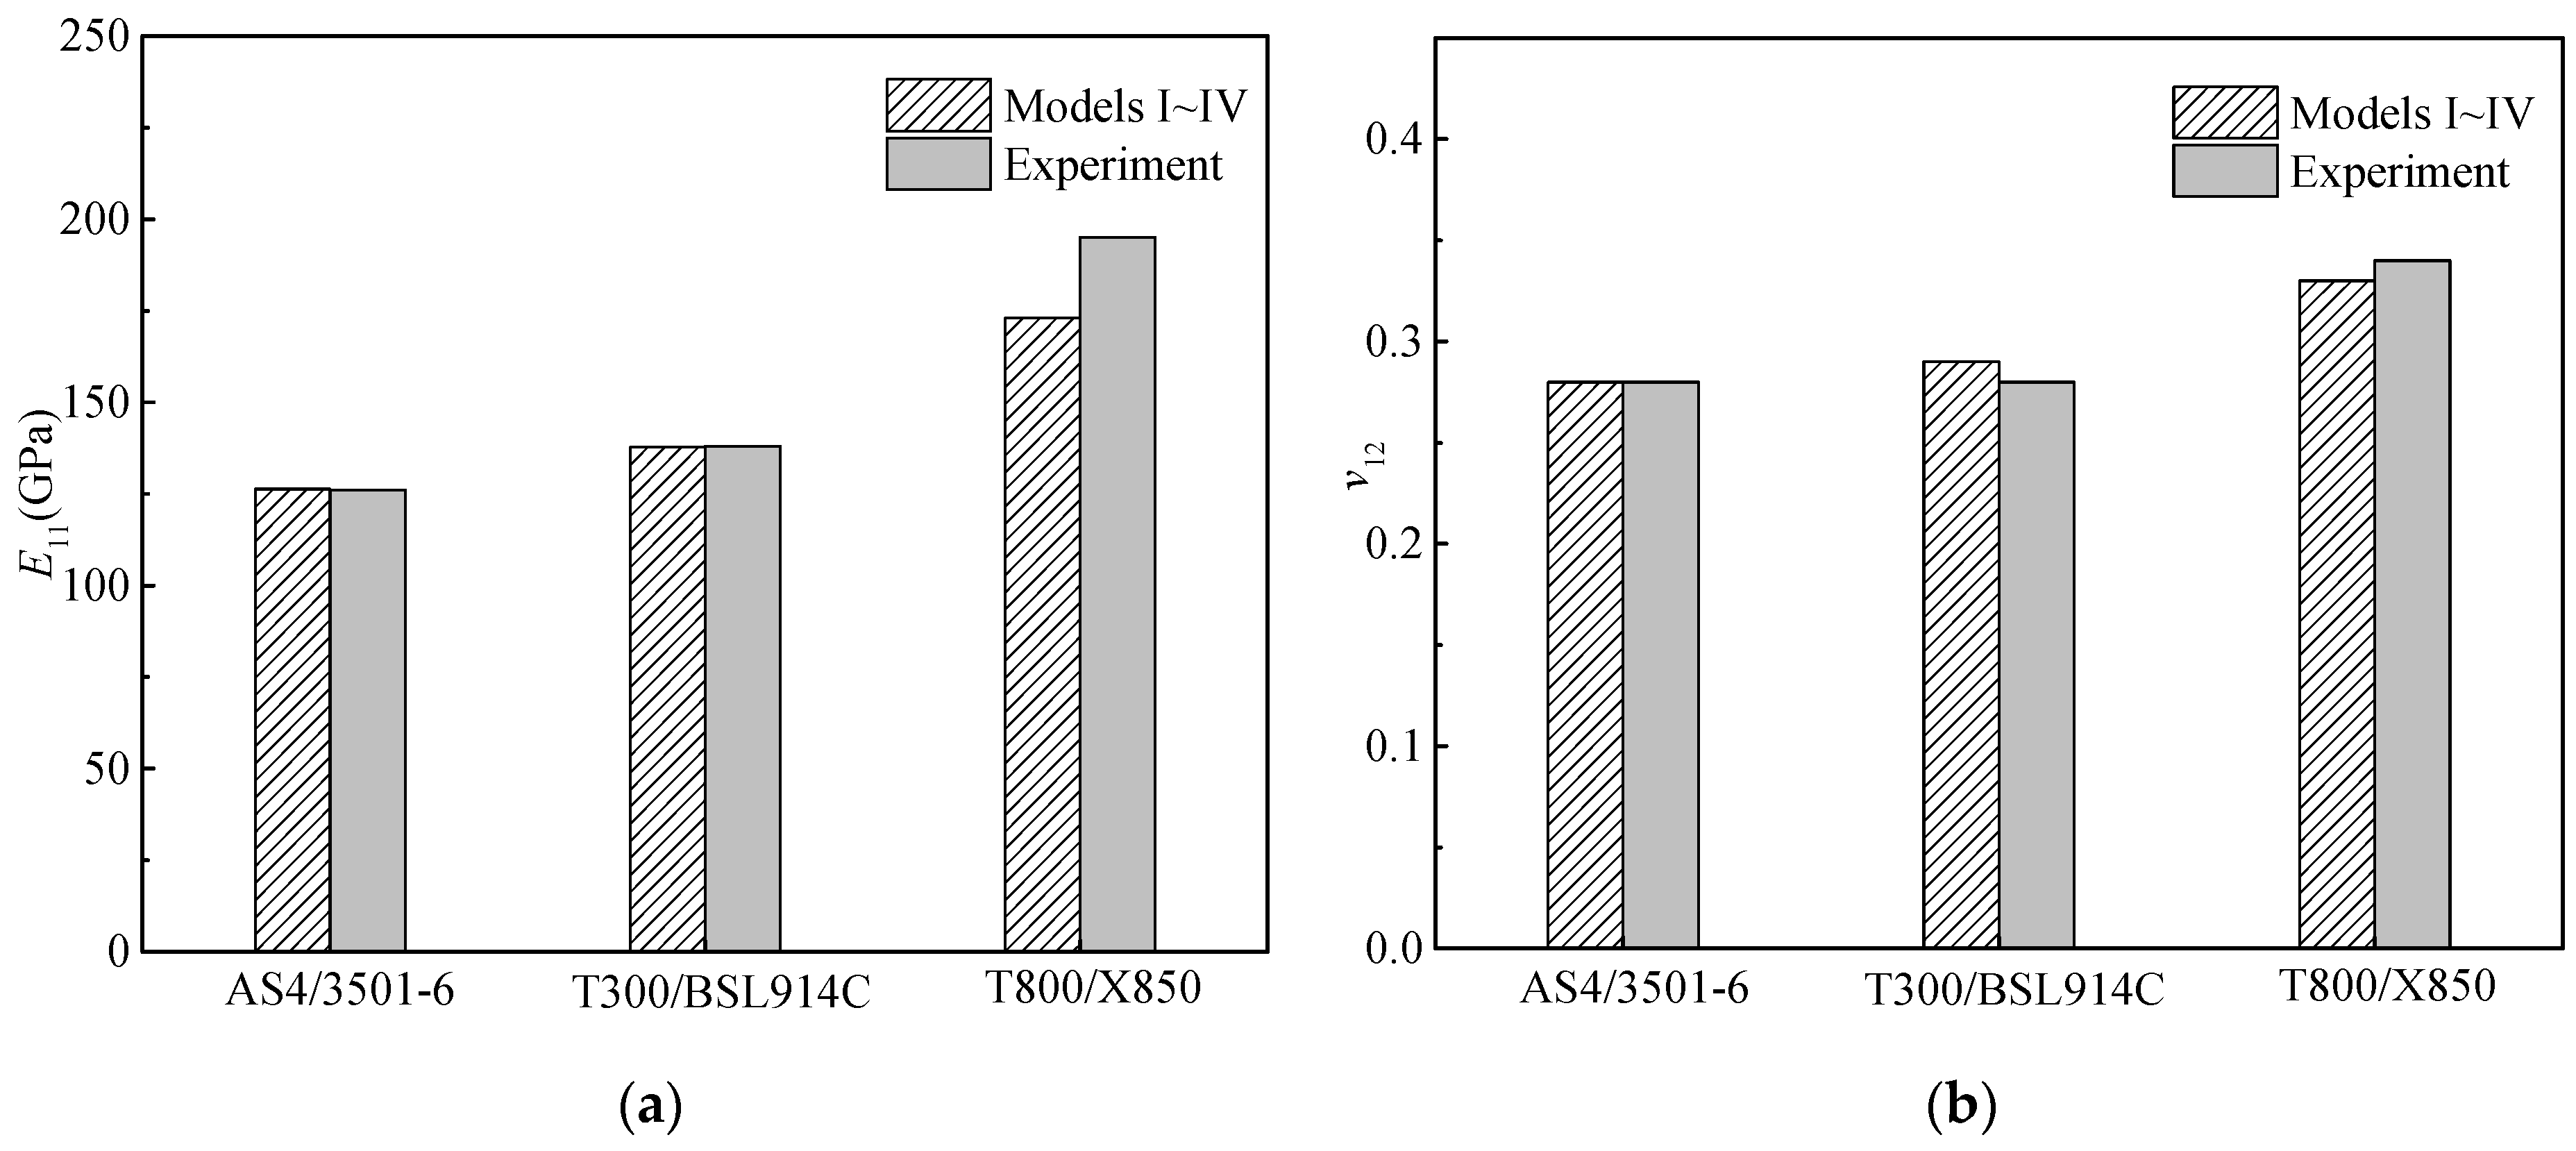
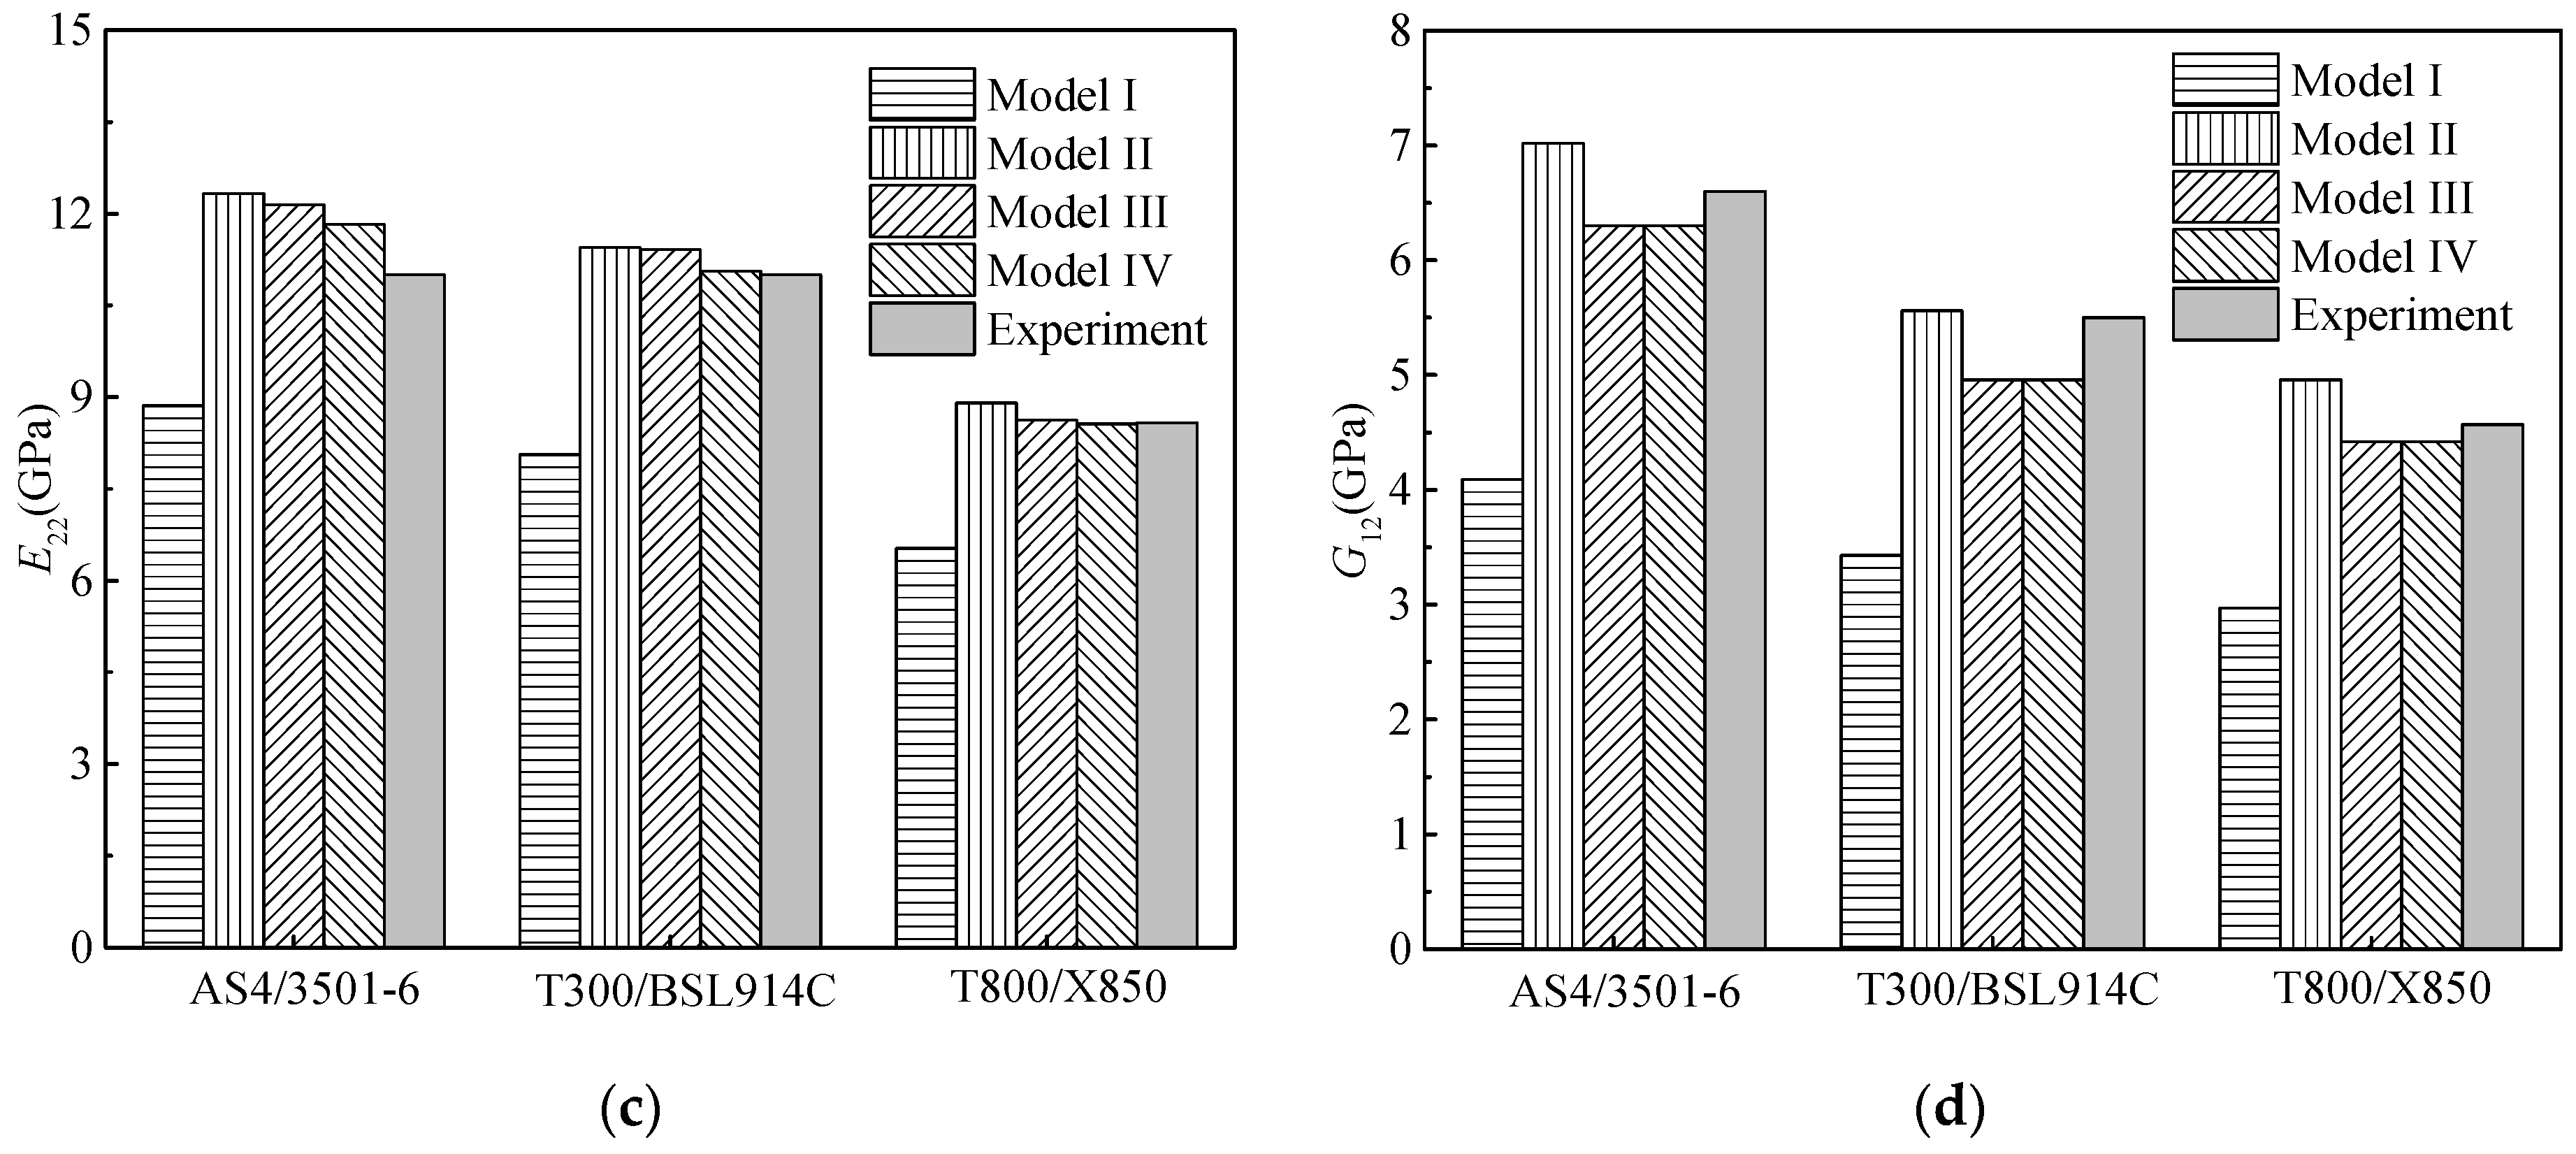
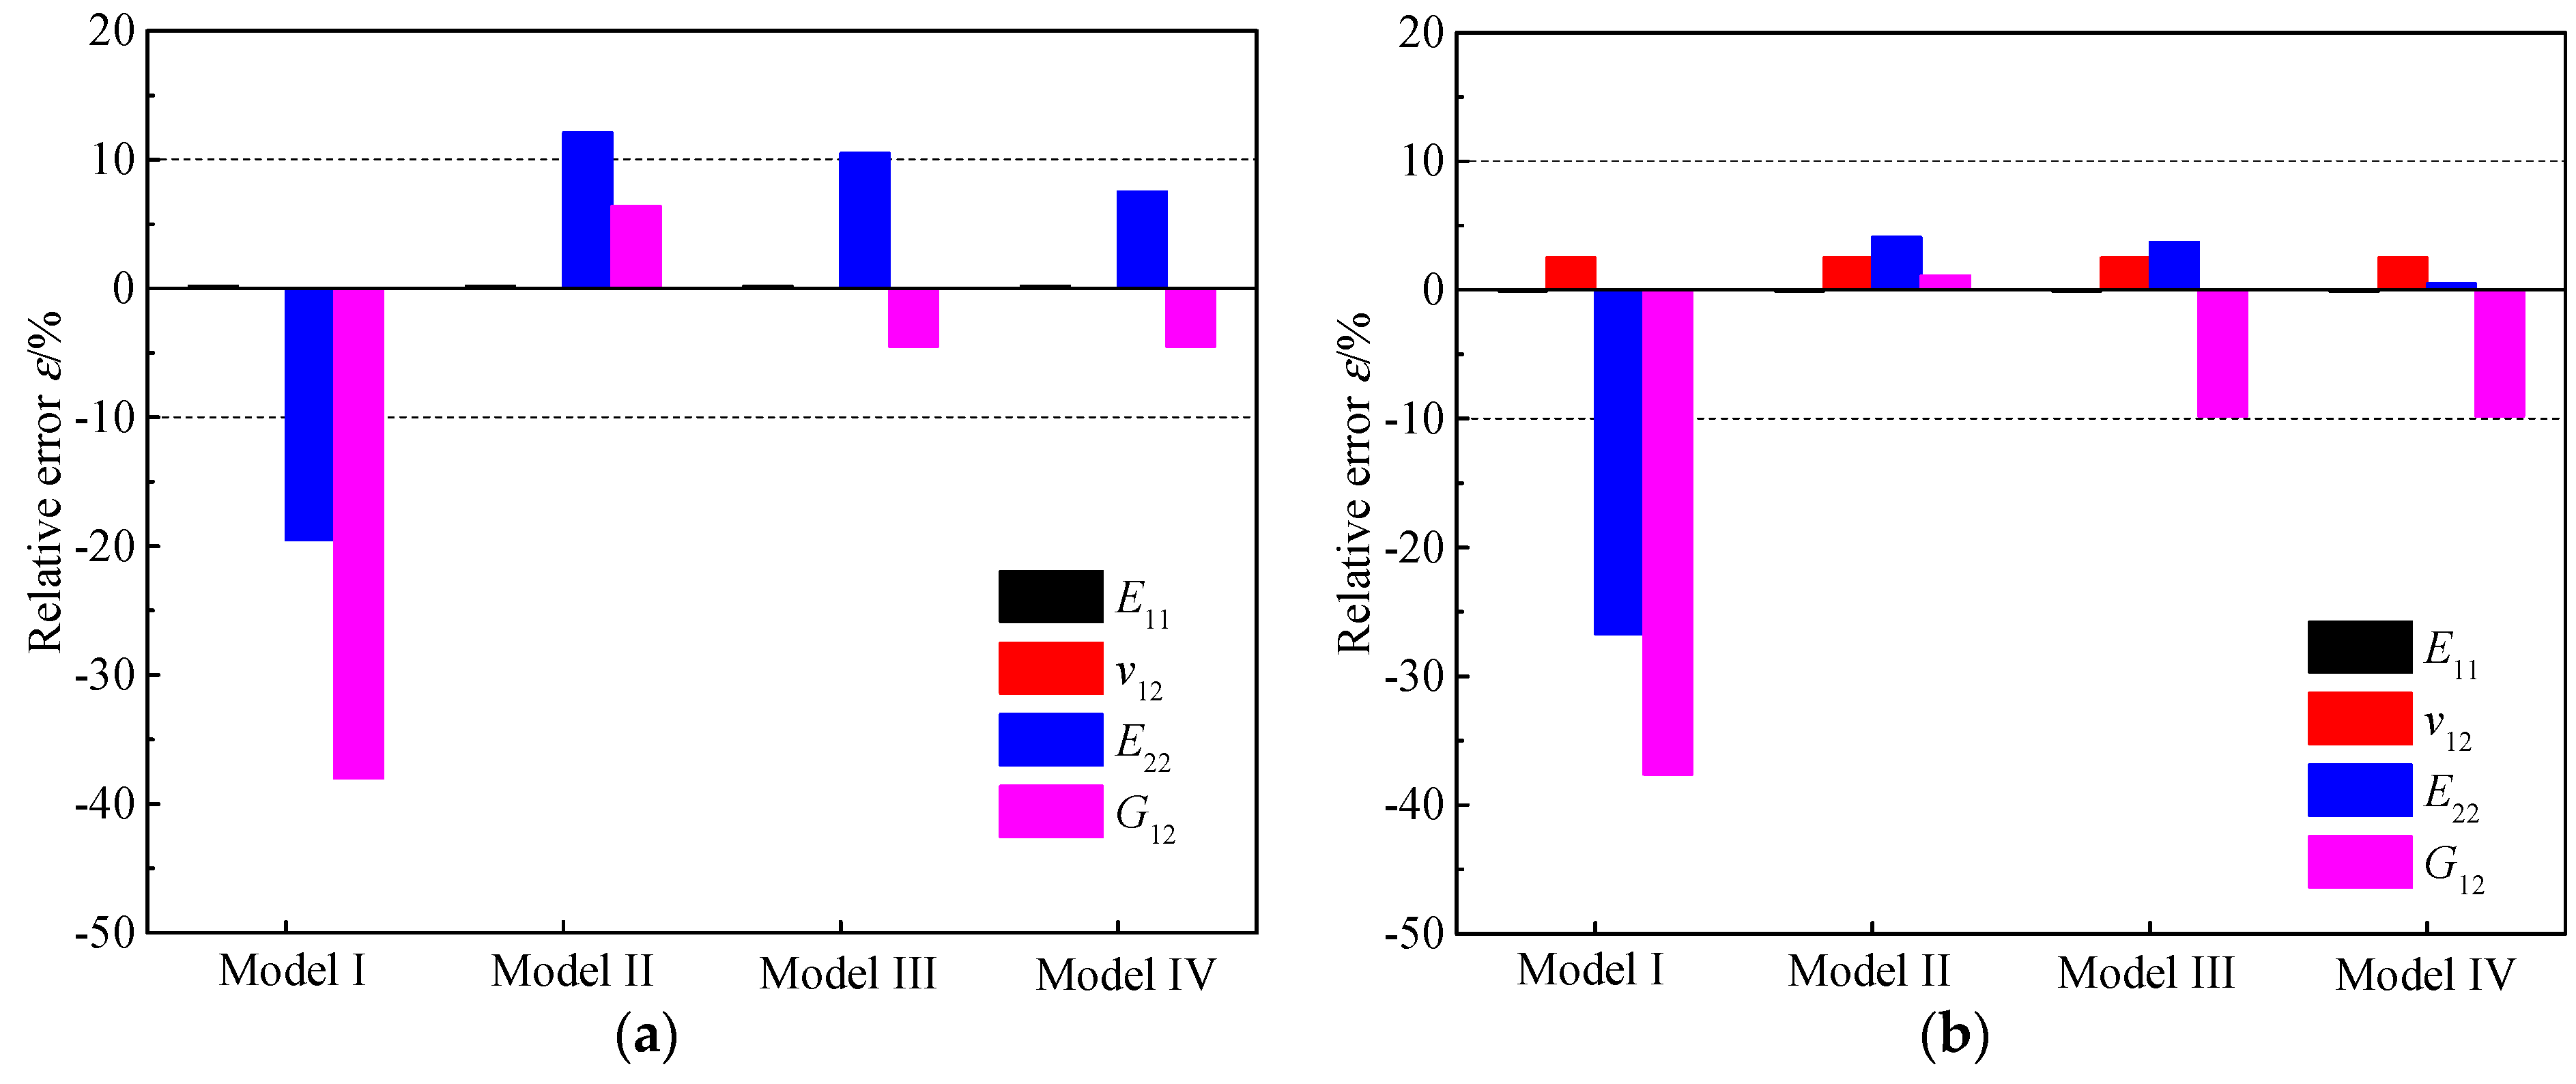
3.2. Results and Analyses
4. Predictions of Random Elastic Properties
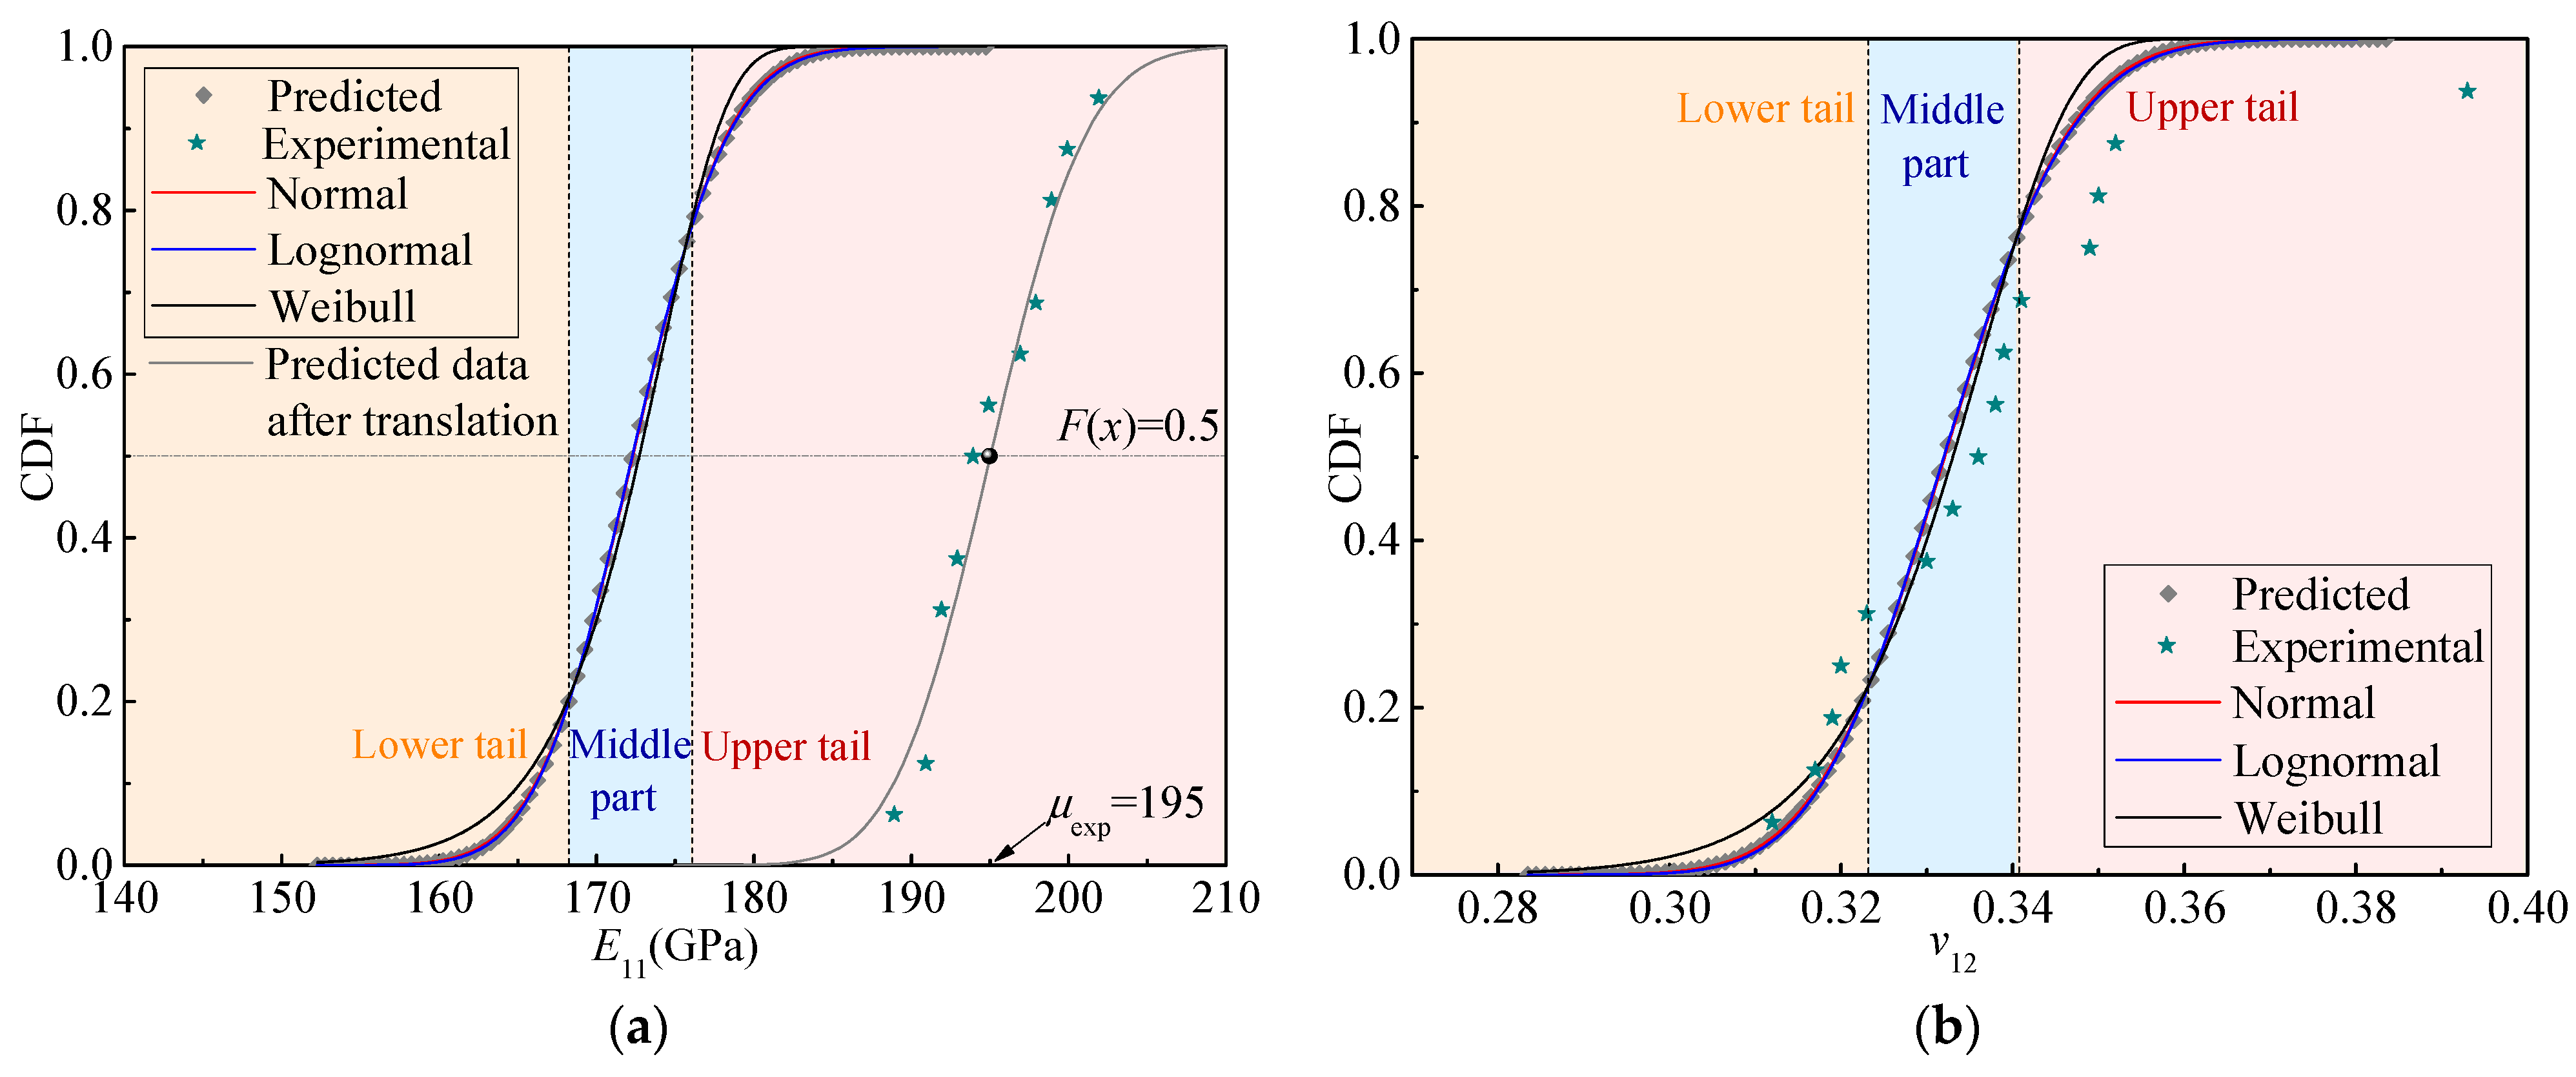
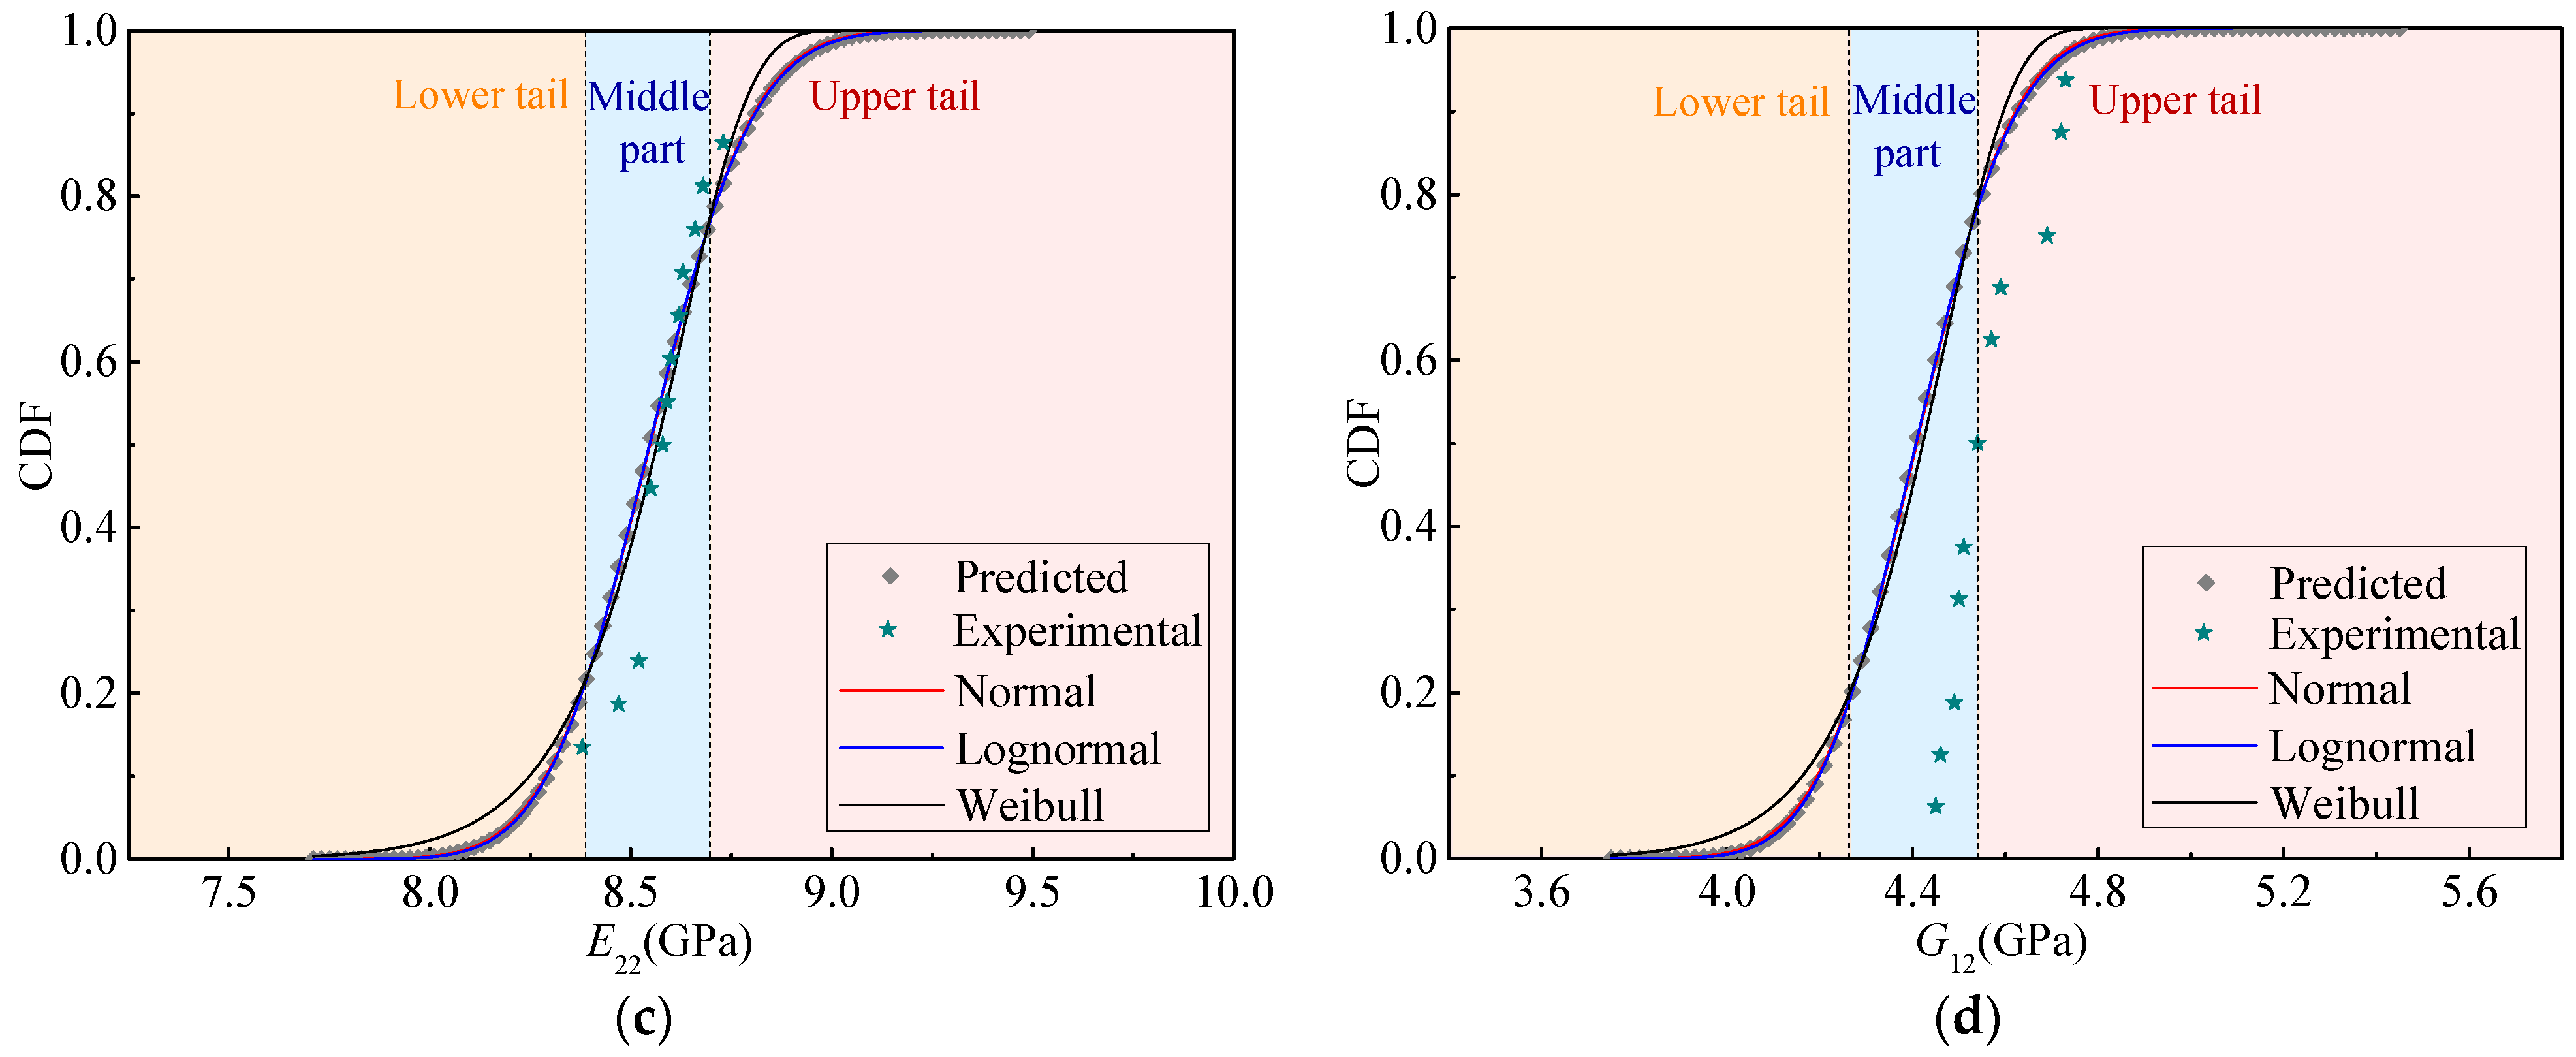
4.1. Validation
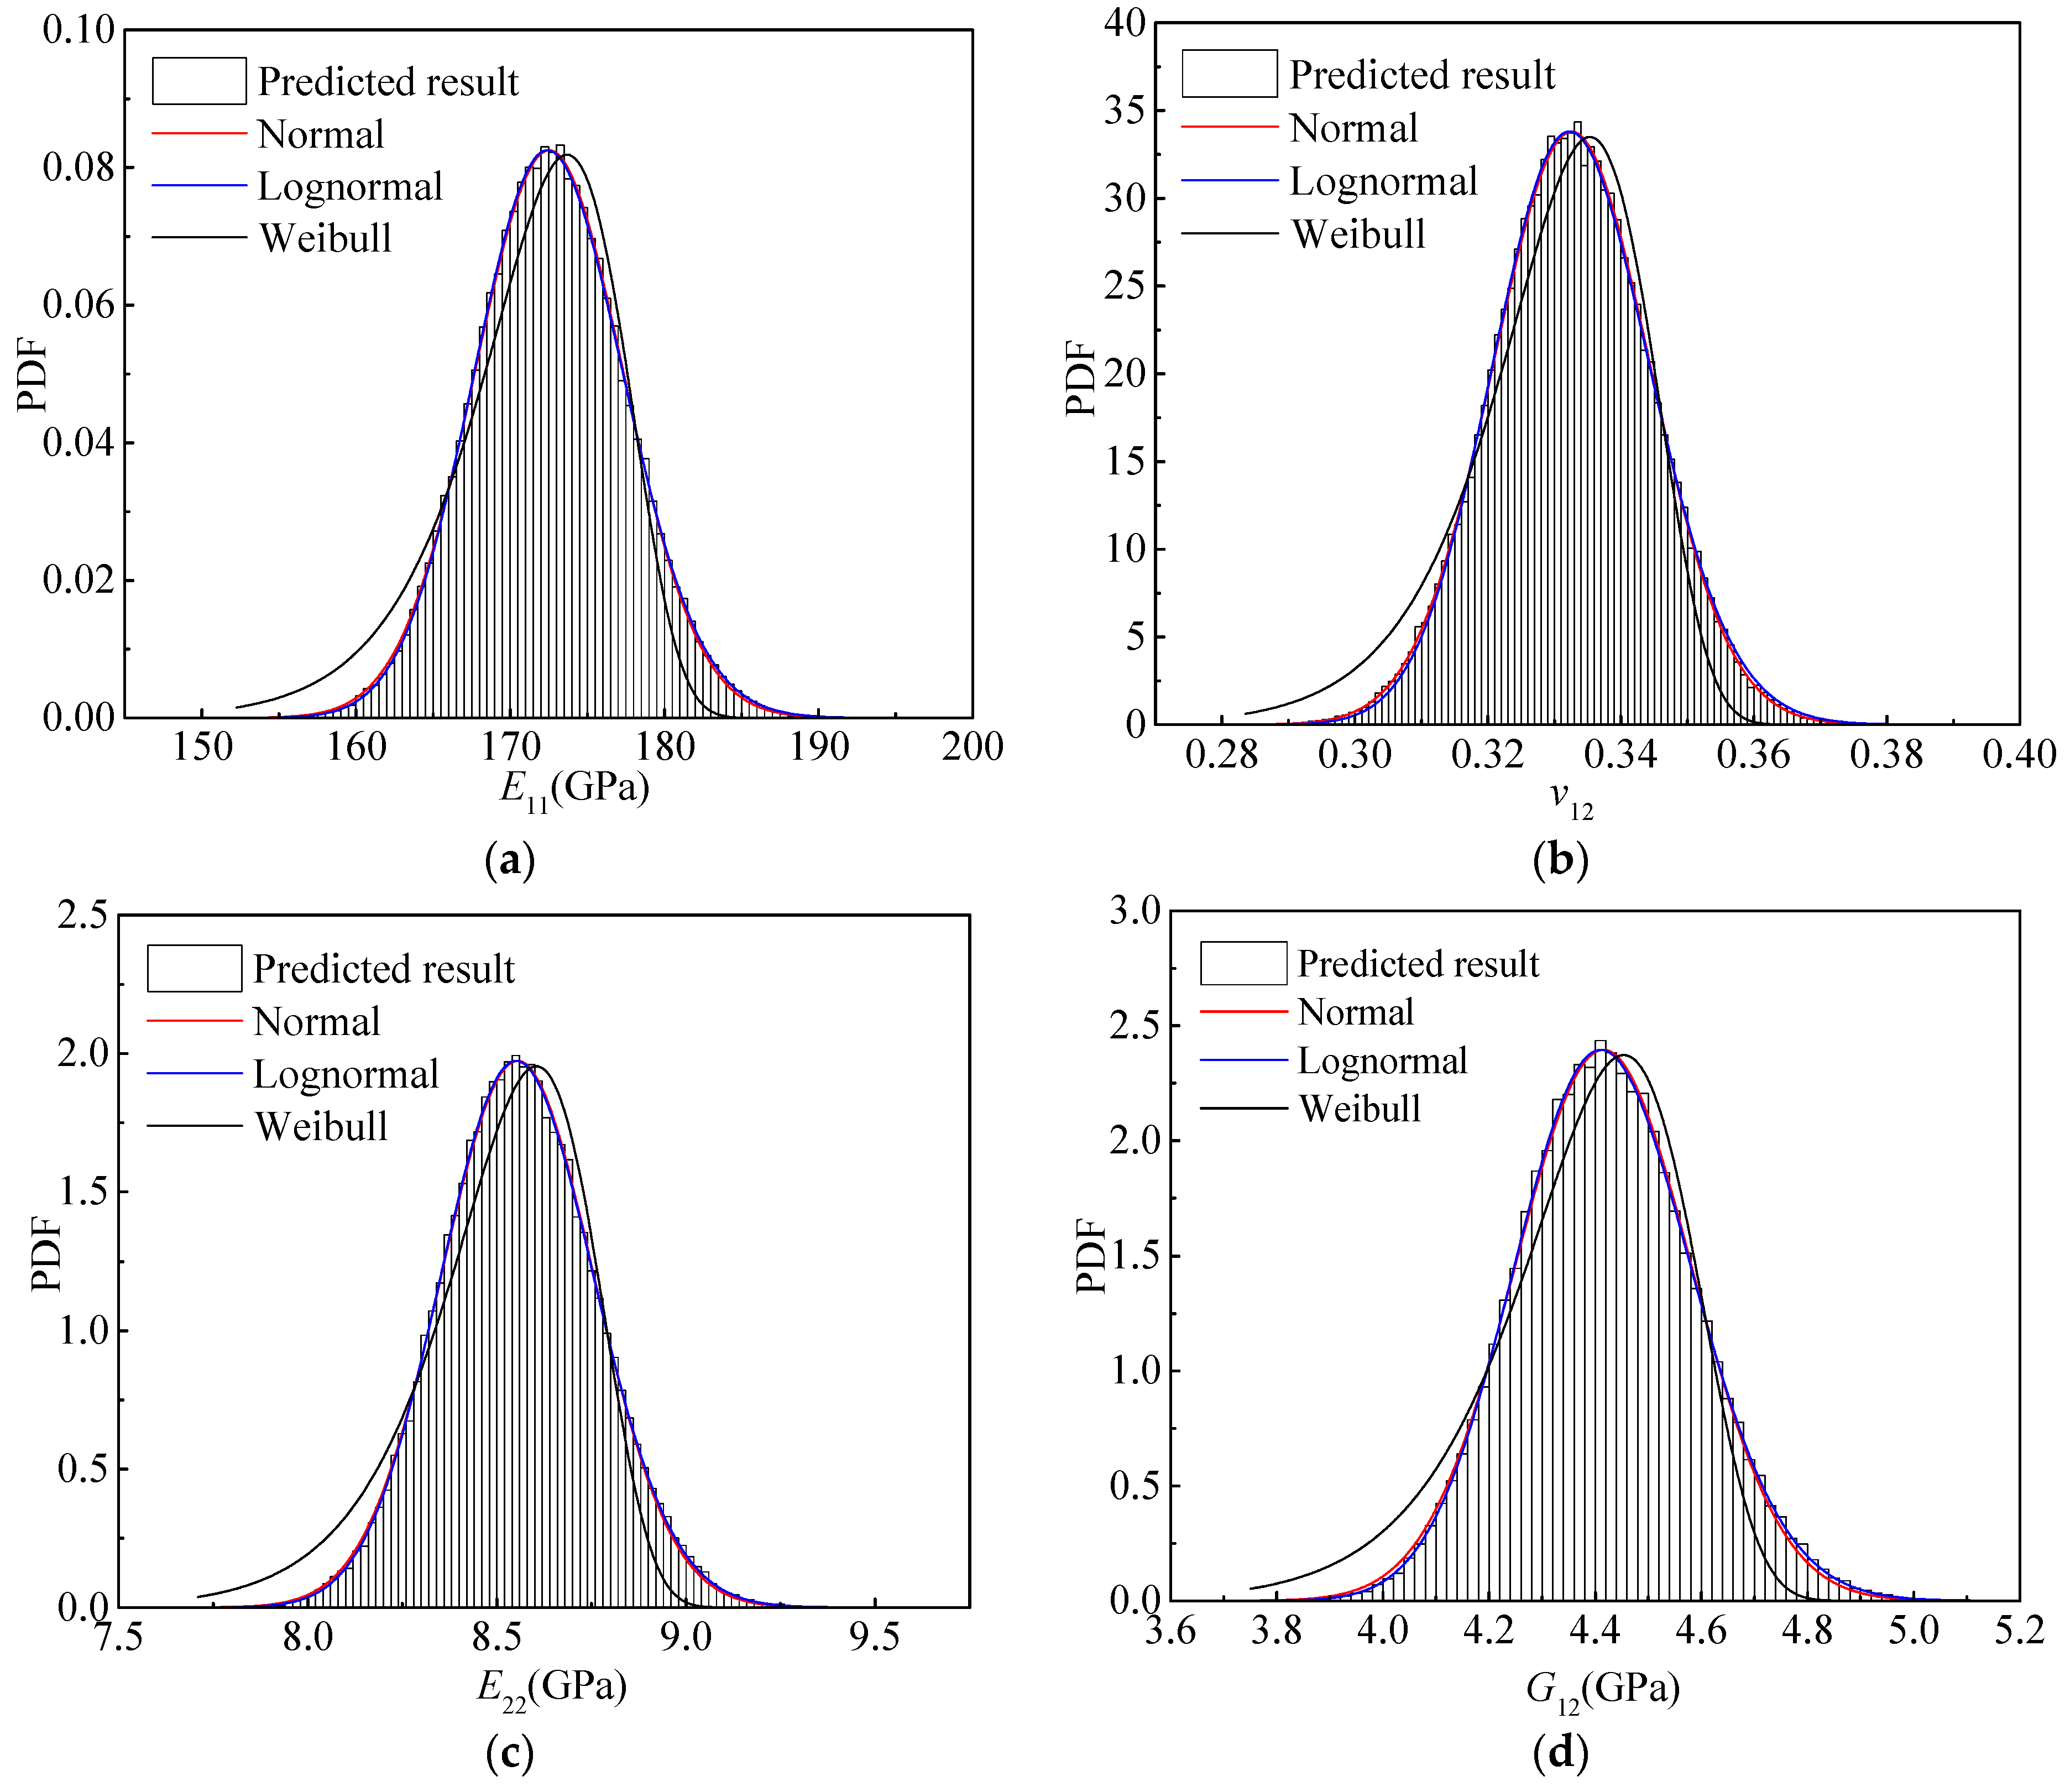
4.2. Statistics of Elastic Parameters
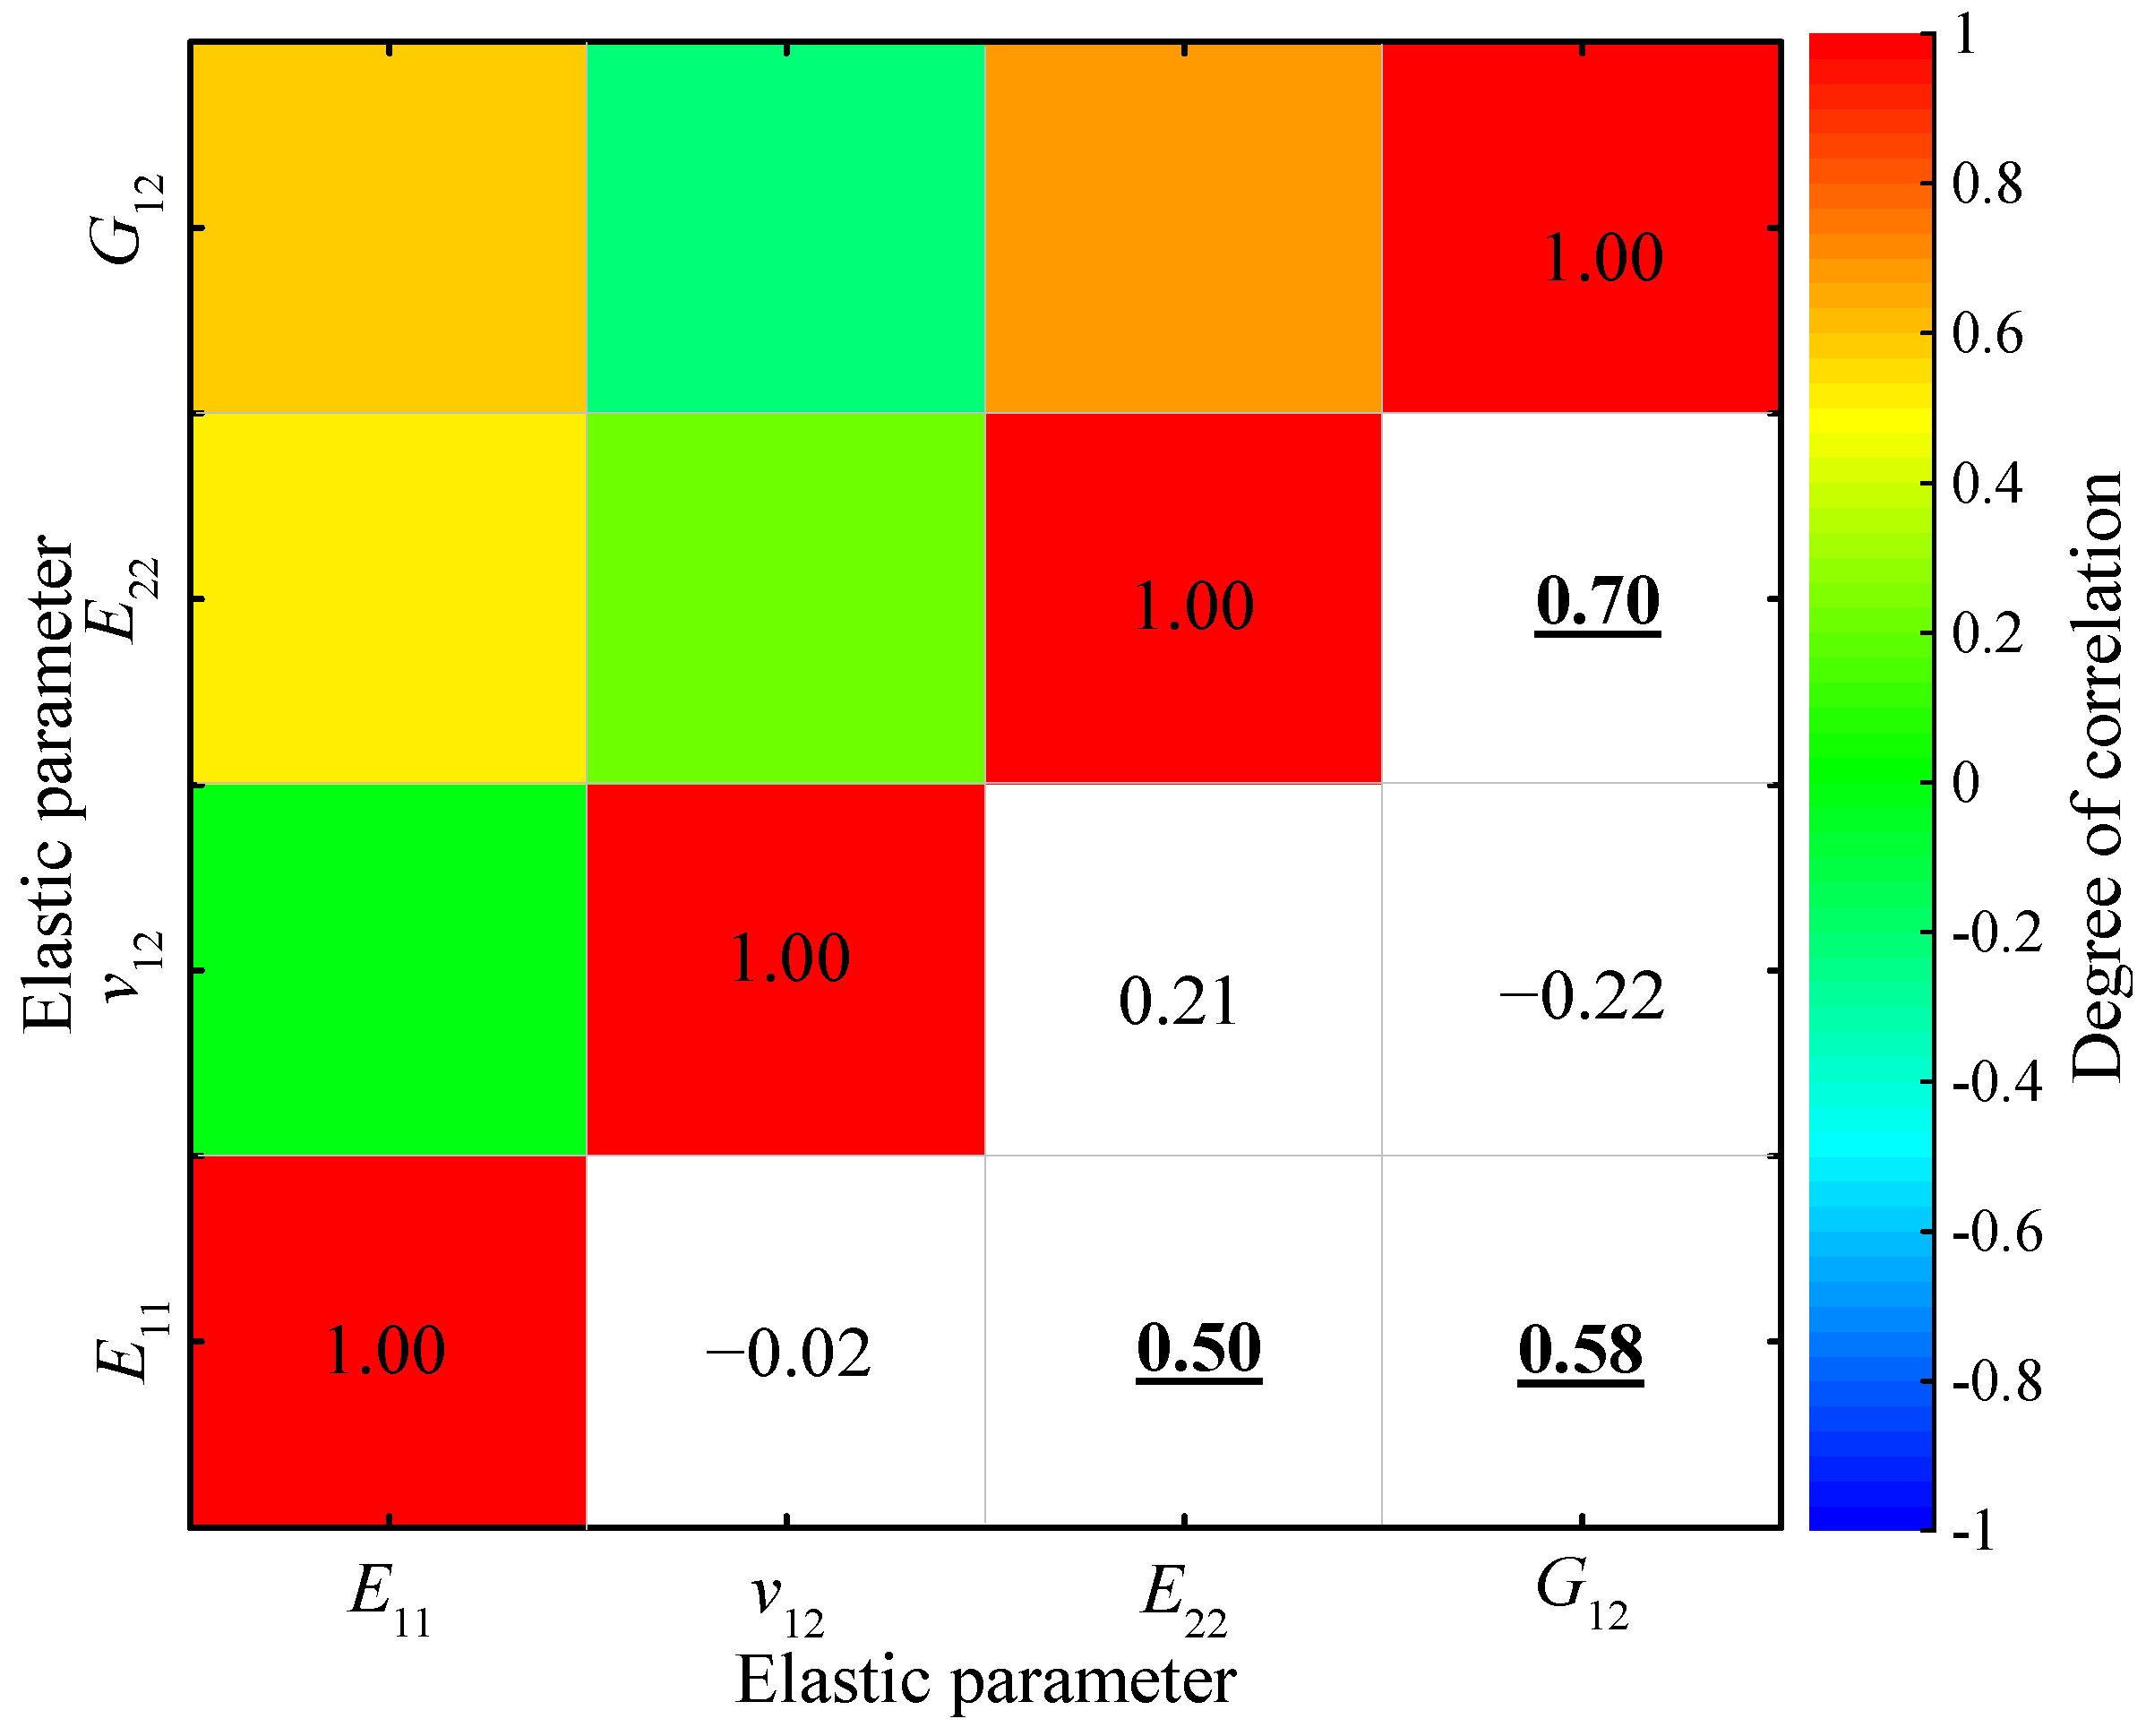
4.3. Correlation Analysis
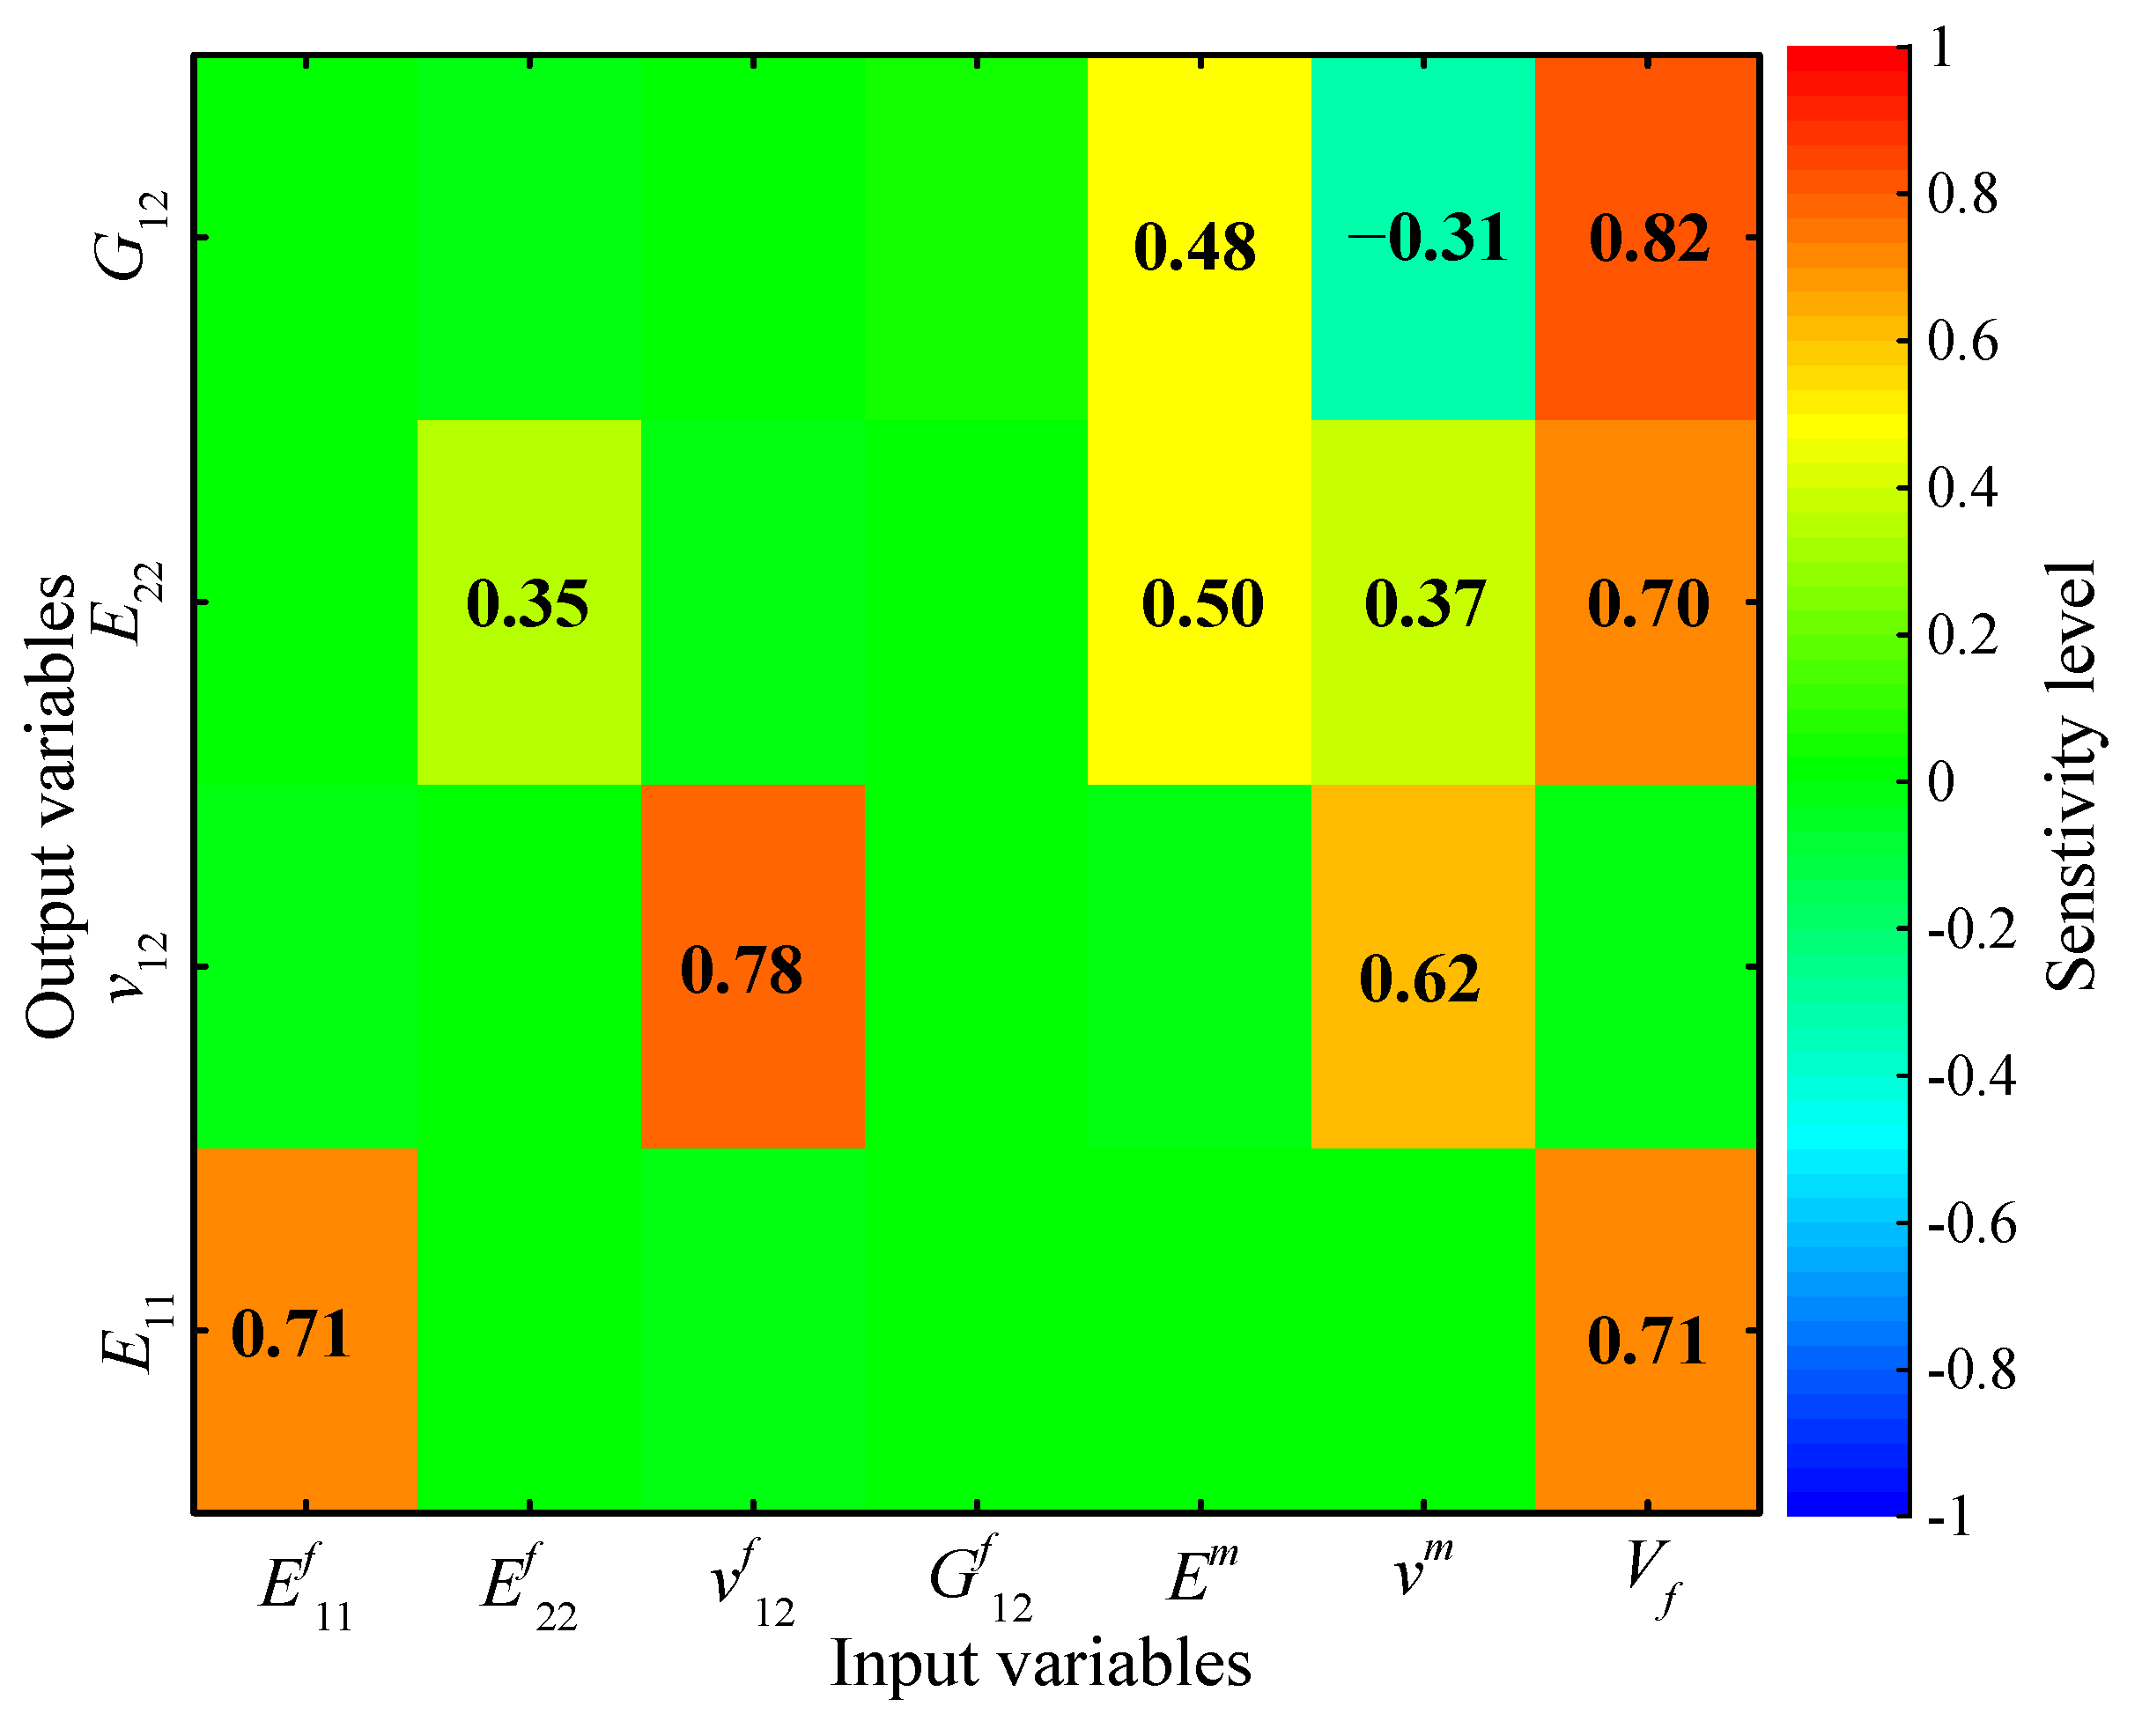
4.4. Sensitivity Analysis
5. Conclusions
Author Contributions
Funding
Institutional Review Board Statement
Informed Consent Statement
Data Availability Statement
Conflicts of Interest
References
- Sriramula, S.; Chryssanthopoulos, M.K. Quantification of uncertainty modelling in stochastic analysis of FRP composites. Compos. Part A 2009, 40, 1673–1684. [Google Scholar] [CrossRef]
- Chiachio, M.; Chiachio, J.; Rus, G. Reliability in composites—A selective review and survey of current development. Compos. Part B 2012, 43, 902–913. [Google Scholar] [CrossRef] [Green Version]
- Zhou, X.Y.; Qian, S.Y.; Wang, N.W.; Xiong, W.; Wu, W.Q. A review on stochastic multiscale analysis for FRP composite structures. Compos. Struct. 2022, 284, 115132. [Google Scholar] [CrossRef]
- Long, M.W.; Narciso, J.D. Probability Design Methodology for Composite Aircraft Structures; DOT/FAA/AR-99/2; Office of Aviation Research: Washington, DC, USA, 1999. [Google Scholar]
- Lin, K.Y.; Styuart, A.V. Probabilistic approach to damage tolerance design of aircraft composite structures. J. Aircr. 2007, 44, 1309–1317. [Google Scholar] [CrossRef] [Green Version]
- Chamis, C.C. Probabilistic simulation of multi-scale composite behavior. Appl. Fract. Mech. 2004, 41, 51–61. [Google Scholar] [CrossRef] [Green Version]
- Naskar, S.; Mukhopadhyay, T.; Sriramula, S. Spatially varying fuzzy multi-scale uncertainty propagation in unidirectional fibre reinforced composites. Compos. Struct. 2019, 209, 940–967. [Google Scholar] [CrossRef] [Green Version]
- Peng, Z.; Wang, X.; Wu, Z. Multiscale strength prediction of fiber-reinforced polymer cables based on random strength distribution. Compos. Sci. Technol. 2020, 196, 108228. [Google Scholar] [CrossRef]
- Sánchez-Heres, L.F.; Ringsberg, J.W.; Johnson, E. Influence of mechanical and probabilistic models on the reliability estimates of fibre-reinforced cross-ply laminates. Struct. Saf. 2014, 51, 35–46. [Google Scholar] [CrossRef]
- Gadade, A.M.; Lal, A.; Singh, B.N. Stochastic buckling and progressive failure of layered composite plate with random material properties under hygro-thermo-mechanical loading. Mater. Today Commun. 2020, 22, 100824. [Google Scholar] [CrossRef]
- An, H.; Youn, B.D.; Kim, H.S. Reliability-based design optimization of laminated composite structures under delamination and material property uncertainties. Inter. J. Mech. Sci. 2021, 205, 106561. [Google Scholar] [CrossRef]
- Sharma, N.; Nishad, M.; Maiti, D.K.; Sunny, M.R.; Singh, B.N. Uncertainty quantification in buckling strength of variable stiffness laminated composite plate under thermal loading. Compos. Struct. 2021, 275, 114486. [Google Scholar] [CrossRef]
- Lin, S.C. Reliability predictions of laminated composite plates with random system parameters. Probab. Eng. Mech. 2000, 15, 327–338. [Google Scholar] [CrossRef]
- Jeong, H.K.; Shenoi, R.A. Probabilistic strength analysis of rectangular FRP plates using Monte Carlo simulation. Comput. Struct. 2000, 76, 219–235. [Google Scholar] [CrossRef]
- Zhao, L.; Shan, M.; Liu, F.; Zhang, J. A probabilistic model for strength analysis of composite double-lap single-bolt joints. Compos. Struct. 2017, 161, 419–427. [Google Scholar] [CrossRef] [Green Version]
- Liu, F.; Shan, M.; Zhao, L.; Zhang, J. Probabilistic bolt load distribution analysis of composite single-lap multi-bolt joints considering random bolt-hole clearances and tightening torques. Compos. Struct. 2018, 194, 12–20. [Google Scholar] [CrossRef]
- Liu, F.; Fang, Z.; Zhao, L.; Zhang, J.; Hu, N. A failure-envelope-based method for the probabilistic failure prediction of composite multi-bolt double-lap joints. Compos. Part B 2019, 172, 593–602. [Google Scholar] [CrossRef]
- Sepahvand, K.; Marburg, S. Identification of composite uncertain material parameters from experimental modal data. Probab. Eng. Mech. 2014, 37, 148–153. [Google Scholar] [CrossRef]
- Shaw, A.; Sriramula, S.; Gosling, P.D.; Chryssanthopoulos, M.K. A critical reliability evaluation of fibre reinforced composite materials based on probabilistic micro and macro-mechanical analysis. Compos. Part B 2010, 41, 446–453. [Google Scholar] [CrossRef]
- Smarslok, B.P.; Haftka, R.T.; Ifju, P.G. Correlation model for composite elastic properties using only measurements from a single specimen. Probab. Eng. Mech. 2012, 29, 64–69. [Google Scholar] [CrossRef]
- Zhang, S.; Zhang, C.; Chen, X. Effect of statistical correlation between ply mechanical properties on reliability of fibre reinforced plastic composite structures. J. Compos. Mater. 2015, 49, 2935–2945. [Google Scholar] [CrossRef]
- Lee, S.P.; Jin, J.W.; Kang, K.W. Probabilistic analysis for mechanical properties of glass/epoxy composites using homogenization method and Monte Carlo simulation. Renew. Energy 2014, 65, 219–226. [Google Scholar] [CrossRef]
- Mustafa, G.; Suleman, A.; Crawford, C. Probabilistic micromechanical analysis of composite material stiffness properties for a wind turbine blade. Compos. Struct. 2015, 131, 905–916. [Google Scholar] [CrossRef]
- Mustafa, G.; Suleman, A.; Crawford, C. Probabilistic first ply failure prediction of composite laminates using a multi-scale M-SaF and Bayesian inference approach. J. Compos. Mater. 2018, 52, 169–195. [Google Scholar] [CrossRef]
- Jin, J.W.; Jeon, B.W.; Choi, C.W.; Kang, K.W. Multi-scale probabilistic analysis for the mechanical properties of plain weave carbon/epoxy composites using the homogenization technique. Appl. Sci. 2020, 10, 6542. [Google Scholar] [CrossRef]
- Bhattacharyya, R.; Mahadevan, S.; Basu, P.K. Computationally efficient multiscale modeling for probabilistic analysis of CFRP composites with micro-scale spatial randomness. Compos. Struct. 2022, 280, 114884. [Google Scholar] [CrossRef]
- Pitchai, P.; Jha, N.K.; Nair, R.G.; Guruprasad, P.J. A coupled framework of variational asymptotic method based homogenization technique and Monte Carlo approach for the uncertainty and sensitivity analysis of unidirectional composites. Compos. Struct. 2021, 263, 113656. [Google Scholar] [CrossRef]
- Lezgy-Nazargah, M. A micromechanics model for effective coupled thermo-electro-elastic properties of macro fiber composites with interdigitated electrodes. J. Mech. 2015, 31, 183–199. [Google Scholar] [CrossRef]
- Lezgy-Nazargah, M.; Eskandari-Naddaf, H. Effective coupled thermo-electro-mechanical properties of piezoelectric structural fiber composites: A micromechanical approach. J. Intel. Mater. Syst. Struct. 2018, 29, 496–513. [Google Scholar] [CrossRef]
- Tsai, S.W.; Hahn, H.T. Introduction to Composite Materials; Technomic Publishing Co.: Westport, CT, USA, 1980. [Google Scholar]
- Halpin, J.C.; Kardos, J.L. Halpin-Tsai equations–Review. Polym. Eng. Sci. 1976, 16, 344–352. [Google Scholar]
- Chamis, C.C. Mechanics of composite materials: Past, present and future. J. Compos. Technol. Res. 1989, 11, 3–14. [Google Scholar]
- Huang, Z.M. Micromechanical prediction of ultimate strength of transversely isotropic fibrous composites. Inter. J. Solids. Struct. 2001, 38, 4147–4172. [Google Scholar] [CrossRef]
- Toft, H.S.; Branner, K.; Mishnaevsky, L., Jr.; Sørensen, J.D. Uncertainty modelling and code calibration for composite materials. J. Compos. Mater. 2013, 47, 1729–1747. [Google Scholar] [CrossRef]
- Alazwari, M.A.; Rao, S.S. Modeling and analysis of composite laminates in the presence of uncertainties. Compos. Part B 2019, 161, 107–120. [Google Scholar] [CrossRef]
- Hopkins, D.A.; Chamis, C.C. A Unique Set of Micromechanics Equations for High Temperature Metal Matrix Composites. NASA TM 87154. In Proceedings of the First Symposium on Testing Technology of Metal Matrix Composites Sponsored by ASTM, Nashville, TN, USA, 18–20 November 1985. [Google Scholar]
- Christensen, R.M. Tensor transformation and failure criteria for analysis of fiber composite materials. J. Compos. Mater. 1988, 22, 874–897. [Google Scholar] [CrossRef]
- Mayes, J.S.; Hansen, A.C. Composite laminate failure analysis using multicontinuum theory. Compos. Sci. Technol. 2004, 64, 379–394. [Google Scholar] [CrossRef]
- Li, Y.; Liu, F.R. A micromechanics based method for obtaining transverse mechanical properties of fibers. Compos. Part B Eng. 2015, 58, 241–246. [Google Scholar]
- Zhao, L.; Li, Y.; Zhang, J.; Zhou, L.; Hu, N. A novel material degradation model for unidirectional CFRP composites. Compos. Part B 2018, 135, 84–94. [Google Scholar] [CrossRef]
- Soden, P.D.; Hinton, M.J.; Kaddour, A.S. Lamina properties, lay-up configurations and loading conditions for a range of fibre-reinforced composite laminates. Compos. Sci. Technol. 1998, 58, 1011–1022. [Google Scholar] [CrossRef]
- Hyer, M.W.; Waas, A.M. Micromechanics of Linear Elastic Continuous Fiber Composites; WCB/McGraw-Hill: New York, NY, USA, 1999. [Google Scholar]
- Huang, Z.M. Simulation of the mechanical properties of fibrous composites by the bridging micromechanics model. Compos. Part A 2001, 32, 143–172. [Google Scholar] [CrossRef]
- Huang, Z.M. Correlation of the bridging model predictions of the biaxial failure strengths of fibrous laminates with experiments. Compos. Sci. Technol. 2004, 64, 529–548. [Google Scholar] [CrossRef]
- Huang, Z.M.; Zhang, C.C.; Xue, Y.D. Stiffness prediction of short fiber reinforced composites. Inter. J. Mech. Sci. 2019, 161–162, 105068. [Google Scholar] [CrossRef]
- Shiao, M.C.; Chamis, C.C. Probabilistic evaluation of fuselage-type composite structures. Probab. Eng. Mech. 1999, 14, 179–187. [Google Scholar] [CrossRef]


| Title | Fiber Volume Fraction | Elastic Properties of the Fiber | Elastic Properties of the Matrix | ||||
|---|---|---|---|---|---|---|---|
| AS4/3501−6 [38] | 0.60 | 207.5 | 25 | 95 | 0.240 | 4.5 | 0.34 |
| T300/BSL914C [39] | 0.60 | 227 | 25 | 28 | 0.245 | 4.0 | 0.35 |
| T800/X850 [40] | 0.58 | 295 | 17.1 | 40.9 | 0.32 | 3.52 | 0.35 |
| Random Variable | Mean | COV | Distribution Type |
|---|---|---|---|
| (GPa) | 295 | 0.02 | Normal |
| (GPa) | 17.1 | 0.02 | Normal |
| (GPa) | 40.9 | 0.02 | Normal |
| 0.32 | 0.05 | Normal | |
| (GPa) | 3.52 | 0.02 | Normal |
| 0.35 | 0.05 | Normal | |
| 0.58 | 0.02 | Normal |
| Random Variable | Normal Distribution | Lognormal Distribution | Weibull Distribution | ||||||
|---|---|---|---|---|---|---|---|---|---|
| μ | σ | Adj. R2 | μ | σ | Adj. R2 | λ | κ | Adj. R2 | |
| E11 (GPa) | 172 | 4.83 | 0.99999 | 5.15 | 0.028 | 1.00000 | 174 | 42.10 | 0.99760 |
| v12 | 0.33 | 0.012 | 1.00000 | −1.10 | 0.036 | 0.99997 | 0.34 | 33.12 | 0.99781 |
| E22 (GPa) | 8.55 | 0.202 | 0.99998 | 2.15 | 0.024 | 1.00000 | 8.63 | 49.85 | 0.99736 |
| G12 (GPa) | 4.41 | 0.167 | 0.99996 | 1.48 | 0.038 | 1.00000 | 4.47 | 31.19 | 0.99771 |
Publisher’s Note: MDPI stays neutral with regard to jurisdictional claims in published maps and institutional affiliations. |
© 2022 by the authors. Licensee MDPI, Basel, Switzerland. This article is an open access article distributed under the terms and conditions of the Creative Commons Attribution (CC BY) license (https://creativecommons.org/licenses/by/4.0/).
Share and Cite
Shan, M.; Zhao, L.; Ye, J. A Novel Micromechanics-Model-Based Probabilistic Analysis Method for the Elastic Properties of Unidirectional CFRP Composites. Materials 2022, 15, 5090. https://doi.org/10.3390/ma15155090
Shan M, Zhao L, Ye J. A Novel Micromechanics-Model-Based Probabilistic Analysis Method for the Elastic Properties of Unidirectional CFRP Composites. Materials. 2022; 15(15):5090. https://doi.org/10.3390/ma15155090
Chicago/Turabian StyleShan, Meijuan, Libin Zhao, and Jinrui Ye. 2022. "A Novel Micromechanics-Model-Based Probabilistic Analysis Method for the Elastic Properties of Unidirectional CFRP Composites" Materials 15, no. 15: 5090. https://doi.org/10.3390/ma15155090
APA StyleShan, M., Zhao, L., & Ye, J. (2022). A Novel Micromechanics-Model-Based Probabilistic Analysis Method for the Elastic Properties of Unidirectional CFRP Composites. Materials, 15(15), 5090. https://doi.org/10.3390/ma15155090