
Investigation on the Air Permeability and Pore Structure of Concrete Subjected to Carbonation under Compressive Stress


Abstract
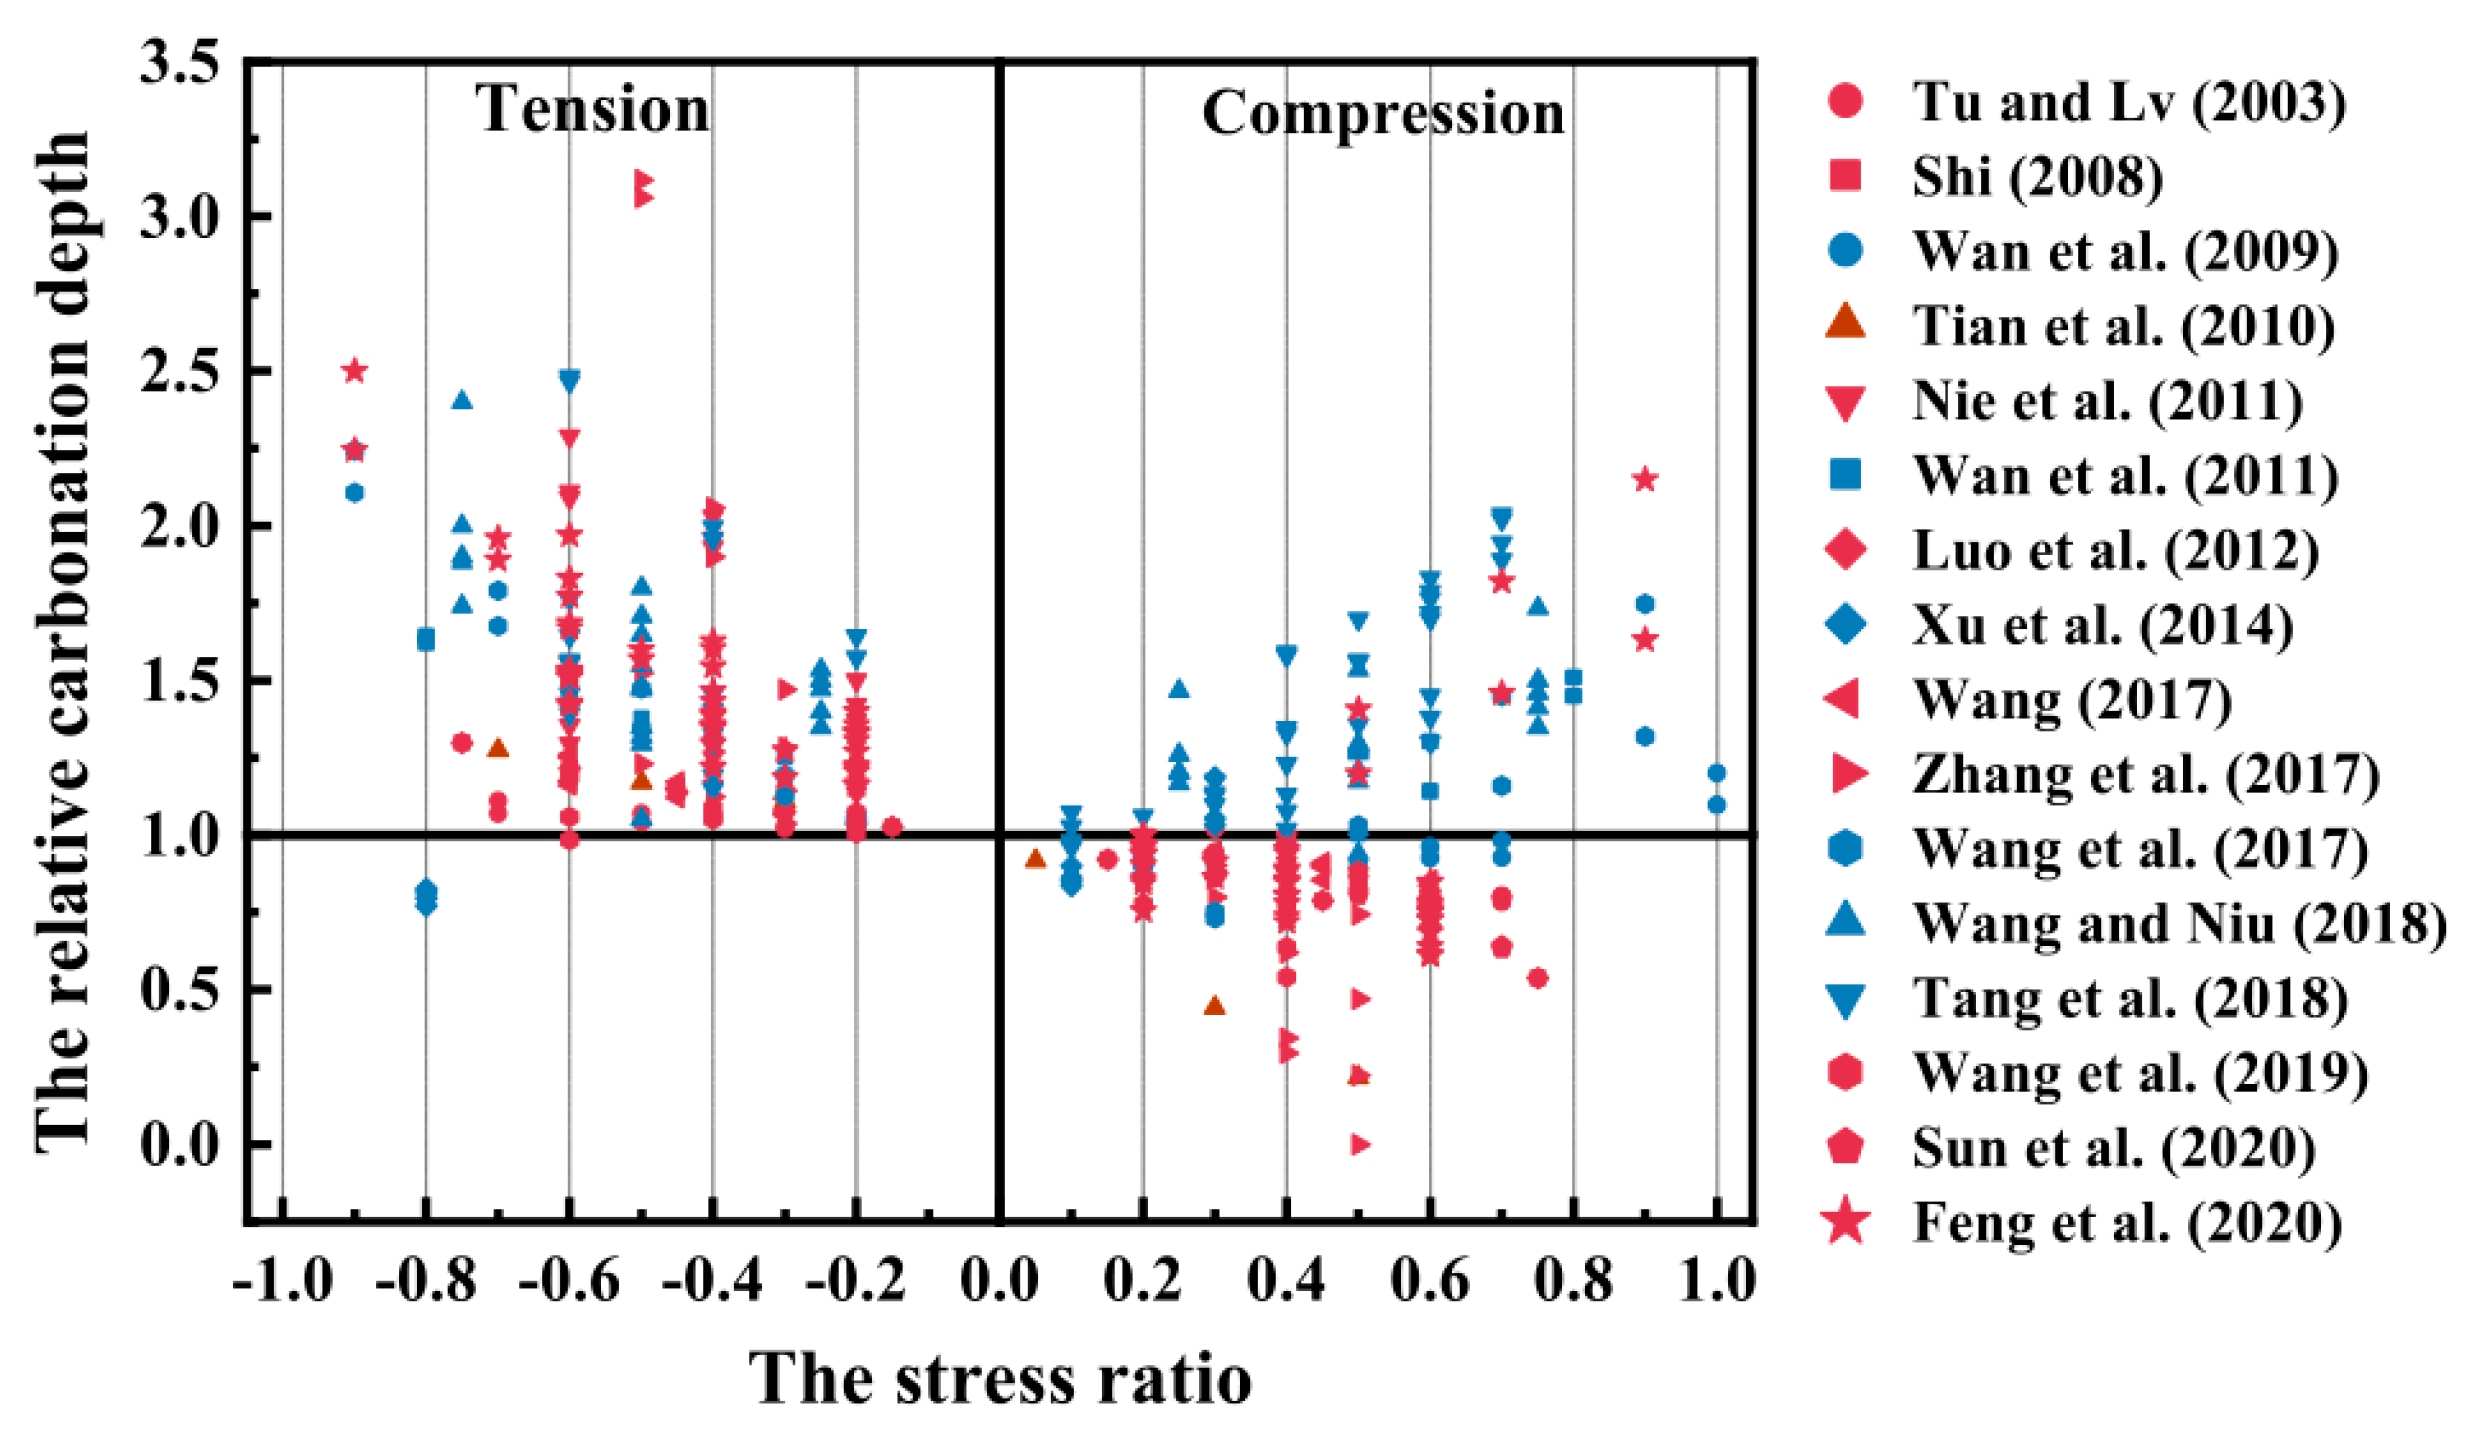
:1. Introduction
2. Materials and Methods
2.1. Raw Materials
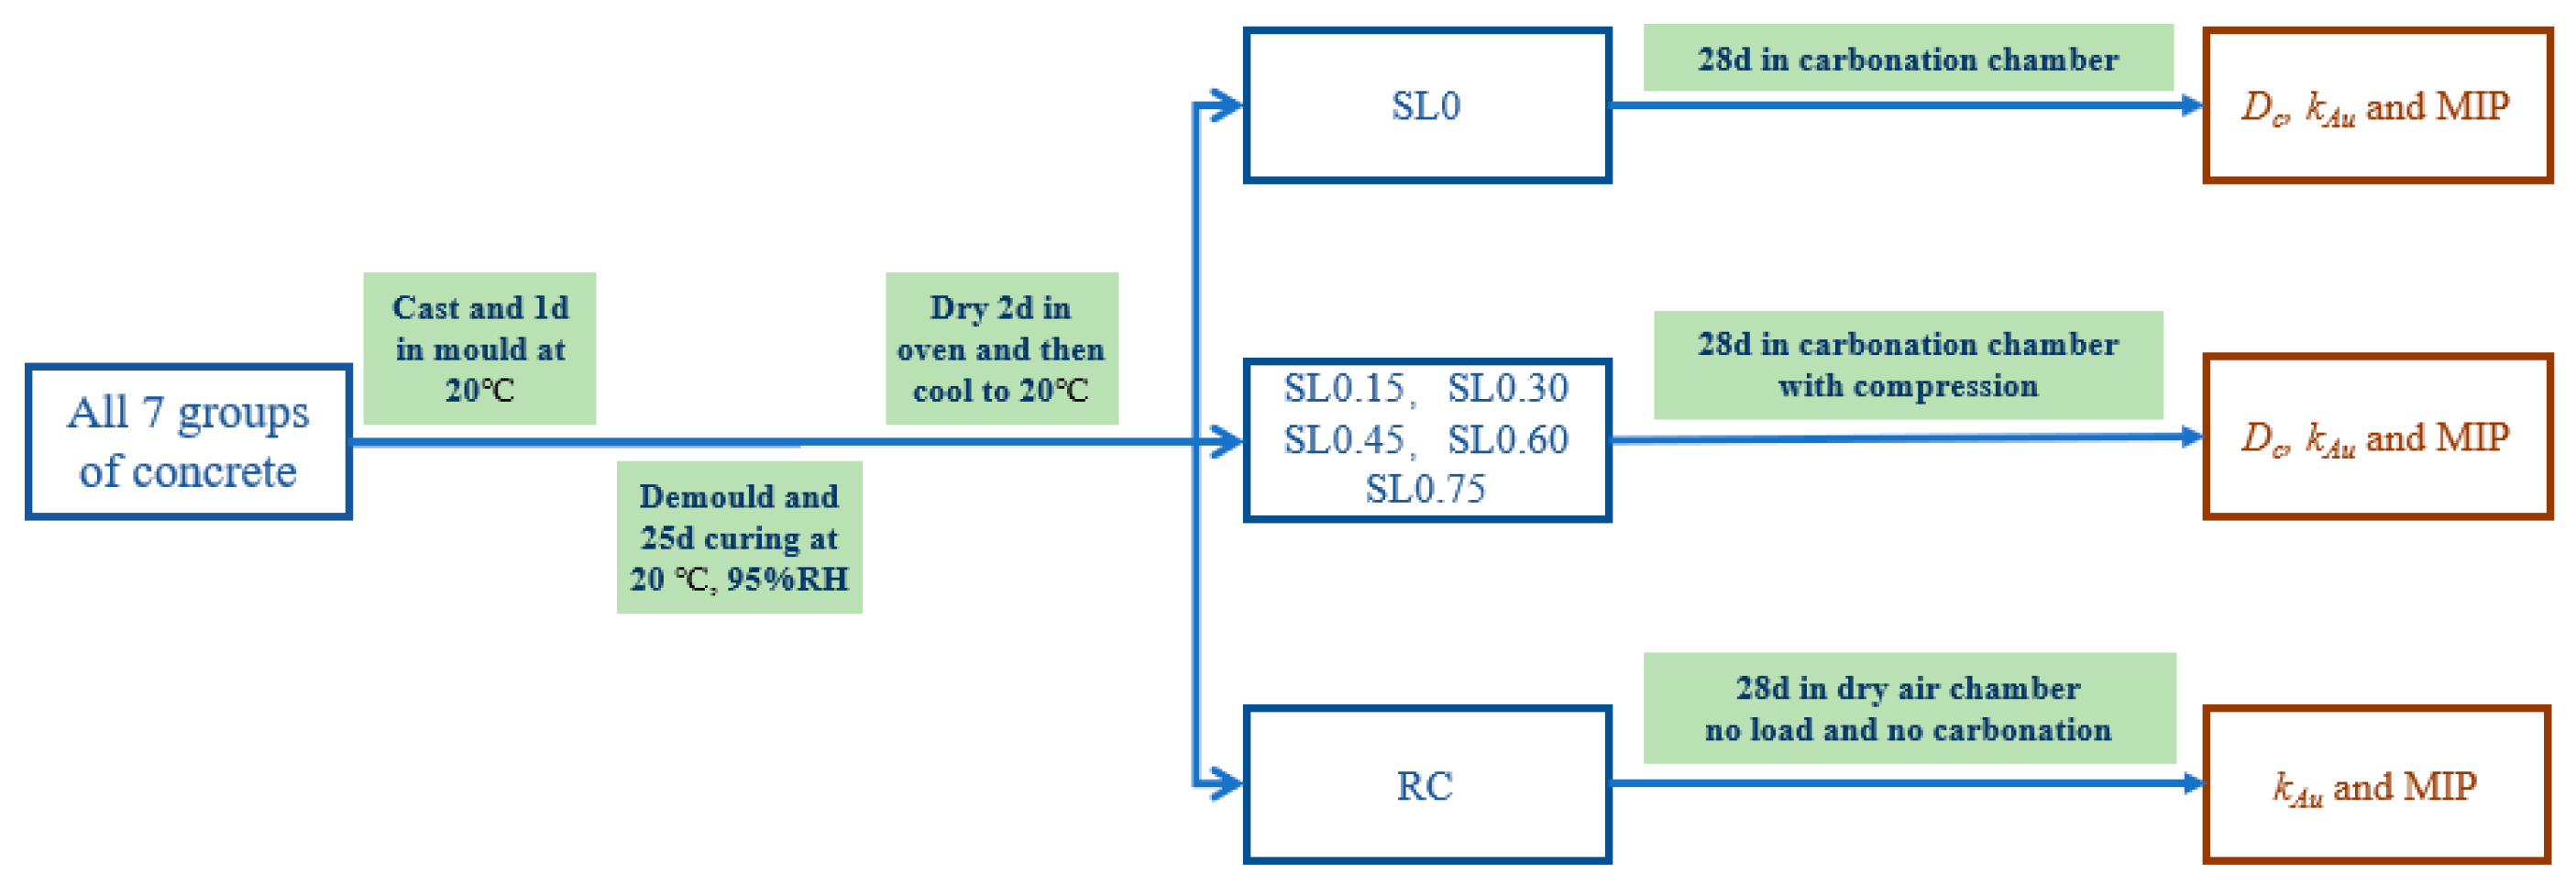
2.2. Mix Proportion and Concrete Specimens
2.3. Test Devices
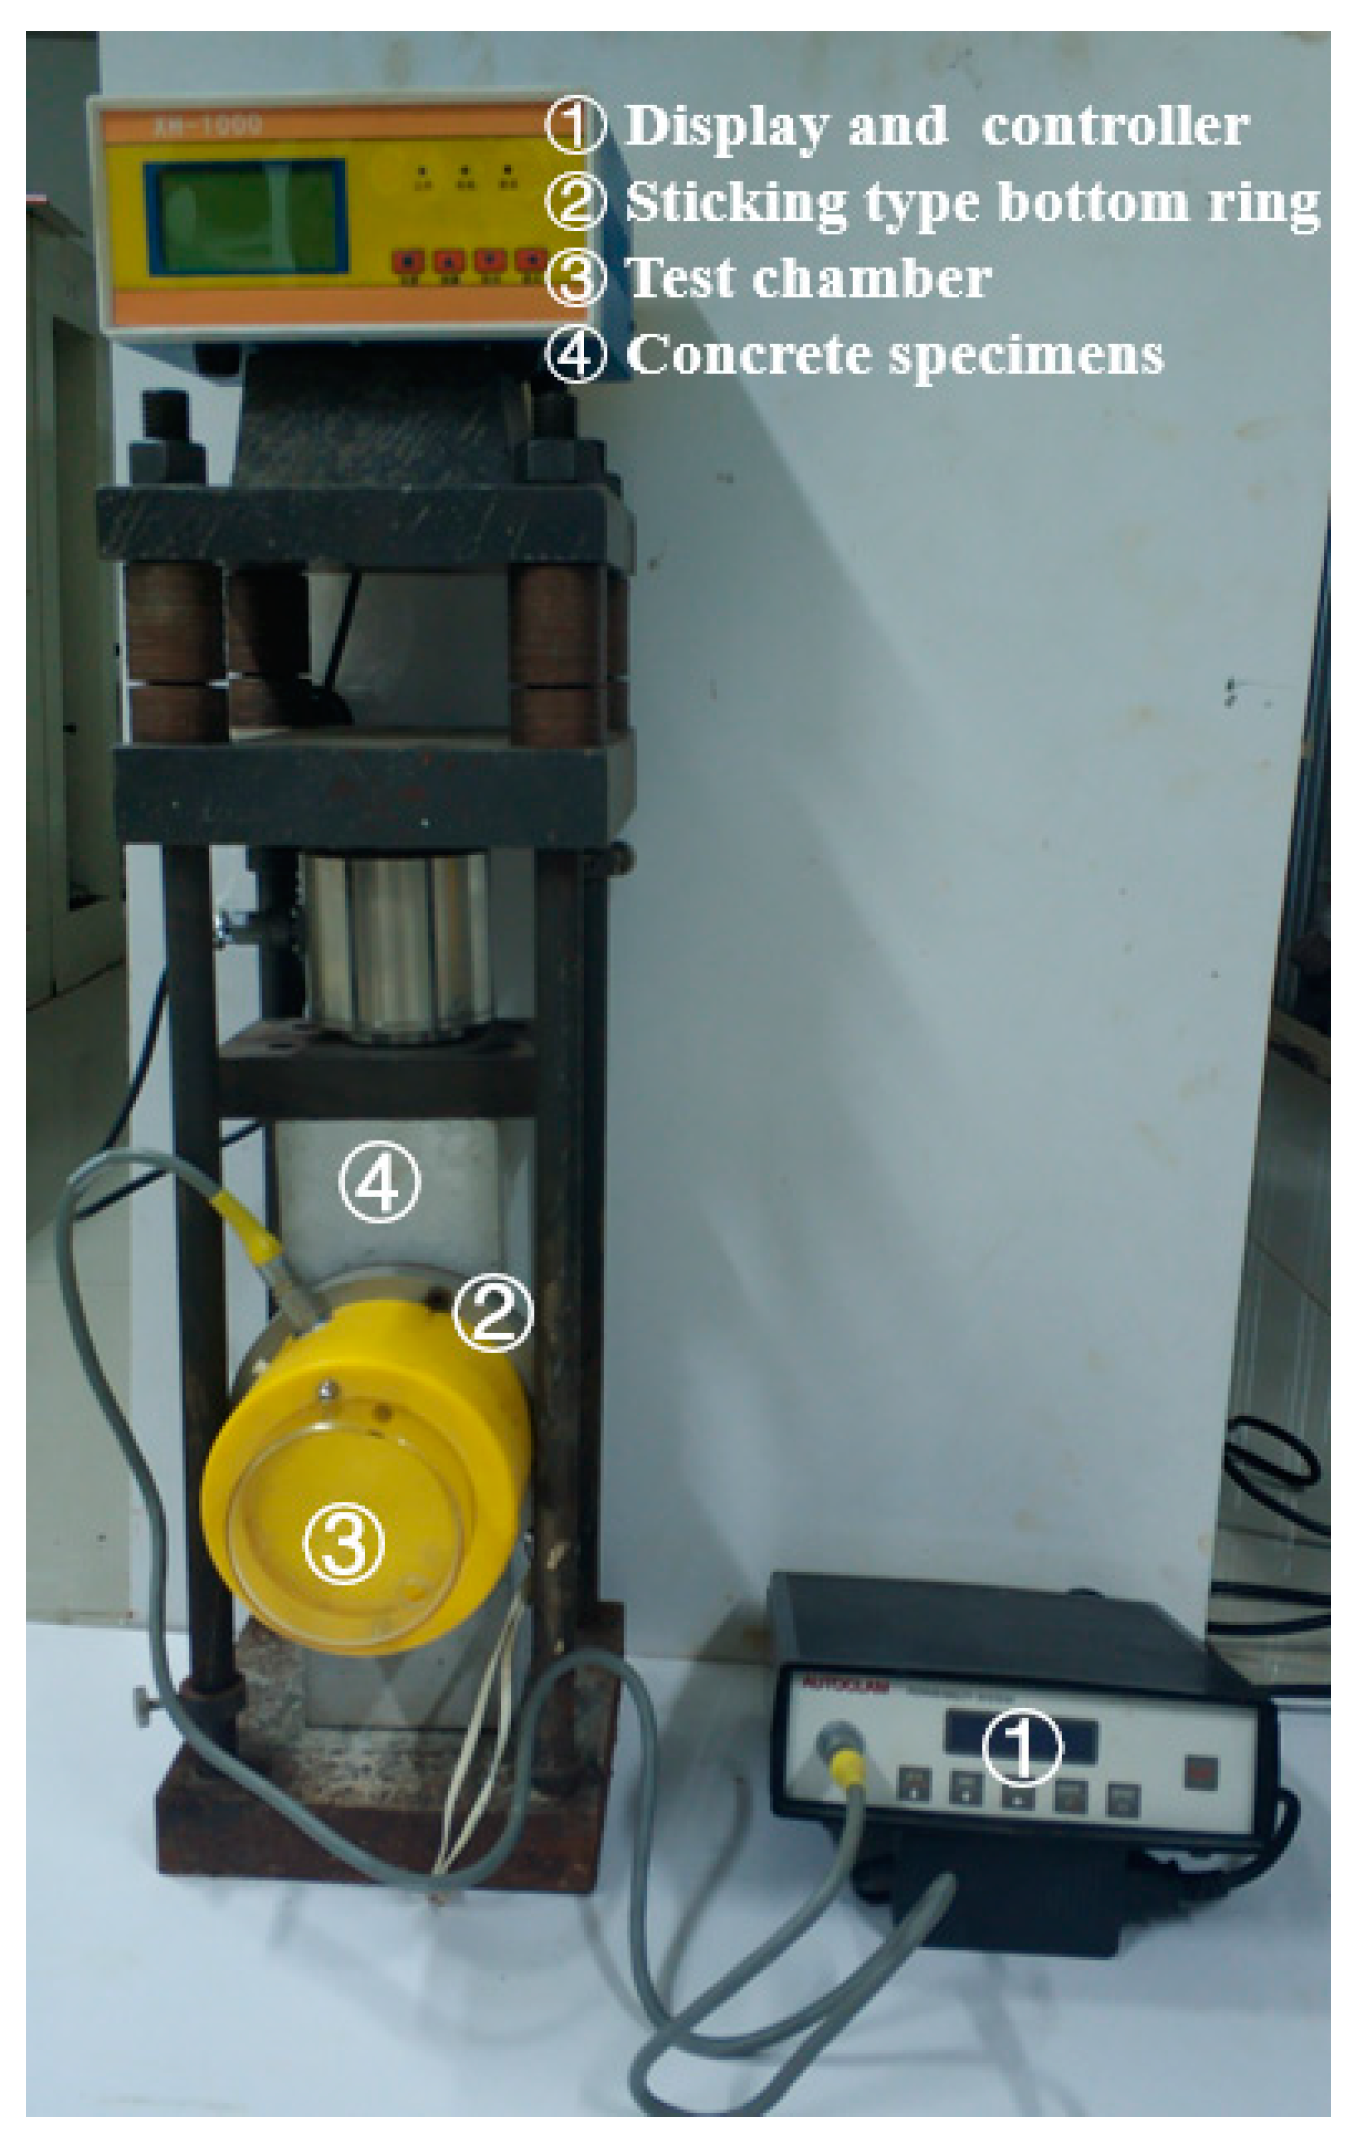
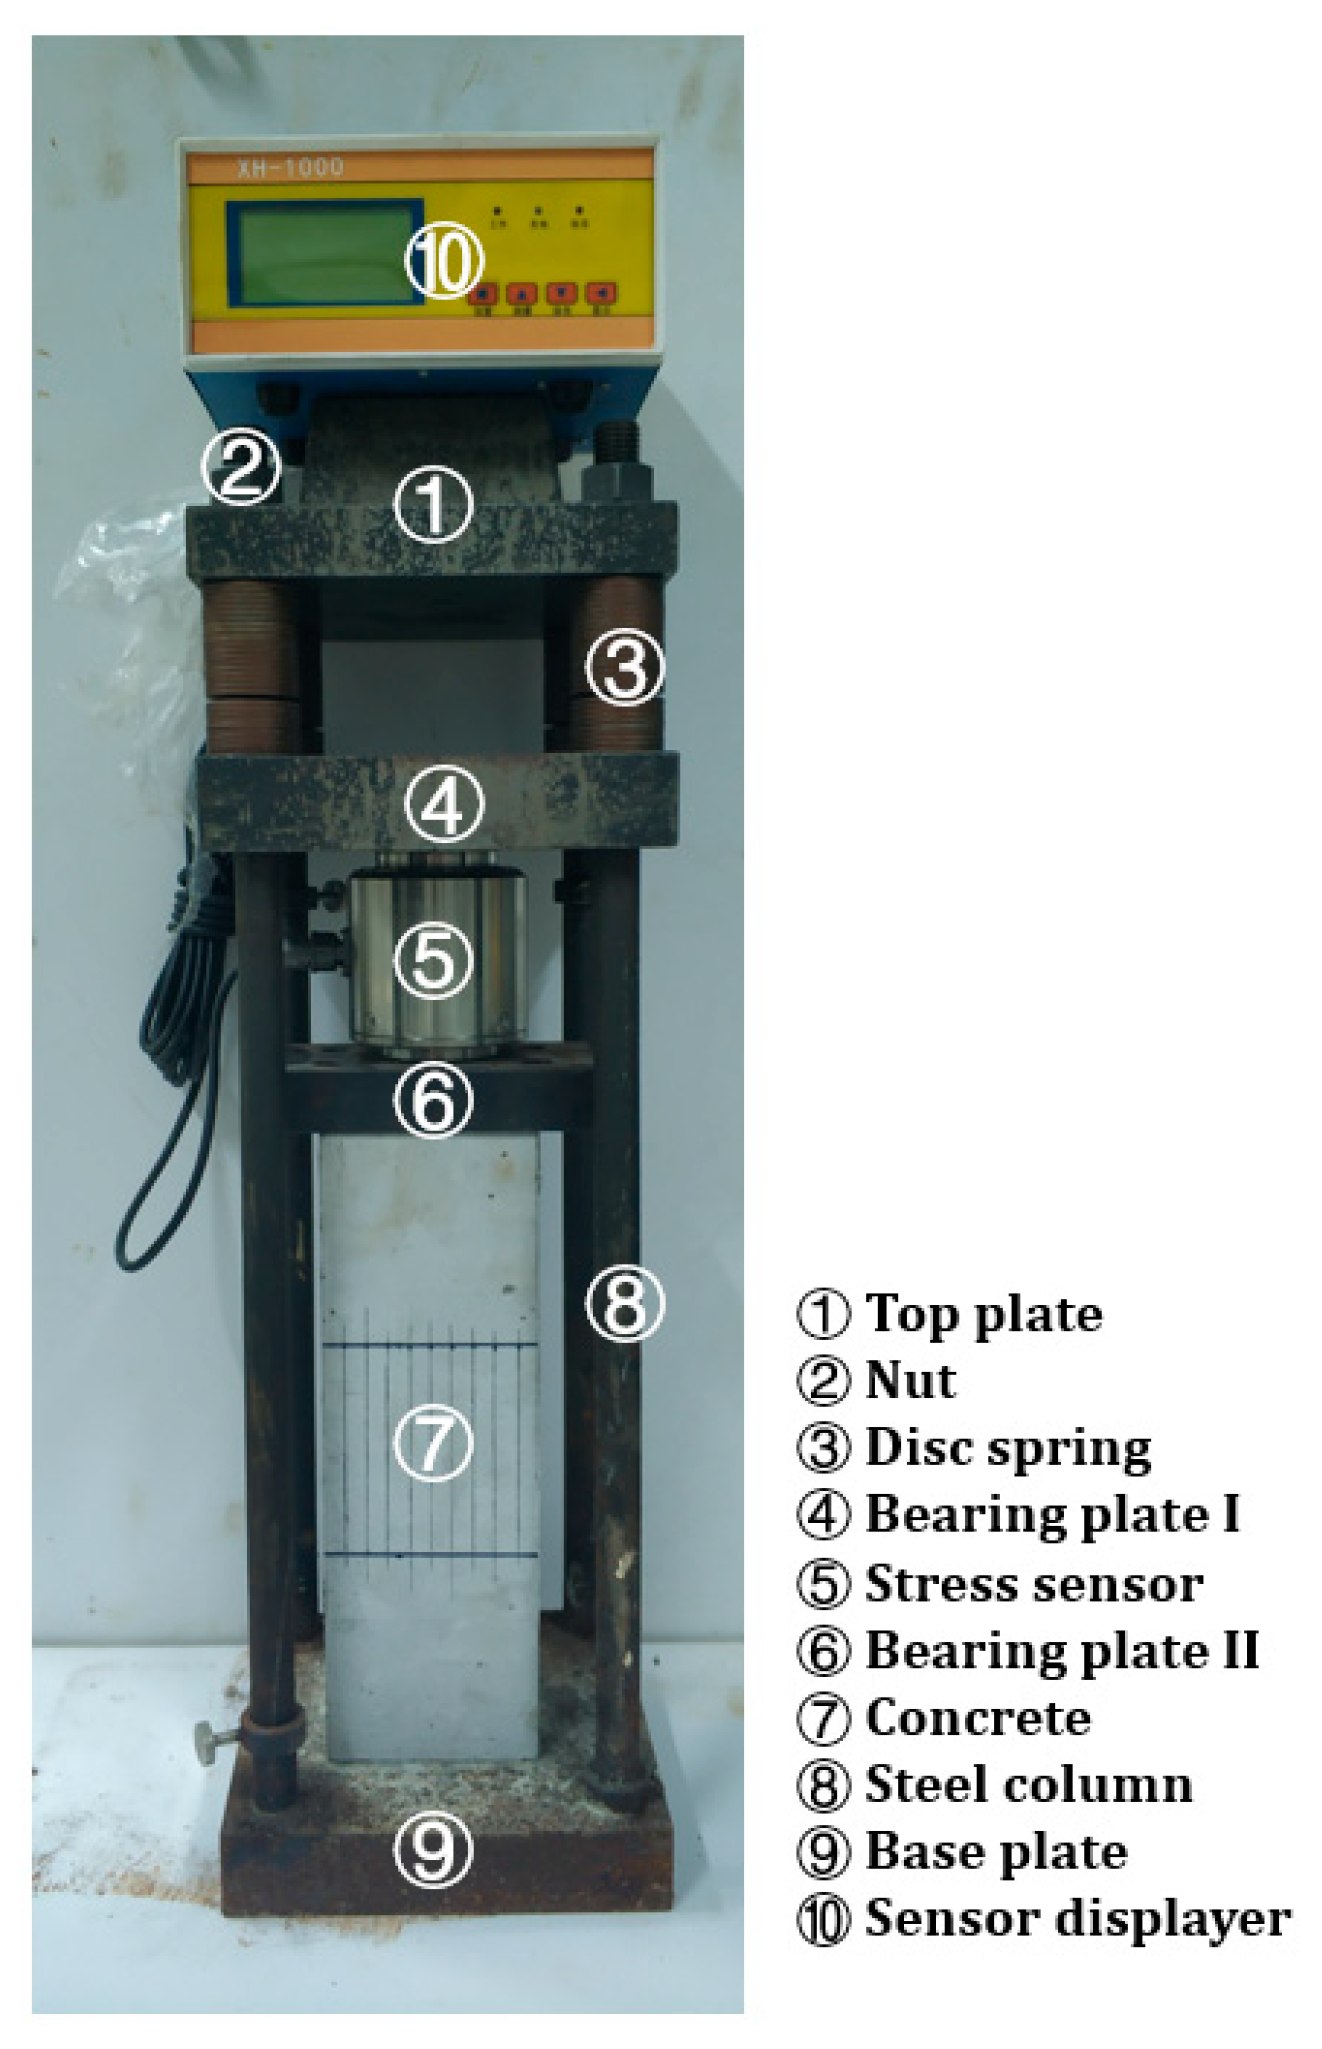
2.3.1. Compression Test Rigs
2.3.2. Autoclam Test System
2.3.3. Mercury Injection Apparatus
2.4. Test Procedure
2.4.1. Accelerated Carbonation and Compression
- ①
- Carbonation depth (DC)
- ②
- Pore structural parameters
2.4.2. Comparison Test without Carbonation and Compression
3. Test Results and Discussion
3.1. Air Permeability Coefficient and Carbonation Depth of Concrete
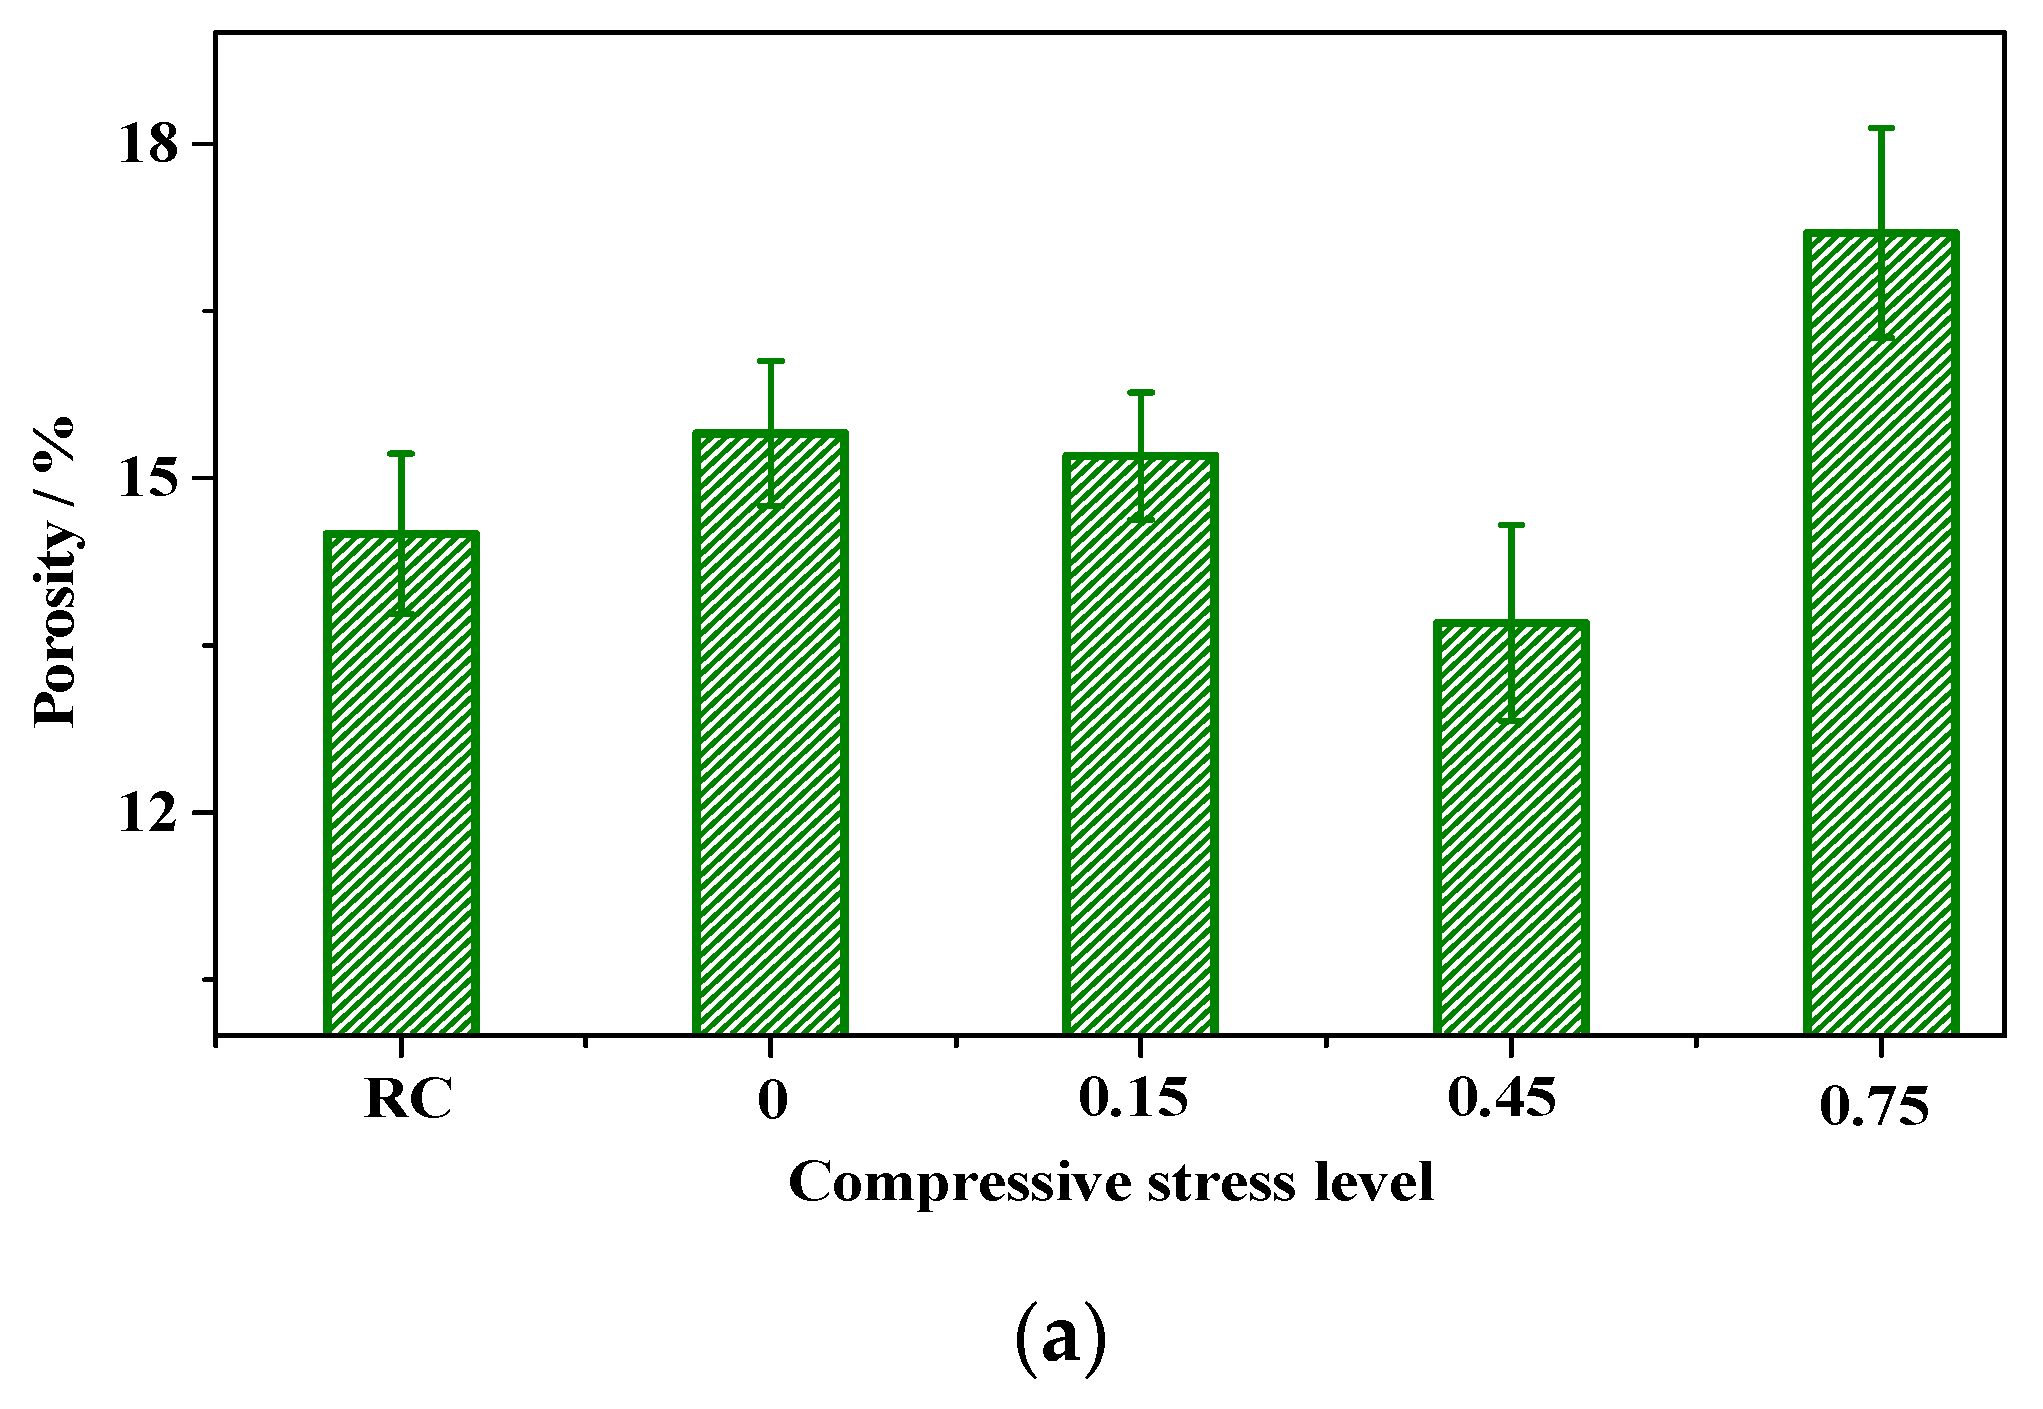
3.2. The Change in Pore Structure of Concrete
3.2.1. Accelerated Carbonation and Compression
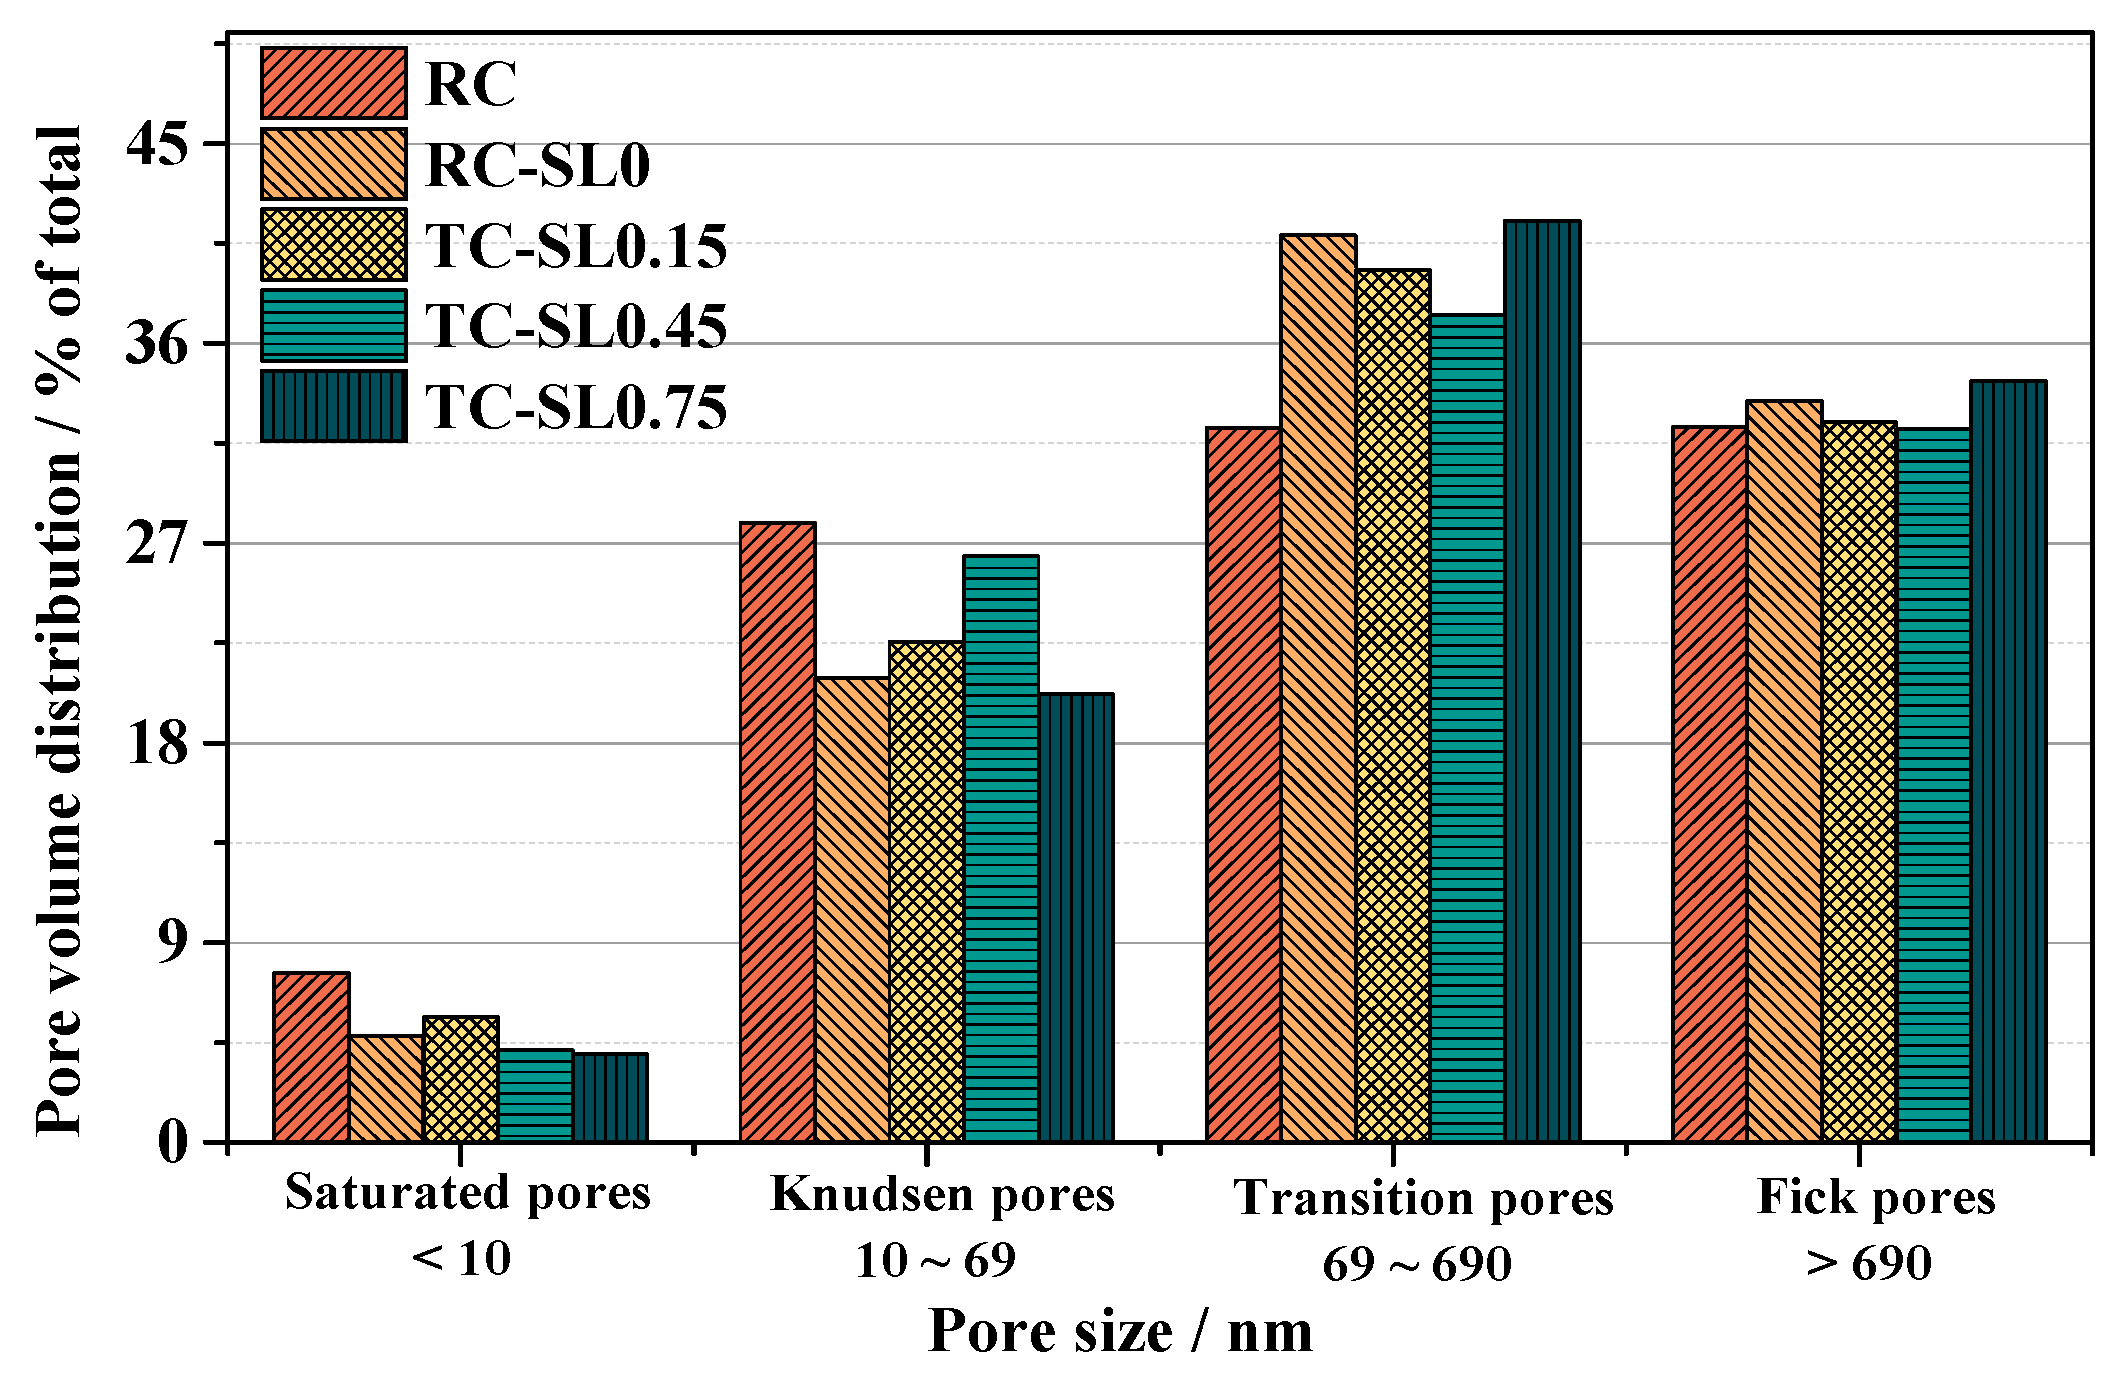
3.2.2. Pore Volume Distribution (PVD)
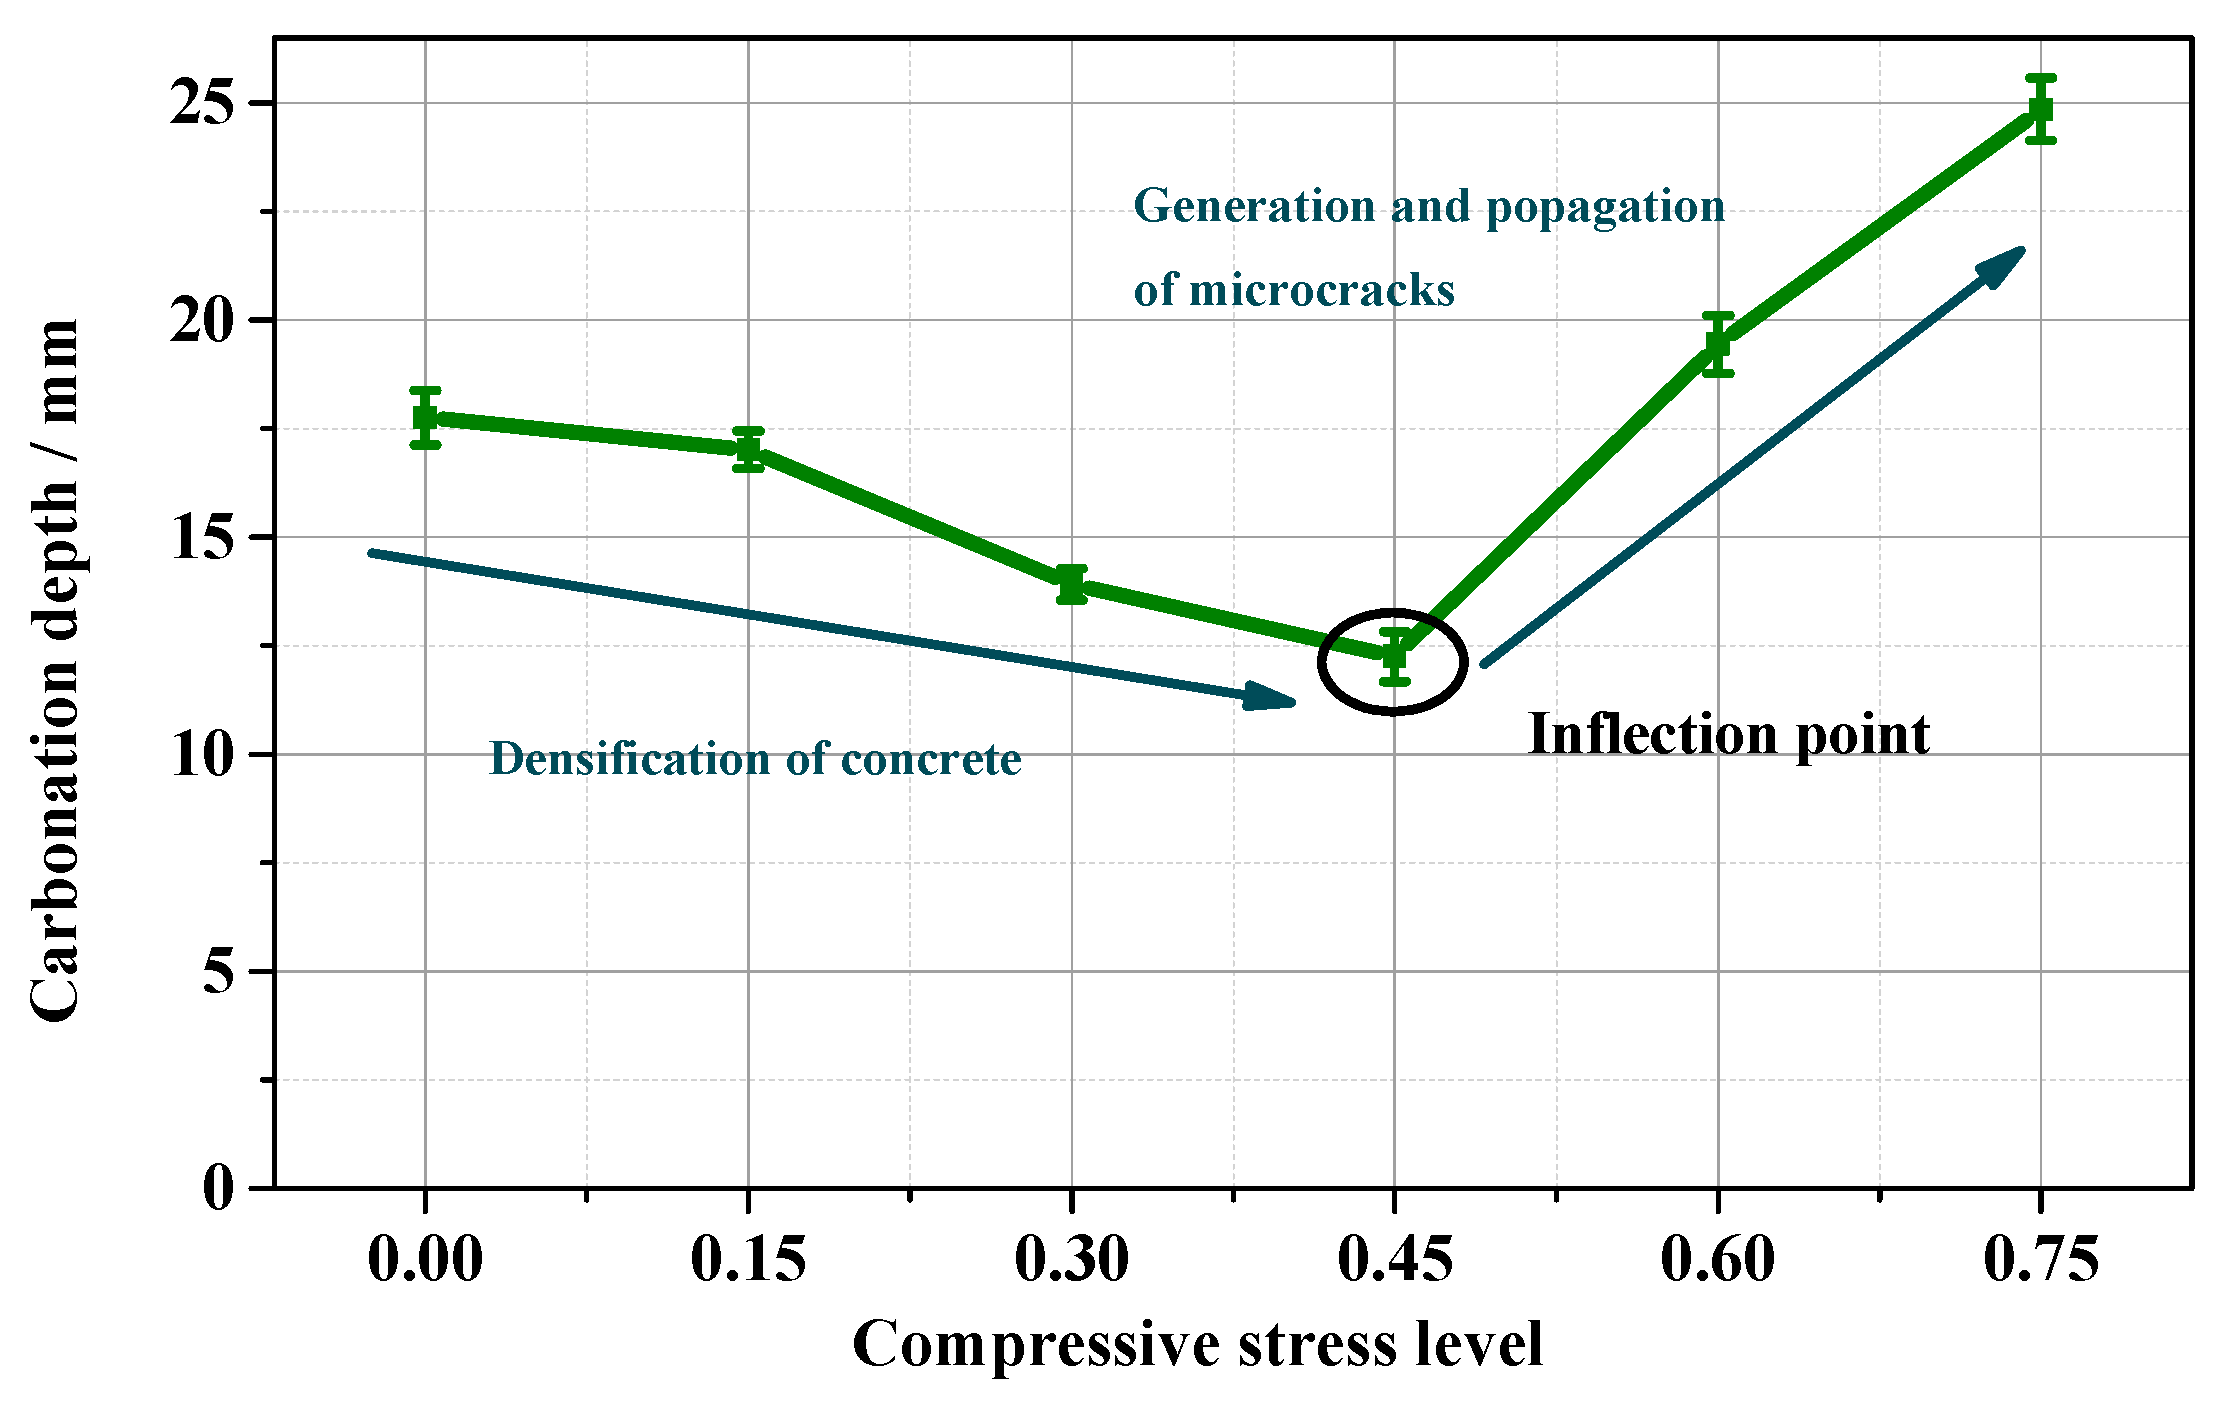
3.3. The Degradation of Concrete under Carbonation and Compression
3.3.1. Carbonation Action
3.3.2. Compression Action
3.3.3. The Combined Actions of Carbonation and Compression
4. Correlation Analysis of Air Permeability Coefficient with Pore Structure Parameters of Concrete under Carbonation and Compressive Stress
4.1. The Gray Relational Analysis Method
4.2. Regression Analysis Based on the Gray Relational Analysis
5. Conclusions
Author Contributions
Funding
Institutional Review Board Statement
Informed Consent Statement
Data Availability Statement
Acknowledgments
Conflicts of Interest
Abbreviations
| C–C | Carbonation and compressive stress | kAu | Air permeability coefficient |
| RC | Reference concrete | DC | Carbonation depth |
| SL | Stress level | dA | Average pore diameter |
| MIP | Mercury intrusion porosimetry | dM-A | Median pore diameter (area) |
| GRA | Gray relational analysis | dM-V | Median pore diameter (volume) |
| PVD | Pore volume distribution | PROPS | Proportion of saturation pores |
| C–S–H | Calcium silicate hydrates | PROPT | Proportion of transition pores |
| CH | Calcium hydroxide | PROPK | Proportion of Knudsen pores |
| SPSS | Statistical Product and Service Solutions software | PROPF | Proportion of Fick pores |
| γ | Gray relational grade |
References
- Von Greve-Dierfeld, S.; Lothenbach, B.; Vollpracht, A.; Wu, B.; Huet, B.; Andrade, C.; Medina, C.; De Belie, N. Understanding the carbonation of concrete with supplementary cementitious materials: A critical review by RILEM TC 281-CCC. Mater. Struct. 2022, 53, 136. [Google Scholar] [CrossRef]
- Gruyaert, E.; van den Heede, P.; De Belie, N. Carbonation of slag concrete: Effect of the cement replacement level and curing on the carbonation coefficient-effect of carbonation on the pore structure. Cem. Concr. Compos. 2013, 35, 39–48. [Google Scholar] [CrossRef]
- Azad, V.J.; Suraneni, P.; Trejo, D.; Jason Weiss, W.; Burkan Isgor, O. Thermodynamic investigation of allowable admixtured chloride limits in concrete. ACI Mater. J. 2018, 115, 727–738. [Google Scholar] [CrossRef]
- Robayo-Salazar, R.A.; María Aguirre-Guerrero, A.; Mejía de Gutiérrez, R. Carbonation-induced corrosion of alkali-activated binary concrete based on natural volcanic pozzolan. Constr. Build. Mater. 2020, 232, 117189. [Google Scholar] [CrossRef]
- Li, Z.G.; Li, S. Effects of wetting and drying on alkalinity and strength of fly ash/slag-activated materials. Constr. Build. Mater. 2020, 254, 119069. [Google Scholar] [CrossRef]
- Huseien, G.F.; Shah, K.W. Durability and life cycle evaluation of self-compacting concrete containing fly ash as GBFS replacement with alkali activation. Constr. Build. Mater. 2020, 235, 117458. [Google Scholar] [CrossRef]
- Wei, Z.H.; Wang, B.; Falzone, G.; Callagon La Plante, E.; Okoronkwo, M.U.; She, Z.Y.; Oey, T.; Sant, G. Clinkering-free cementation by fly ash carbonation. J. CO2 Util. 2018, 23, 117–127. [Google Scholar] [CrossRef]
- Liu, Z.Y.; van den Heede, P.; Zhang, C.; Shi, X.Y.; Wang, L.; Li, J.; Yao, Y.; De Belie, N. Influence of sustained compressive load on the carbonation of concrete containing blast furnace slag. Constr. Build. Mater. 2022, 335, 127457. [Google Scholar] [CrossRef]
- Leemann, A.; Moro, F. Carbonation of concrete: The role of CO2 concentration, relative humidity and CO2 buffer capacity. Mater. Struct. 2016, 50, 30. [Google Scholar] [CrossRef]
- Yao, Y.; Tang, G.B.; Wang, L.; Cui, S.P.; Cao, Y. Difference between natural and accelerated carbonation of concrete at 2% CO2 and 20% CO2. Rev. Romana Mater. 2018, 48, 70–75. [Google Scholar]
- Auroy, M.; Poyet, S.; Le Bescop, P.; Torrenti, J.M.; Charpentier, T.; Moskura, M.; Bourbon, X. Comparison between natural and accelerated carbonation (3% CO2): Impact on mineralogy, microstructure, water retention and cracking. Cem. Concr. Res. 2018, 109, 64–80. [Google Scholar] [CrossRef]
- Steiner, S.; Lothenbach, B.; Proske, T.; Borgschulte, A.; Winnefeld, F. Effect of relative humidity on the carbonation rate of portlandite, calcium silicate hydrates and ettringite. Cem. Concr. Res. 2020, 135, 106116. [Google Scholar] [CrossRef]
- Drouet, E.; Poyet, S.; Le Bescop, P.; Torrenti, J.M.; Bourbon, X. Carbonation of hardened cement pastes: Influence of temperature. Cem. Concr. Res. 2019, 115, 445–459. [Google Scholar] [CrossRef] [Green Version]
- Galan, I.; Andrade, C.; Castellote, M. Natural and accelerated CO2 binding kinetics in cement paste at different relative humidities. Cem. Concr. Res. 2013, 49, 21–28. [Google Scholar] [CrossRef]
- Tang, J.Z.; Wu, J.; Zou, Z.H.; Yue, A.Y.; Mueller, A. Influence of axial loading and carbonation age on the carbonation resistance of recycled aggregate concrete. Constr. Build. Mater. 2018, 173, 707–717. [Google Scholar] [CrossRef]
- Lei, B.; Li, W.G.; Li, Z.H.; Wang, G.; Sun, Z.H. Effect of cyclic loading deterioration on concrete durability: Water absorption, freeze-thaw, and carbonation. J. Mater. Civ. Eng. 2018, 30, 04018220.1–04018220.10. [Google Scholar] [CrossRef]
- Wang, W.; Lu, C.F.; Li, Y.X.; Yuan, G.L.; Li, Q.T. Effects of stress and high temperature on the carbonation resistance of fly ash concrete. Constr. Build. Mater. 2017, 138, 486–495. [Google Scholar] [CrossRef]
- Wan, X.M.; Cao, W.Q.; Zhao, T.J.; Fan, H. Service life prediction based on carbonation reliability theory for reinforced concrete under mechanical load. Adv. Mater. Res. 2011, 243, 1156–1162. [Google Scholar] [CrossRef]
- Tang, G.B.; Yao, Y.; Wang, L.; Cui, S.P.; Cao, Y. Relation of damage variable and gas permeability coefficient of concrete under stress. J. Wuhan Univ. Technol. Mater. Sci. Ed. 2018, 33, 1481–1485. [Google Scholar] [CrossRef]
- Han, J.D.; Liu, W.Q.; Wang, S.G.; Geert, D.S.; Sun, W.; Liang, Y. Carbonation reaction and microstructural changes of metro-tunnel segment concrete coupled with static and fatigue load. J. Mater. Civ. Eng. 2016, 29, 04016216. [Google Scholar] [CrossRef]
- Yao, Y.; Wang, Z.D.; Wang, L. Durability of concrete under combined mechanical load and environmental actions: A review. J. Sustain. Cem.-Based Mater. 2012, 1, 2–15. [Google Scholar] [CrossRef]
- Yao, Y.; Wang, L.; Wittmann, F.H.; De Belie, N.; Schlangen, E.; Gehlen, C.; Wang, Z.D.; Li, J. Recommendation of RILEM TC 246-TDC: Test methods to determine durability of concrete under combined environmental actions and mechanical load. Mater. Struct. 2017, 50, 155. [Google Scholar] [CrossRef]
- Shi, X.Y.; Zhang, C.; Liu, Z.Y.; van den Heede, P.; Wang, L.; De Belie, N.; Yao, Y. Numerical modeling of the carbonation depth of meso-scale concrete under sustained loads considering stress state and damage. Constr. Build. Mater. 2022, 340, 127798. [Google Scholar] [CrossRef]
- Liu, Z.Y.; van den Heede, P.; De Belie, N. Effect of the Mechanical Load on the Carbonation of Concrete: A Review of the Underlying Mechanisms, Test Methods, and Results. Materials 2021, 14, 4407. [Google Scholar] [CrossRef]
- Shi, X.Y.; Zhang, C.; Wang, L.; Yao, Y. Numerical investigation on the influence of ITZ and its width on the carbonation depth of concrete with stress damage. Cem. Concr. Compos. 2022, 132, 104630. [Google Scholar] [CrossRef]
- Zeng, Q.; Wang, Z.D. Poroelastic insights into stress dependence of chloride penetration into saturated cement-based porous materials. J. Adv. Concr. Technol. 2019, 17, 350–364. [Google Scholar] [CrossRef] [Green Version]
- Zeng, Q.; Jike, N.; Liu, J.H.; Wang, Z.D.; Wang, J.Y. Fractal analysis of stress-dependent diffusivity of porous cementitious materials. Fractals 2020, 28, 2050117. [Google Scholar] [CrossRef]
- Wang, Y.C.; Jiang, X.L.; Wang, S.H.; Yang, W.G.; Liu, W.; Xing, F.; Yang, K.; Basheer, P.A.M. Influence of axial loads on CO2 and Cl− transport in concrete phases: Paste, Mortar and ITZ. Constr. Build. Mater. 2019, 204, 875–883. [Google Scholar] [CrossRef] [Green Version]
- Yao, Y.; Wang, L.; Tang, G.B.; Cao, Y. An Annotated Bibliography on Carbonation with Load and Carbonation: An Annotated Bibliography; Aedificatio Publisher: Freiburg, Germany, 2020. [Google Scholar]
- Shi, X.Y.; Yao, Y.; Wang, L.; Zhang, C.; Ahmad, I. A modified numerical model for predicting carbonation depth of concrete with stress damage. Constr. Build. Mater. 2021, 304, 124389. [Google Scholar] [CrossRef]
- Choinska, M.; Khelidj, A.; Chatzigeorgiou, G.; Pijaudier-Cabot, G. Effects and interactions of temperature and stress-level related damage on permeability of concrete. Cem. Concr. Res. 2007, 37, 79–88. [Google Scholar] [CrossRef] [Green Version]
- Banthia, N.; Biparva, A.; Mindess, S. Permeability of concrete under stress. Cem. Concr. Res. 2005, 35, 1651–1655. [Google Scholar] [CrossRef]
- Wimalasiri, M.; Robert, D.; Li, C.Q. Permeability degradation of stressed concrete considering concrete plasticity. J. Mater. Civ. Eng. 2020, 32, 04020265. [Google Scholar] [CrossRef]
- Sadrmomtazi, A.; Tahmouresi, B.; Khoshkbijari, R.K. Effect of fly ash and silica fume on transition zone, pore structure and permeability of concrete. Mag. Concr. Res. 2018, 70, 519–532. [Google Scholar] [CrossRef]
- Dhir, R.K.; Hetwlett, P.C.; Chan, Y.N. Near-surface characteristics of concrete prediction of carbonation resistance. Mag. Concr. Res. 1989, 148, 137–143. [Google Scholar] [CrossRef]
- Torrent, R.; Denarié, E.; Jacobs, F.; Leemann, A.; Teruzzi, T. Specification and site control of the permeability of the cover concrete: The swiss approach. Mater. Corros. 2012, 63, 1127–1133. [Google Scholar] [CrossRef]
- Torrent, R.J. A Two-chamber vacuum cell for measuring the coefficient of permeability to air of the concrete cover on site. Mater. Struct. 1992, 25, 358–365. [Google Scholar]
- Salvoldi, B.G.; Beushausen, H.; Alexander, M.G. Oxygen permeability of concrete and its relation to carbonation. Constr. Build. Mater. 2015, 85, 30–37. [Google Scholar] [CrossRef]
- Wang, R.; Gao, X.J.; Li, Q.Y.; Yang, Y.Z. Influence of splitting load on transport properties of ultra-high-performance concrete. Constr. Build. Mater. 2018, 171, 708–718. [Google Scholar] [CrossRef]
- Djerbi Tegguer, A.; Bonnet, S.; Khelidj, A.; Baroghel-Bouny, V. Effect of uniaxial compressive loading on gas permeability and chloride diffusion coefficient of concrete and their relationship. Cem. Concr. Res. 2013, 52, 131–139. [Google Scholar] [CrossRef] [Green Version]
- Zhou, C.S.; Li, K.F.; Han, J.G. Characterizing the effect of compressive damage on transport properties of cracked concretes. Mater. Struct. 2011, 45, 381–392. [Google Scholar] [CrossRef]
- Yao, Y.; Wang, L.; Wittmann, F.H.; De Belie, N.; Schlangen, E.; Alava, H.E.; Wang, Z.D.; Cao, Y. Test methods to determine durability of concrete under combined environmental actions and mechanical load: Final report of RILEM TC 246-TDC. Mater. Struct. 2017, 50, 123. [Google Scholar] [CrossRef]
- Yang, K.; Basheer, P.A.M.; Bai, Y.; Magee, B.J.; Long, A.E. Evelopment of a new in situ test method to measure the air permeability of high performance concretes. NDT E Int. 2014, 64, 30–40. [Google Scholar] [CrossRef]
- Basheer, L.; Nanukuttan, S.V.; Basheer, P.A.M. The influence of reusing ‘formtex’ controlled permeability formwork on strength and durability of concrete. Mater. Struct. 2007, 41, 1363–1375. [Google Scholar] [CrossRef] [Green Version]
- Basheer, P.A.M.; Montgomery, F.R.; Long, A.E. Clam’ tests for measuring in-situ permeation properties of concrete. Nondestruct. Test. Eval. 1995, 12, 53–73. [Google Scholar] [CrossRef]
- Anstice, D.J.; Page, C.L.; Page, M.M. The pore solution phase of carbonated cement pastes. Cem. Concr. Res. 2005, 35, 377–383. [Google Scholar] [CrossRef]
- Morandeau, A.; Thiéry, M.; Dangla, P. Investigation of the carbonation mechanism of CH and C-S-H in terms of kinetics, microstructure changes and moisture properties. Cem. Concr. Res. 2014, 56, 153–170. [Google Scholar] [CrossRef] [Green Version]
- Morandeau, A.; Thiéry, M.; Dangla, P. Impact of accelerated carbonation on OPC cement paste blended with fly ash. Cem. Concr. Res. 2015, 67, 226–236. [Google Scholar] [CrossRef]
- Sevelsted, T.F.; Skibsted, J. Carbonation of C-S-H and C-A-S-H samples studied by 13C, 27Al and 29Si MAS NMR Spectroscopy. Cem. Concr. Res. 2015, 71, 56–65. [Google Scholar] [CrossRef]
- Shen, A.Q.; Lin, S.L.; Guo, Y.C.; He, T.Q.; Lyu, Z.H. Relationship between flexural strength and pore structure of pavement concrete under fatigue loads and freeze-thaw interaction in seasonal frozen regions. Constr. Build. Mater. 2018, 174, 684–692. [Google Scholar] [CrossRef]
- Houst, Y.F.; Wittmann, F.H. Influence of porosity and water content on the diffusivity of CO2 and O2 through hydrated cement paste. Cem. Concr. Res. 1994, 24, 1165–1176. [Google Scholar] [CrossRef]
- Sercombe, J.; Vidal, R.; Gallé, C.; Adenot, F. Experimental study of gas diffusion in cement paste. Cem. Concr. Res. 2007, 37, 579–588. [Google Scholar] [CrossRef] [Green Version]
- Peter, M.A.; Muntean, A.; Meier, S.A.; Böhm, M. Competition of several carbonation reactions in concrete: A parametric study. Cem. Concr. Res. 2008, 38, 1385–1393. [Google Scholar] [CrossRef] [Green Version]
- Muntean, A.; Böhm, M.; Kropp, J. Moving carbonation fronts in concrete: A moving-sharp-interface approach. Chem. Eng. Sci. 2011, 66, 538–547. [Google Scholar] [CrossRef]
- Rochelle, C.A.; Milodowski, A.E. Carbonation of borehole seals: Comparing evidence from short-term laboratory experiments and long-term natural analogues. Appl. Geochem. 2013, 30, 161–177. [Google Scholar] [CrossRef] [Green Version]
- Thiery, M.; Bouny, B.B.; Villain, G.; Dangla, P. Numerical modeling of concrete carbonation based on durability indicators. ACI Mater. J. 2006, 234, 765–780. [Google Scholar]
- Ishida, T.; Li, C.H. Modeling of carbonation based on thermo-hygro physics with strong coupling of mass transport and equilibrium in micro-pore structure of concrete. J. Adv. Concr. Technol. 2008, 6, 303–316. [Google Scholar] [CrossRef] [Green Version]
- Wu, B.; Ye, G. Development of porosity of cement paste blended with supplementary cementitious materials after carbonation. Constr. Build. Mater. 2017, 145, 52–61. [Google Scholar] [CrossRef] [Green Version]
- Shi, Z.G.; Lothenbach, B.; Geiker, M.R.; Kaufmann, J.; Leemann, A.; Ferreiro, S.; Skibsted, J. Experimental studies and thermodynamic modeling of the carbonation of portland cement, metakaolin and limestone mortars. Cem. Concr. Res. 2016, 88, 60–72. [Google Scholar] [CrossRef]
- Hay, R.; Li, J.Q.; Celik, K. Phase evolution, micromechanical properties, and morphology of calcium (alumino)silicate hydrates C-(A-)S-H under carbonation. Cem. Concr. Res. 2022, 152, 106683. [Google Scholar] [CrossRef]
- Tosun, N. Determination of optimum parameters for multi-performance characteristics in drilling by using grey relational analysis. Int. J. Adv. Manuf. Technol. 2012, 28, 450–455. [Google Scholar] [CrossRef]
- Fung, C.P. Manufacturing process optimization for wear property of fiber-reinforced polybutylene terephthalate composites with grey relational analysis. Wear 2003, 254, 298–306. [Google Scholar] [CrossRef]
- Lin, Z.C.; Ho, C.Y. Analysis and application of grey relation and an ova in chemical–mechanical polishing process parameters. Int. J. Adv. Manuf. Technol. 2003, 21, 10–14. [Google Scholar]
- Haq, A.N.; Marimuthu, P.; Jeyapaul, R. Multi response optimization of machining parameters of drilling al/sic metal matrix composite using grey relational analysis in the taguchi method. Int. J. Adv. Manuf. Technol. 2007, 37, 250–255. [Google Scholar] [CrossRef]
- Li, K.F.; Zeng, Q.; Luo, M.Y.; Pang, X.Y. Effect of self-desiccation on the pore structure of paste and mortar incorporating 70% GGBS. Constr. Build. Mater. 2014, 51, 329–337. [Google Scholar] [CrossRef]
- Gui, Q.; Qin, M.F.; Li, K.F. Gas permeability and electrical conductivity of structural concretes: Impact of pore structure and pore saturation. Cem. Concr. Res. 2016, 89, 109–119. [Google Scholar] [CrossRef]
- Tang, G.B.; Yao, Y.; Wang, L.; Cao, Y.; Cui, S.P. Prediction model of concrete carbonation depth under the combined action of stress. J. Build. Mater. 2020, 23, 304–308. (In Chinese) [Google Scholar]


| Composition | SiO2 | Al2O3 | SO3 | Fe2O3 | MgO | CaO | LOI |
|---|---|---|---|---|---|---|---|
| Content (%) | 22.11 | 4.43 | 2.62 | 3.13 | 2.28 | 62.38 | 2.04 |
| Density (kg·m−3) | Specific Surface (kg·m−3) | Setting Time (min) | Flexural Strength (MPa) | Compressive Strength (MPa) | |||
|---|---|---|---|---|---|---|---|
| Initial | Final | 3 Days | 28 Days | 3 Days | 28 Days | ||
| 3127 | 355 | 99 | 159 | 5.8 | 8.6 | 28.1 | 51.2 |
| Portland Cement (kg·m−3) | Fine Aggregate (kg·m−3) | Coarse Aggregate (kg·m−3) | Water (kg·m−3) | Superplasticizer (kg·m−3) | w/c | Slump (cm) | 28 Day fc (MPa) |
|---|---|---|---|---|---|---|---|
| 330 | 719 | 1162 | 198 | 0.7 | 0.6 | 11 | 34.93 |
| No. | Remarks | Test Items |
|---|---|---|
| RC | Reference concrete 1: no carbonation, no compression | kAu, MIP |
| SL0 | Reference concrete 2: carbonation, no compression | Dc, kAu, MIP |
| SL0.15 | Test concrete: C–C (concrete under carbonation and compressive stress), stress level of 0.15 | Dc, kAu, MIP |
| SL0.30 | Test concrete: C–C, stress level of 0.30 | Dc, kAu |
| SL0.45 | Test concrete: C–C, stress level of 0.45 | Dc, kAu, MIP |
| SL0.60 | Test concrete: C–C, stress level of 0.60 | Dc, kAu |
| SL0.75 | Test concrete: C–C, stress level of 0.75 | Dc, kAu, MIP |
| Conditions | Increment of PROPs | Increment of PROPK | Increment of PROPT | Increment of PROPF | |
|---|---|---|---|---|---|
| SL0 | ref. RC | −1.86 | −6.98 | +8.66 | +1.18 |
| SL0.15 | ref. SL0 | +0.89 | +1.62 | −1.54 | −0.97 |
| SL0.45 | ref. SL0 | −0.62 | +5.48 | −3.6 | −1.26 |
| SL0.75 | ref. SL0 | −0.81 | −0.74 | +0.66 | +0.89 |
| Compressive Stress Level | ||||
|---|---|---|---|---|
| 0 | 0–0.45 | 0.45 | 0.45–0.75 | |
| Pore-filling effect | ++ | ++ | ++ | ++ |
| Decalcification effect | ++++ | ++++ | ++++ | ++++ |
| Densification effect | / | +++++ | +++++ | / |
| Split effect | / | / | / | +++++ |
| kAu | Porosity | dA | dM-A | dM-V | PROPS | PROPK | PROPT | PROPF | |
|---|---|---|---|---|---|---|---|---|---|
| RC | 1 | 1 | 1 | 1 | 1 | 1 | 1 | 1 | 1 |
| SL0 | 1.507 | 1.184 | 1.058 | 1.106 | 1.696 | 0.625 | 0.750 | 1.269 | 1.037 |
| SL0.15 | 1.402 | 1.153 | 0.988 | 1.048 | 1.582 | 0.742 | 0.808 | 1.221 | 1.007 |
| SL0.45 | 1.173 | 1.077 | 0.975 | 1.033 | 1.062 | 0.545 | 0.946 | 1.157 | 0.998 |
| SL0.75 | 1.825 | 1.323 | 1.328 | 1.236 | 3.355 | 0.520 | 0.723 | 1.289 | 1.064 |
| Porosity | dA | dM-A | dM-V | PROPS | PROPK | PROPT | PROPF | |
|---|---|---|---|---|---|---|---|---|
| RC | 1 | 1 | 1 | 1 | 1 | 1 | 1 | 1 |
| SL0 | 0.703 | 0.629 | 0.656 | 0.802 | 0.464 | 0.502 | 0.762 | 0.619 |
| SL0.15 | 0.754 | 0.654 | 0.684 | 0.809 | 0.537 | 0.562 | 0.808 | 0.659 |
| SL0.45 | 0.888 | 0.793 | 0.846 | 0.872 | 0.548 | 0.771 | 0.979 | 0.813 |
| SL0.75 | 0.603 | 0.606 | 0.565 | 0.333 | 0.369 | 0.409 | 0.587 | 0.501 |
| Porosity | dA | dM-A | dM-V | Pore Volume Distribution | |||
|---|---|---|---|---|---|---|---|
| PROPS | PROPK | PROPT | PROPF | ||||
| 0.789 | 0.736 | 0.749 | 0.763 | 0.583 | 0.649 | 0.827 | 0.718 |
Publisher’s Note: MDPI stays neutral with regard to jurisdictional claims in published maps and institutional affiliations. |
© 2022 by the authors. Licensee MDPI, Basel, Switzerland. This article is an open access article distributed under the terms and conditions of the Creative Commons Attribution (CC BY) license (https://creativecommons.org/licenses/by/4.0/).
Share and Cite
Zhang, C.; Shi, X.; Wang, L.; Yao, Y. Investigation on the Air Permeability and Pore Structure of Concrete Subjected to Carbonation under Compressive Stress. Materials 2022, 15, 4775. https://doi.org/10.3390/ma15144775
Zhang C, Shi X, Wang L, Yao Y. Investigation on the Air Permeability and Pore Structure of Concrete Subjected to Carbonation under Compressive Stress. Materials. 2022; 15(14):4775. https://doi.org/10.3390/ma15144775
Chicago/Turabian StyleZhang, Cheng, Xinyu Shi, Ling Wang, and Yan Yao. 2022. "Investigation on the Air Permeability and Pore Structure of Concrete Subjected to Carbonation under Compressive Stress" Materials 15, no. 14: 4775. https://doi.org/10.3390/ma15144775
APA StyleZhang, C., Shi, X., Wang, L., & Yao, Y. (2022). Investigation on the Air Permeability and Pore Structure of Concrete Subjected to Carbonation under Compressive Stress. Materials, 15(14), 4775. https://doi.org/10.3390/ma15144775