
Study on Performance of Retarded Composite Semi-Rigid Base Mixed with Rubber Powder

 ,
,
Abstract
:1. Introduction
2. Materials and Methods
2.1. Aggregate
2.2. Cement
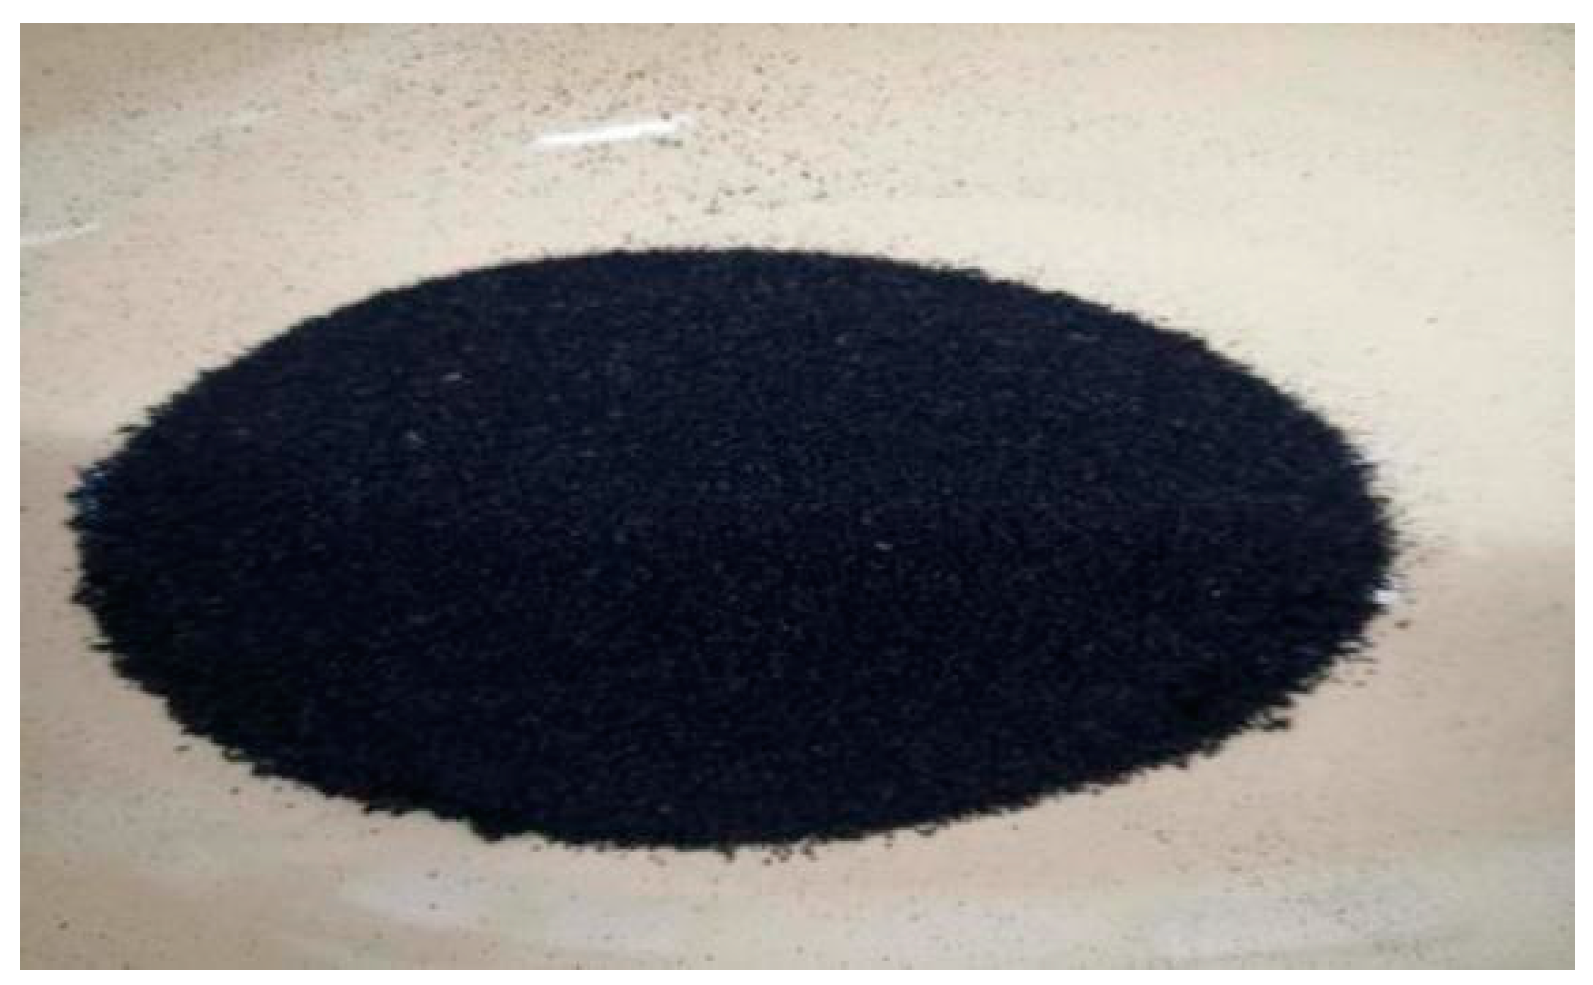
2.3. Powder
2.4. Retarder Water
2.5. Water
2.6. Design of Test Blending Ratio
2.7. Test Method of Unconfined Compressive Strength
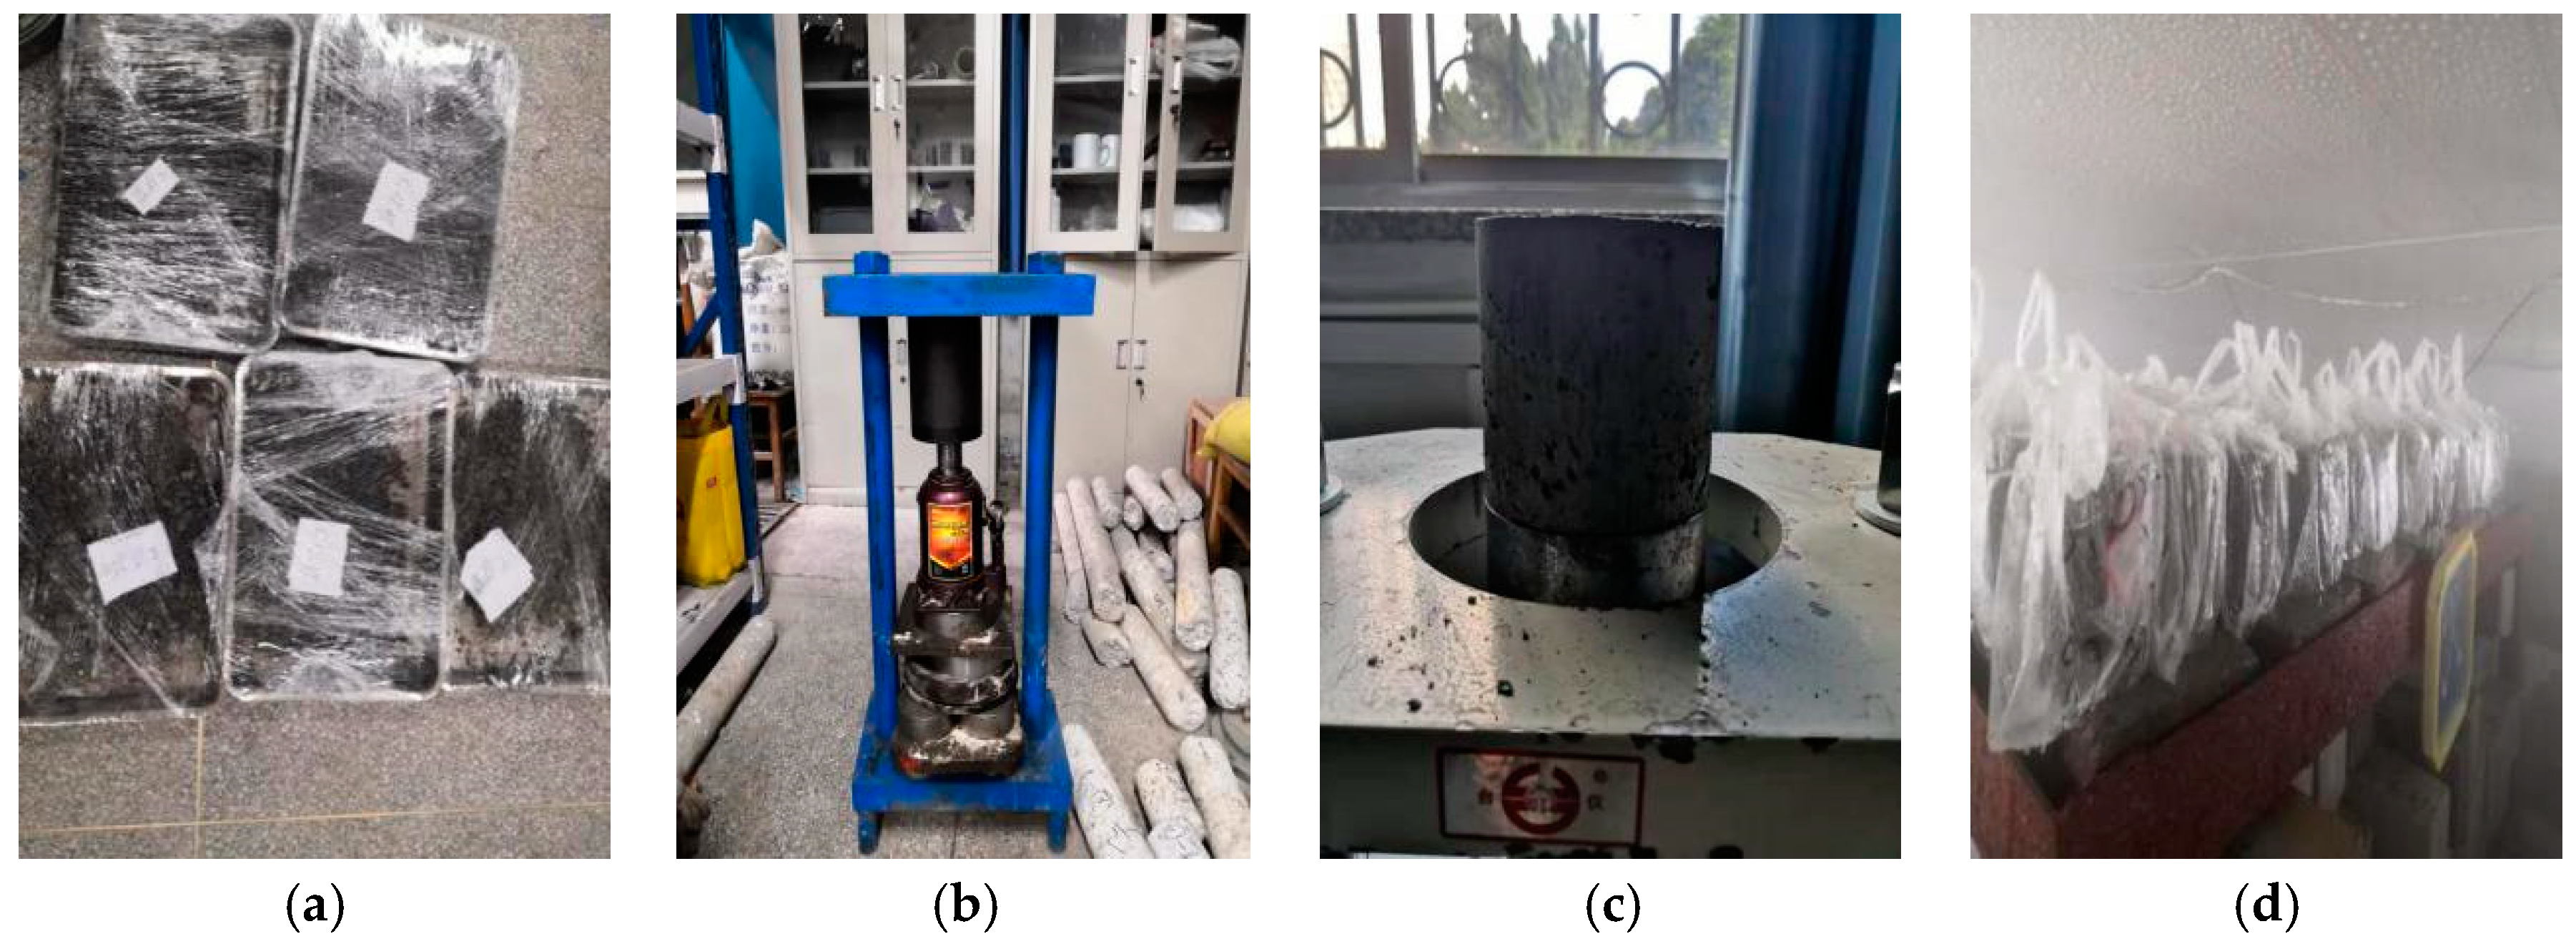
2.7.1. Making and Health Preservation of Specimens
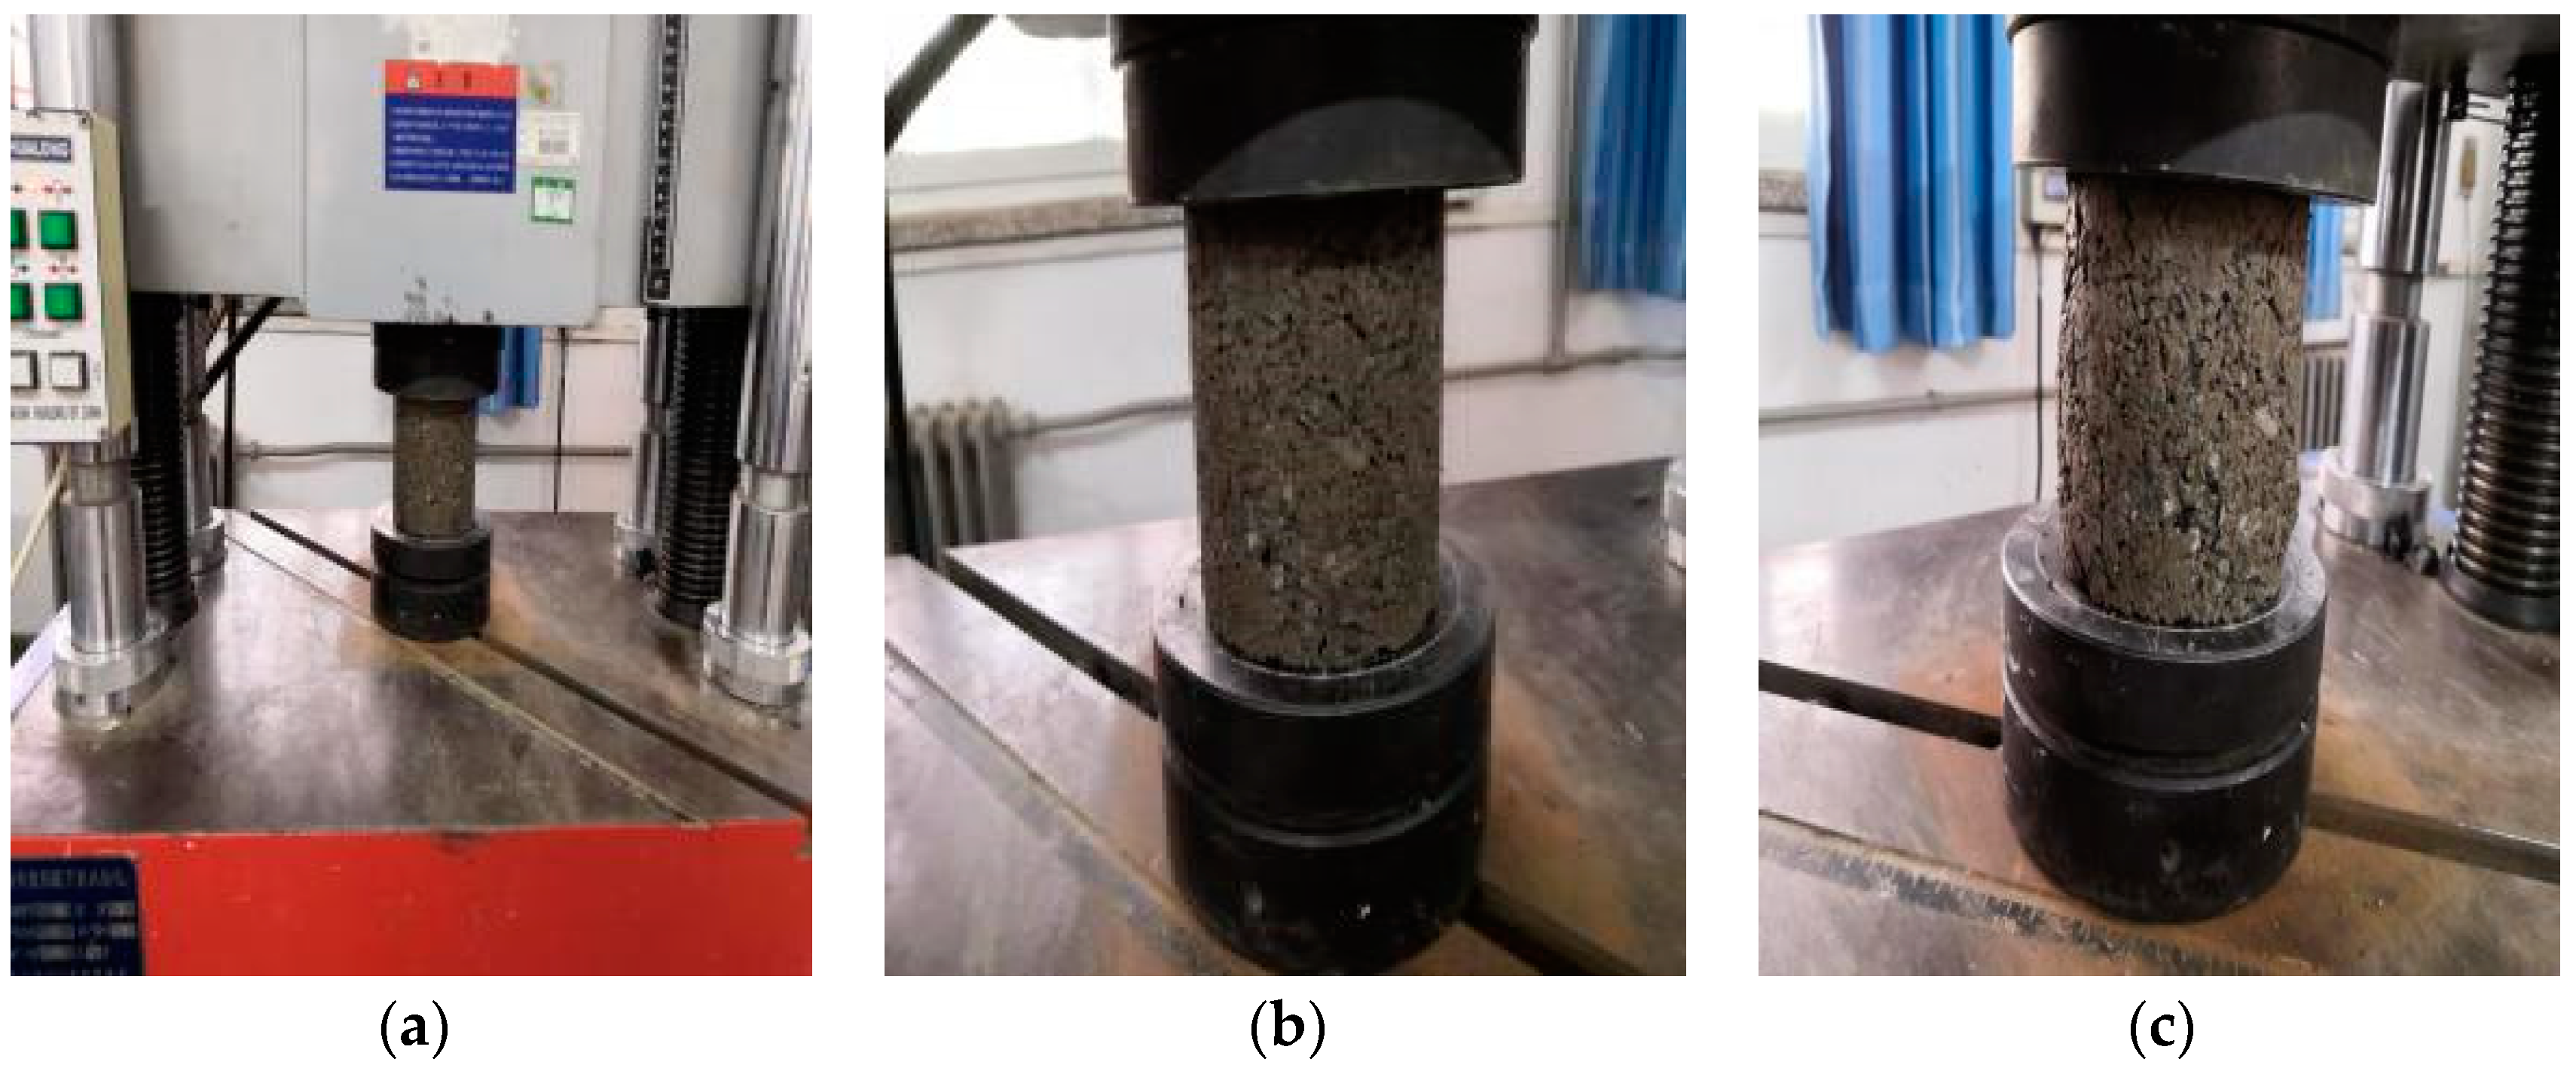
2.7.2. Unconfined Compressive Test
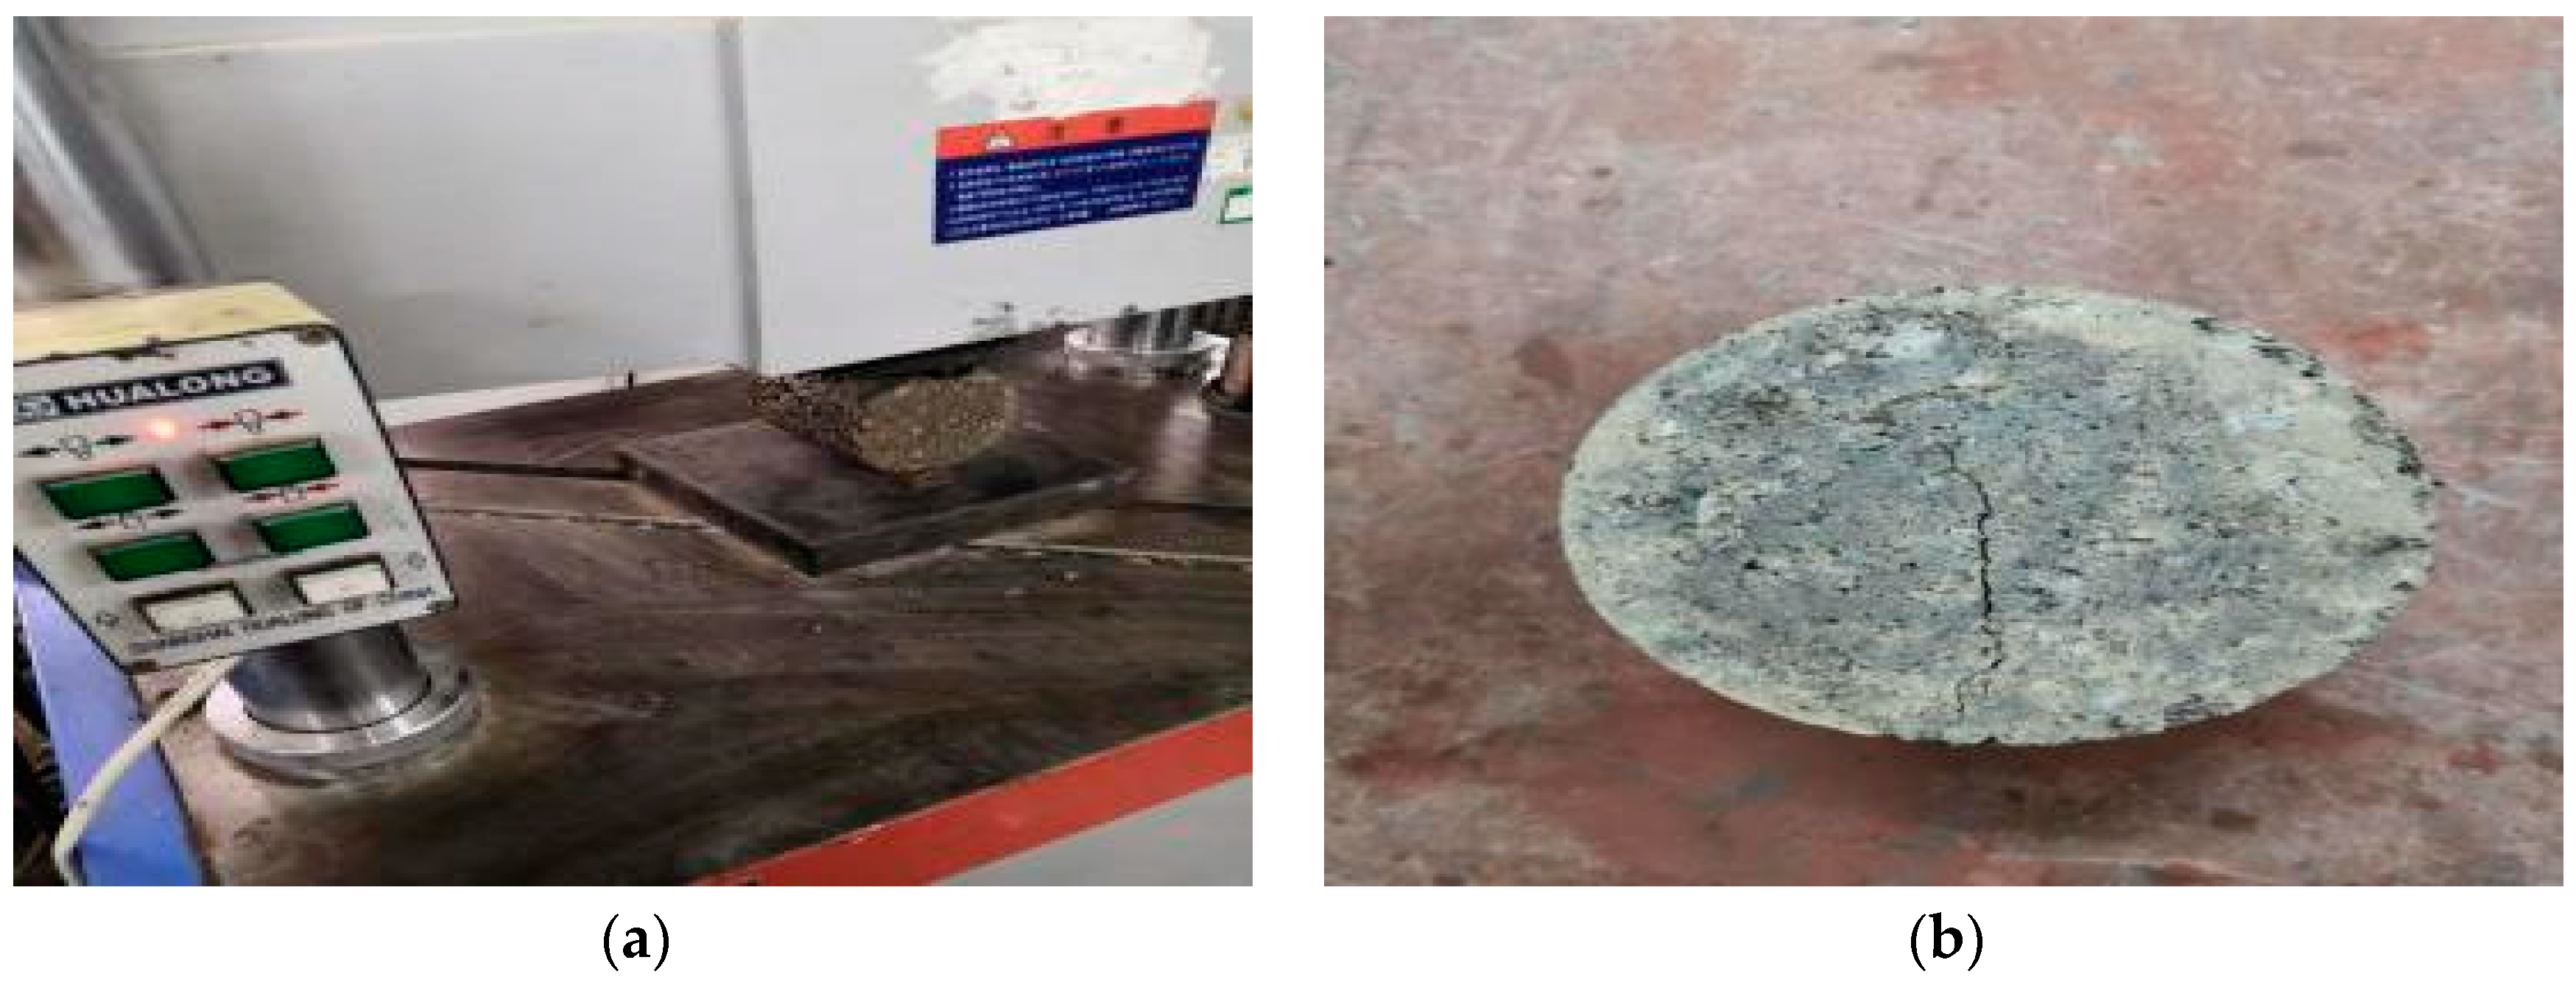
2.8. Splitting Strength Test
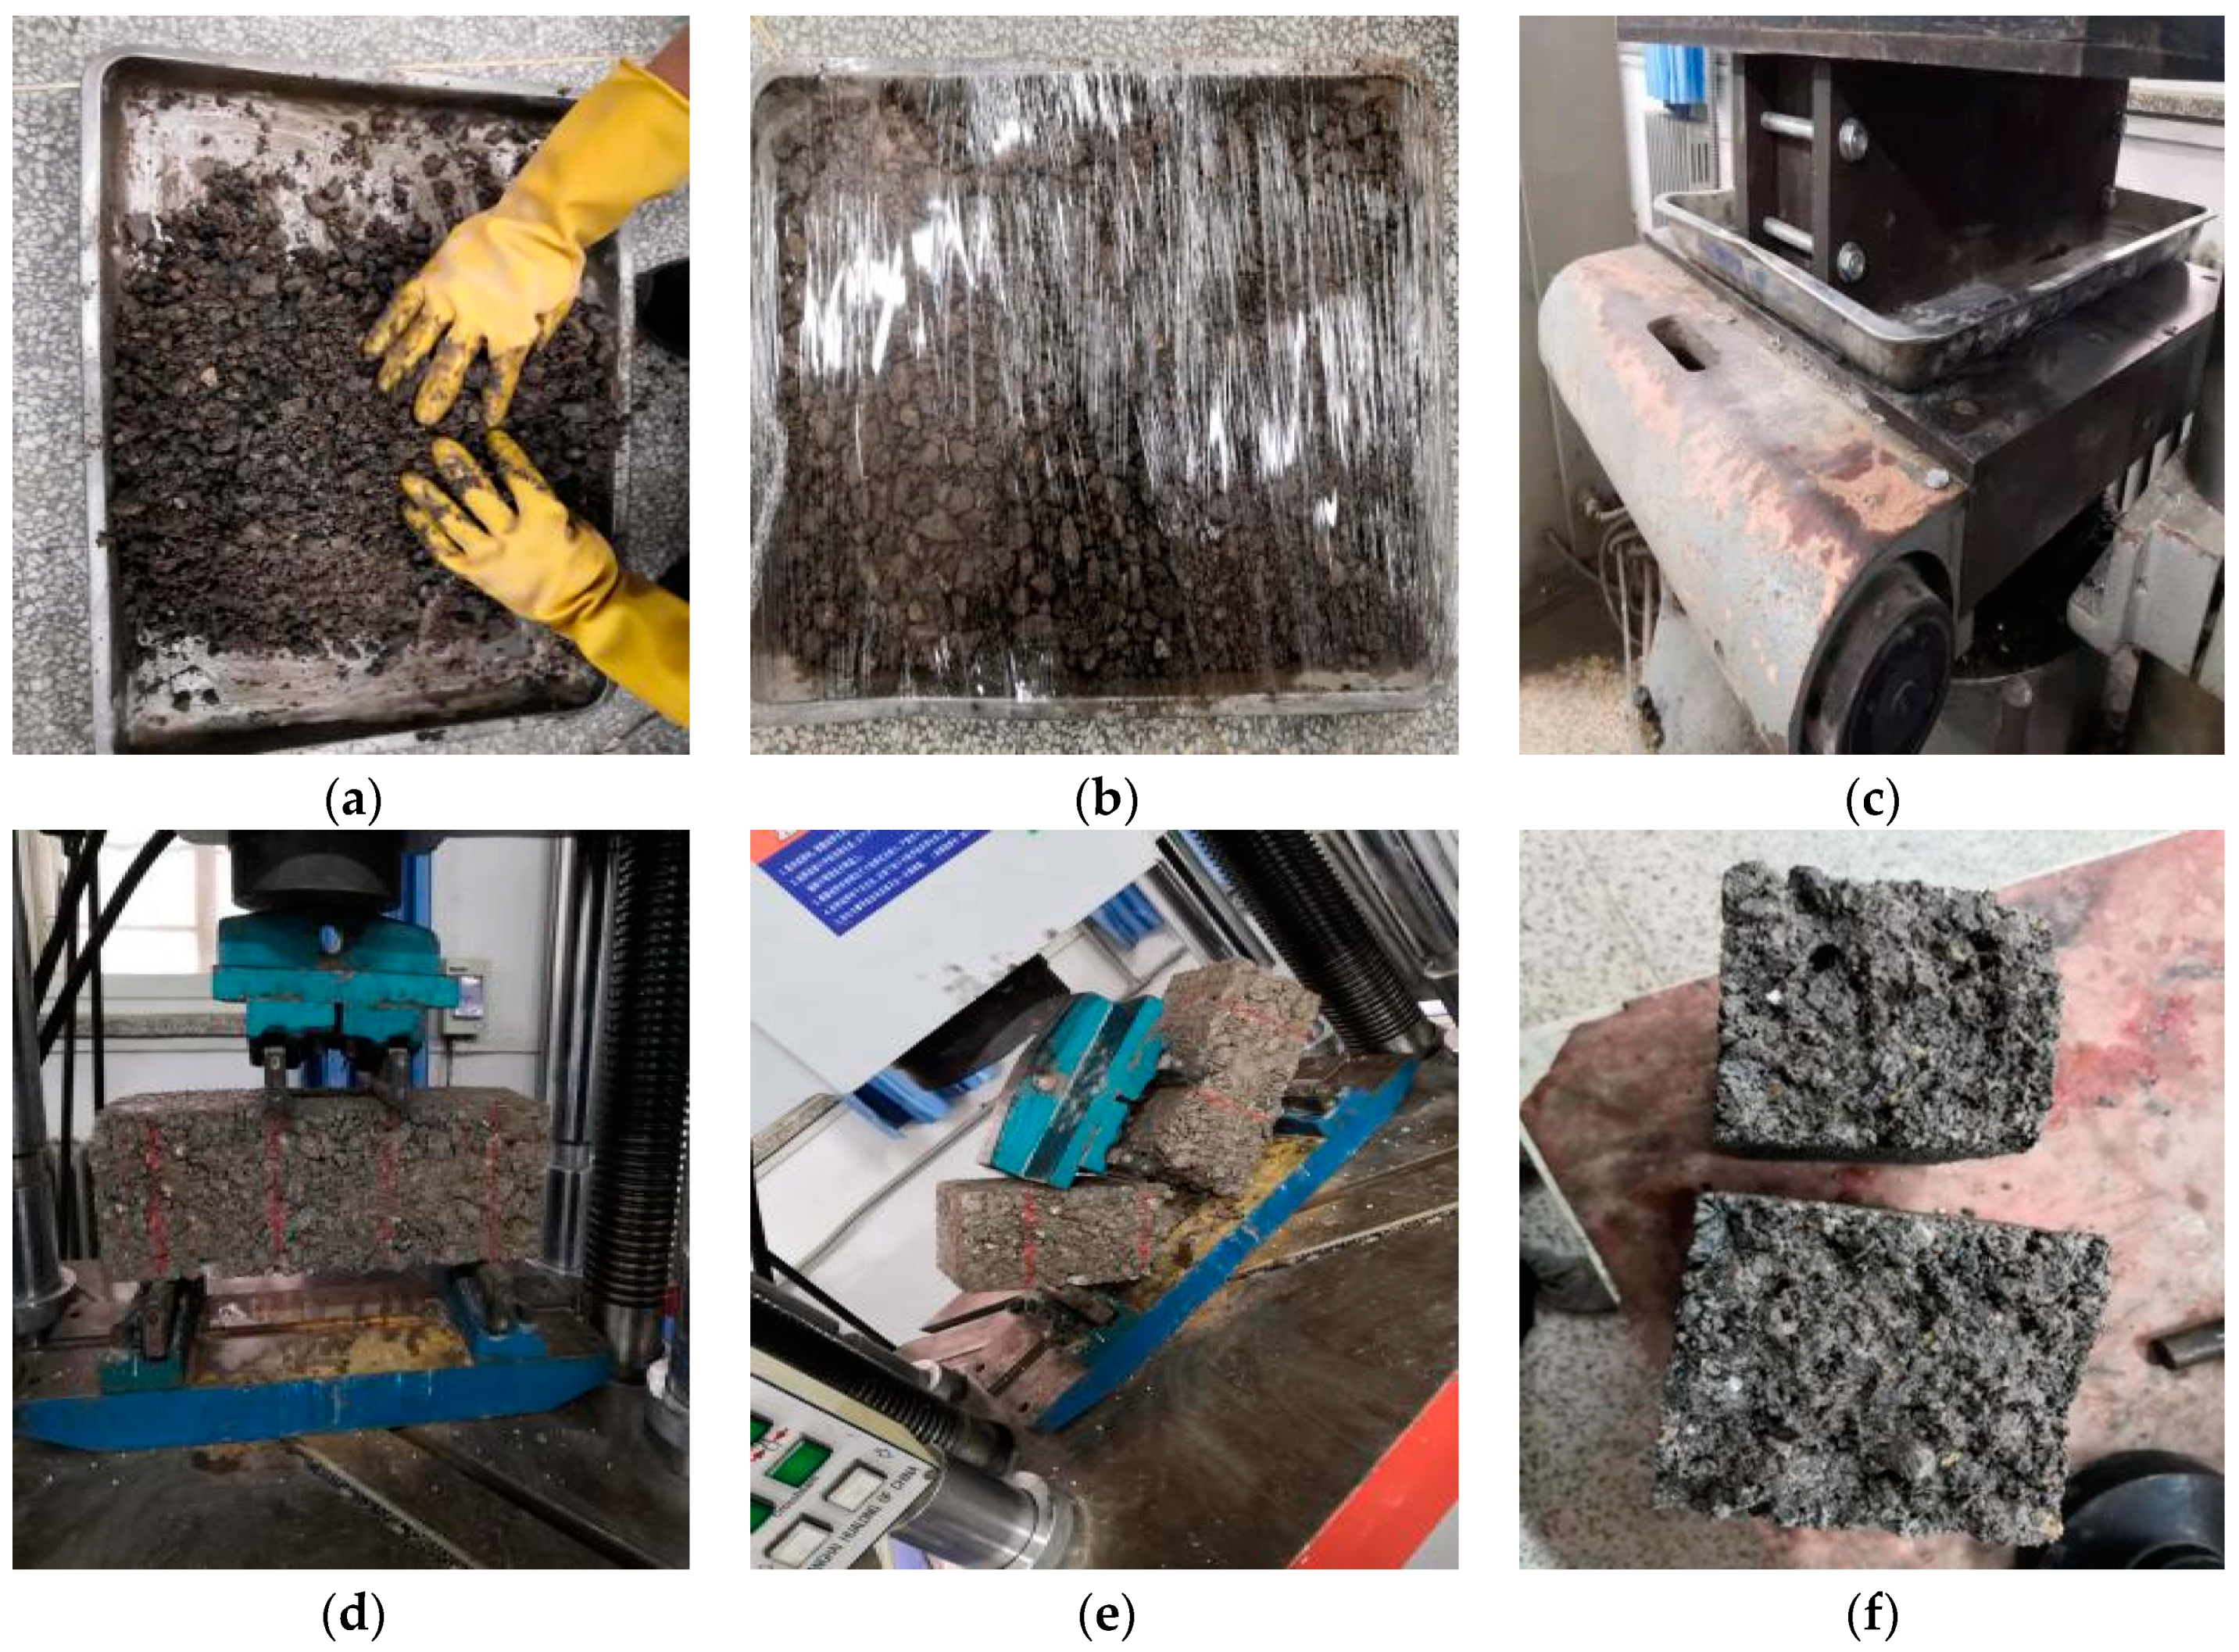
2.9. Flexural Tensile Strength Test
2.10. Dry Shrinkage Test
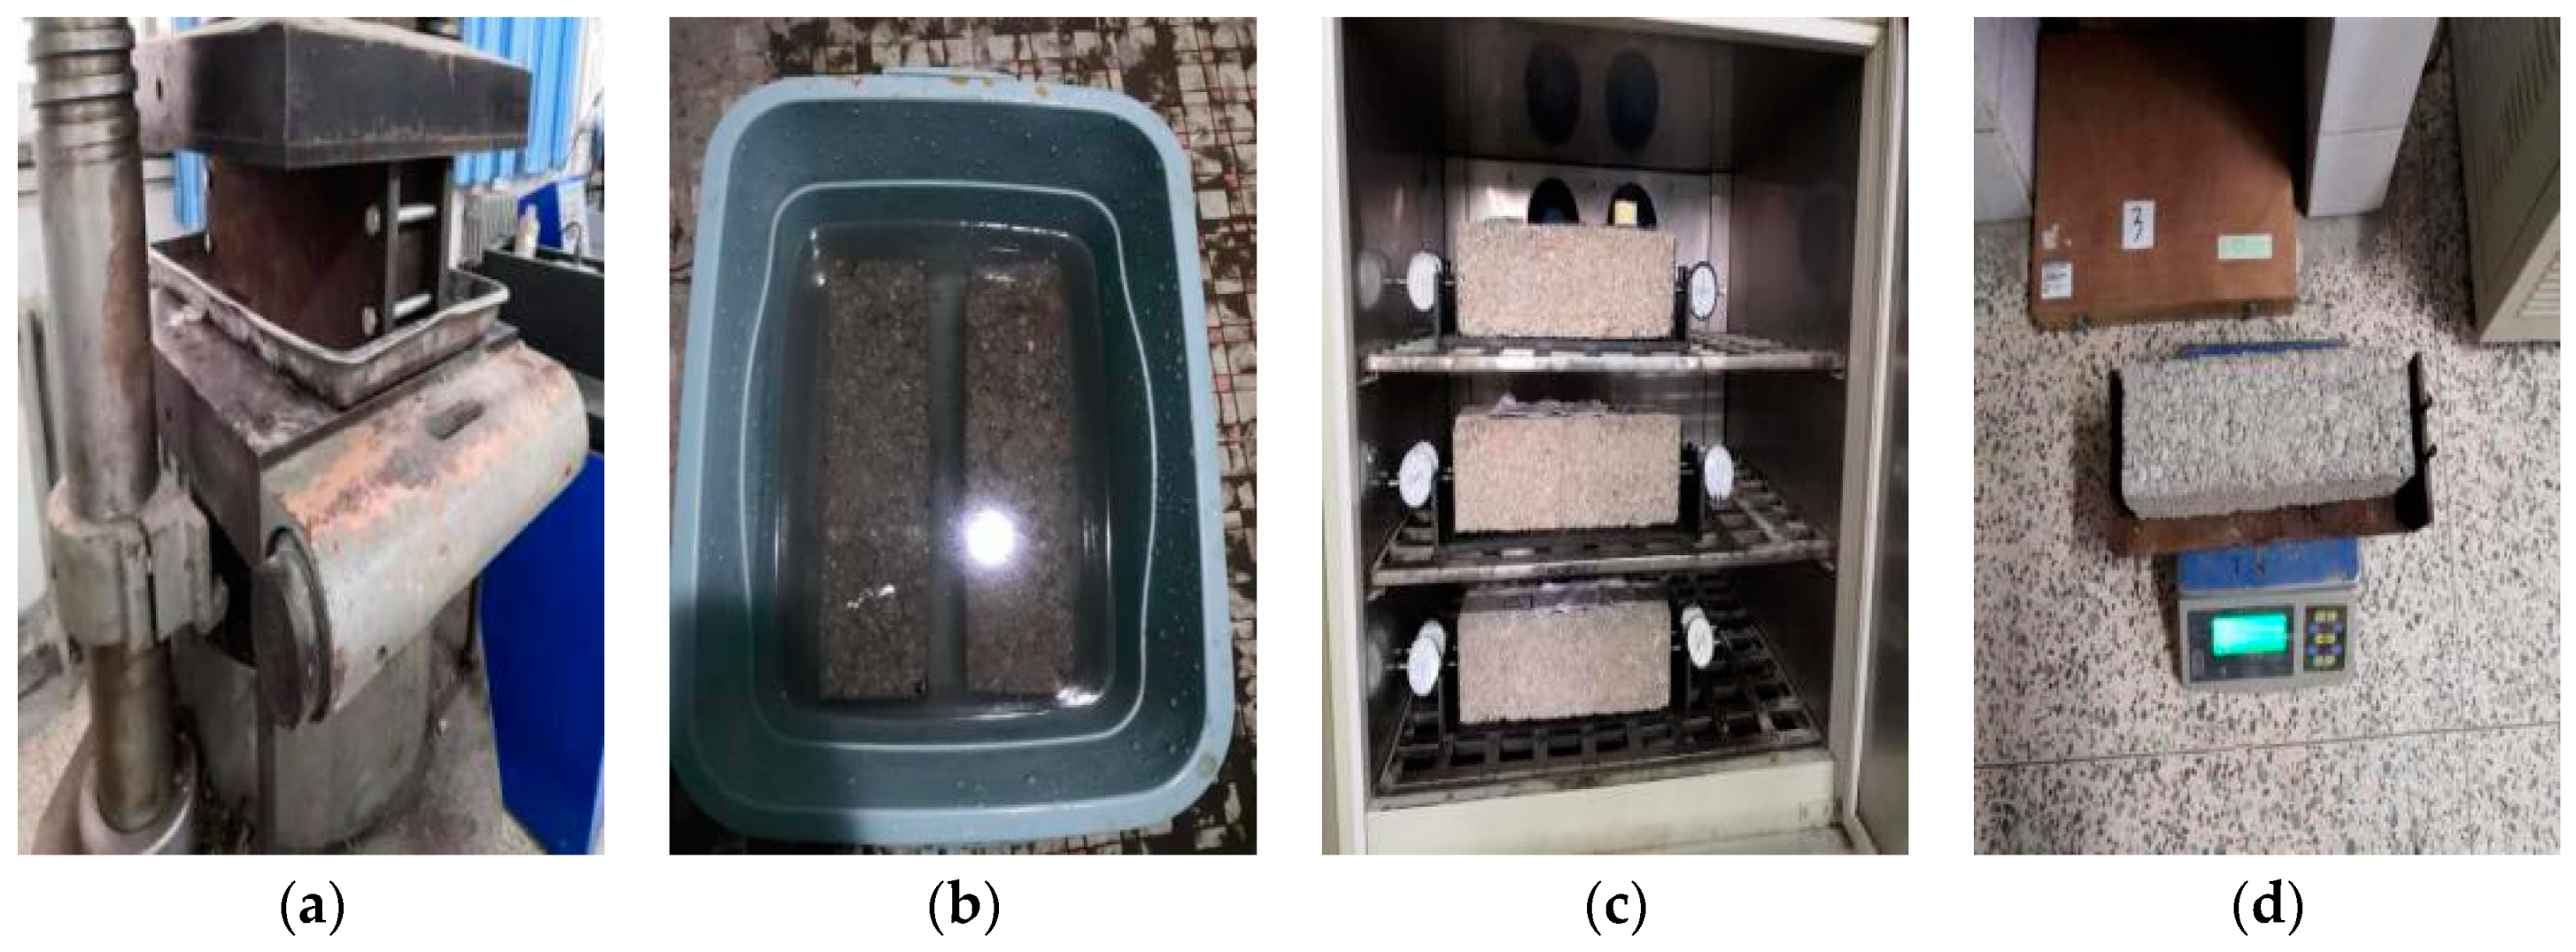
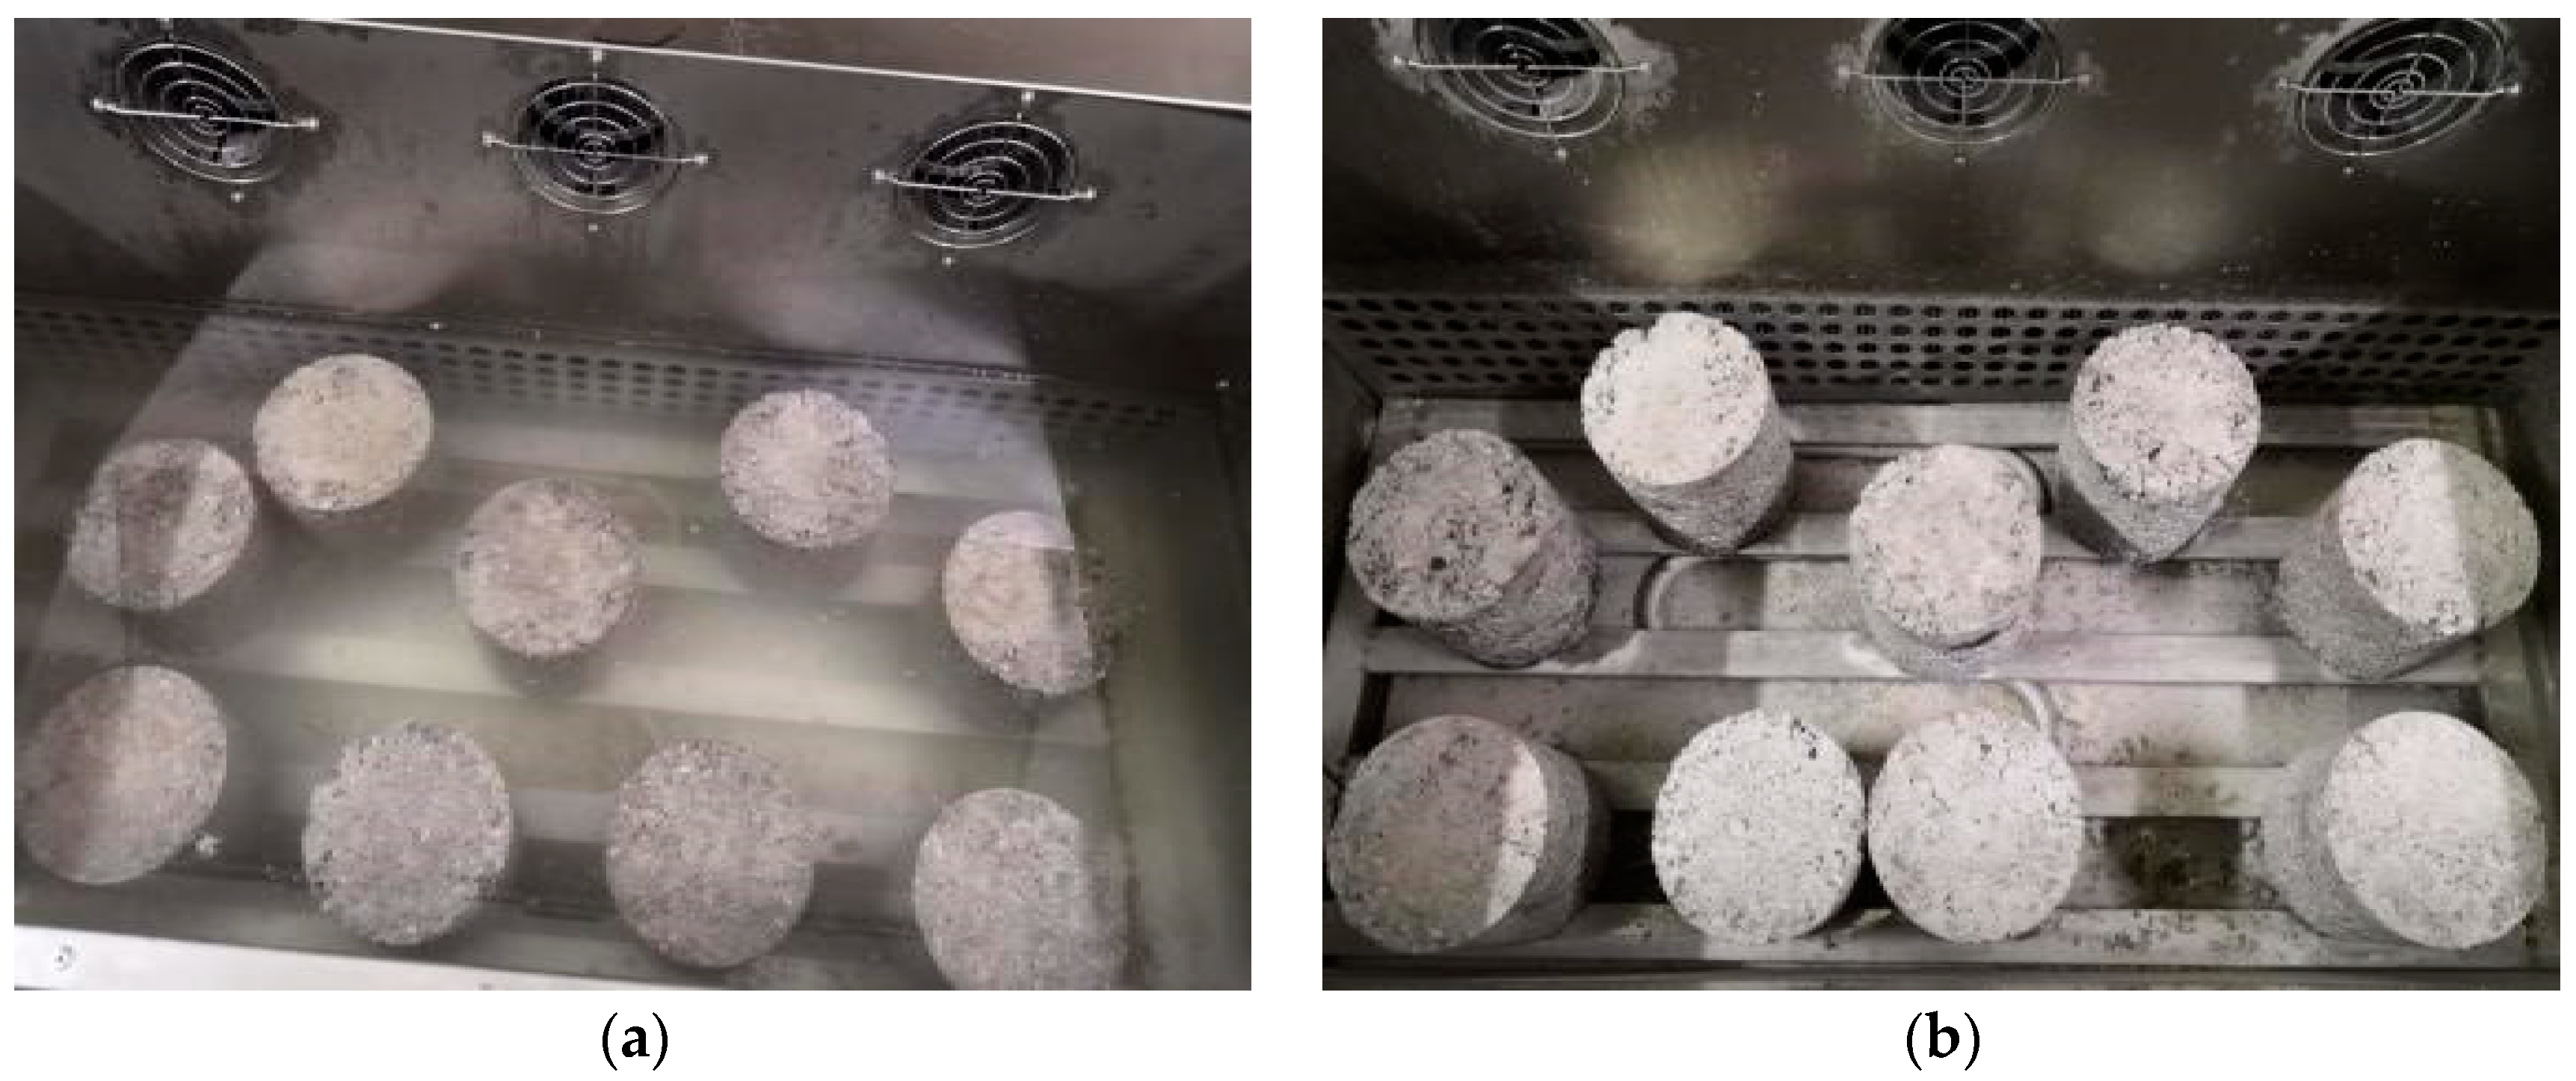
2.11. Freeze-Thaw Performance Test
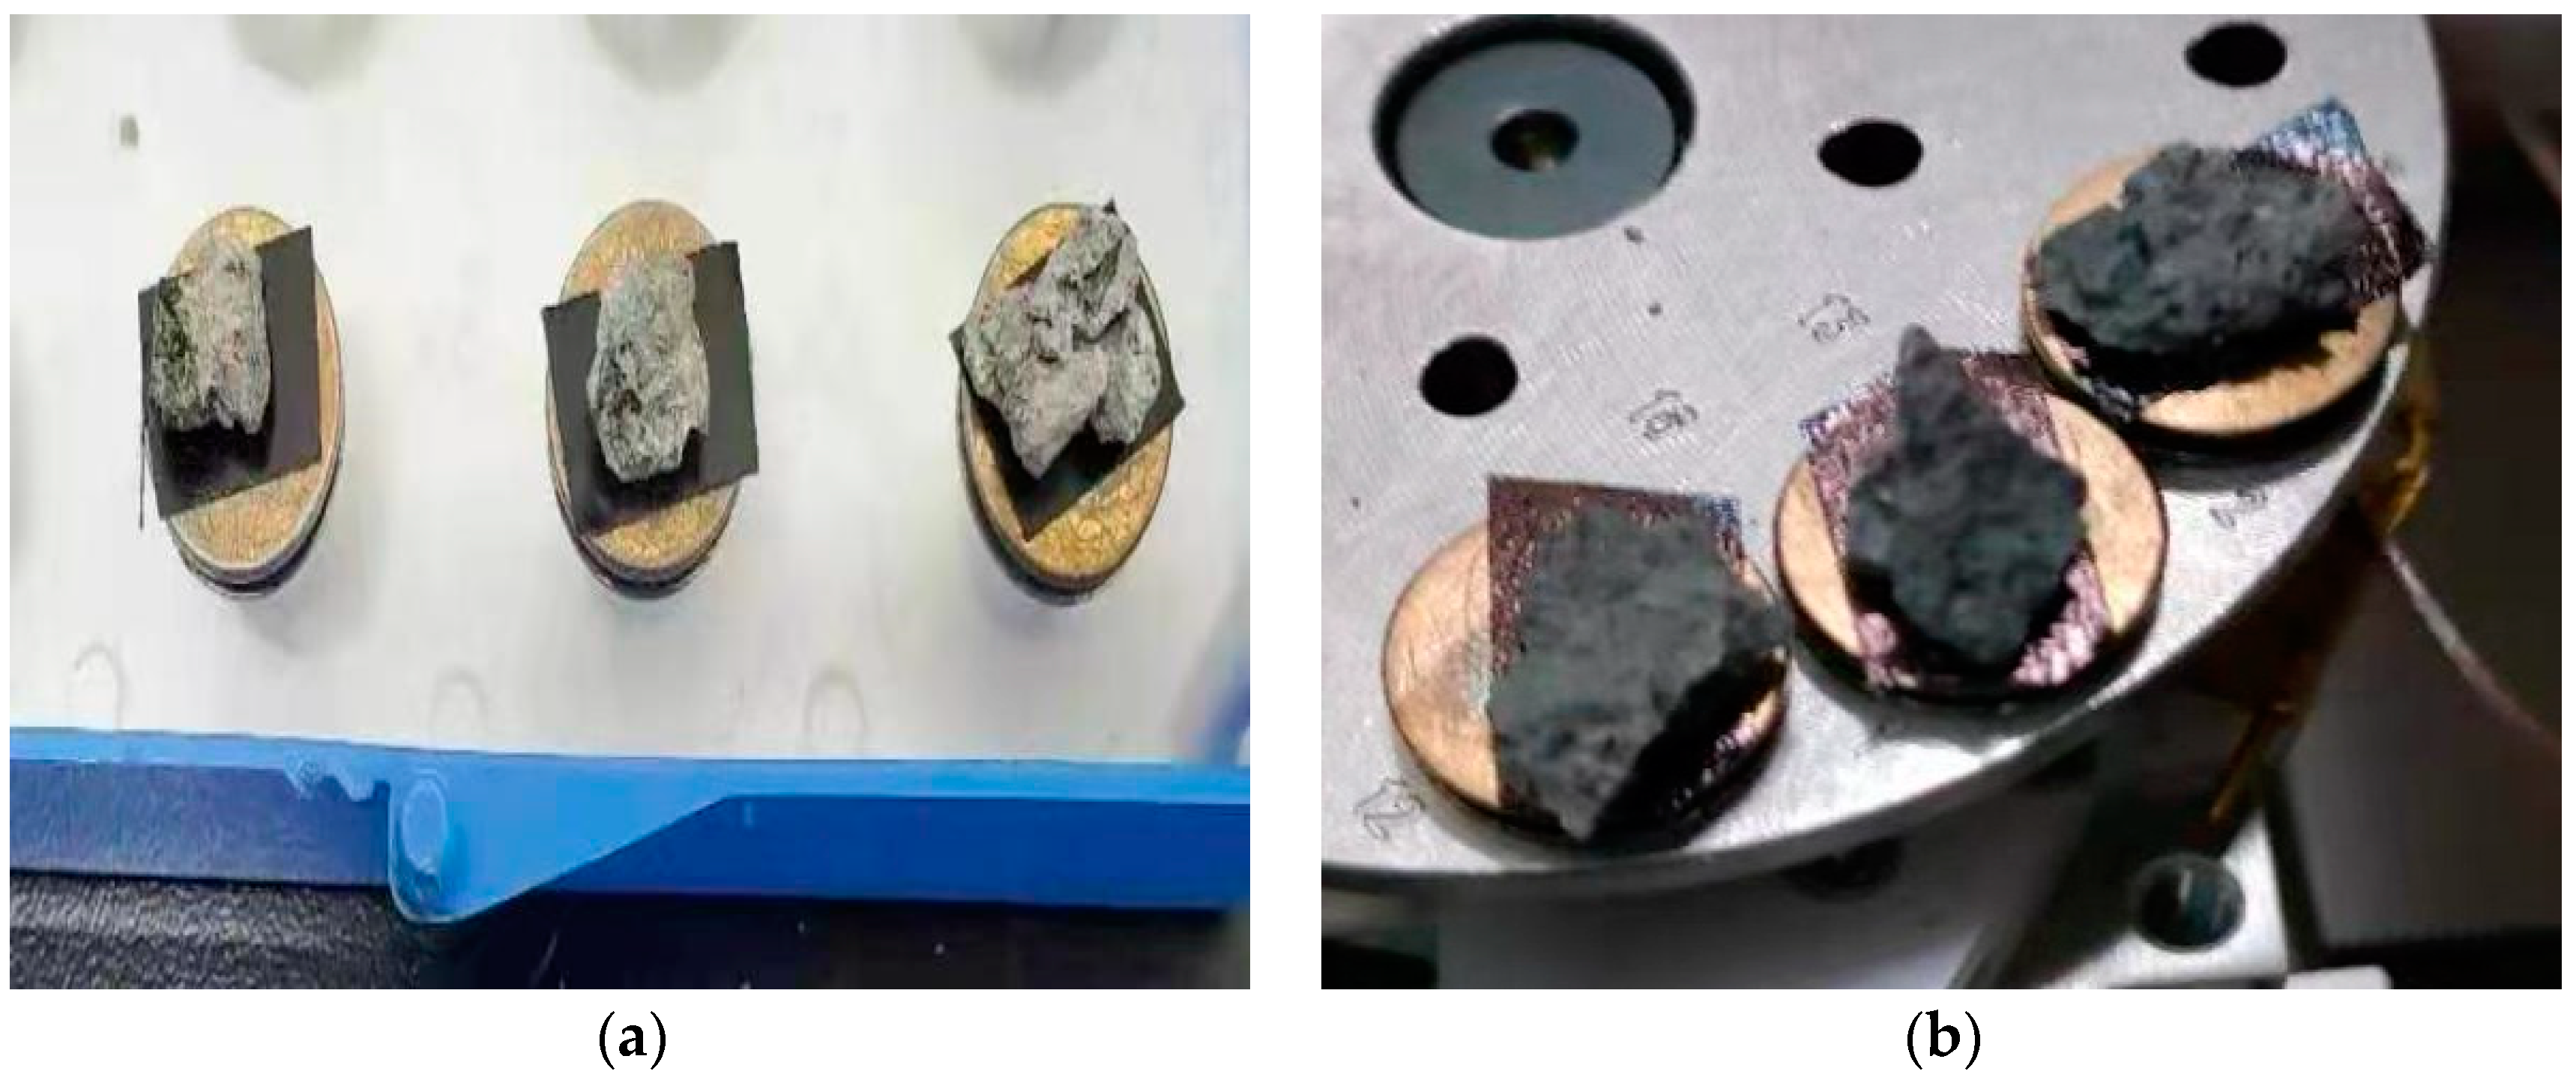
2.12. Scanning Electron Microscope
2.13. Industrial CT Test
3. Results and Discussion
3.1. Analysis of Unconfined Compressive Strength
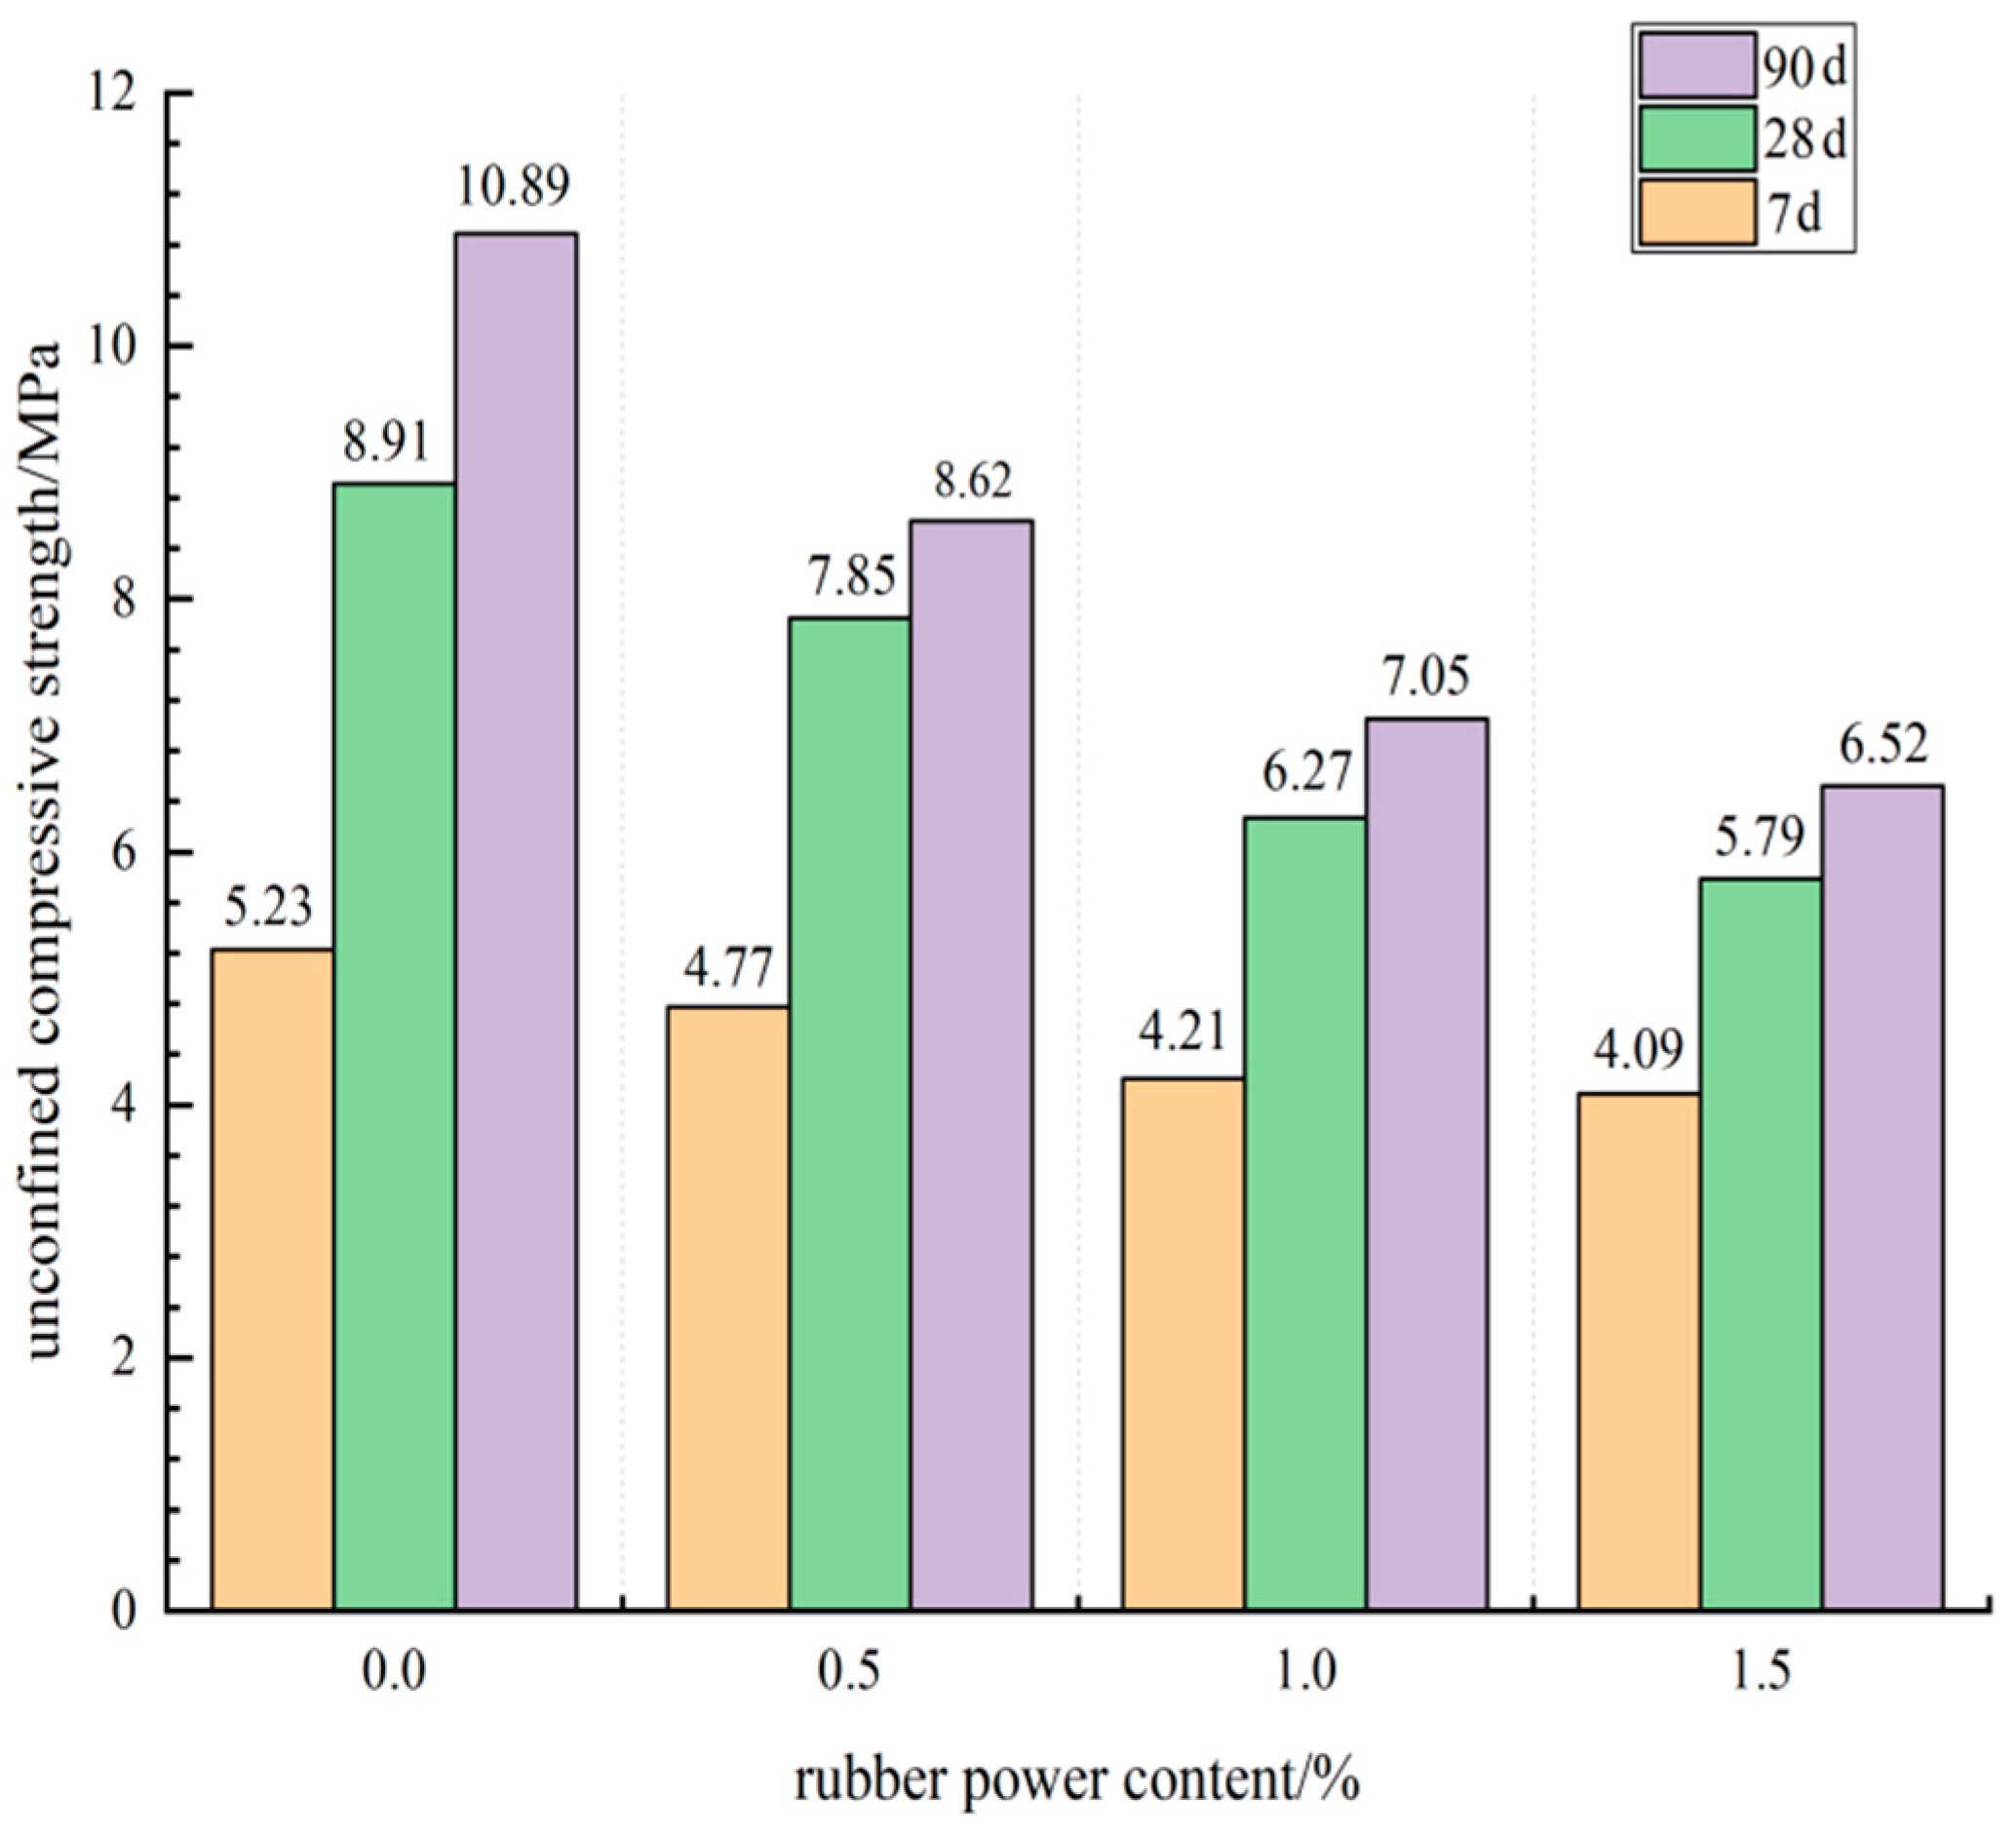
3.1.1. Influence of Rubber Powder Content on Unconfined Compressive Strength
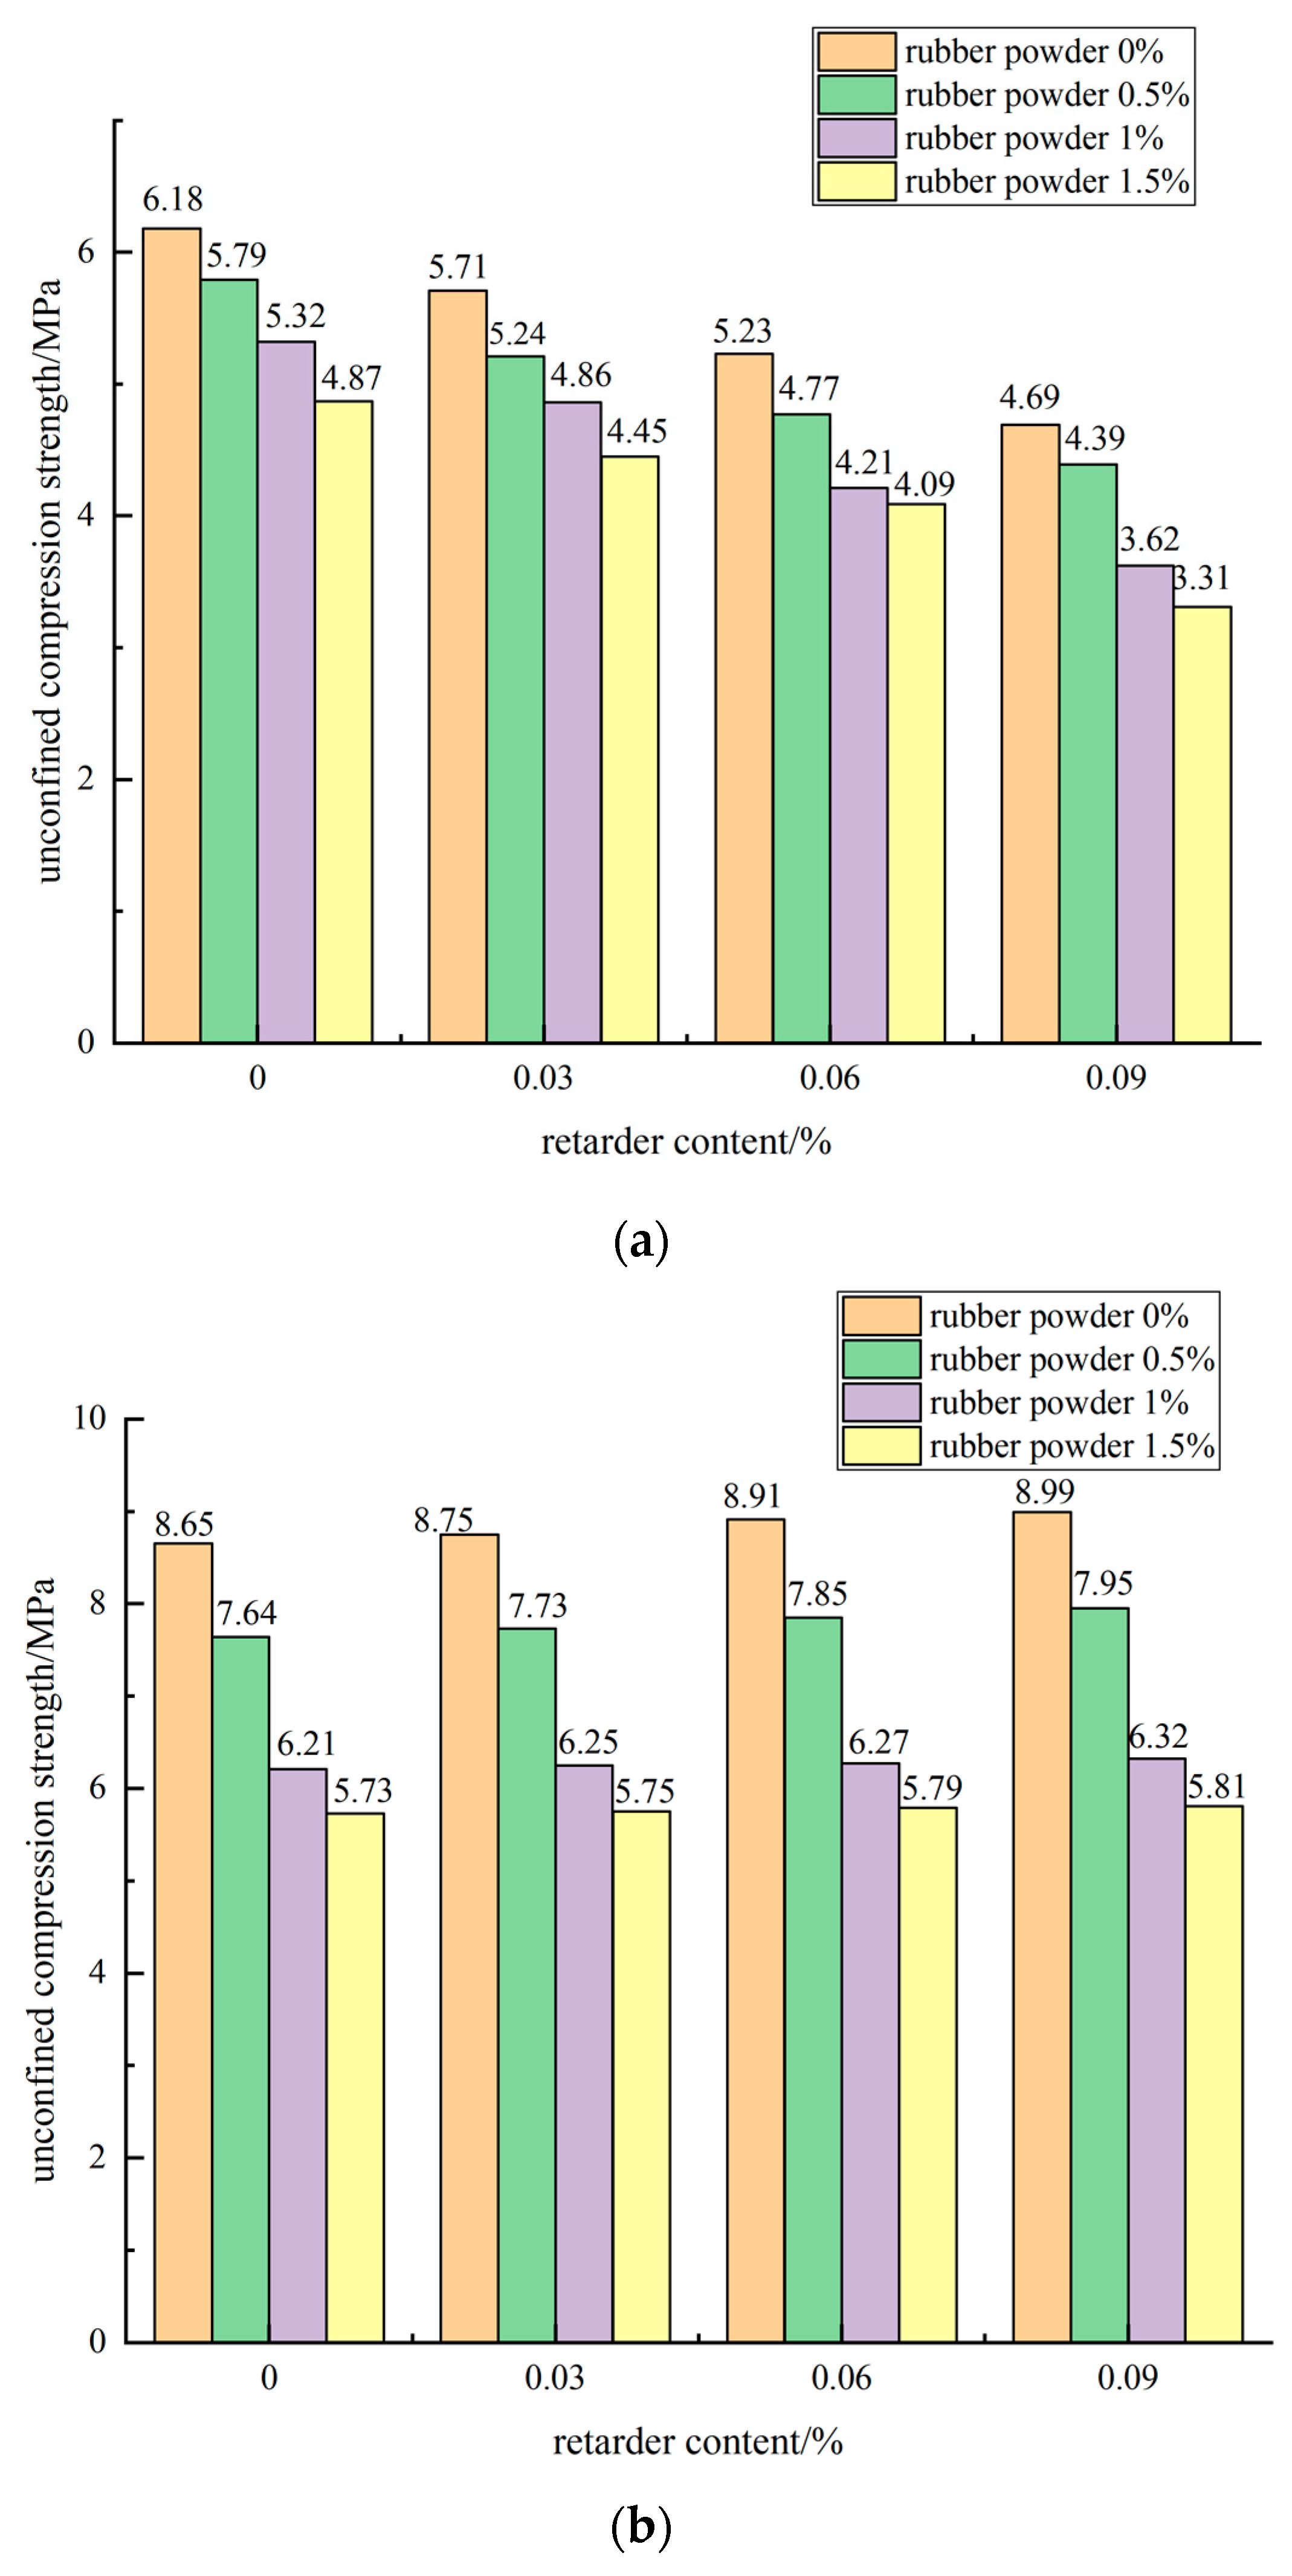
3.1.2. Effect of Retarder Dosage on Unconfined Compressive Strength
3.1.3. Effect of Composite of Rubber Powder and Retarder on Unconfined Compressive Strength
3.2. Splitting Strength Analysis
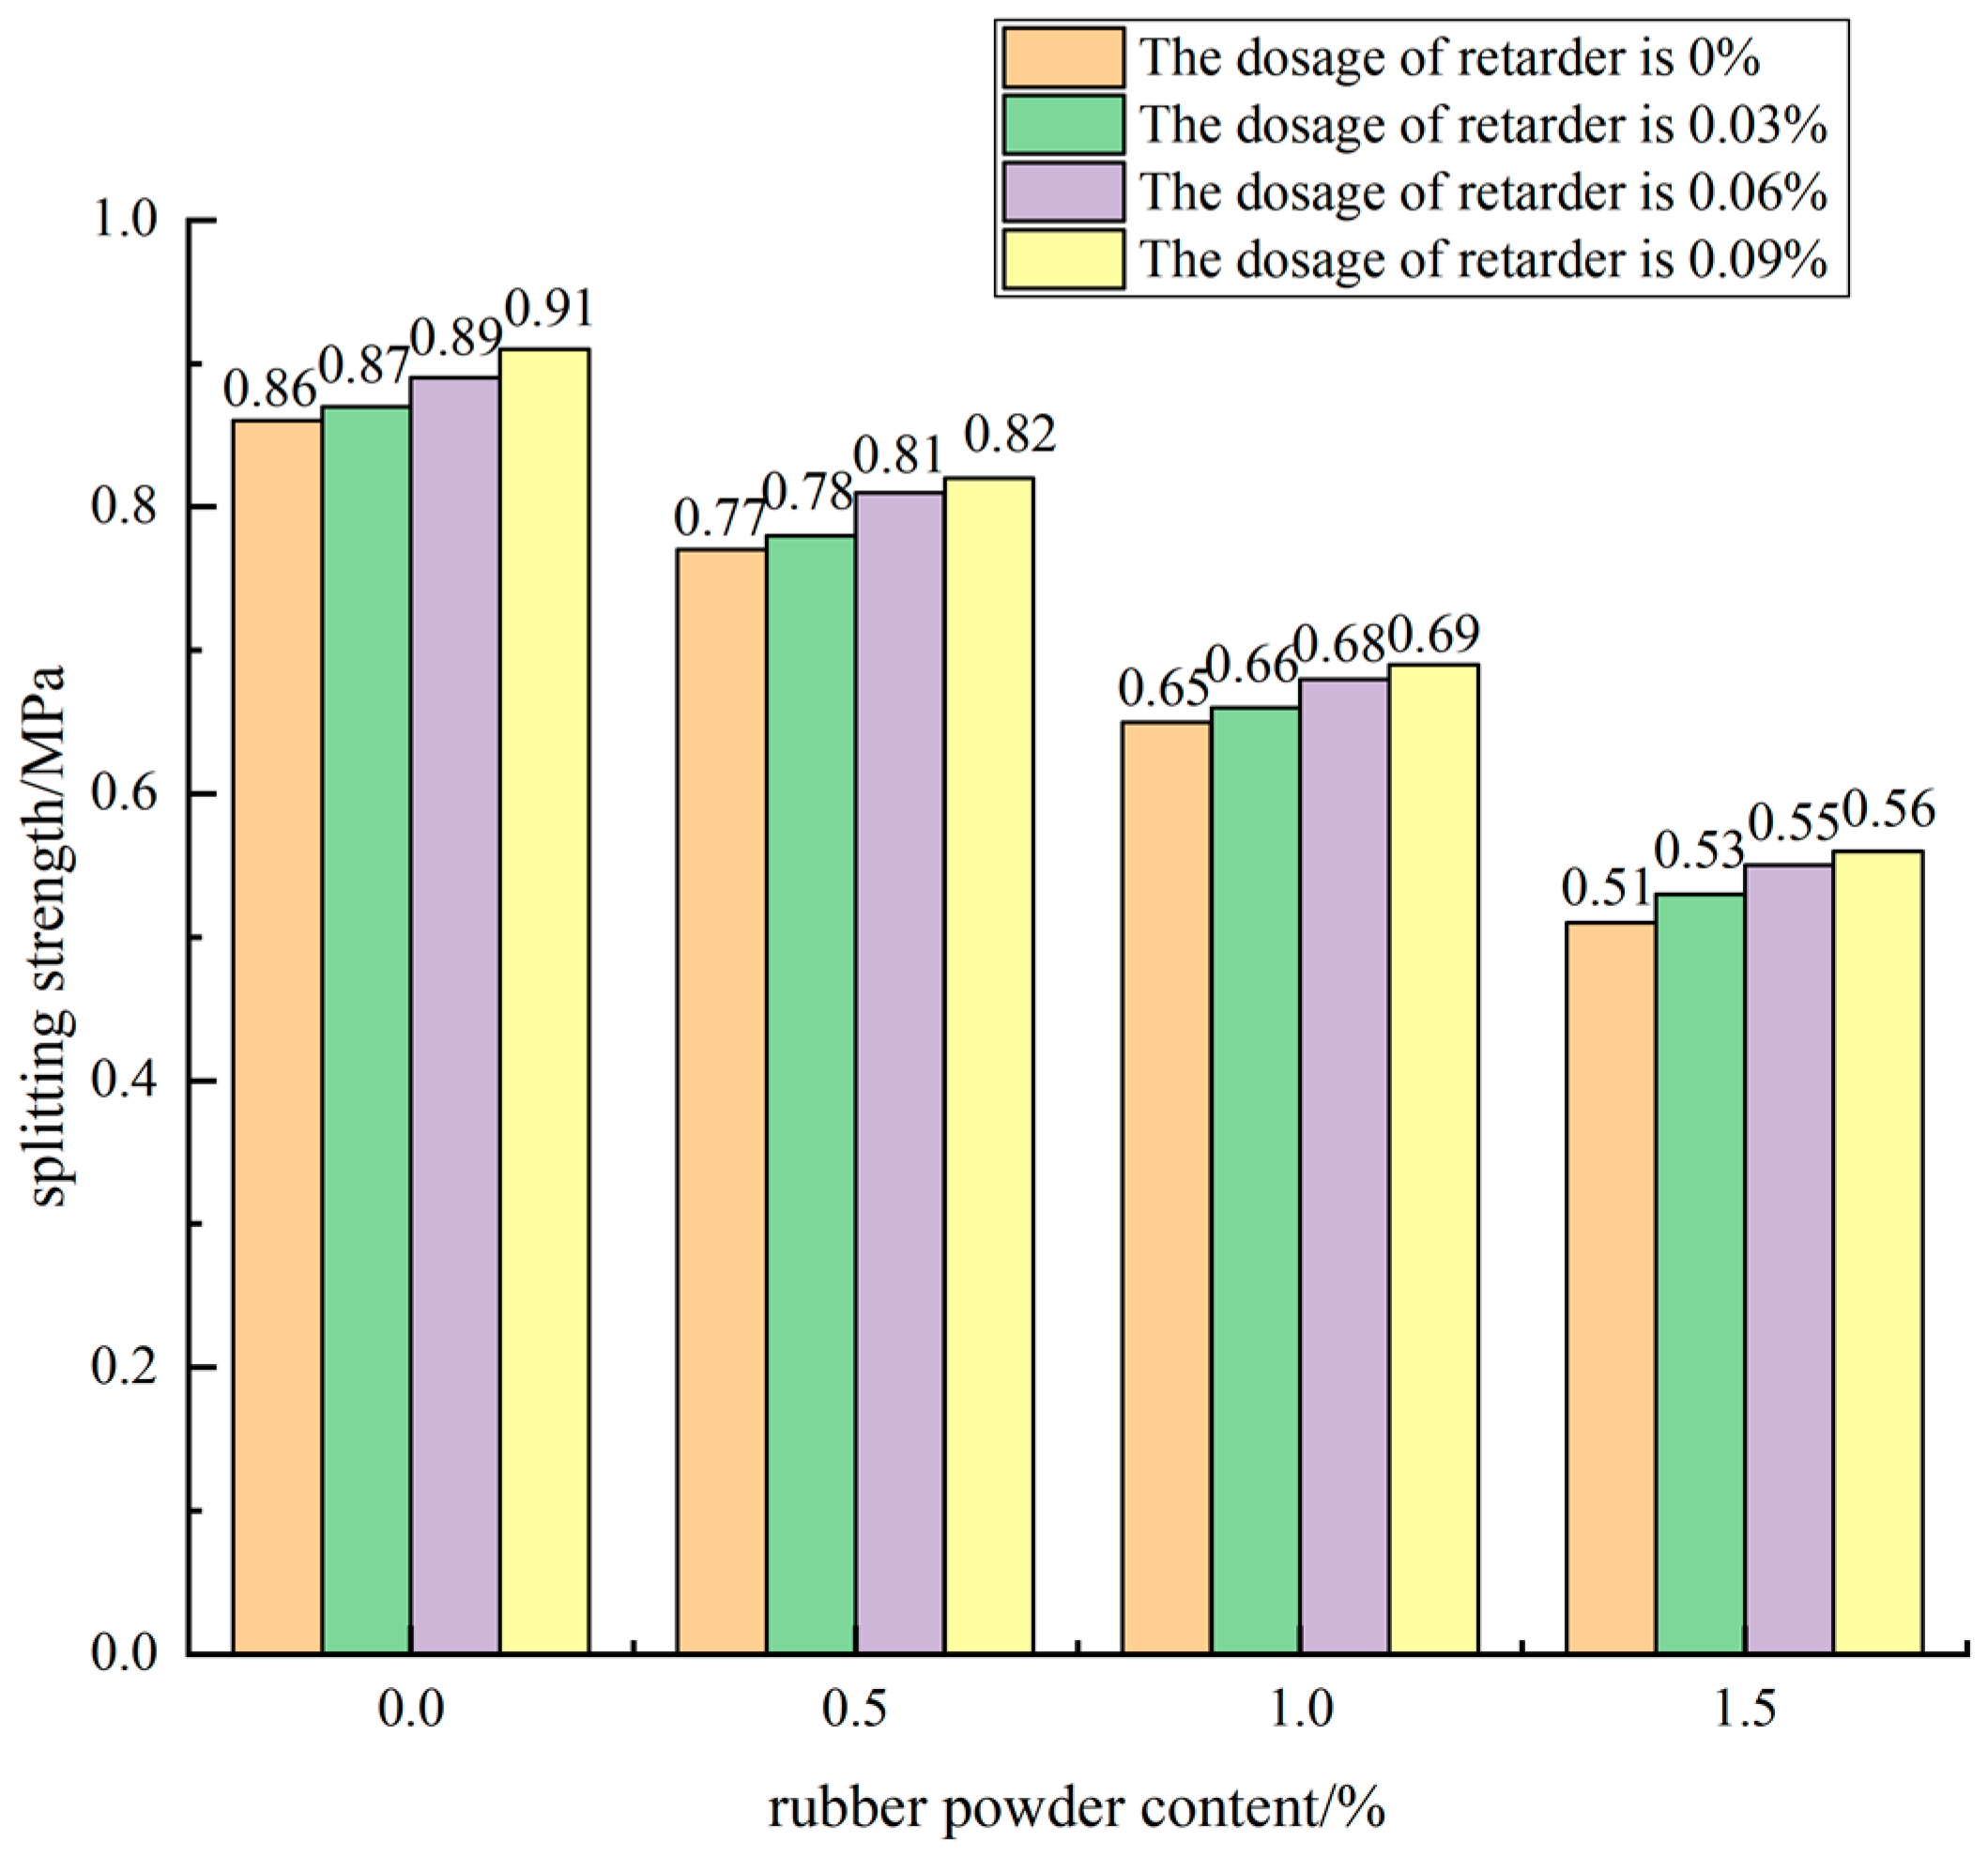
3.2.1. Effect of Rubber Powder Content on Splitting Strength
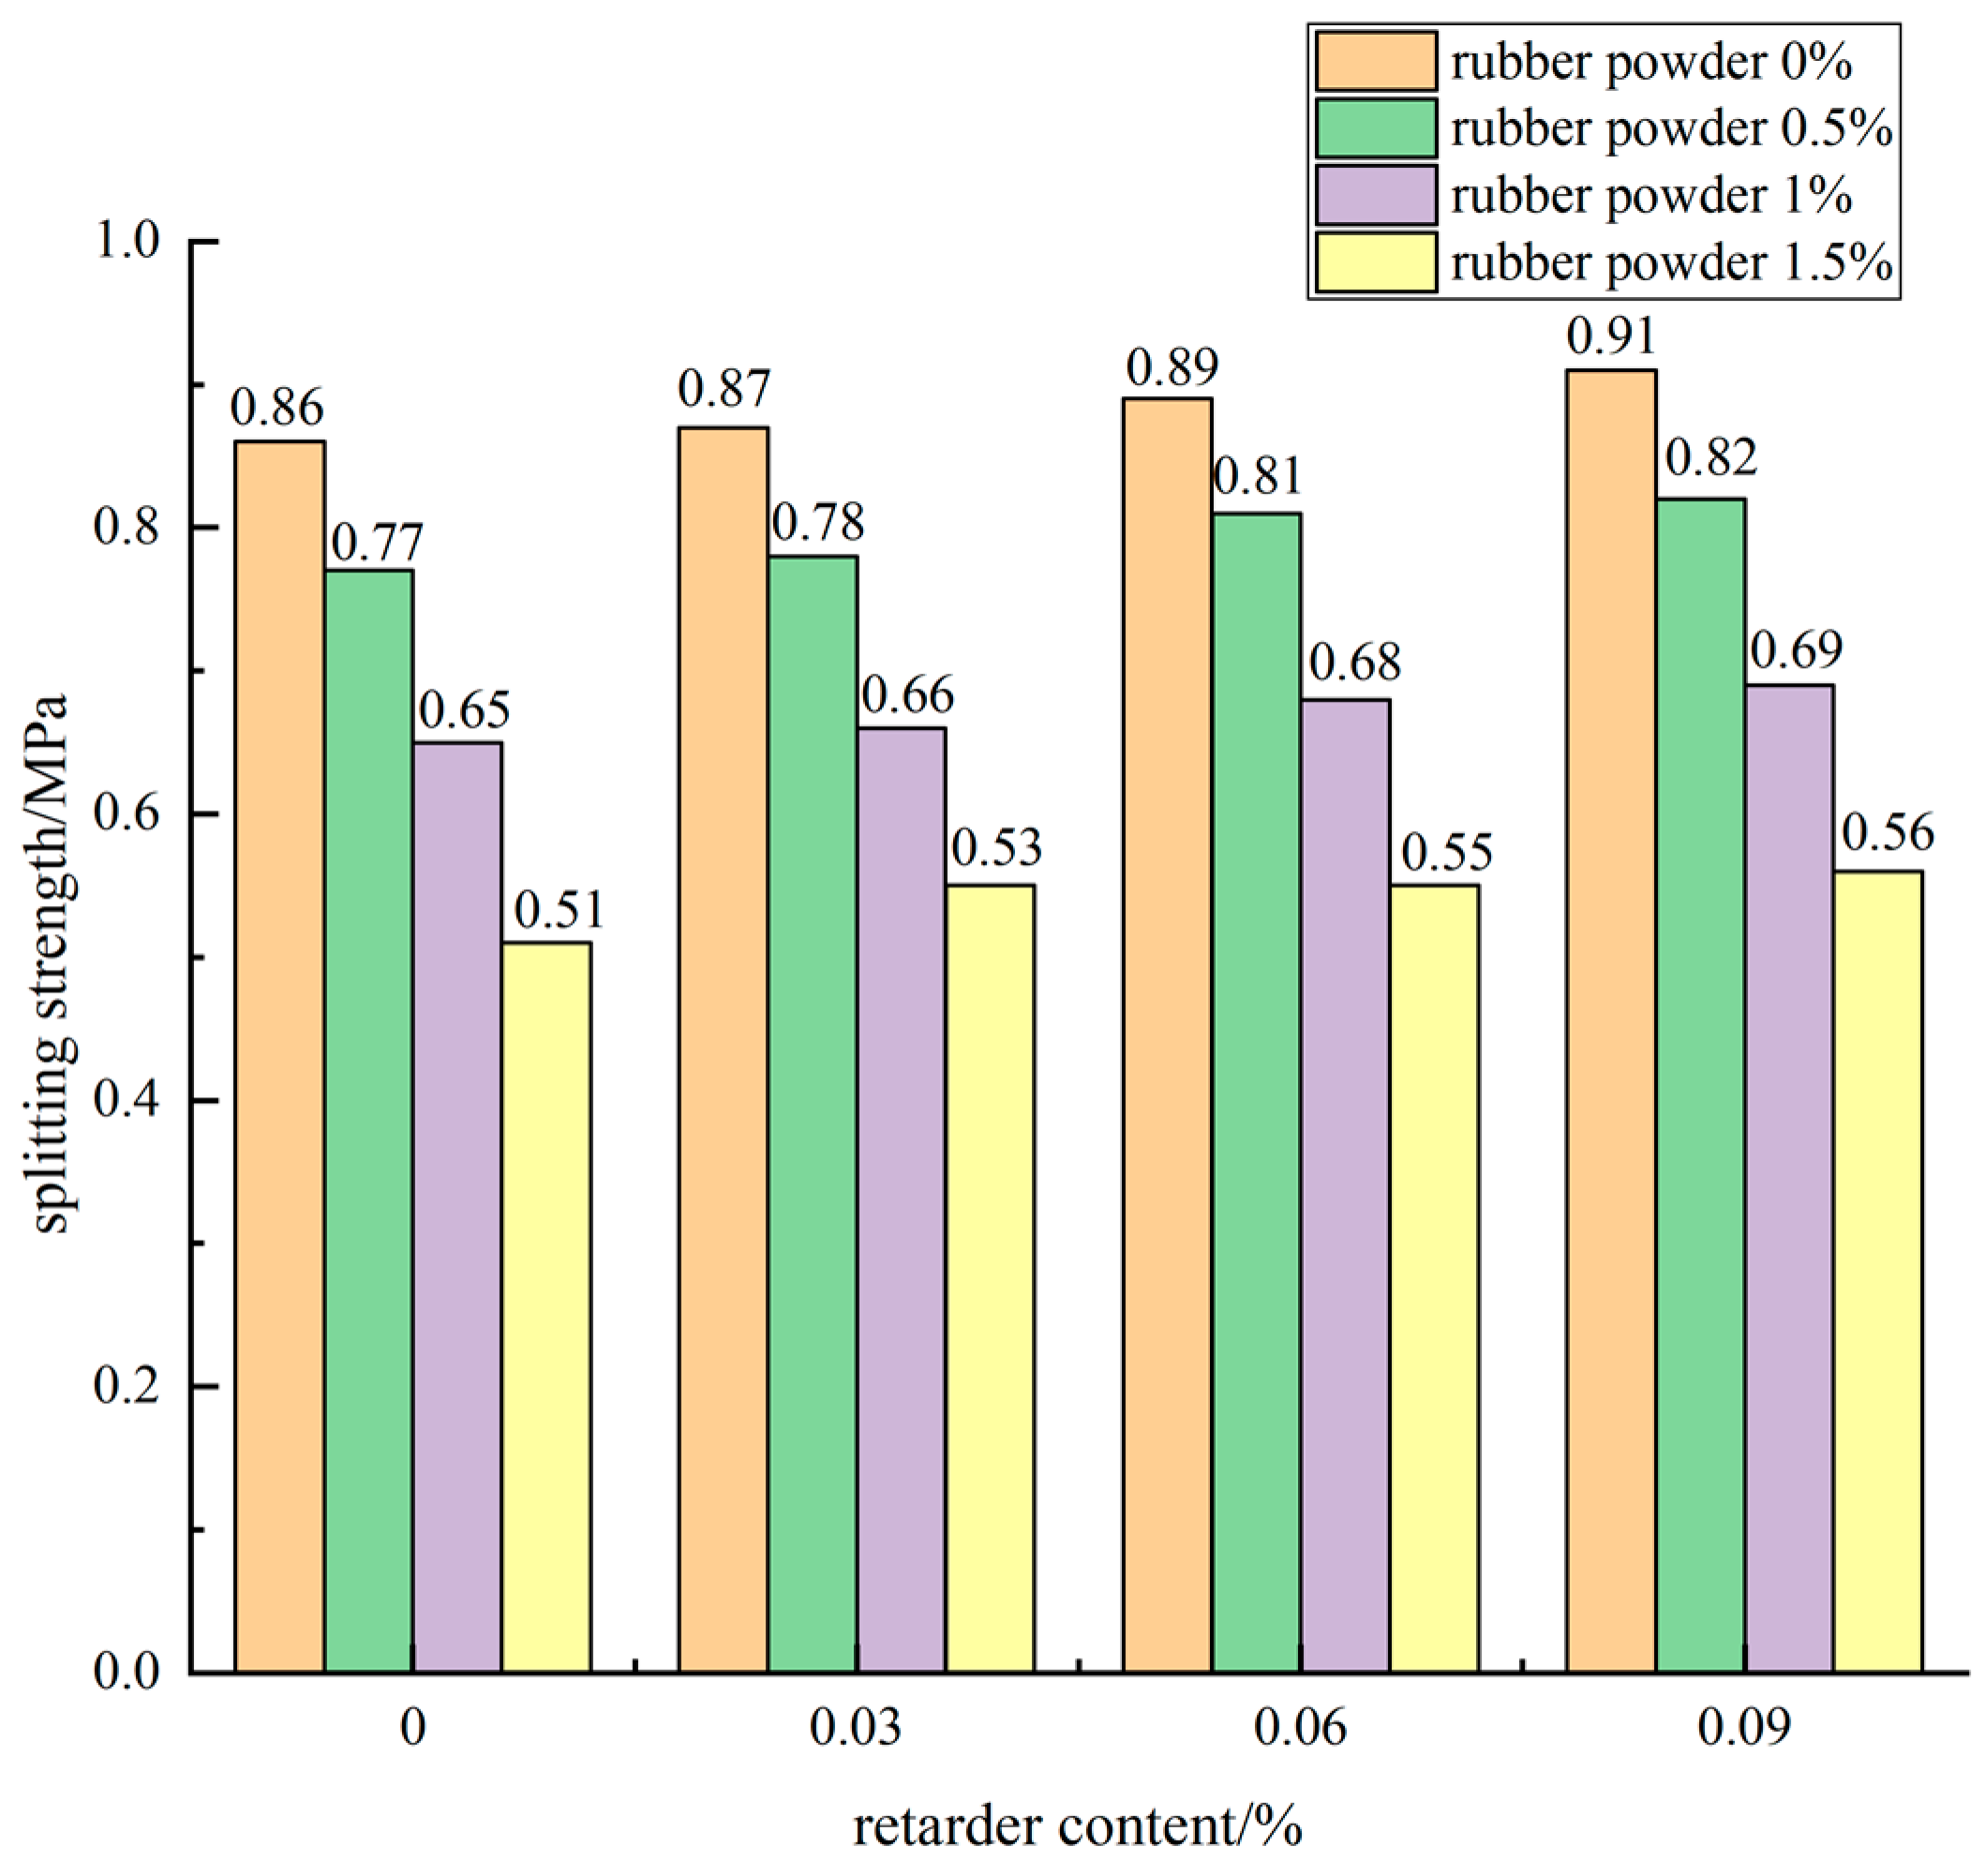
3.2.2. Effect of Retarder Dosage on Splitting Strength
3.2.3. Effect of Compound of Rubber Powder and Retarder on Splitting Strength
3.3. Flexural Tensile Strength Analysis
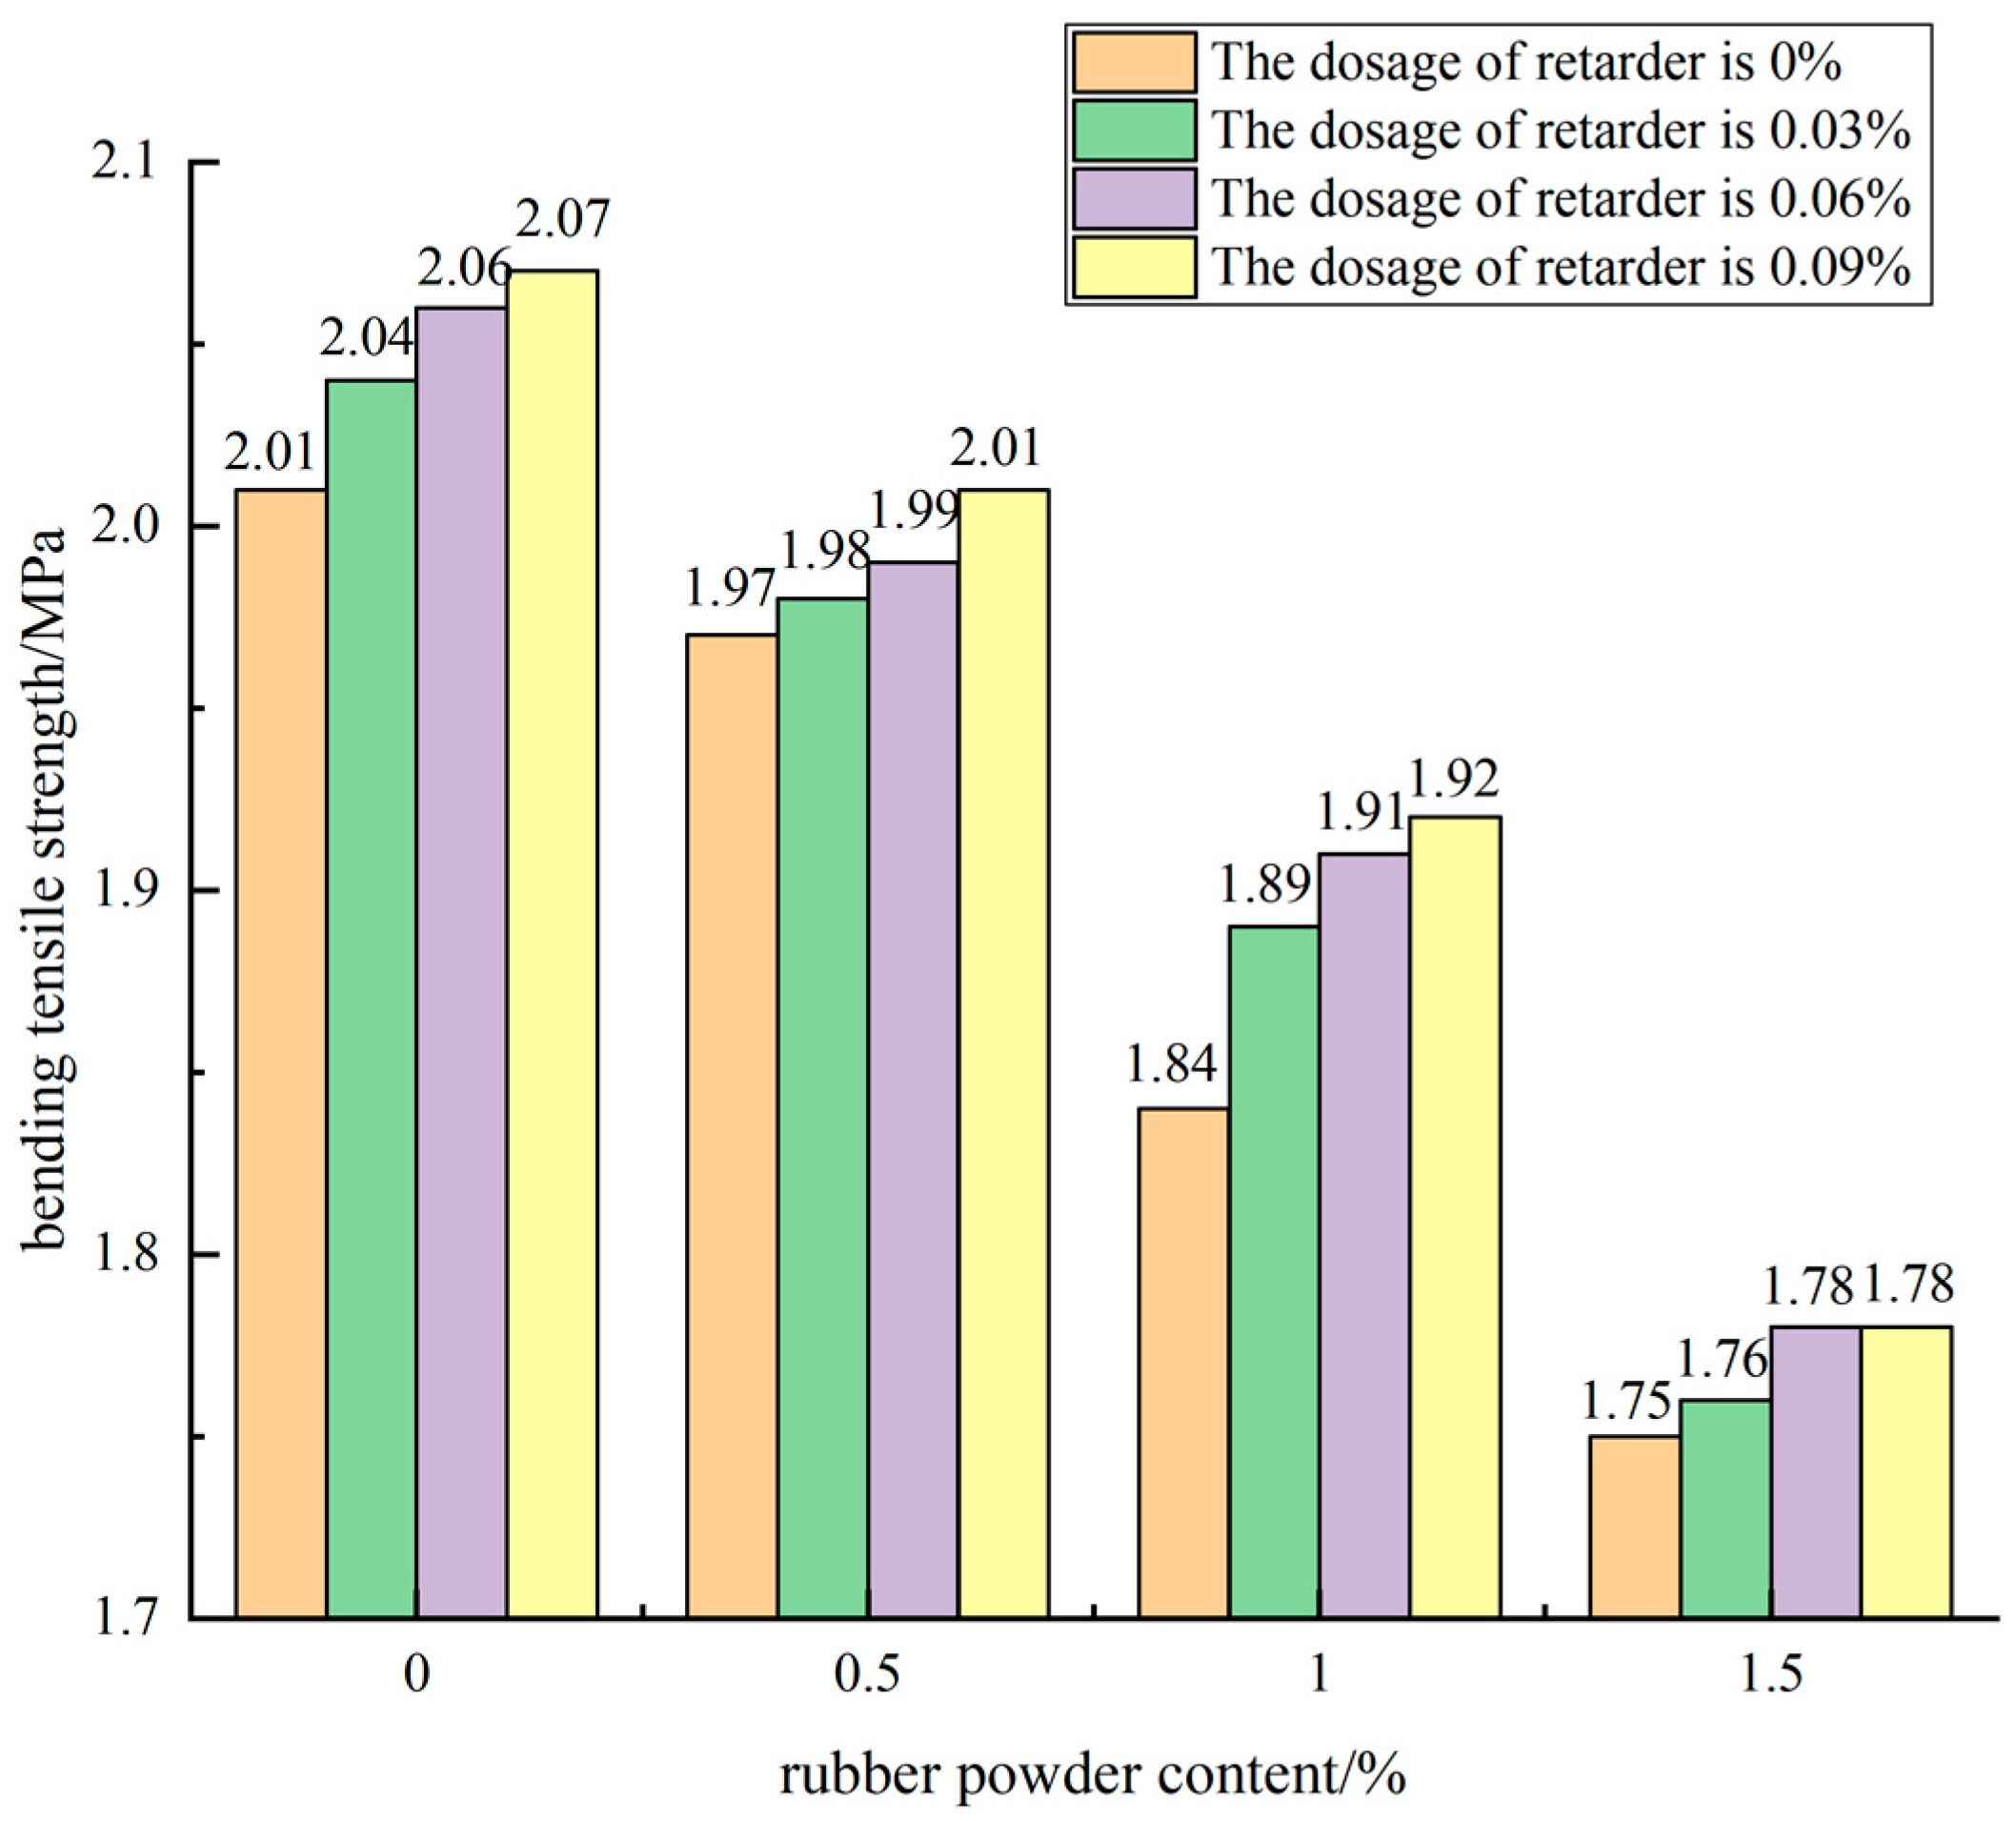
3.3.1. Effect of Rubber Powder Content on Flexural Tensile Strength
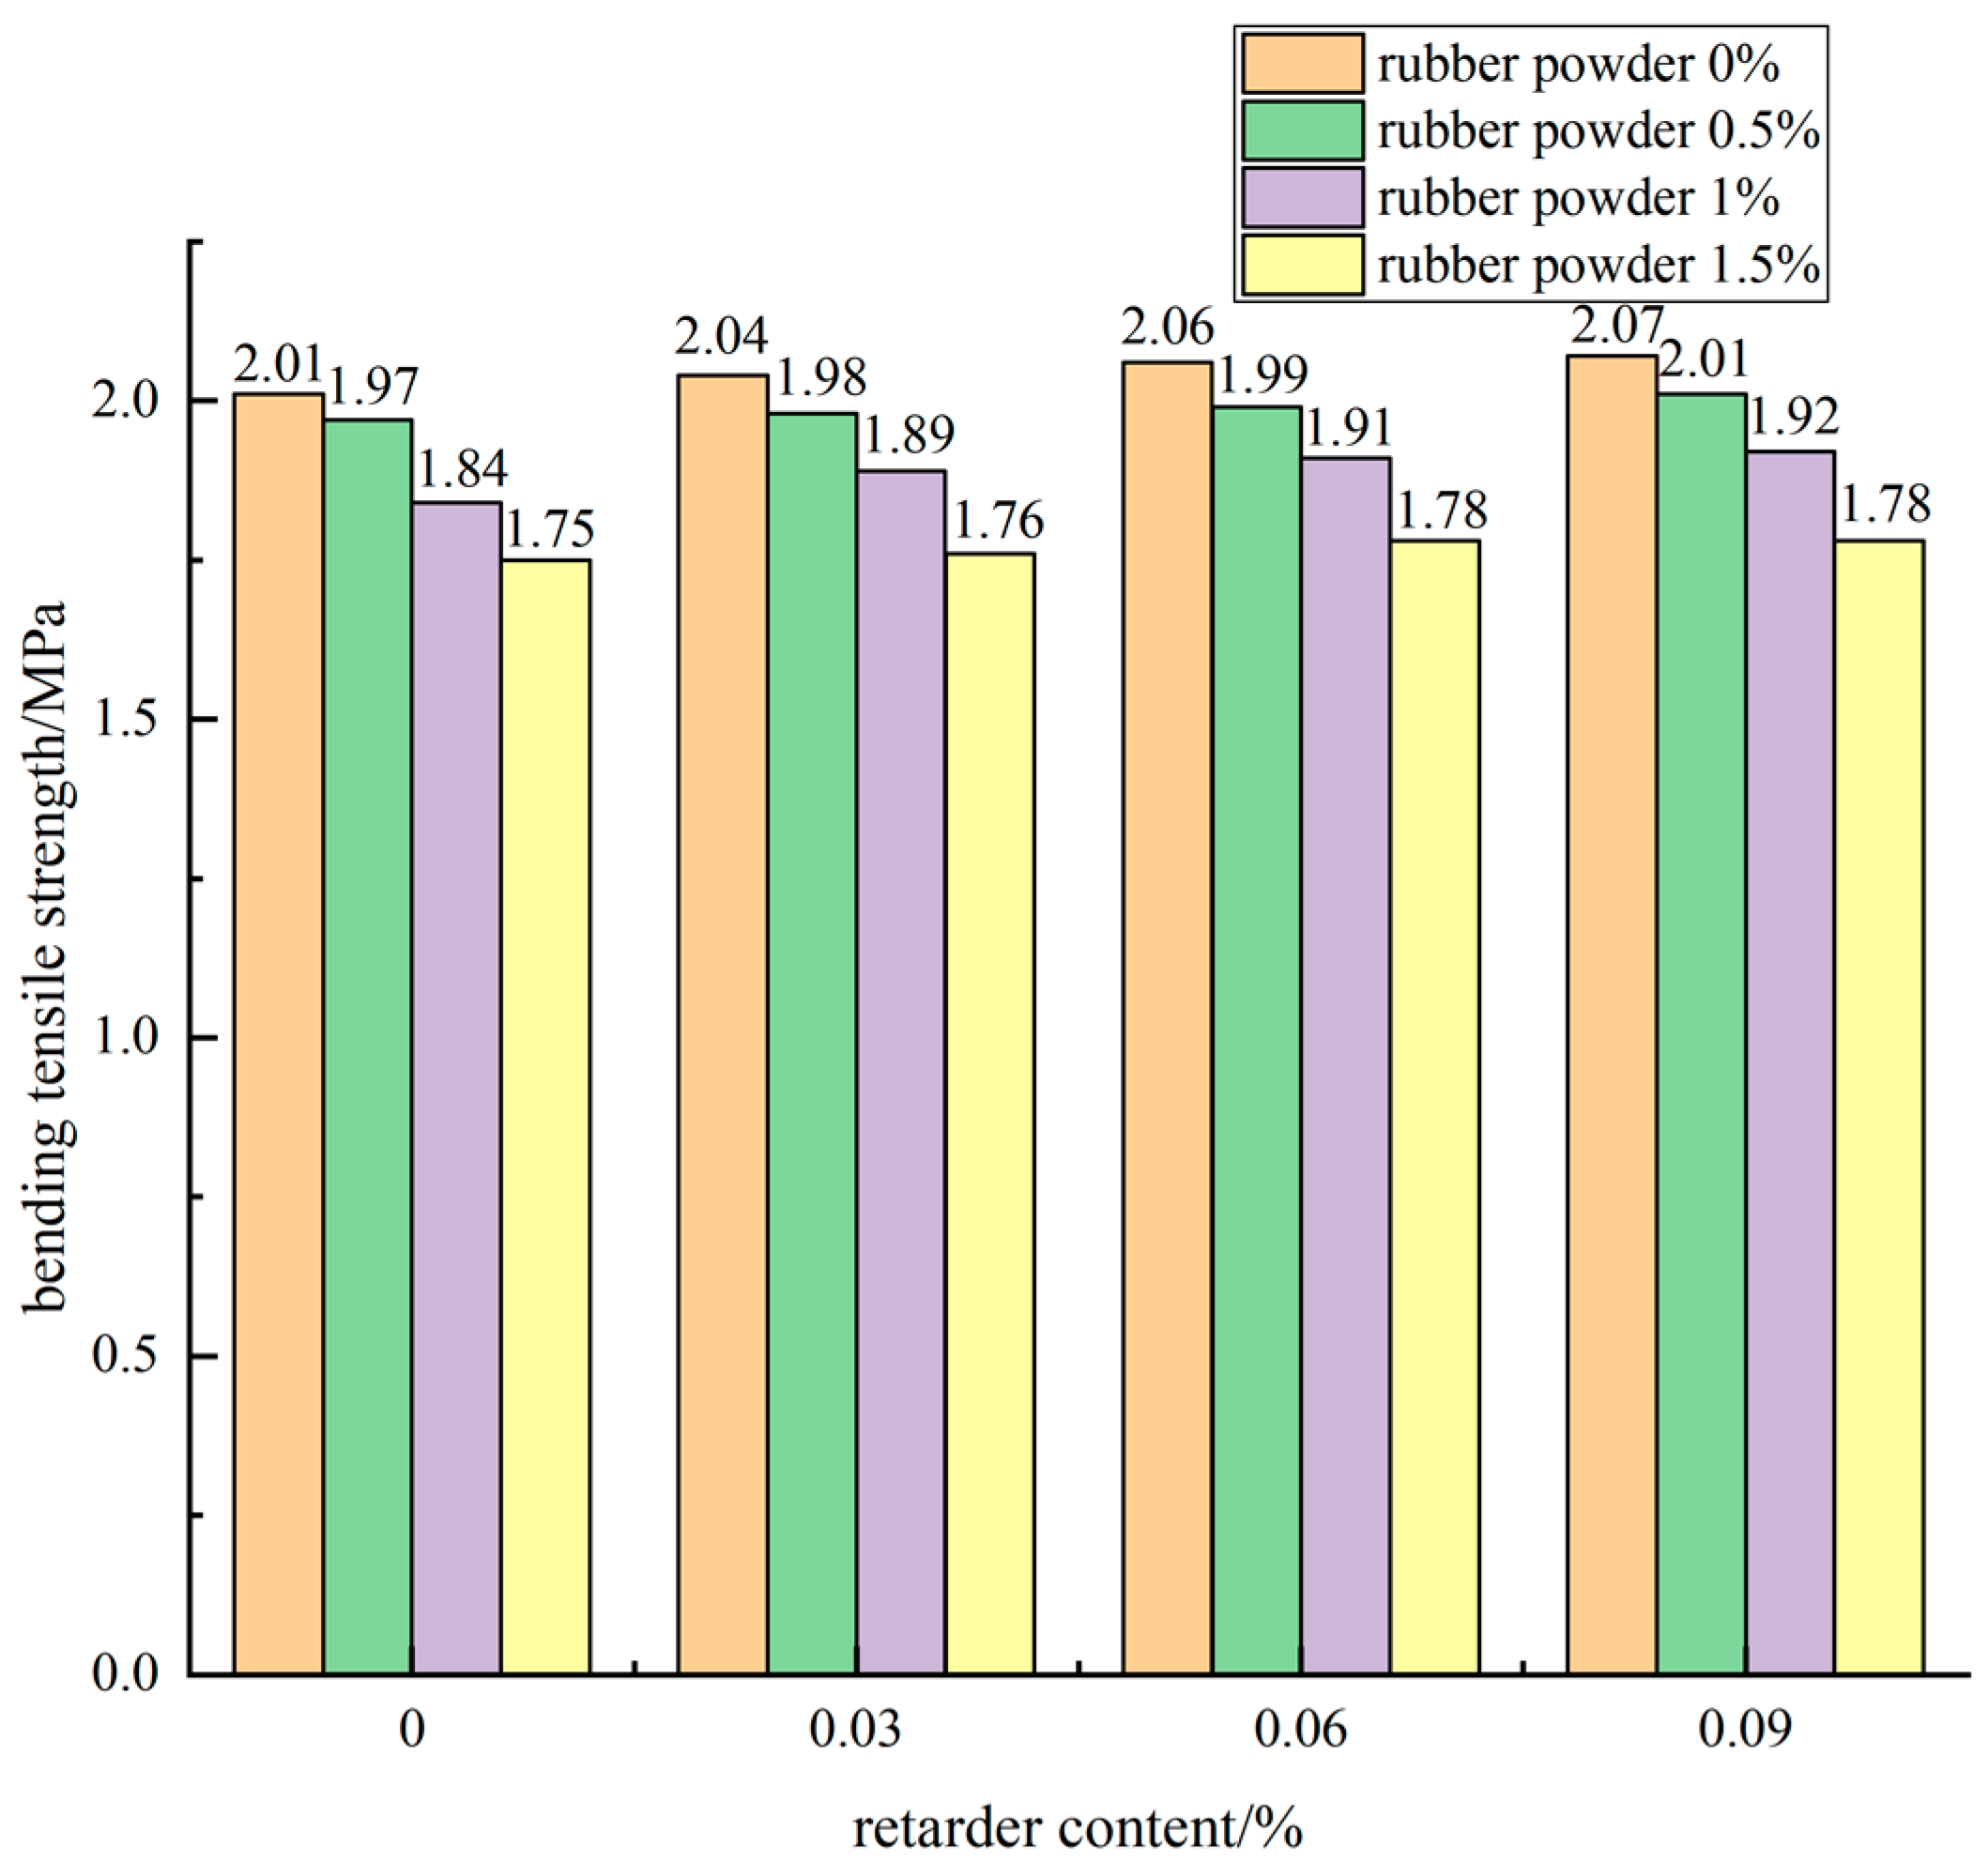
3.3.2. Effect of Retarder Content on Flexural Tensile Strength
3.3.3. Effect of Compound of Rubber Powder and Retarder on Flexural Strength
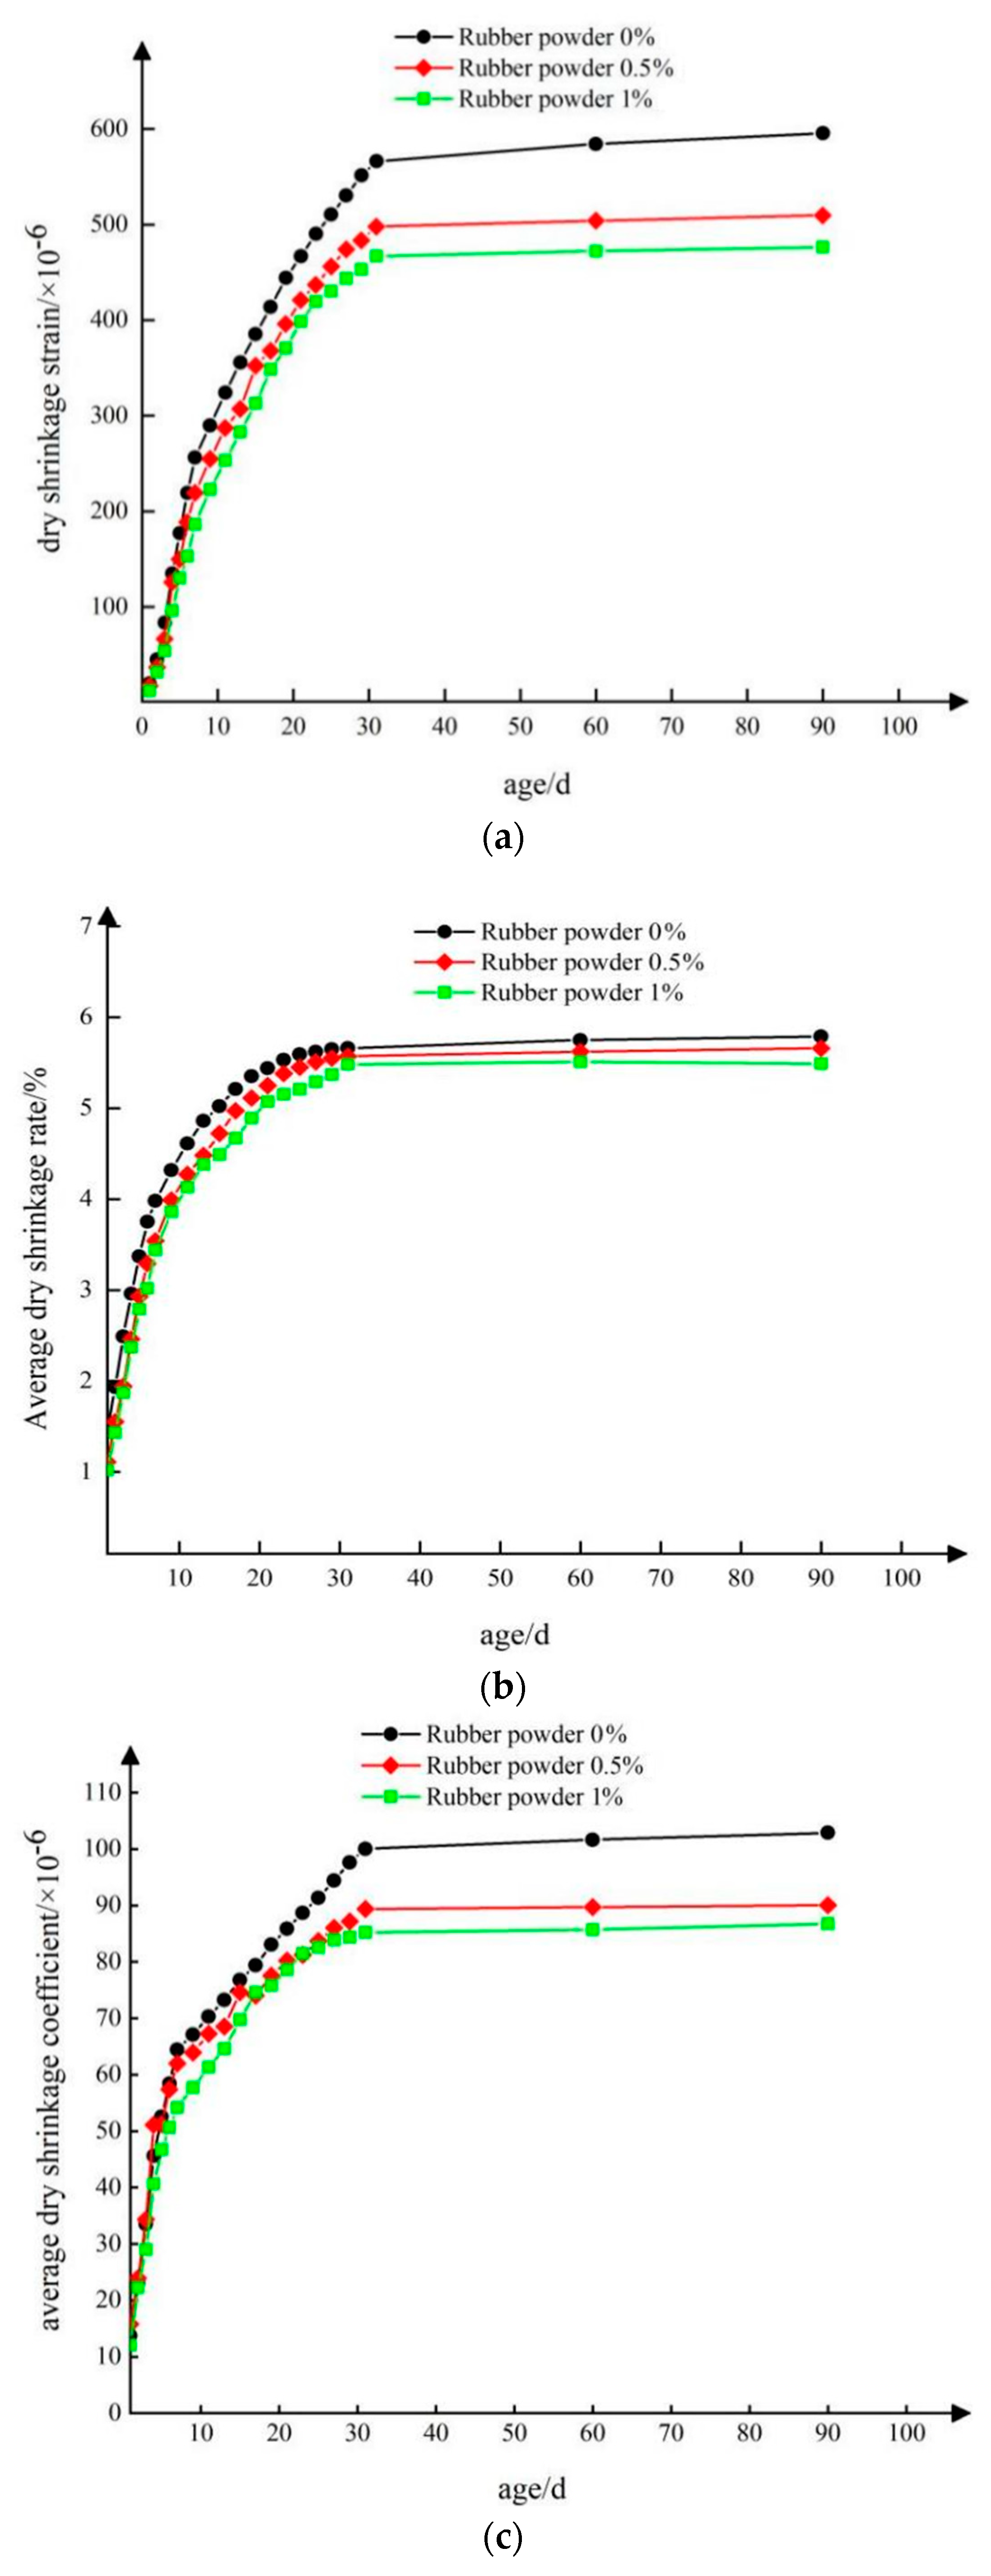
3.4. Dry Shrinkage Performance Analysis
3.5. Freeze-Thaw Performance Analysis
3.5.1. Effect of Rubber Powder Content on Freeze-Thaw Performance
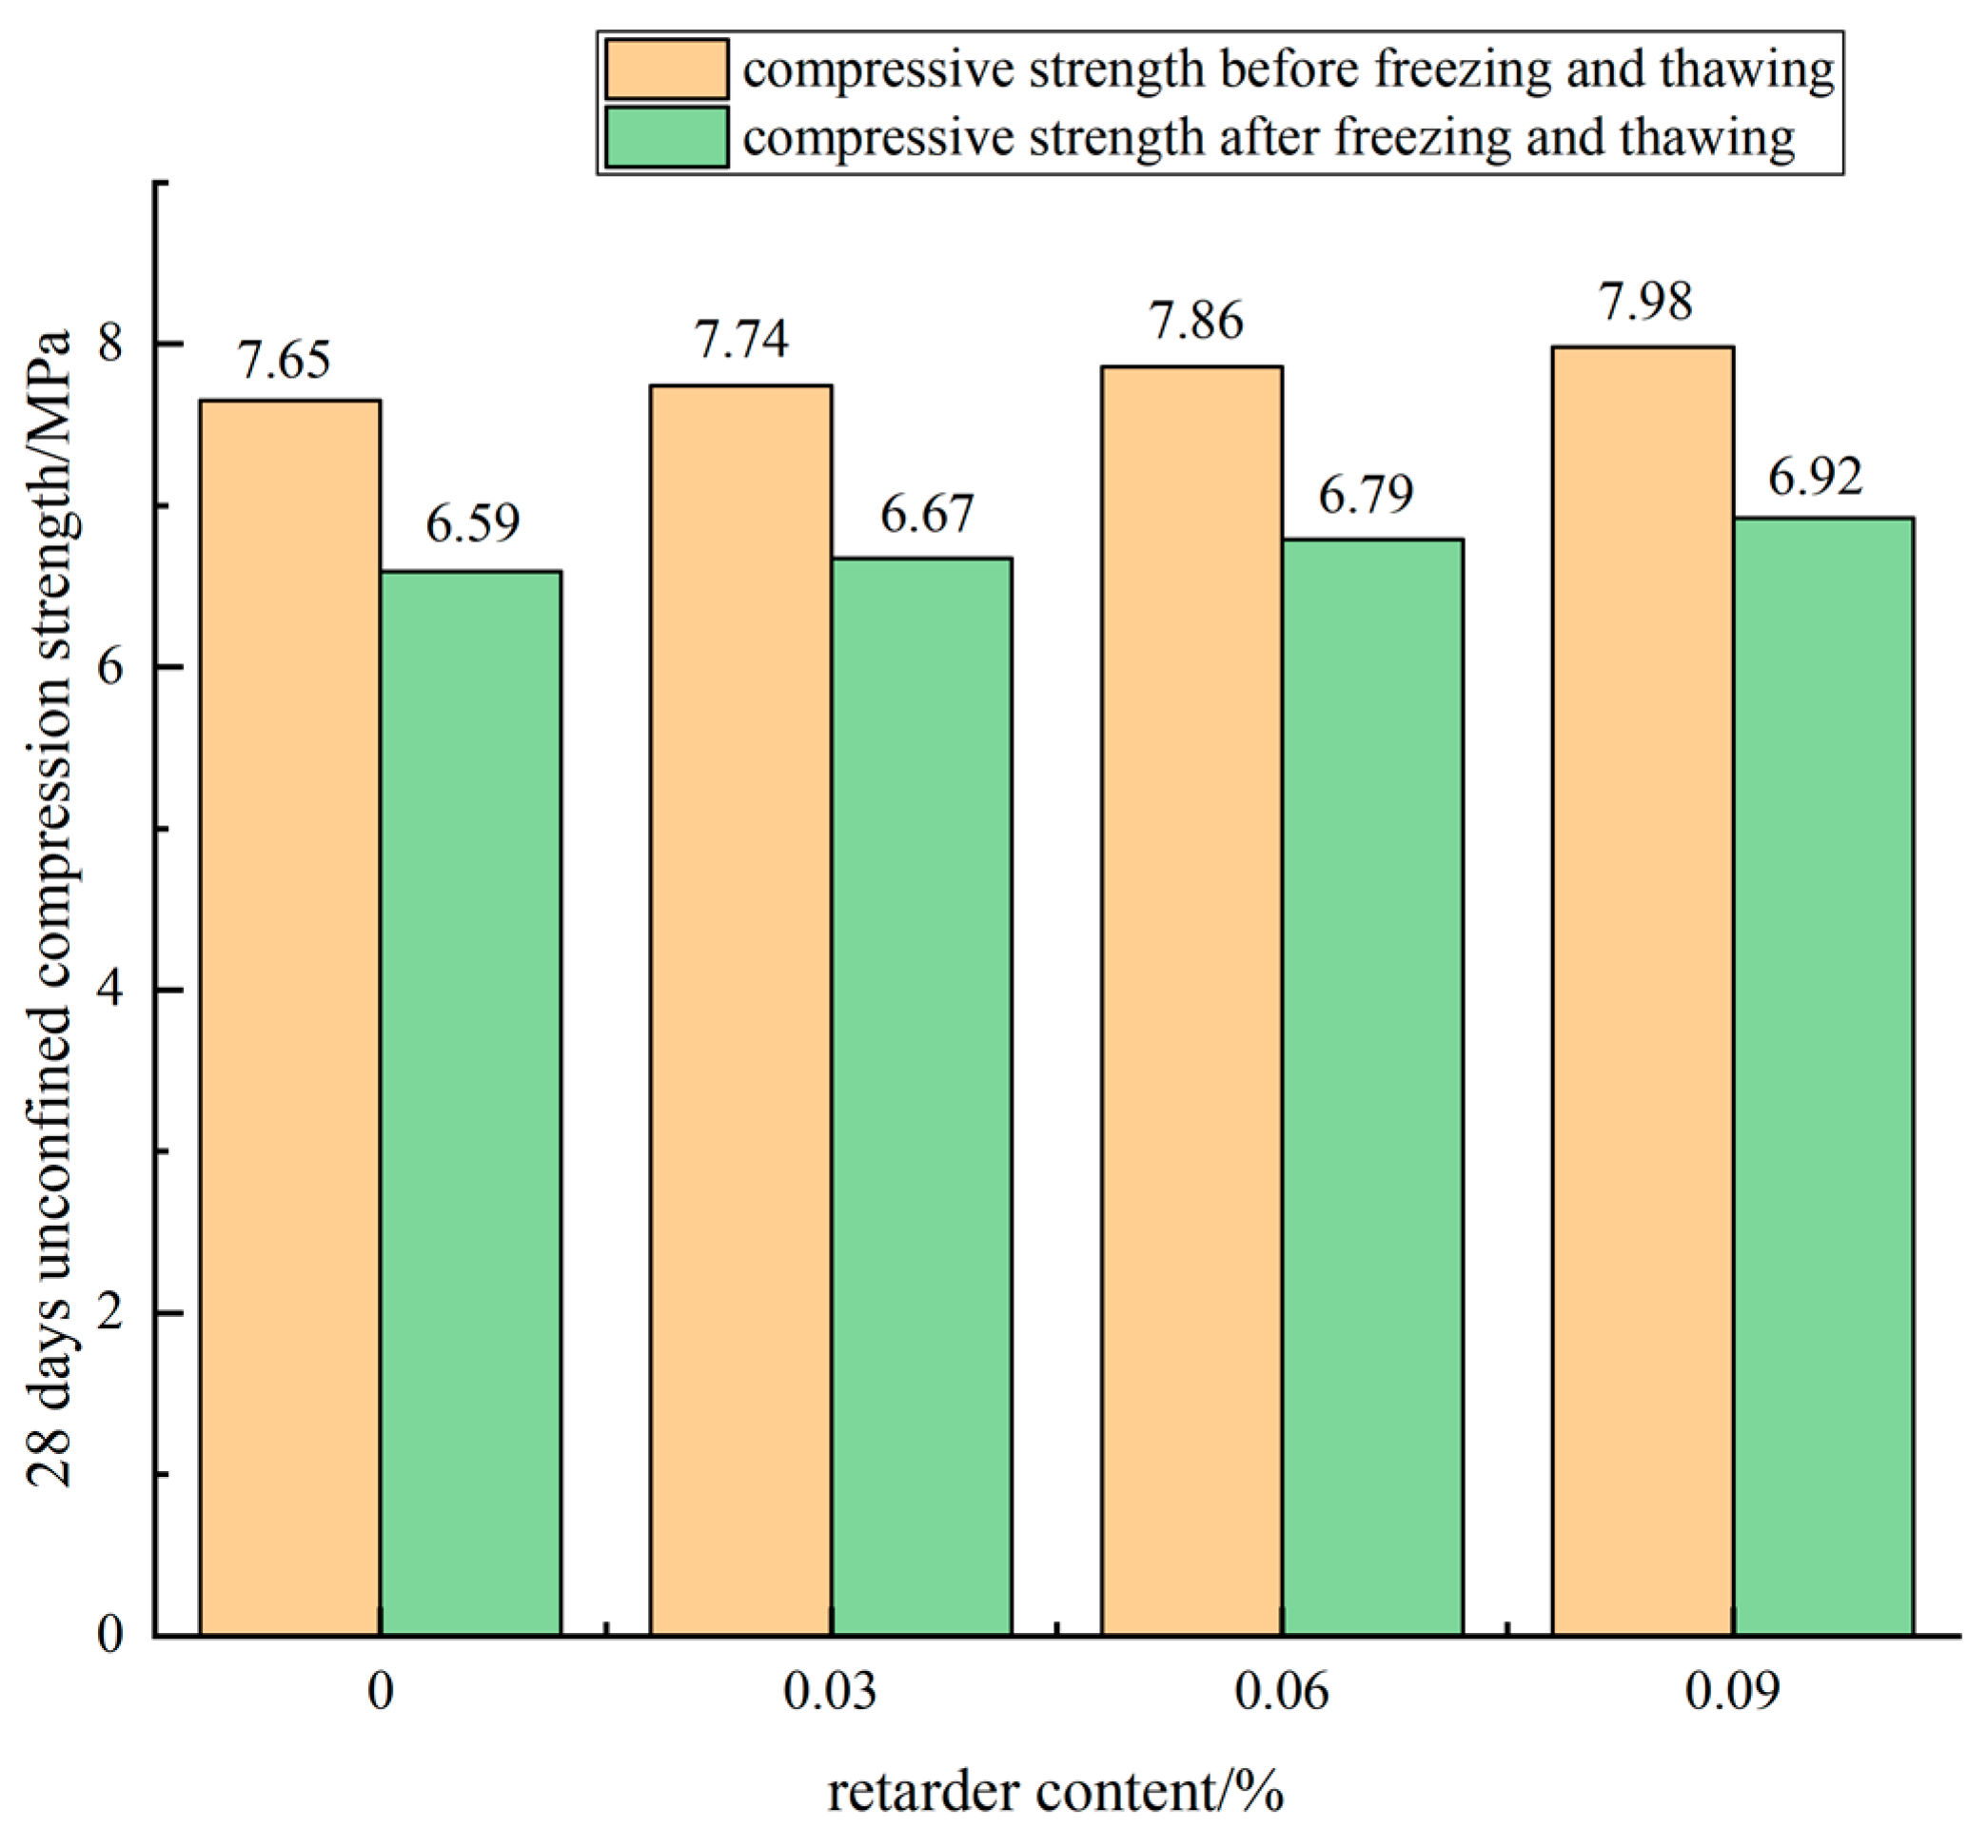
3.5.2. Effect of Retarder Dosage on Freeze-Thaw Performance
3.5.3. Effect of Compound of Rubber Powder and Retarder on Freeze-Thaw Performance
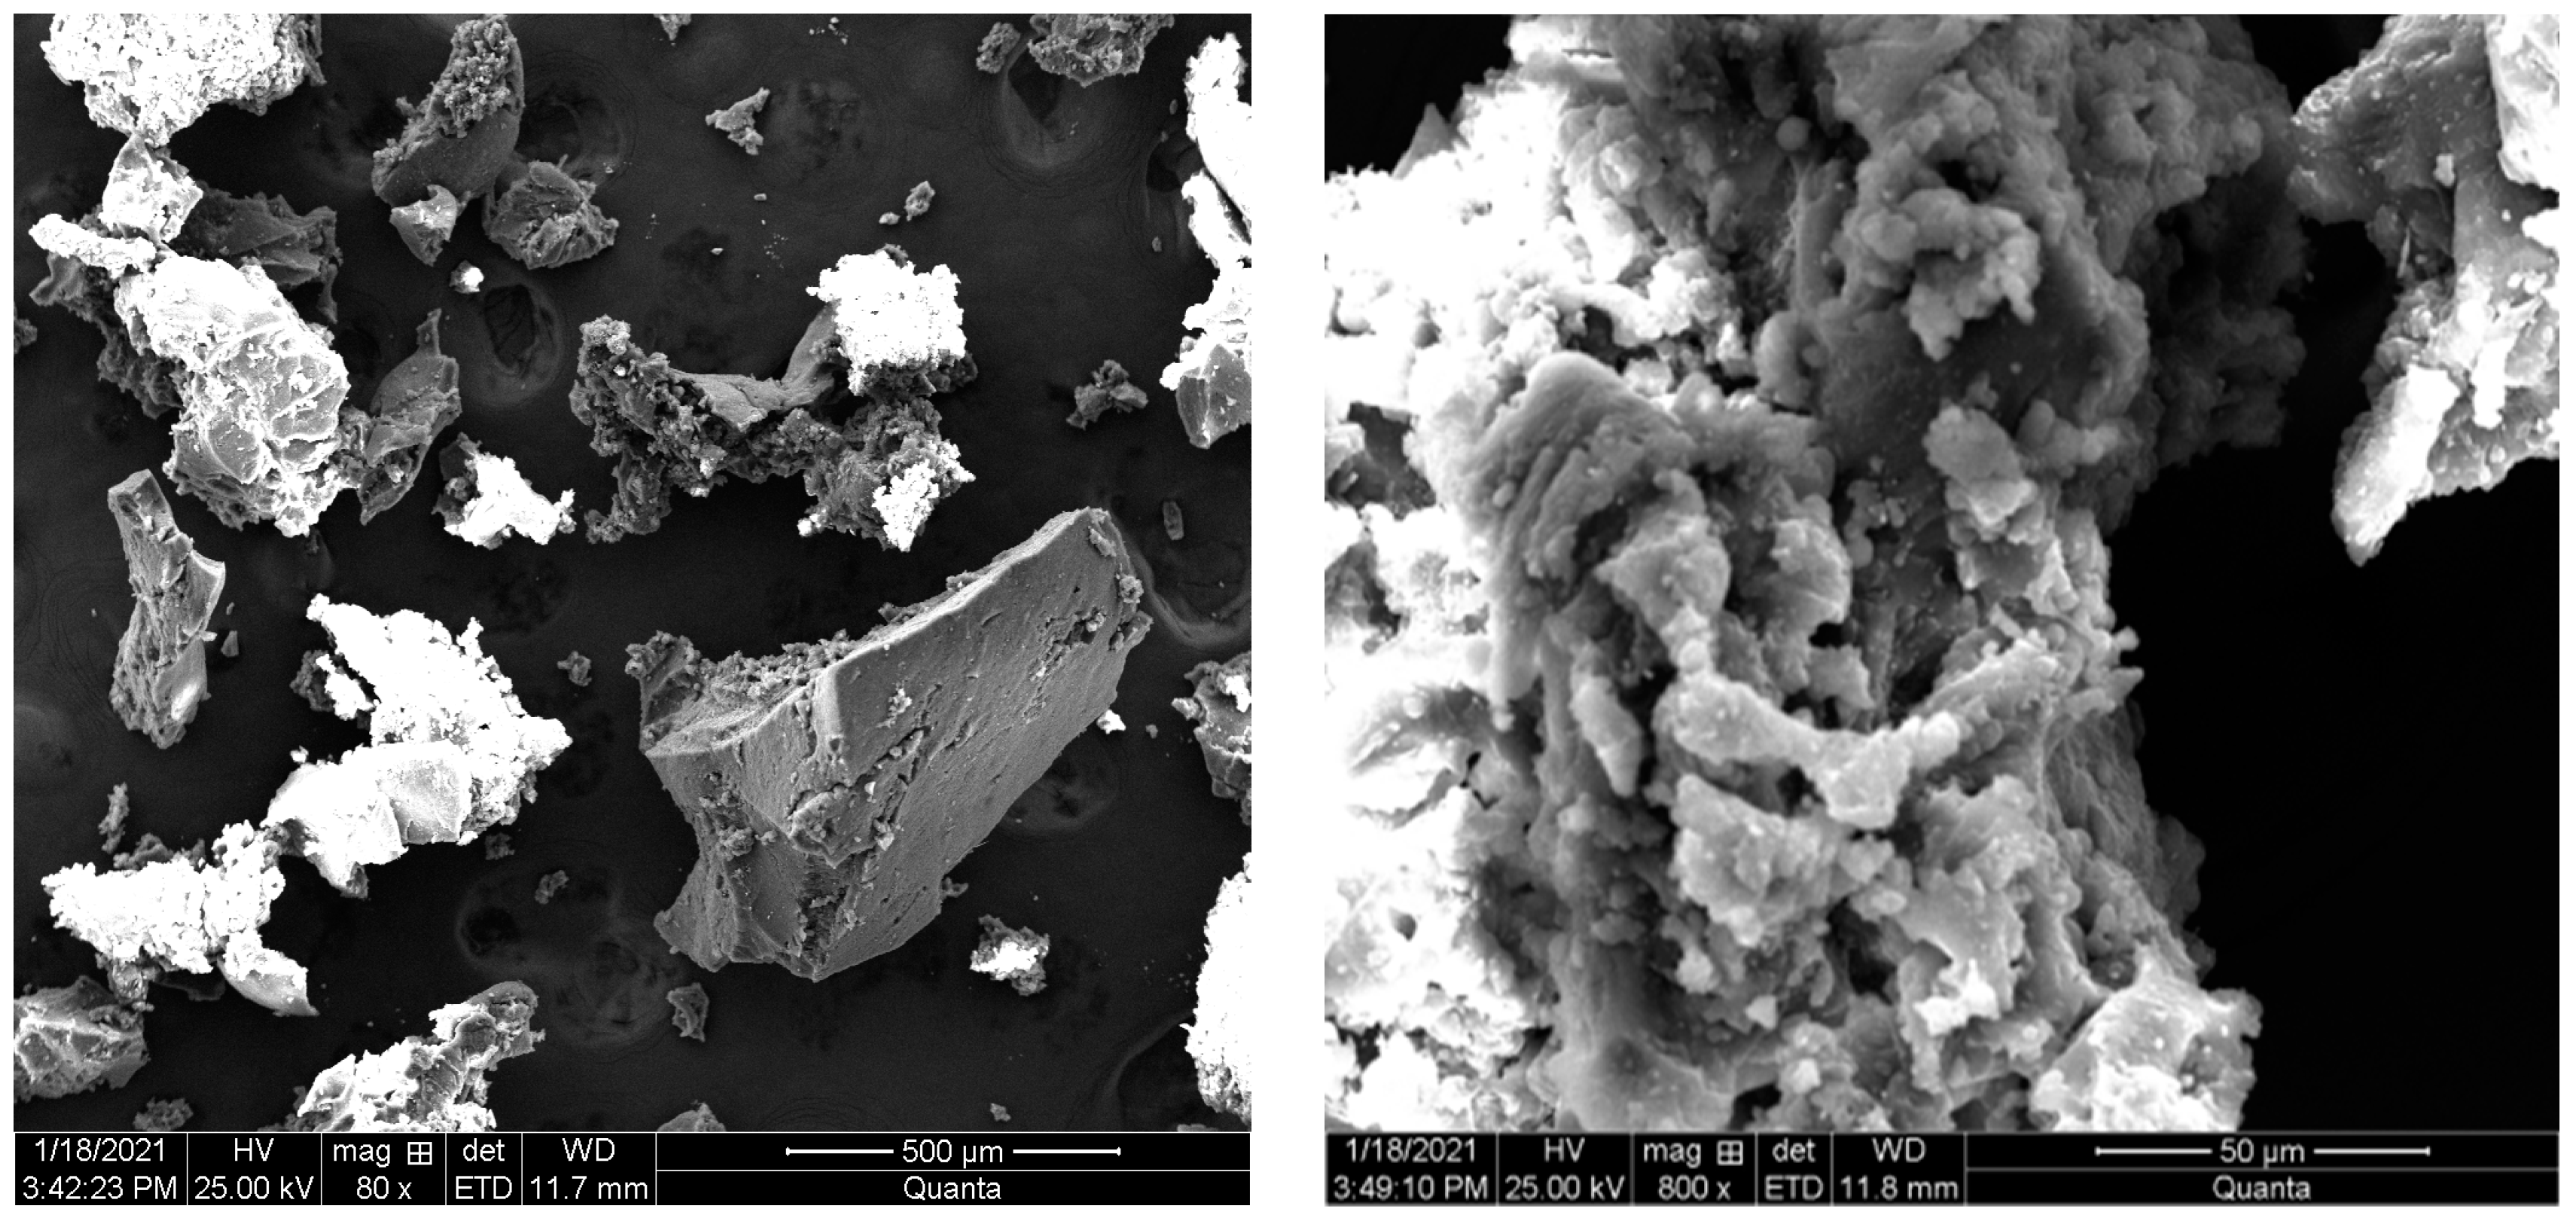
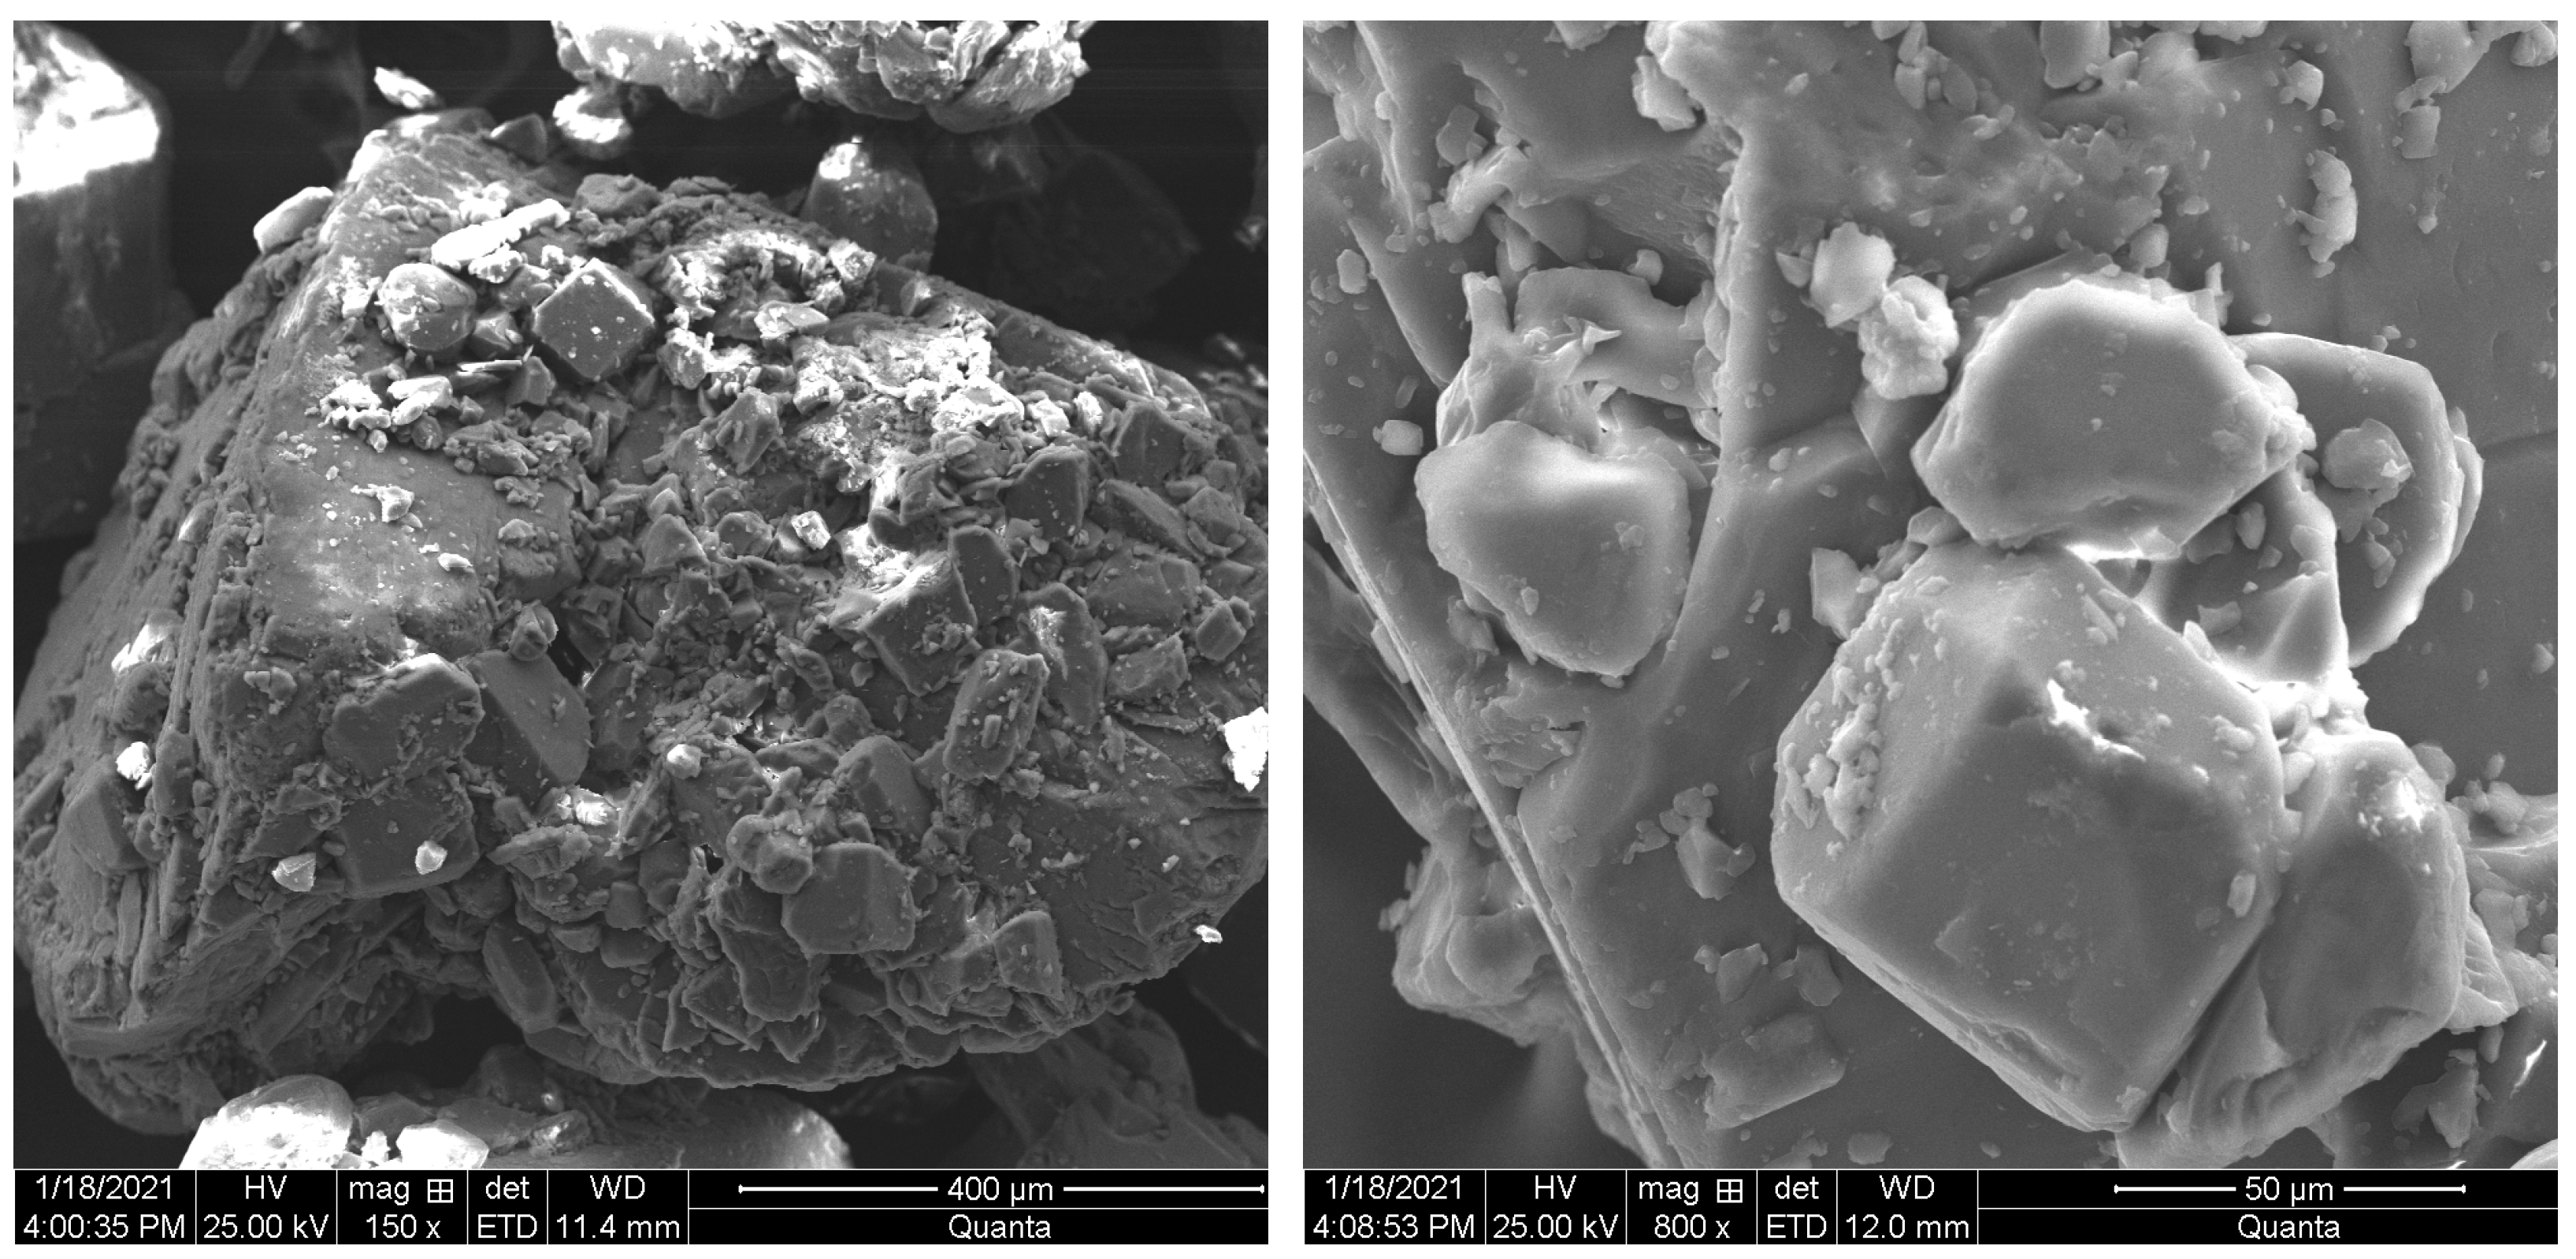
3.6. Micro-Analysis
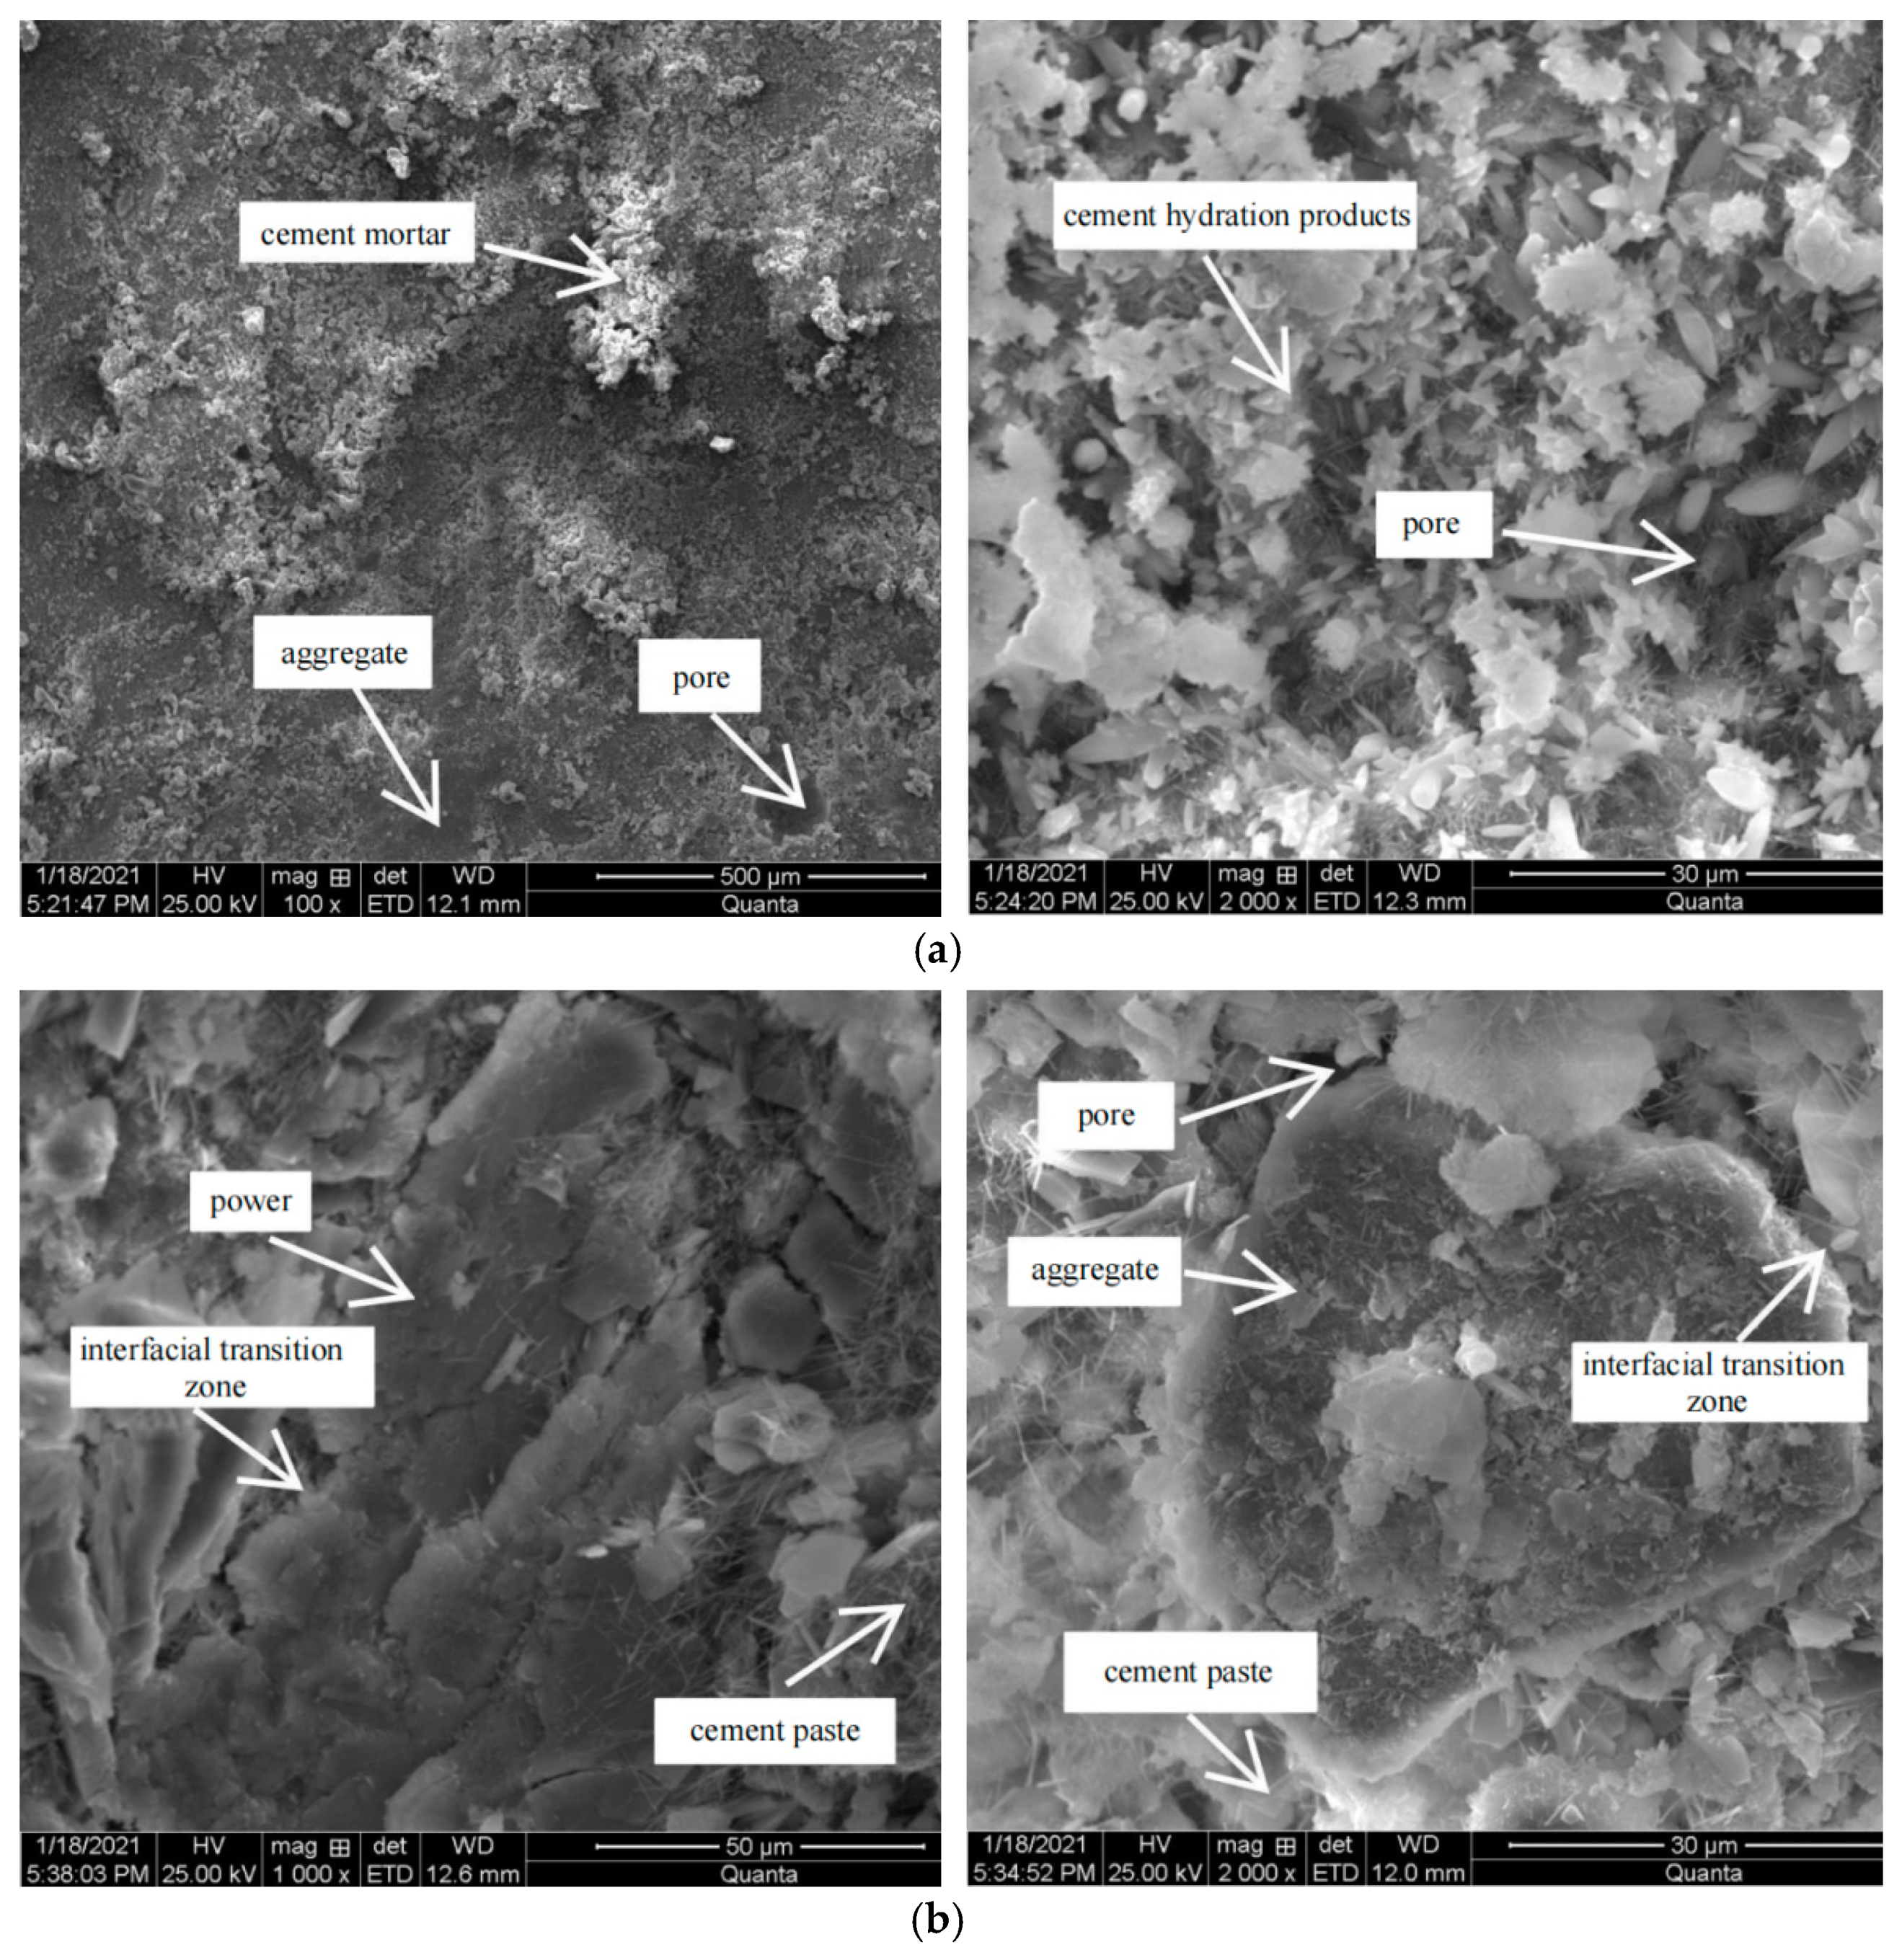
3.6.1. Effect of Rubber Powder on Microstructure of Cement-Stabilized Mixture
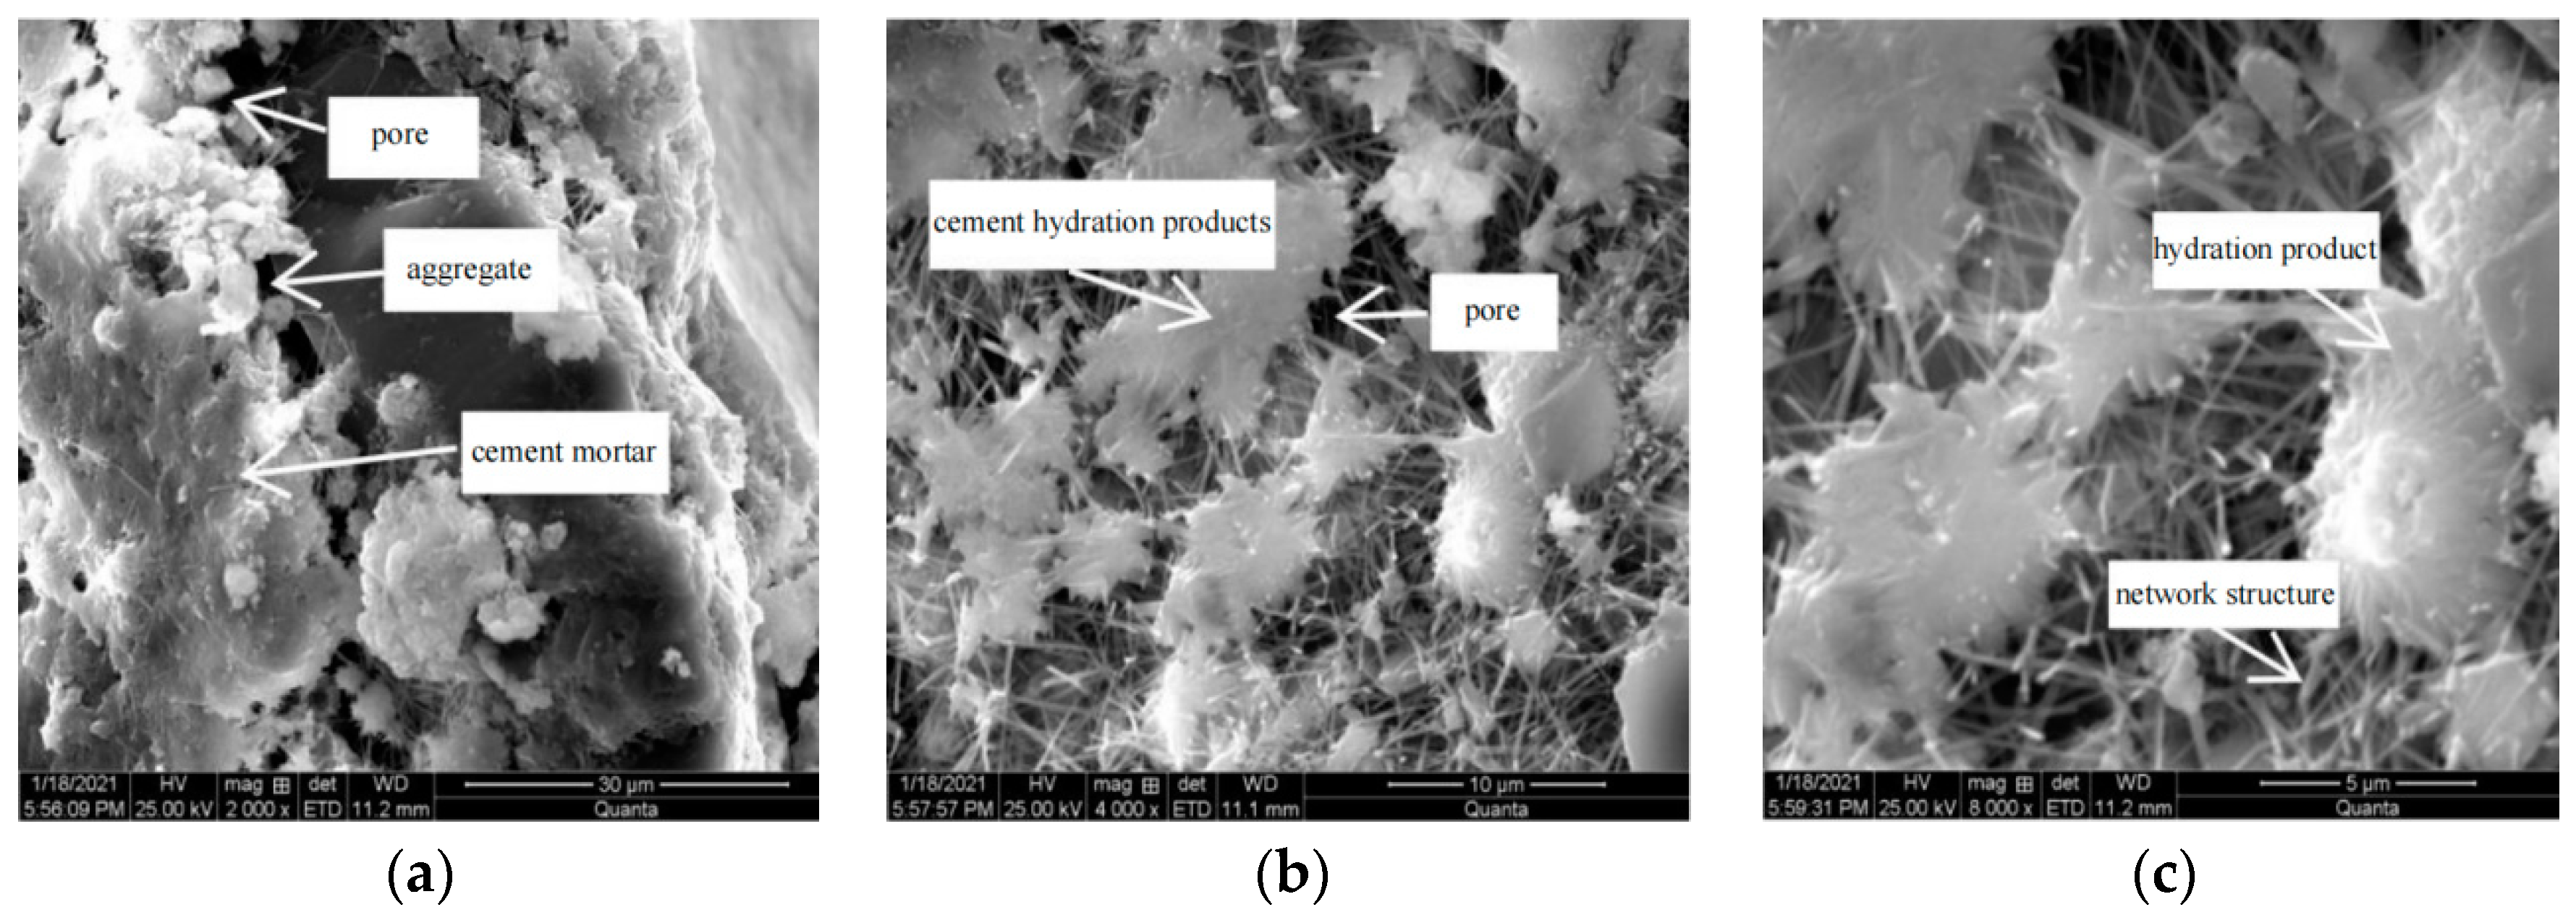
3.6.2. Effect of Retarder on Microstructure of Cement-Stabilized Mixture
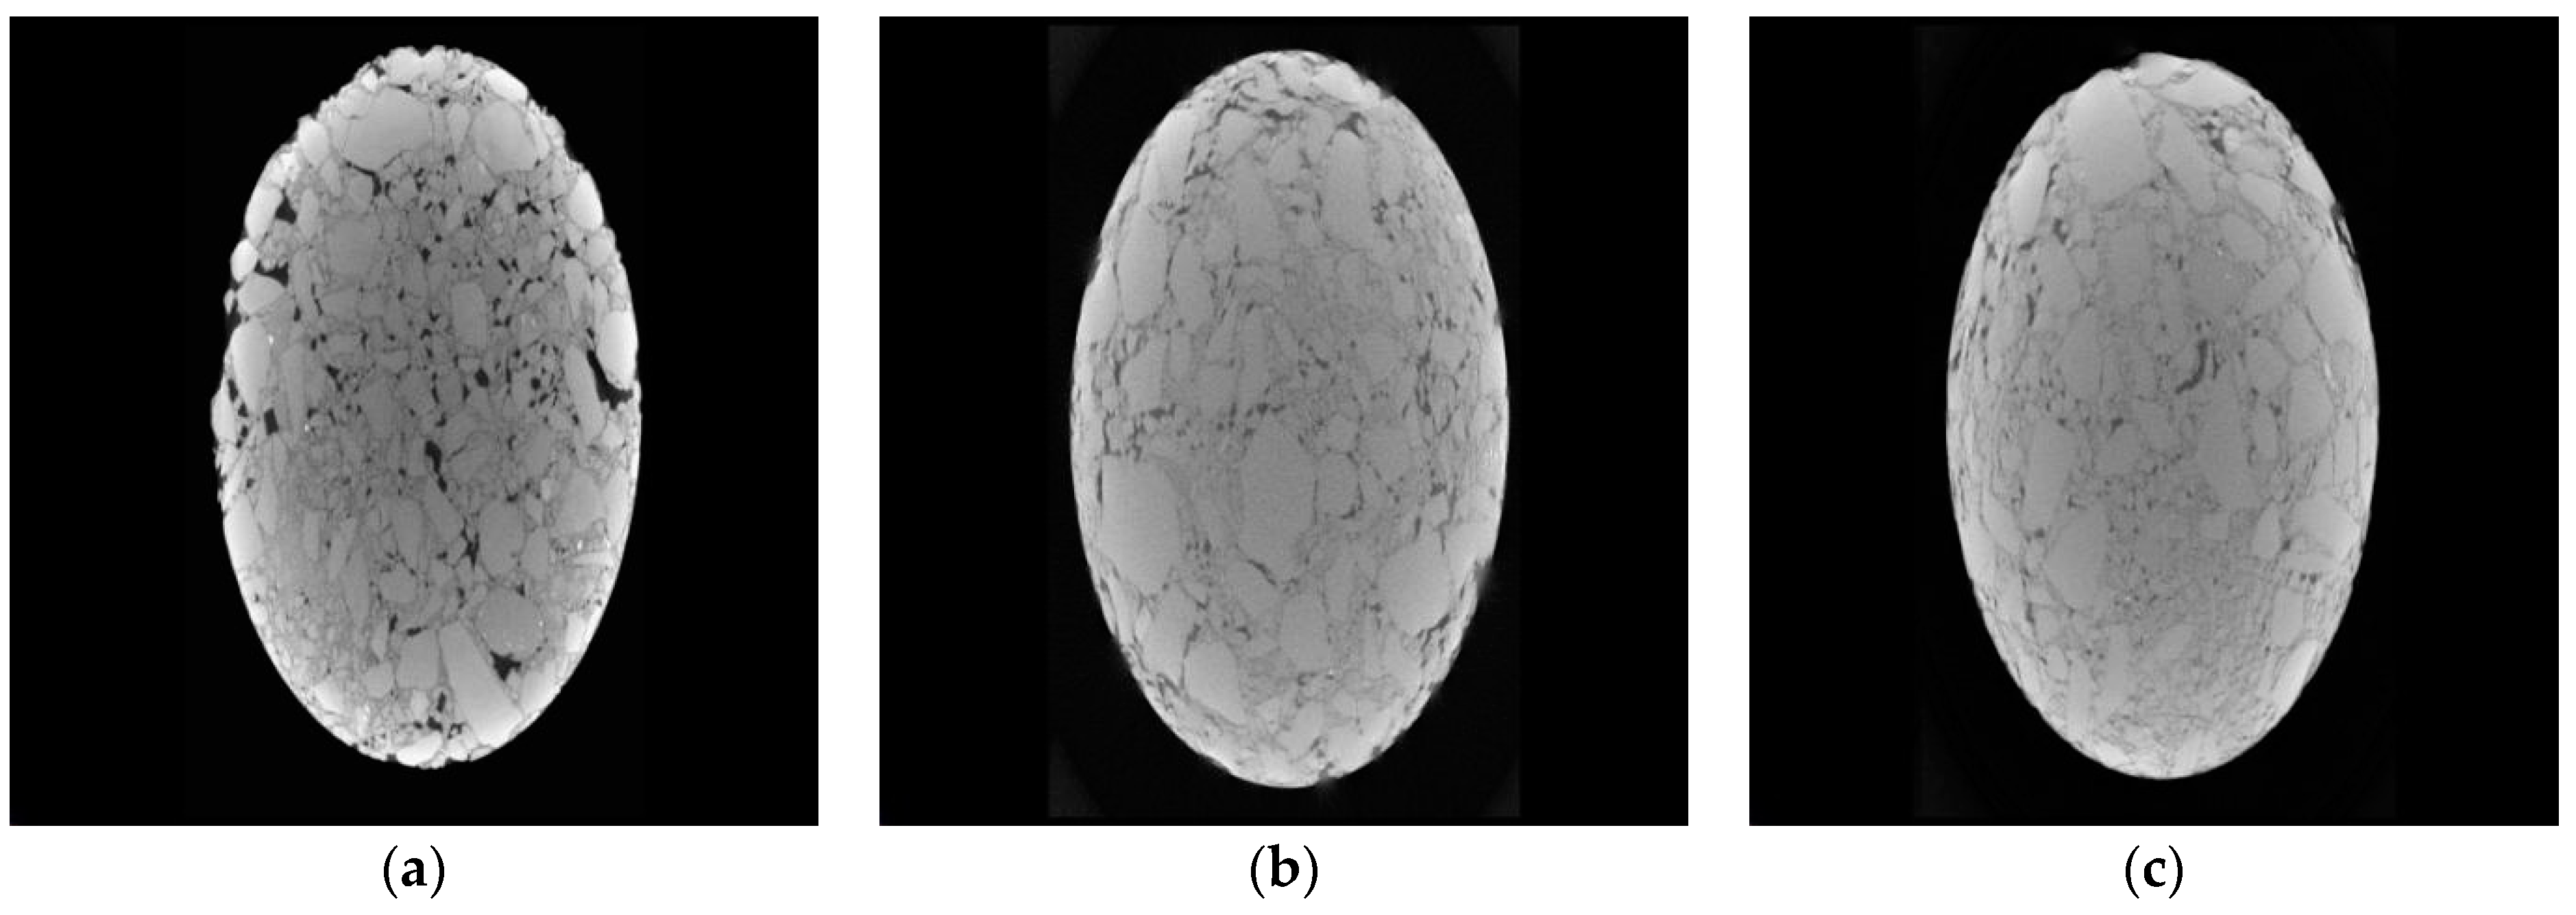
3.6.3. Industrial CT Test Analysis
4. Conclusions
- (1)
- Rubber powder had an adverse effect on the compressive strength, splitting strength, flexural tensile strength, and other mechanical properties of the mixture. With the increase of the amount of rubber powder, the mechanical properties of cement-stabilized macadam specimens decreased more obviously. When the content of rubber powder reached 1.5%, it decreased by 11.1% compared with the samples without rubber powder, and the decrease was 3.8 times as much as when the content of rubber powder was 0.5%.
- (2)
- The addition of retarder could improve the mechanical properties such as compressive strength, splitting strength, and flexural tensile strength of cement-stabilized macadam mixture. When the content of retarder was 0.09%, the compressive strength, splitting strength, and flexural tensile strength increased by 1.9%, 6.5%, and 2.0%, respectively.
- (3)
- The dry shrinkage strain, average water loss rate, and average dry shrinkage coefficient of the cement-stabilized mixture showed a decreasing trend with the increase of the rubber powder content. This is because the rubber powder was added to the mixture. As fine aggregate, it filled in the pores inside the specimen to improve the compactness of the mixture and refined the pores with large diameter into small and medium pores. The characteristics of large deformation can absorb part of the expansion stress generated during freezing and improve the dry shrinkage performance and frost resistance of the mixture.
- (4)
- Retarder can improve the frost resistance of the mixture. Since the addition of sodium gluconate can promote the formation of cement hydration products, the filling of hydration products in the pores can reduce the porosity of the specimen, thereby improving the compactness of the specimen, reducing the free water channel inside the specimen, enhancing the bonding force between the interiors of the mixture, improving the residual ratio of freeze-thaw compressive strength of the water stabilized mixture, and improving its frost resistance.
- (5)
- According to the microscopic analysis, the rubber powder is different from the natural aggregate and cannot be well combined with the cement slurry. The addition of retarder improved the integrity of the mixture, changed the morphological characteristics of the hydration products, formed a dense network structure, provided a certain strength, and then improved the mechanical properties and durability of the cement-stabilized macadam mixture.
- (6)
- In practical engineering, both of them are mixed together. Considering that too much retarder content will affect the early strength production of semi-rigid base, and too much rubber powder content will affect the mechanical properties of semi-rigid base, it is suggested that the retarder content should be controlled at 0.03–0.06%, and the rubber powder content should be 0.5–1%.
Author Contributions
Funding
Institutional Review Board Statement
Informed Consent Statement
Data Availability Statement
Conflicts of Interest
References
- Ma, X.; Liu, H.; Feng, Z.; Xiupu, Z. Study on Waste Tire Recycling System. Compr. Util. Tire Resour. China 2018, 43–47. [Google Scholar] [CrossRef]
- Dong, C. Comprehensive Utilization of Waste Tire Resources. Compr. Util. Tire Resour. China 2016, 45–48. [Google Scholar] [CrossRef]
- Yu, Q. Present Situation and Future Development of Tire Industry Production. Rubber Plast. Technol. Equip. 2016, 42, 7–15. [Google Scholar] [CrossRef]
- Lu, N.; Xin, Z. Application of Waste Tire Rubber Powder. World Rubber Ind. 2015, 42, 9–13. [Google Scholar]
- Zhang, L.; Kong, X.; Feng, Z. Development and industrial test of vibration mixing device for cement stabilized macadam. J. Guangxi Univ. Nat. Sci. Ed. 2015, 40, 1155–1161. [Google Scholar] [CrossRef]
- Wang, L.; Xie, X. Relationship between vibration of cement stabilized macadam and physical and mechanical indexes of static pressure molding. J. Harbin Inst. Technol. 2012, 44, 70–74. [Google Scholar]
- Li, H.; Mao, M.; Zheng, J.; Shen, J. Experimental Study and Application of Fly Ash Cement Stabilized Macadam Base. Sci. Technol. Eng. 2014, 14, 269–272. [Google Scholar]
- Li, Z.; Chen, Y. Test and Analysis on Properties of Different Types of Semi-rigid Base Materials. J. Chang. Univ. Nat. Sci. Ed. 2012, 32, 41–46. [Google Scholar] [CrossRef]
- Li, L.; Ruan, S.; Zeng, L. Mechanical properties and constitutive equations of concrete containing a low volume of tire rubber particles. Constr. Build. Mater. 2014, 70, 291–308. [Google Scholar] [CrossRef]
- Zhang, Y.C.; Liu, S.W.; Gao, L.L. Effect of Rubber Powder Dosage on Performance of Cement Concrete. Adv. Mater. Res. 2014, 3149, 1908–1911. [Google Scholar] [CrossRef]
- Thomas, B.S.; Gupta, R.C. Long term behaviour of cement concrete containing discarded tire rubber. J. Clean. Prod. 2015, 102, 78–87. [Google Scholar] [CrossRef]
- Meddah, A.; Beddar, M.; Bali, A. Use of shredded rubber tire aggregates for roller compacted concrete pavement. J. Clean. Prod. 2014, 72, 187–192. [Google Scholar] [CrossRef]
- Yu, Y.; Zhu, H. Influences of rubber on drying shrinkage performance of cement based material. J. Compos. Mater. 2017, 34, 2624–2630. [Google Scholar] [CrossRef]
- Zhang, H.; Guan, X.; Gou, M.; Peak, H.; Xiaoxing, L. Study on the influence of waste rubber particle size on the strength of cement mortar and concrete. Silic. Notif. 2012, 31, 931–934+938. [Google Scholar] [CrossRef]
- Yang, C.; Yang, M.; Wu, W. Experimental study on working performance of waste rubber concrete. Concrete 2013, 83–86+92. [Google Scholar]
- Yu, Y.; Zhu, H.; Zhu, X.; Haoran, L. Influence of Particle Size and Content of Rubber on Shrinkage and Crack Resistance of Cement-based Materials. Mater. Sci. Eng. J. 2016, 34, 522–525+521. [Google Scholar] [CrossRef]
- Lv, S.; Wang, S.; Wang, P.; Liu, C.; Zhao, D. Strength and Toughness of Rubber-cement Stabilized Macadam. Chin. J. Highw. 2020, 33, 139–147. [Google Scholar] [CrossRef]
- Smirnova, O.M.; Menéndez Pidal de Navascués, I.; Mikhailevskii, V.R.; Kolosov, O.I.; Skolota, N.S. Sound-Absorbing Composites with Rubber Crumb from Used Tires. Appl. Sci. 2021, 11, 7347. [Google Scholar] [CrossRef]
- Smirnova, O.; Kazanskaya, L.; Koplík, J.; Tan, H.; Gu, X. Concrete based on clinker-free cement: Selecting the functional unit for environmental assessment. Sustainability 2021, 13, 135. [Google Scholar] [CrossRef]
- He, Y.; Wang, Y.; Cai, X. Study on Mechanical Properties of Cement Stabilized Macadam with Waste Rubber Particles. North Transp. 2014, 76–78. [Google Scholar] [CrossRef]
- Gisbert, A.N.; Borrell, J.G.; García, F.P.; Sanchis, E.J.; Amorós, J.C.; Alcaraz, J.S.; Vicente, F.S. Analysis behaviour of static and dynamic properties of Ethylene-Propylene-Diene-Methylene crumb rubber mortar. Constr. Build. Mater. 2014, 50, 671–682. [Google Scholar] [CrossRef]
- Liu, F.; Zheng, W.; Li, L.; Feng, W.; Ning, G. Mechanical and fatigue performance of rubber concrete. Constr. Build. Mater. 2013, 47, 711–719. [Google Scholar] [CrossRef]
- Hossain, K.M.A.; Lachemi, M.; Sammour, M.; Sonebi, M. Strength and fracture energy characteristics of self-consolidating concrete incorporating polyvinyl alcohol, steel and hybrid fibres. Constr. Build. Mater. 2013, 45, 20–29. [Google Scholar] [CrossRef]
- Li, L. Cement stabilized macadam base construction technology and quality control. Traffic World 2019, 59–60. [Google Scholar] [CrossRef]
- Xie, R. Research on mix proportion design and construction technology of skeleton dense water-stable mixture. Eng. Constr. 2016, 30, 266–269. [Google Scholar]
- Hu, T.; Zhang, Z. Highway water stabilized macadam base mix design and construction quality control. New Technol. New Prod. China 2011, 89–90. [Google Scholar] [CrossRef]
- Wang, H.; Wang, P. Experiment on Road Performance of Powder Cement Stabilized Aggregate BaseCourse. Highw. Traffic Technol. 2013, 30, 12–16+22. [Google Scholar]
- Yang, H.; Zhu, Y. Study on the effect of retarder on concrete performance. New Build. Mater. 2019, 46, 102–104+169. [Google Scholar]
- Shi, X. The Influence of Retarder to Cement Setting Time at Different Temperatures. Low Temp. Constr. Technol. 2019, 41, 9–10. [Google Scholar] [CrossRef]
- Cheng, L.; Gong, J.; Zeng, Y. Effects of different retarders on setting time of cement. Concr. World 2017, 86–93. [Google Scholar]


| Performance Index | Bulk Density (g/cm3) | Apparent Density (g/cm3) | Water Absorption (%) | Crush Value (%) | Needle and Flake Content (%) | Mud Content (%) | |
|---|---|---|---|---|---|---|---|
| coarse aggregate | 10–20 (mm) | 1.475 | 2.746 | 1.91 | 15.6 | 9.2 | 0.1 |
| 5–10 (mm) | 1.524 | 2.783 | 1.89 | — | 8.4 | 0.0 | |
| fine aggregate | 3–5 (mm) | 1.538 | 2.883 | 2.15 | — | — | — |
| 0–3 (mm) | 1.584 | 2.894 | 2.67 | — | — | — | |
| Test Items | Test Result | Specification Requirement | ||
| fineness (F) | 3.6% | ≤10% (F: 0.08 mm square sieve percentage) | ||
| standard consistency water consumption (P) | 25.7% | P: standard consistency water consumption | ||
| initial setting time | 257 min | ≥180 min | ||
| final setting time | 374 min | ≥360 min | ||
| Test Items | Test Result | Specification Requirement | ||
| stability | 1.0 mm | ≤5 mm | ||
| strength of cement mortar (MPa) | flexural strength | 3 d | 5.9 | ≥3.5 MPa |
| 28 d | 8.7 | ≥6.5 MPa | ||
| compressive strength | 3 d | 25.8 | ≥17.0 MPa | |
| 28 d | 48.7 | ≥42.5 MPa | ||
| Mixing Method No. of Rubber Powder and Retarder | Rubber Percentage (R) | Sodium Gluconate Percentage(C) |
|---|---|---|
| R0-C0 | 0% | 0% |
| R0-C0.03 | 0% | 0.03% |
| R0-C0.06 | 0% | 0.06% |
| R0-C0.09 | 0% | 0.09% |
| R0.5-C0 | 0.5% | 0% |
| R0.5-C0.03 | 0.5% | 0.03% |
| R0.5-C0.06 | 0.5% | 0.06% |
| R0.5-C0.09 | 0.5% | 0.09% |
| R1-C0 | 1% | 0% |
| R1-C0.03 | 1% | 0.03% |
| R1-C0.06 | 1% | 0.06% |
| R1-C0.09 | 1% | 0.09% |
| R1.5-C0 | 1.5% | 0% |
| R1.5-C0.03 | 1.5% | 0.03% |
| R1.5-C0.06 | 1.5% | 0.06% |
| R1.5-C0.09 | 1.5% | 0.09% |
Publisher’s Note: MDPI stays neutral with regard to jurisdictional claims in published maps and institutional affiliations. |
© 2022 by the authors. Licensee MDPI, Basel, Switzerland. This article is an open access article distributed under the terms and conditions of the Creative Commons Attribution (CC BY) license (https://creativecommons.org/licenses/by/4.0/).
Share and Cite
Li, Z.; Guo, T.; Chen, Y.; Wang, Y.; Chen, Y.; He, Q.; Yang, X.; Wang, J. Study on Performance of Retarded Composite Semi-Rigid Base Mixed with Rubber Powder. Materials 2022, 15, 4683. https://doi.org/10.3390/ma15134683
Li Z, Guo T, Chen Y, Wang Y, Chen Y, He Q, Yang X, Wang J. Study on Performance of Retarded Composite Semi-Rigid Base Mixed with Rubber Powder. Materials. 2022; 15(13):4683. https://doi.org/10.3390/ma15134683
Chicago/Turabian StyleLi, Zhenxia, Tengteng Guo, Yuanzhao Chen, Yunpeng Wang, Yanyan Chen, Qingyun He, Xiao Yang, and Jing Wang. 2022. "Study on Performance of Retarded Composite Semi-Rigid Base Mixed with Rubber Powder" Materials 15, no. 13: 4683. https://doi.org/10.3390/ma15134683
APA StyleLi, Z., Guo, T., Chen, Y., Wang, Y., Chen, Y., He, Q., Yang, X., & Wang, J. (2022). Study on Performance of Retarded Composite Semi-Rigid Base Mixed with Rubber Powder. Materials, 15(13), 4683. https://doi.org/10.3390/ma15134683