
Combining X-ray Fluorescence and Monte Carlo Simulation Methods to Differentiate between Tumbaga and Gold-Alloy or Gildings

 , , , and
Abstract
:1. Introduction
2. Materials and Methods
3. Results
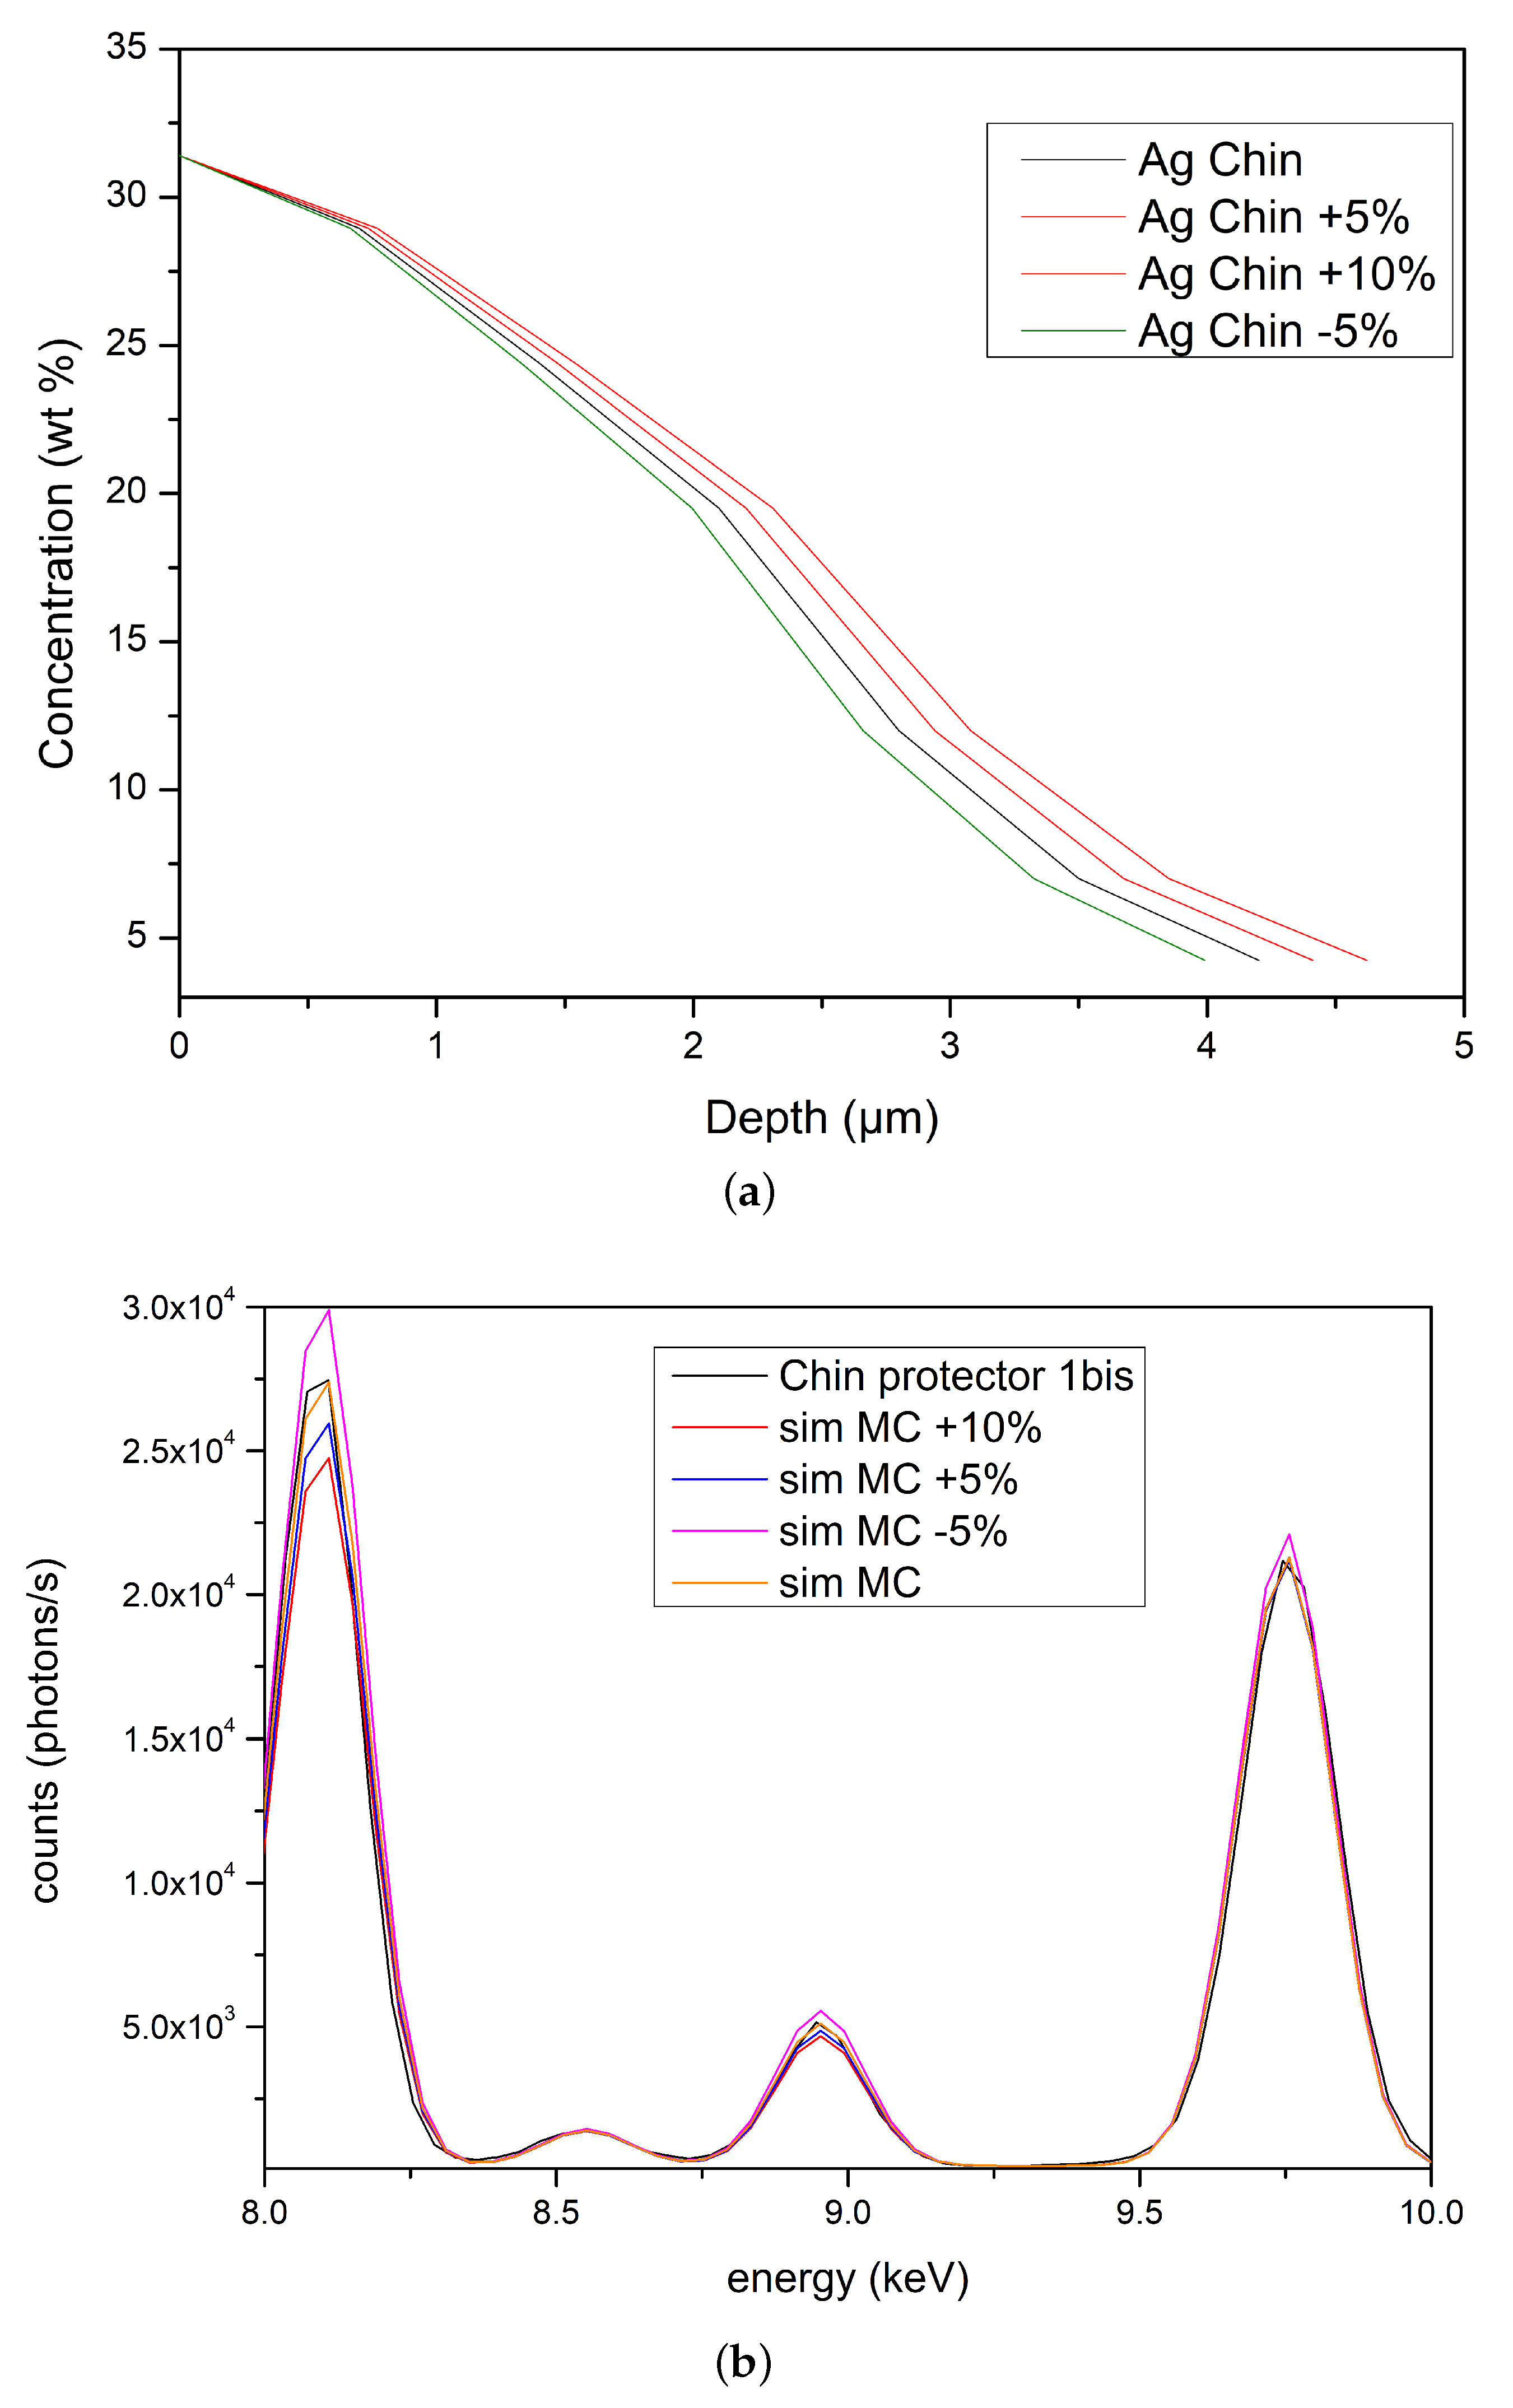
- is there more than one optimal solution for the gradient profile?
- what is the minimum detectable change in the slope of gradient?
4. Conclusions
Author Contributions
Funding
Institutional Review Board Statement
Informed Consent Statement
Data Availability Statement
Conflicts of Interest
References
- The Jan Mitchell Collection, The Art Precolombian Gold; The Metropolitan Museum of Art: New York, NY, USA, 1985.
- Scott, D.A. Gold and Platinum Metallurgy of Ancient Colombia and Ecuador; Conservation Science Press: Trukee, CA, USA, 2012. [Google Scholar]
- Guisbiers, G.; Mejia-Rosales, S.; Khanal, S.; Ruiz-Zepeda, F.; Whetten, R.L.; Yacaman, M.J. Gold-Copper Nano-Alloy, Tumbaga, in The Era of Nano: Phase Diagram and Segregation. Nano Lett. 2014, 14, 6718–6726. [Google Scholar] [CrossRef] [PubMed] [Green Version]
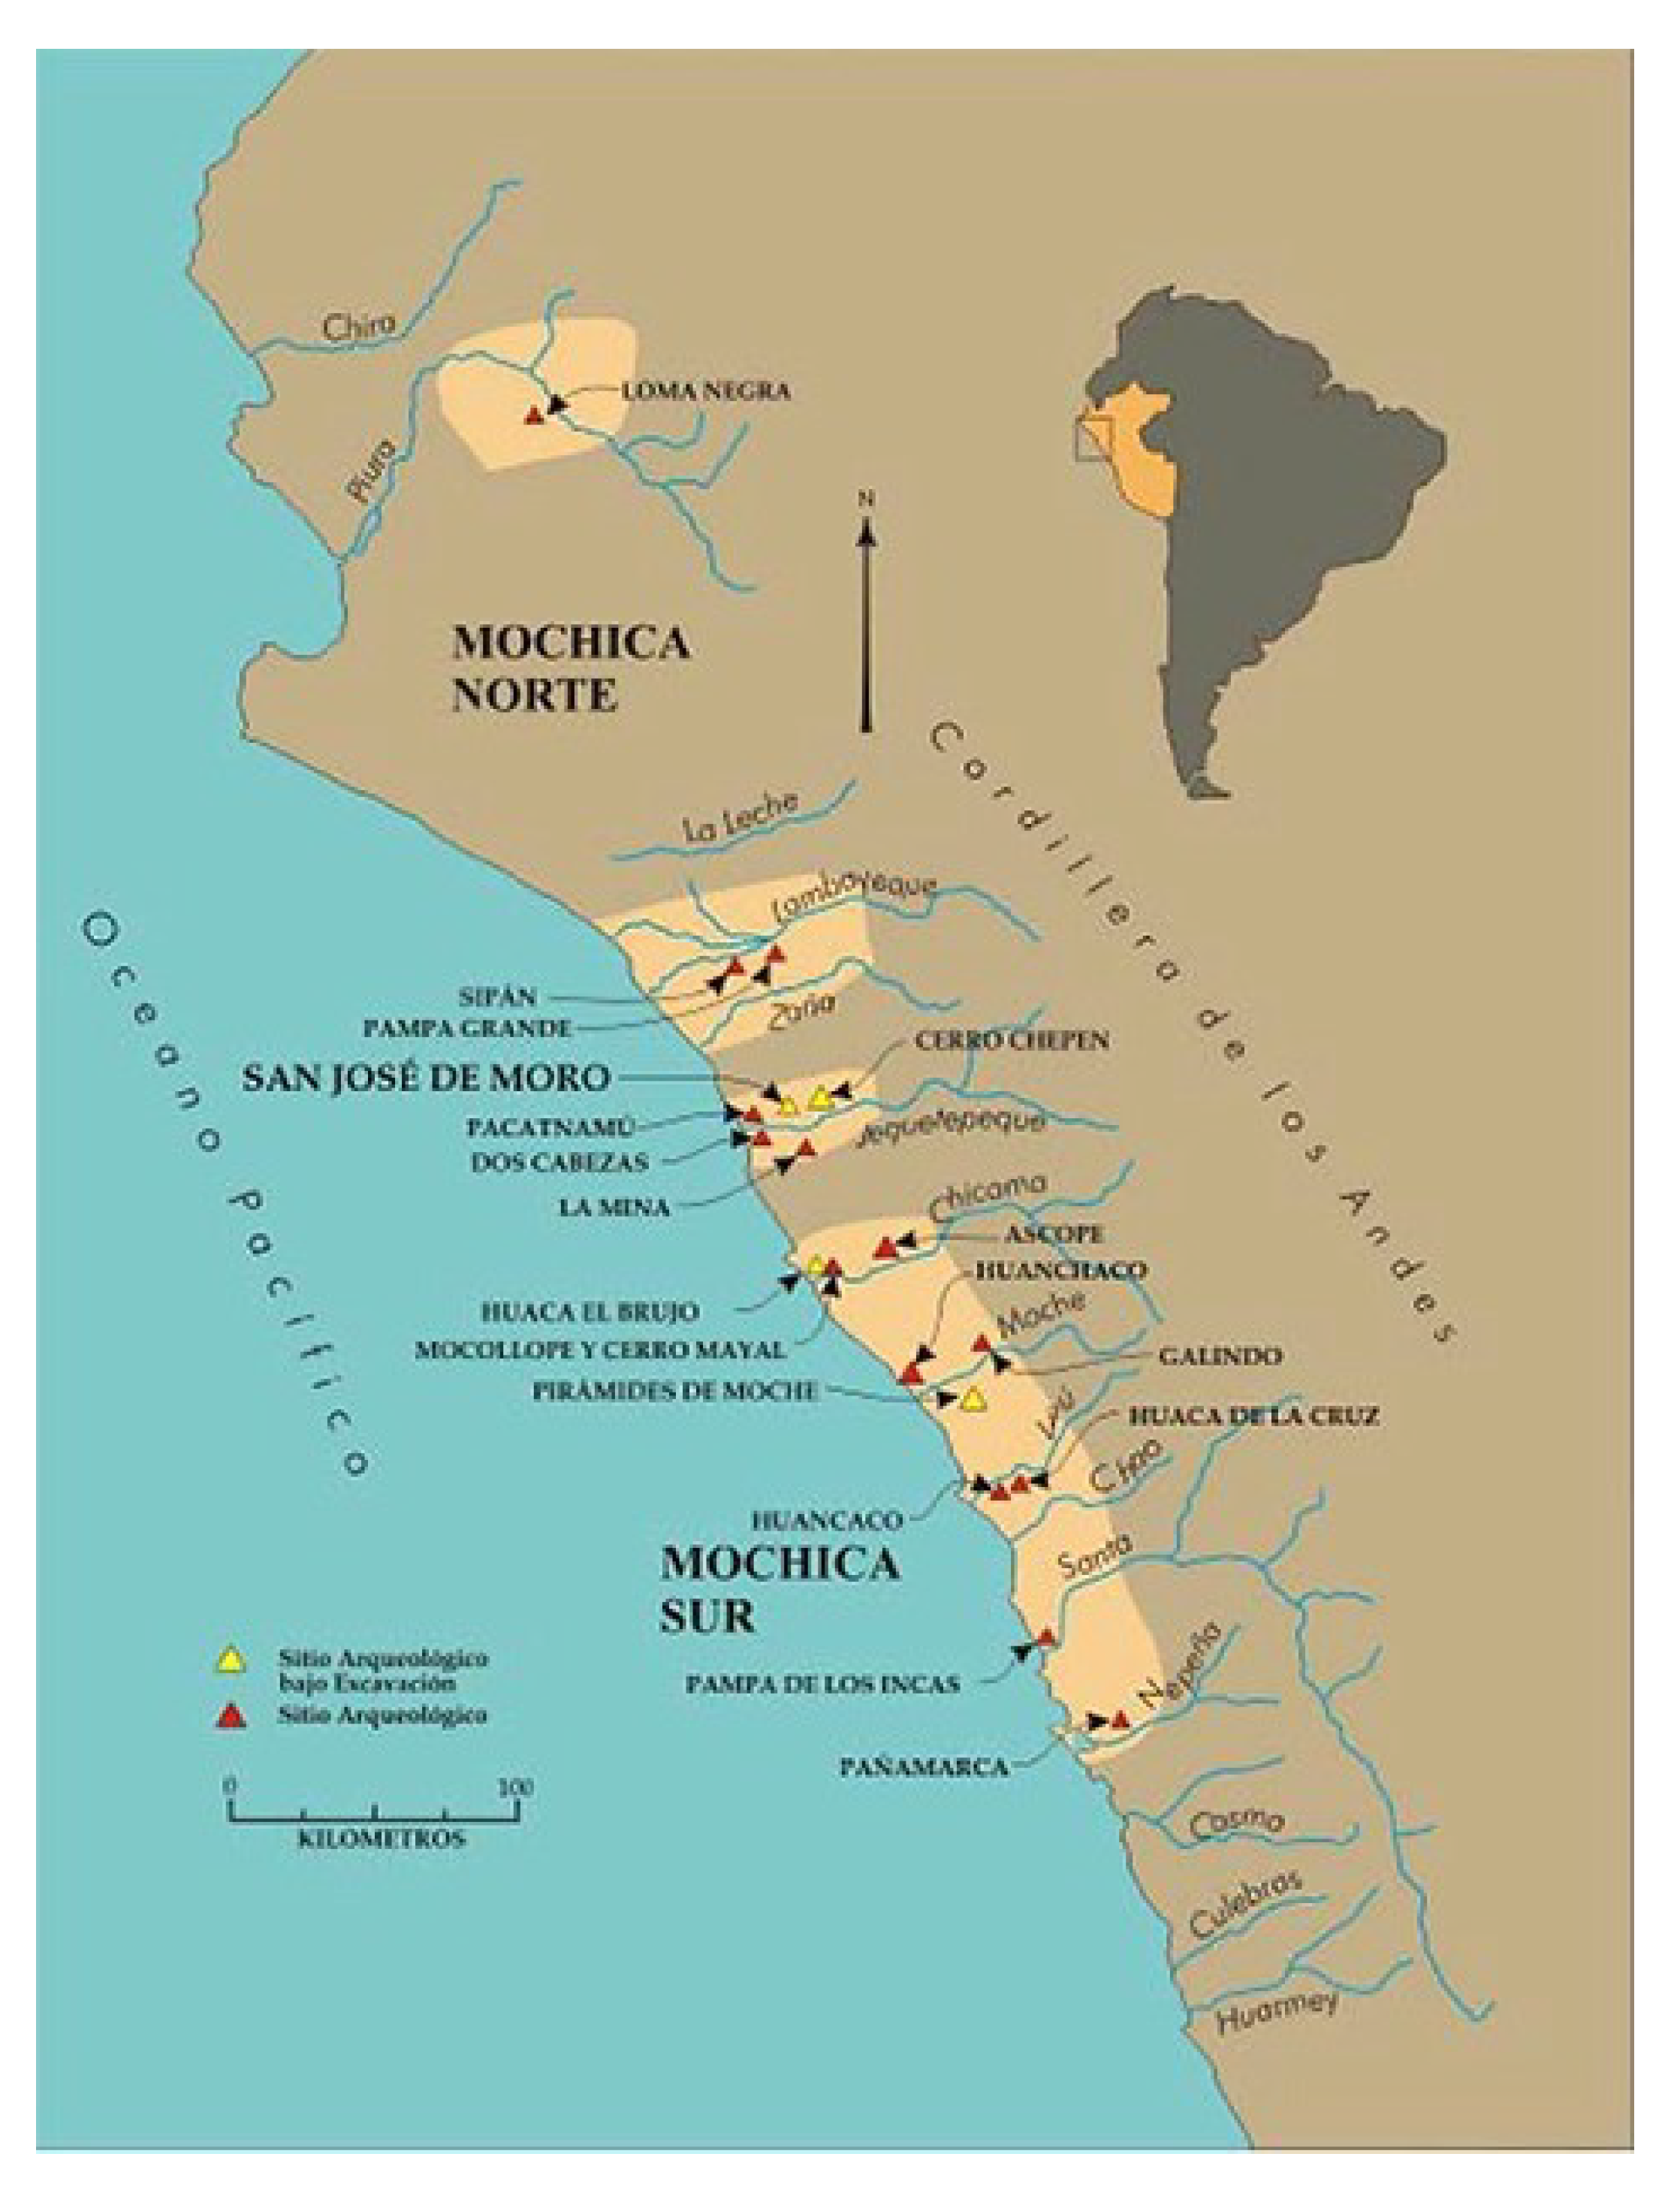
- Alva, W. Descubrimiento e Investigación; Tumba Real of Lord of Sipan Museum: Lambayeque, Peru, 2015. [Google Scholar]
- The Worlds of the Moche on the North Coast of Peru; University of Texas Press: Austin, TX, USA, 2012.
- Cesareo, R.; Franco Jordan, R.; Fernez, A.; Bustamante, A.; Fabian, J.; del Pilar Zambrano, S.; Azeredo, S.; Lopes, R.T.; Ingo, G.M.; Riccucci, C.; et al. Analysis of the spectacular gold and silver from the Moche tomb “Señora de Cao”. X-ray Spectrom. 2016, 45, 138–154. [Google Scholar] [CrossRef]
- Demortier, G.; Ruvalcaba-Sil, J.L. Differential PIXE analysis of Mesoamerican jewelry items. Nucl. Instrum.Methods Phys. Res. 1996, B 118, 352–358. [Google Scholar] [CrossRef]
- Galli, L.; Bonizzoni, A.; Sibilia, E.; Martini, M. EDXRF analysis of metal artefacts from the grave goods of the Royal Tomb 14 of Sipan, Peru. X-ray Spectrom. 2011, 40, 74–78. [Google Scholar] [CrossRef]
- Martinón-Torres, M.; Arenas, J.L.G.; Veronesi, U.; White, H. Goldsmithing traditions and innovations in colonial Colombia: An analytical study of crucibles from Santa Cruz de Mompox. Post-Medieval Archaeol. 2019, 52, 147–169. [Google Scholar] [CrossRef]
- Hörz, G.; Kallfass, M. The treasure of gold and silver artifacts from the Royal Tombs of Sipàn, Peru—A study on the Moche metalworking techniques. Mater. Charact. 2000, 45, 391–420. [Google Scholar] [CrossRef]
- Demortier, G. Ion beam studies of archaeological gold jewellery items. Nucl. Instrum. Methods Phys. Res. 1996, B I13, 347–353. [Google Scholar] [CrossRef]
- Ingo, G.M.; Albini, M.; Bustamante, A.D.; Zambrano Alva, S.D.P.; Fernandez, A.; Giuliani, C.; Messina, E.; Pascucci, M.; Riccucci, C.; Staccioli, P.; et al. Microchemical Investigation of Long-Term Buried Gilded and Silvered Artifacts From Ancient Peru. Front. Mater. 2020, 7, 230. [Google Scholar] [CrossRef]
- Cesareo, R.; de Assis, J.T.; Roldán, C.; Bustamante, A.D.; Brunetti, A.; Schiavon, N. Multilayered samples reconstructed by measuring Ka/Kb or La/Lb X-ray intensity ratios by EDXRF. Nucl. Instrum. Methods Phys. Res. 2013, B 312, 15–22. [Google Scholar] [CrossRef]
- Vieri, J.; Uribe-Villegas, M.A.; and Martinón-Torres, M. Of forming, gilding and intentionality in pre-Columbian goldwork: Analytical characterisation of artefacts from the Museo del Oro. Bogotà J. Archaeol. Sci. Rep. 2020, 34, 102626. [Google Scholar] [CrossRef]
- Cesareo, R.; Calza, C.; DosAnjos, M.; Lopes, R.T.; Bustamante, A.; Fabian, J.S.; Alva, W.; Chero, L.Z. Pre-Columbian alloys from the royal tombs of Sipàn; energy dispersive X-ray florescence analysis with a portable equipment. Appl. Radiat. Isot. 2010, 68, 525–528. [Google Scholar] [CrossRef] [PubMed]
- Zucchiatti, A.; Font, A.C.; Neira, P.C.G.; Perea, A.; Esquivel, P.F.; Llorens, S.R.; Sil, J.L.R.; Verde, A. Prehispanic goldwork technology study by PIXE analysis. Nucl. Instrum. Methods Phys. Res. 2014, 332, 160–164. [Google Scholar] [CrossRef]
- Cesareo, R.; Iwanczyk, J.; Bustamante, A.; Anjos, M.D.; de Assis, J.T.; Azeredo, S.; Lopes, R.T. Transmission of X and γ-rays to differentiate Tumbaga from gold and gilded copper. Microchem. J. 2020, 155, 104720. [Google Scholar] [CrossRef]
- Brunetti, A.; Golosio, B.; Schoonjans, T.; Oliva, P. Use of Monte Carlo simulations for cultural heritage X-ray fluorescence analysis. Spectrochim. Acta Part B Spectrosc. 2015, 108, 15–20. [Google Scholar] [CrossRef]
- Kroese, D.P.; Taimre, T.; Botev, Z.I. Handbook of Monte Carlo Methods; John Wiley and Sons: Hoboken, NJ, USA, 2011. [Google Scholar]
- Brunetti, A.; Depalmas, A.; Gennaro, F.D.; Serges, A.; Schiavon, N. X-ray fluorescence spectroscopy and Monte Carlo characterization of a unique nuragic artifact (Sardinia, Italy). Spectrochim. Acta—Part Spectrosc. 2016, 121, 18–21. [Google Scholar] [CrossRef]
- Brunetti, A.; Fabian, J.; Torre, C.W.L.; Schiavon, N. A combined XRF/Monte Carlo simulation study of multilayered Peruvian metal artifacts from the tomb of the Priestess of Chornancap. Appl. Phys. A 2016, 122, 571–578. [Google Scholar] [CrossRef]
- Golosio, B.; Schoonjans, T.; Brunetti, A.; Oliva, P.; Masala, G.L. Monte Carlo simulation of X-ray imaging and spectroscopy experiments using quadric geometry and variance reduction techniques. Comput. Phys. Commun. 2014, 185, 1044–1052. [Google Scholar] [CrossRef] [Green Version]
- Schoonjans, T.; Brunetti, A.; Golosio, B.; Rio, M.S.D.; Solé, V.A.; Ferrero, C.; Vincze, L. The xraylib library for X-ray-matter interactions. Recent developments. Spectrochim. Acta—Part At. Spectrosc. 2011, 66, 776–784. [Google Scholar] [CrossRef]
- Available online: https://github.com/golosio/xrmc (accessed on 17 June 2022).
- Available online: https://github.com/tschoonj/xraylib/wiki (accessed on 17 June 2022).


| Samples (Code :S/T1-O:) | Typology |
|---|---|
| Chin protector (O:7) | Tumbaga |
| Nose decoration (O:9) | Tumbaga |
| Brain container (O:11) | Tumbaga |
| Right eye protector (O:18) | Tumbaga |
| Nose protector (O:13) | Tumbaga |
| center eye protector (=:12) | Tumbaga |
| Tooth protector (O:23) | Tumbaga |
| Convex nose protector (O:14) | Au- alloy |
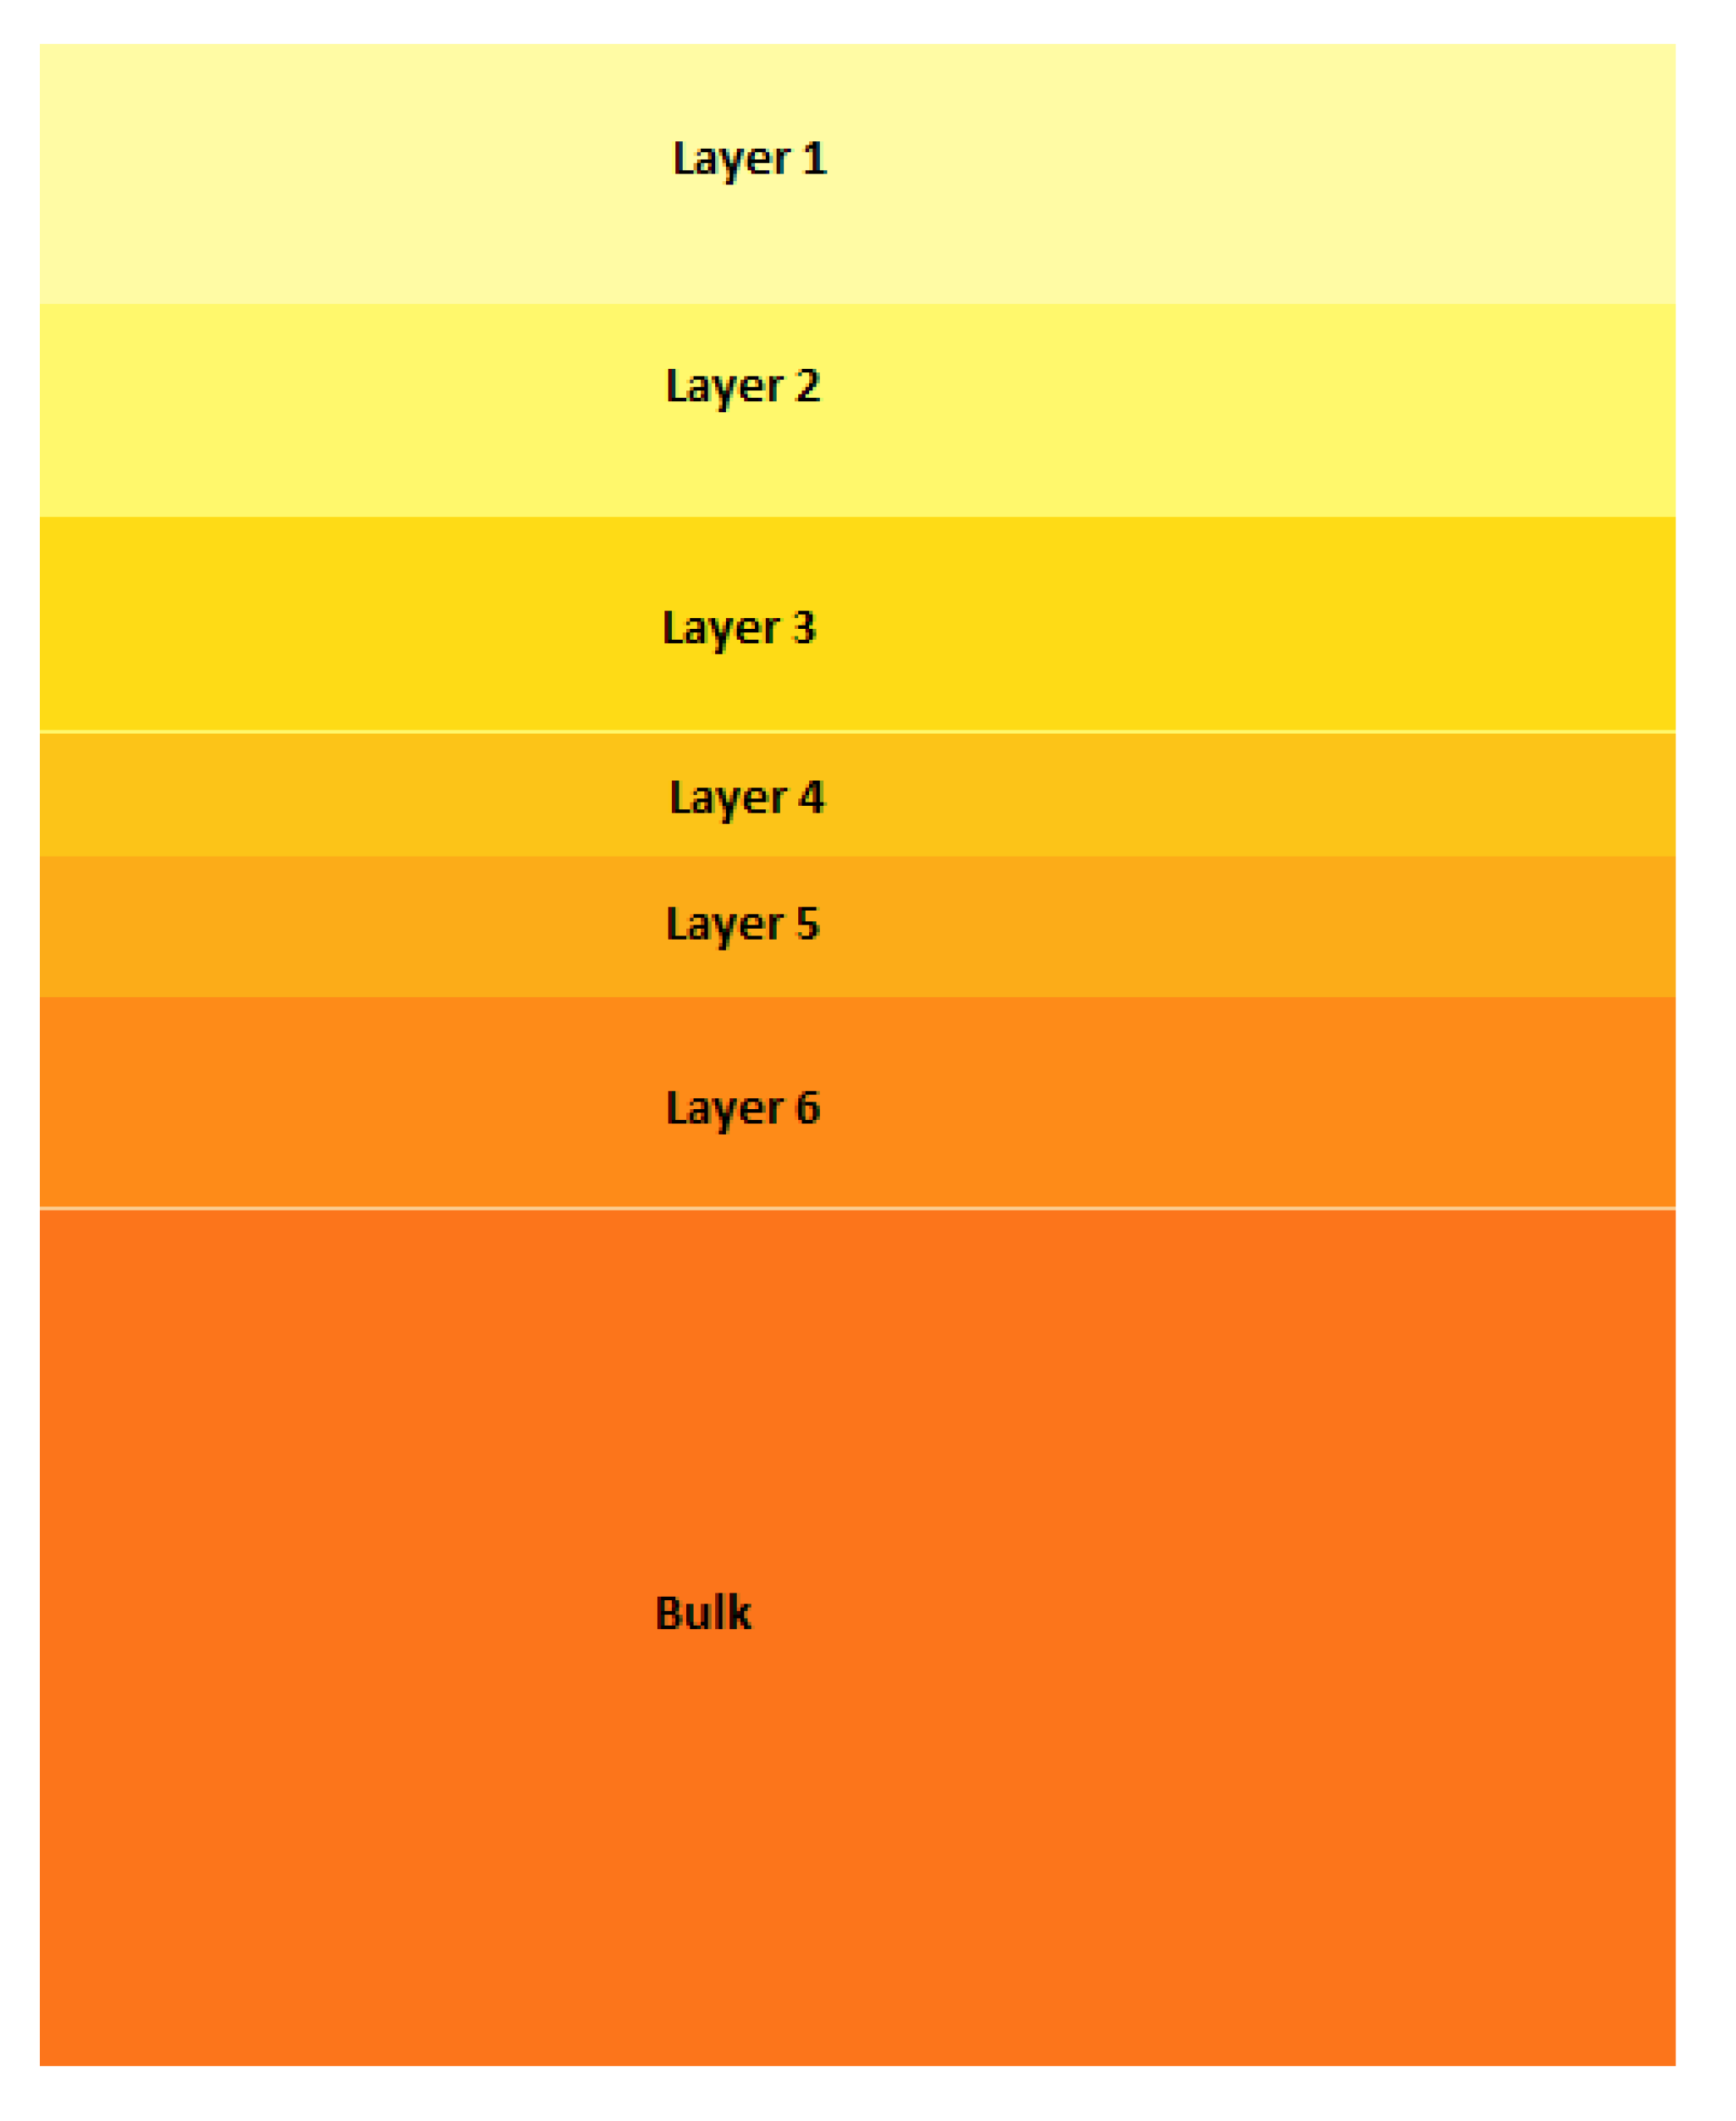
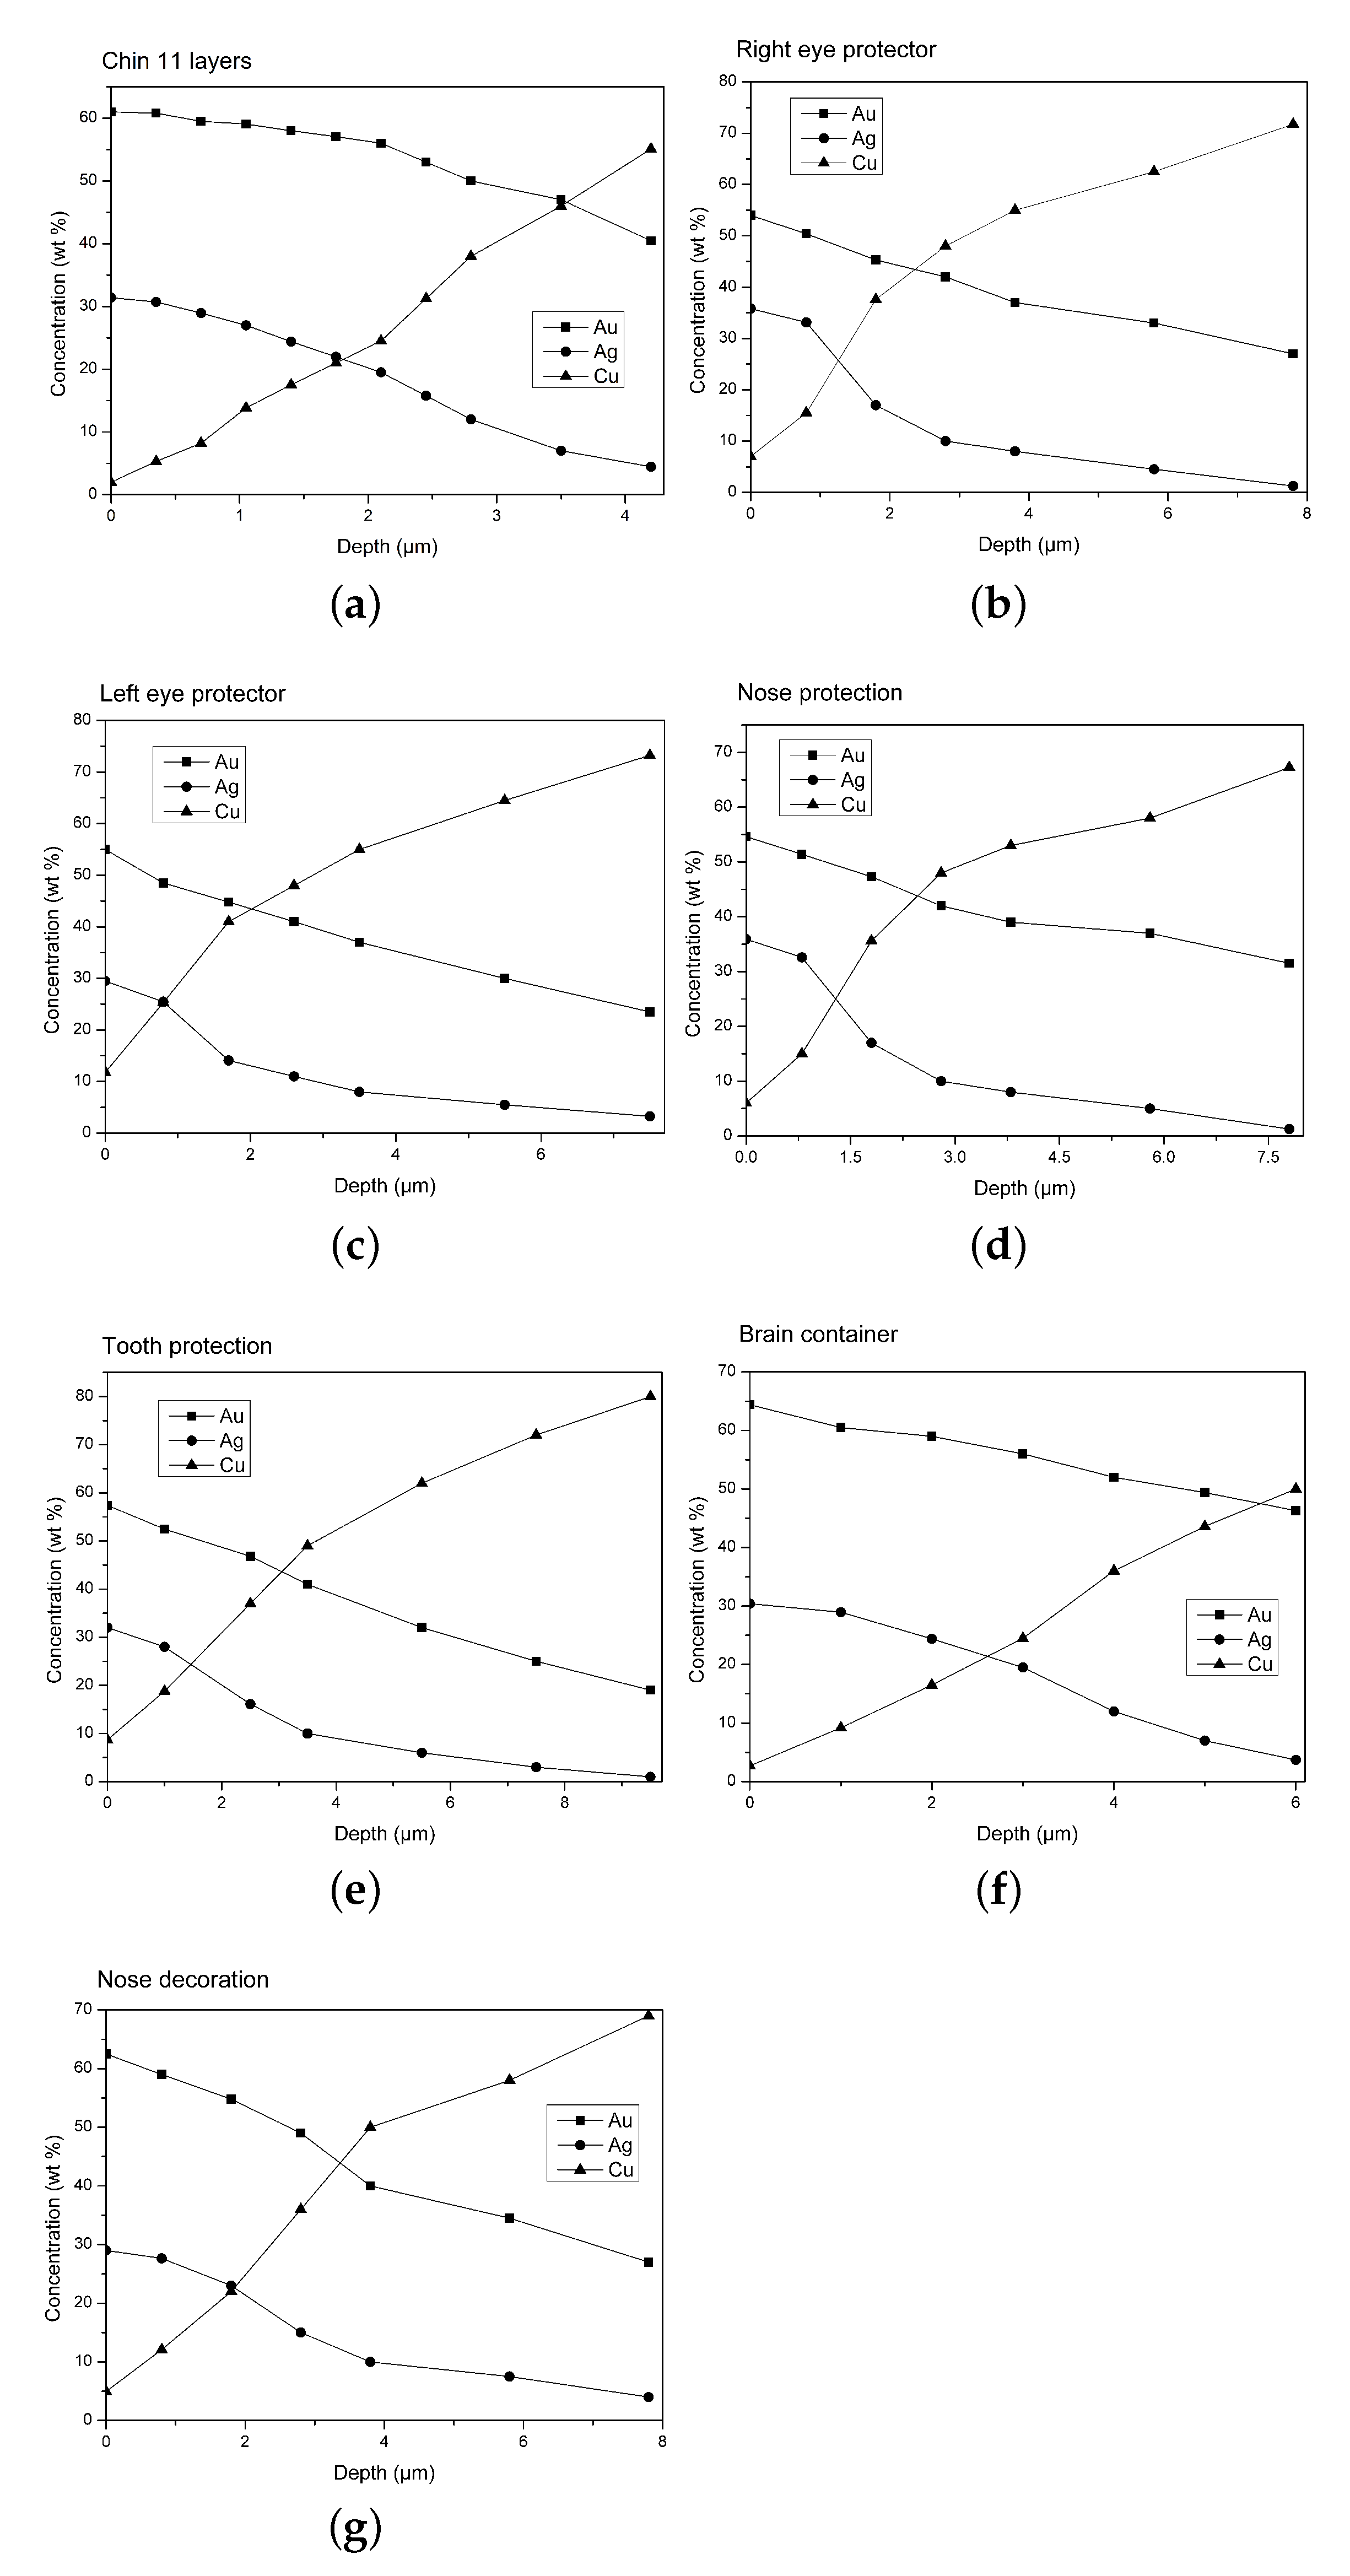
| Layers | Gold (Au wt%) | Silver (Ag wt%) | Copper (Cu wt%) | Thickness (m) |
|---|---|---|---|---|
| 1 | 61.0 | 31.4 | 2.0 | 0.35 |
| 2 | 60.8 | 30.7 | 5.3 | 0.35 |
| 3 | 59.5 | 28.9 | 8.2 | 0.35 |
| 4 | 59.0 | 27.0 | 13.8 | 0.35 |
| 5 | 58.0 | 24.4 | 17.5 | 0.35 |
| 6 | 57.0 | 21.9 | 21.0 | 0.35 |
| 7 | 56.0 | 19.5 | 24.5 | 0.35 |
| 8 | 53.0 | 15.7 | 31.3 | 0.35 |
| 9 | 50.0 | 12.0 | 38.0 | 0.7 |
| 10 | 47.0 | 7.0 | 46.0 | 0.7 |
| 11 | 40.4 | 4.5 | 55.1 | bulk |
Publisher’s Note: MDPI stays neutral with regard to jurisdictional claims in published maps and institutional affiliations. |
© 2022 by the authors. Licensee MDPI, Basel, Switzerland. This article is an open access article distributed under the terms and conditions of the Creative Commons Attribution (CC BY) license (https://creativecommons.org/licenses/by/4.0/).
Share and Cite
Brunetti, A.; Porcaro, M.; Bustamante, A.; Stegel, G.; Cesareo, R. Combining X-ray Fluorescence and Monte Carlo Simulation Methods to Differentiate between Tumbaga and Gold-Alloy or Gildings. Materials 2022, 15, 4452. https://doi.org/10.3390/ma15134452
Brunetti A, Porcaro M, Bustamante A, Stegel G, Cesareo R. Combining X-ray Fluorescence and Monte Carlo Simulation Methods to Differentiate between Tumbaga and Gold-Alloy or Gildings. Materials. 2022; 15(13):4452. https://doi.org/10.3390/ma15134452
Chicago/Turabian StyleBrunetti, Antonio, Marta Porcaro, Angel Bustamante, Giovanni Stegel, and Roberto Cesareo. 2022. "Combining X-ray Fluorescence and Monte Carlo Simulation Methods to Differentiate between Tumbaga and Gold-Alloy or Gildings" Materials 15, no. 13: 4452. https://doi.org/10.3390/ma15134452
APA StyleBrunetti, A., Porcaro, M., Bustamante, A., Stegel, G., & Cesareo, R. (2022). Combining X-ray Fluorescence and Monte Carlo Simulation Methods to Differentiate between Tumbaga and Gold-Alloy or Gildings. Materials, 15(13), 4452. https://doi.org/10.3390/ma15134452