
Crack-Resistant Cements under Drying: Results from Ring Shrinkage Tests and Multi-Physical Modeling


Abstract
:1. Introduction
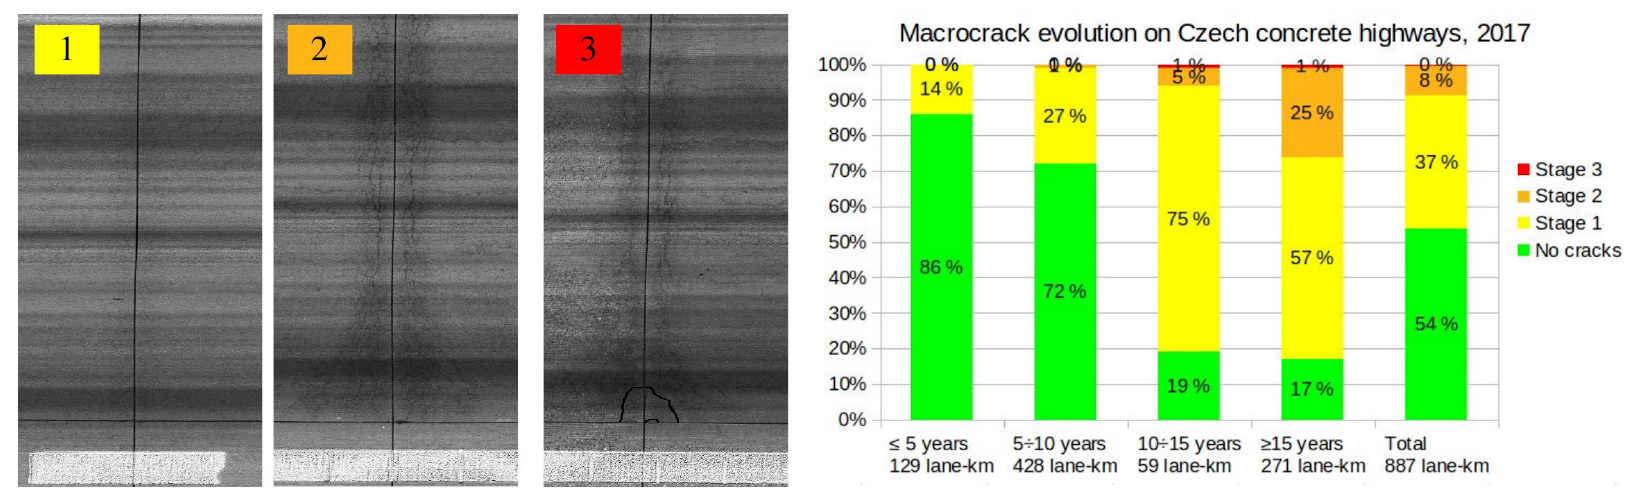
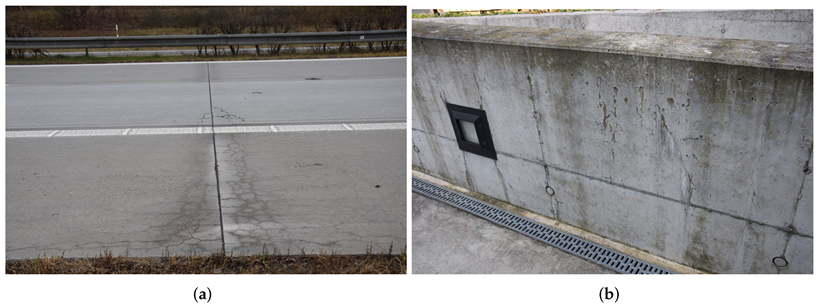
1.1. Surface Cracking
1.2. Microtomography
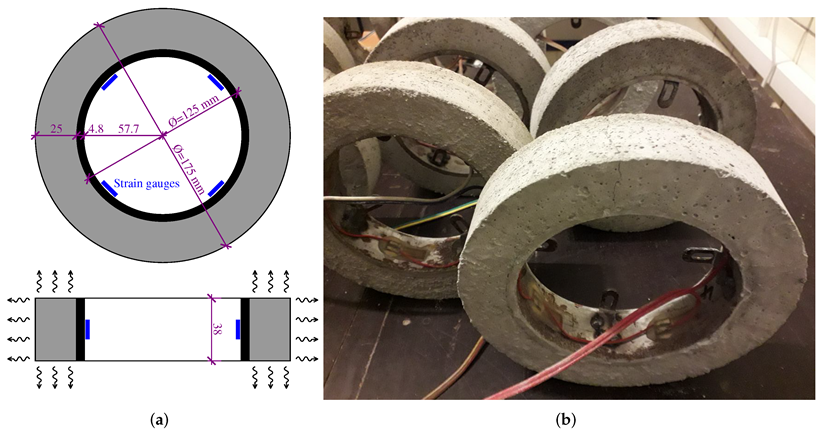
1.3. Ring Tests
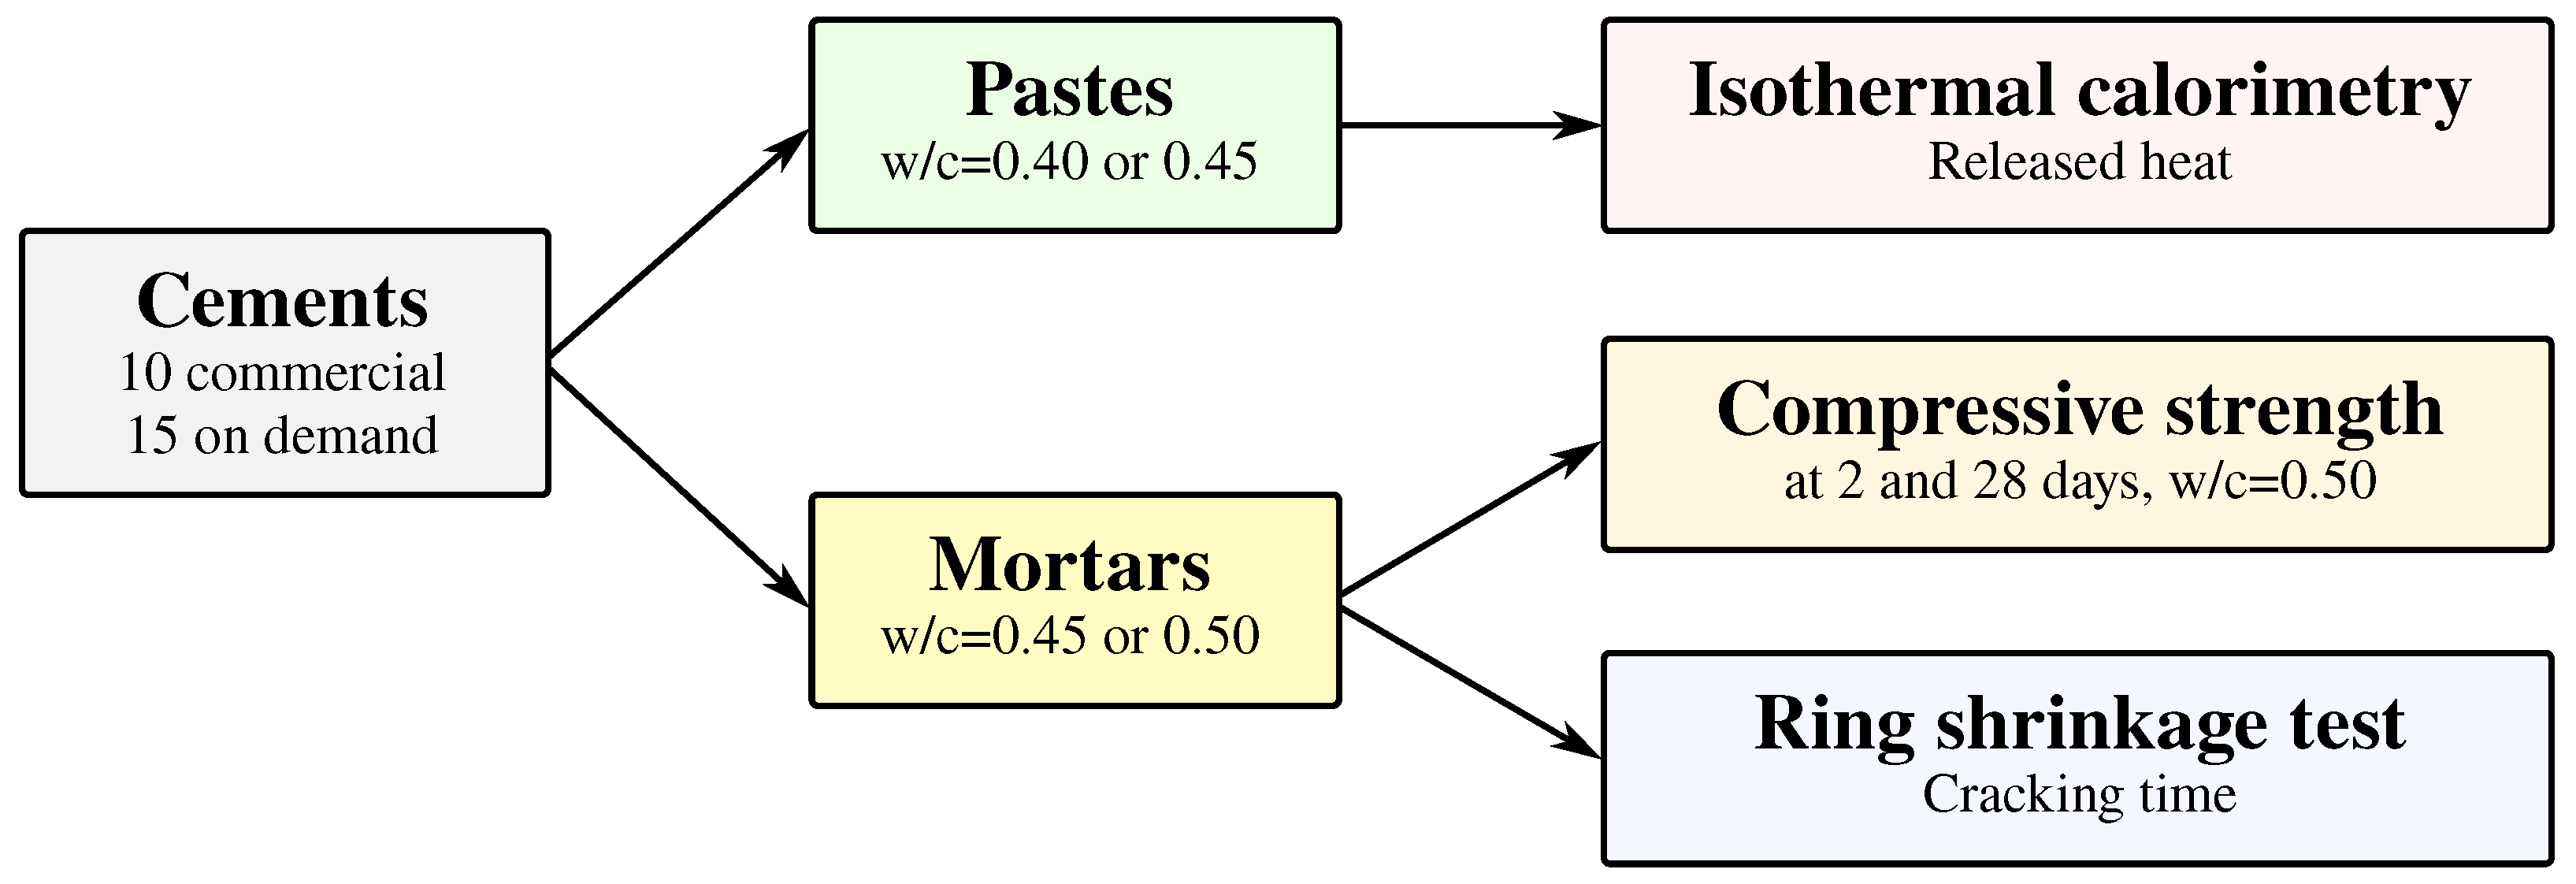
2. Materials and Methods
- 15 cements from Mokrá, Czech Republic (4× CEM I, 5× CEM II/A-S, 6× CEM II/B-S);
- 3 cements from Ladce, Slovak Republic (CEM I);
- 1 on-site blended cement Mokrá + slag SMŠ 400 (CEM II/B-S);
- 1 cement from Praha-Radotín, Czech Republic (CEM II/B-S);
- 1 cement from Hranice, Czech Republic (CEM II/B-S);
- 1 cement from Prachovice, Czech Republic (CEM II/B-S);
- 1 cement from Ożarów, Poland (CEM I);
- 1 cement from Rohožník, Slovak Republic (CEM I);
- 1 cement from Kiralyegyháza, Hungary (CEM II/B-S).
3. Results and Discussion
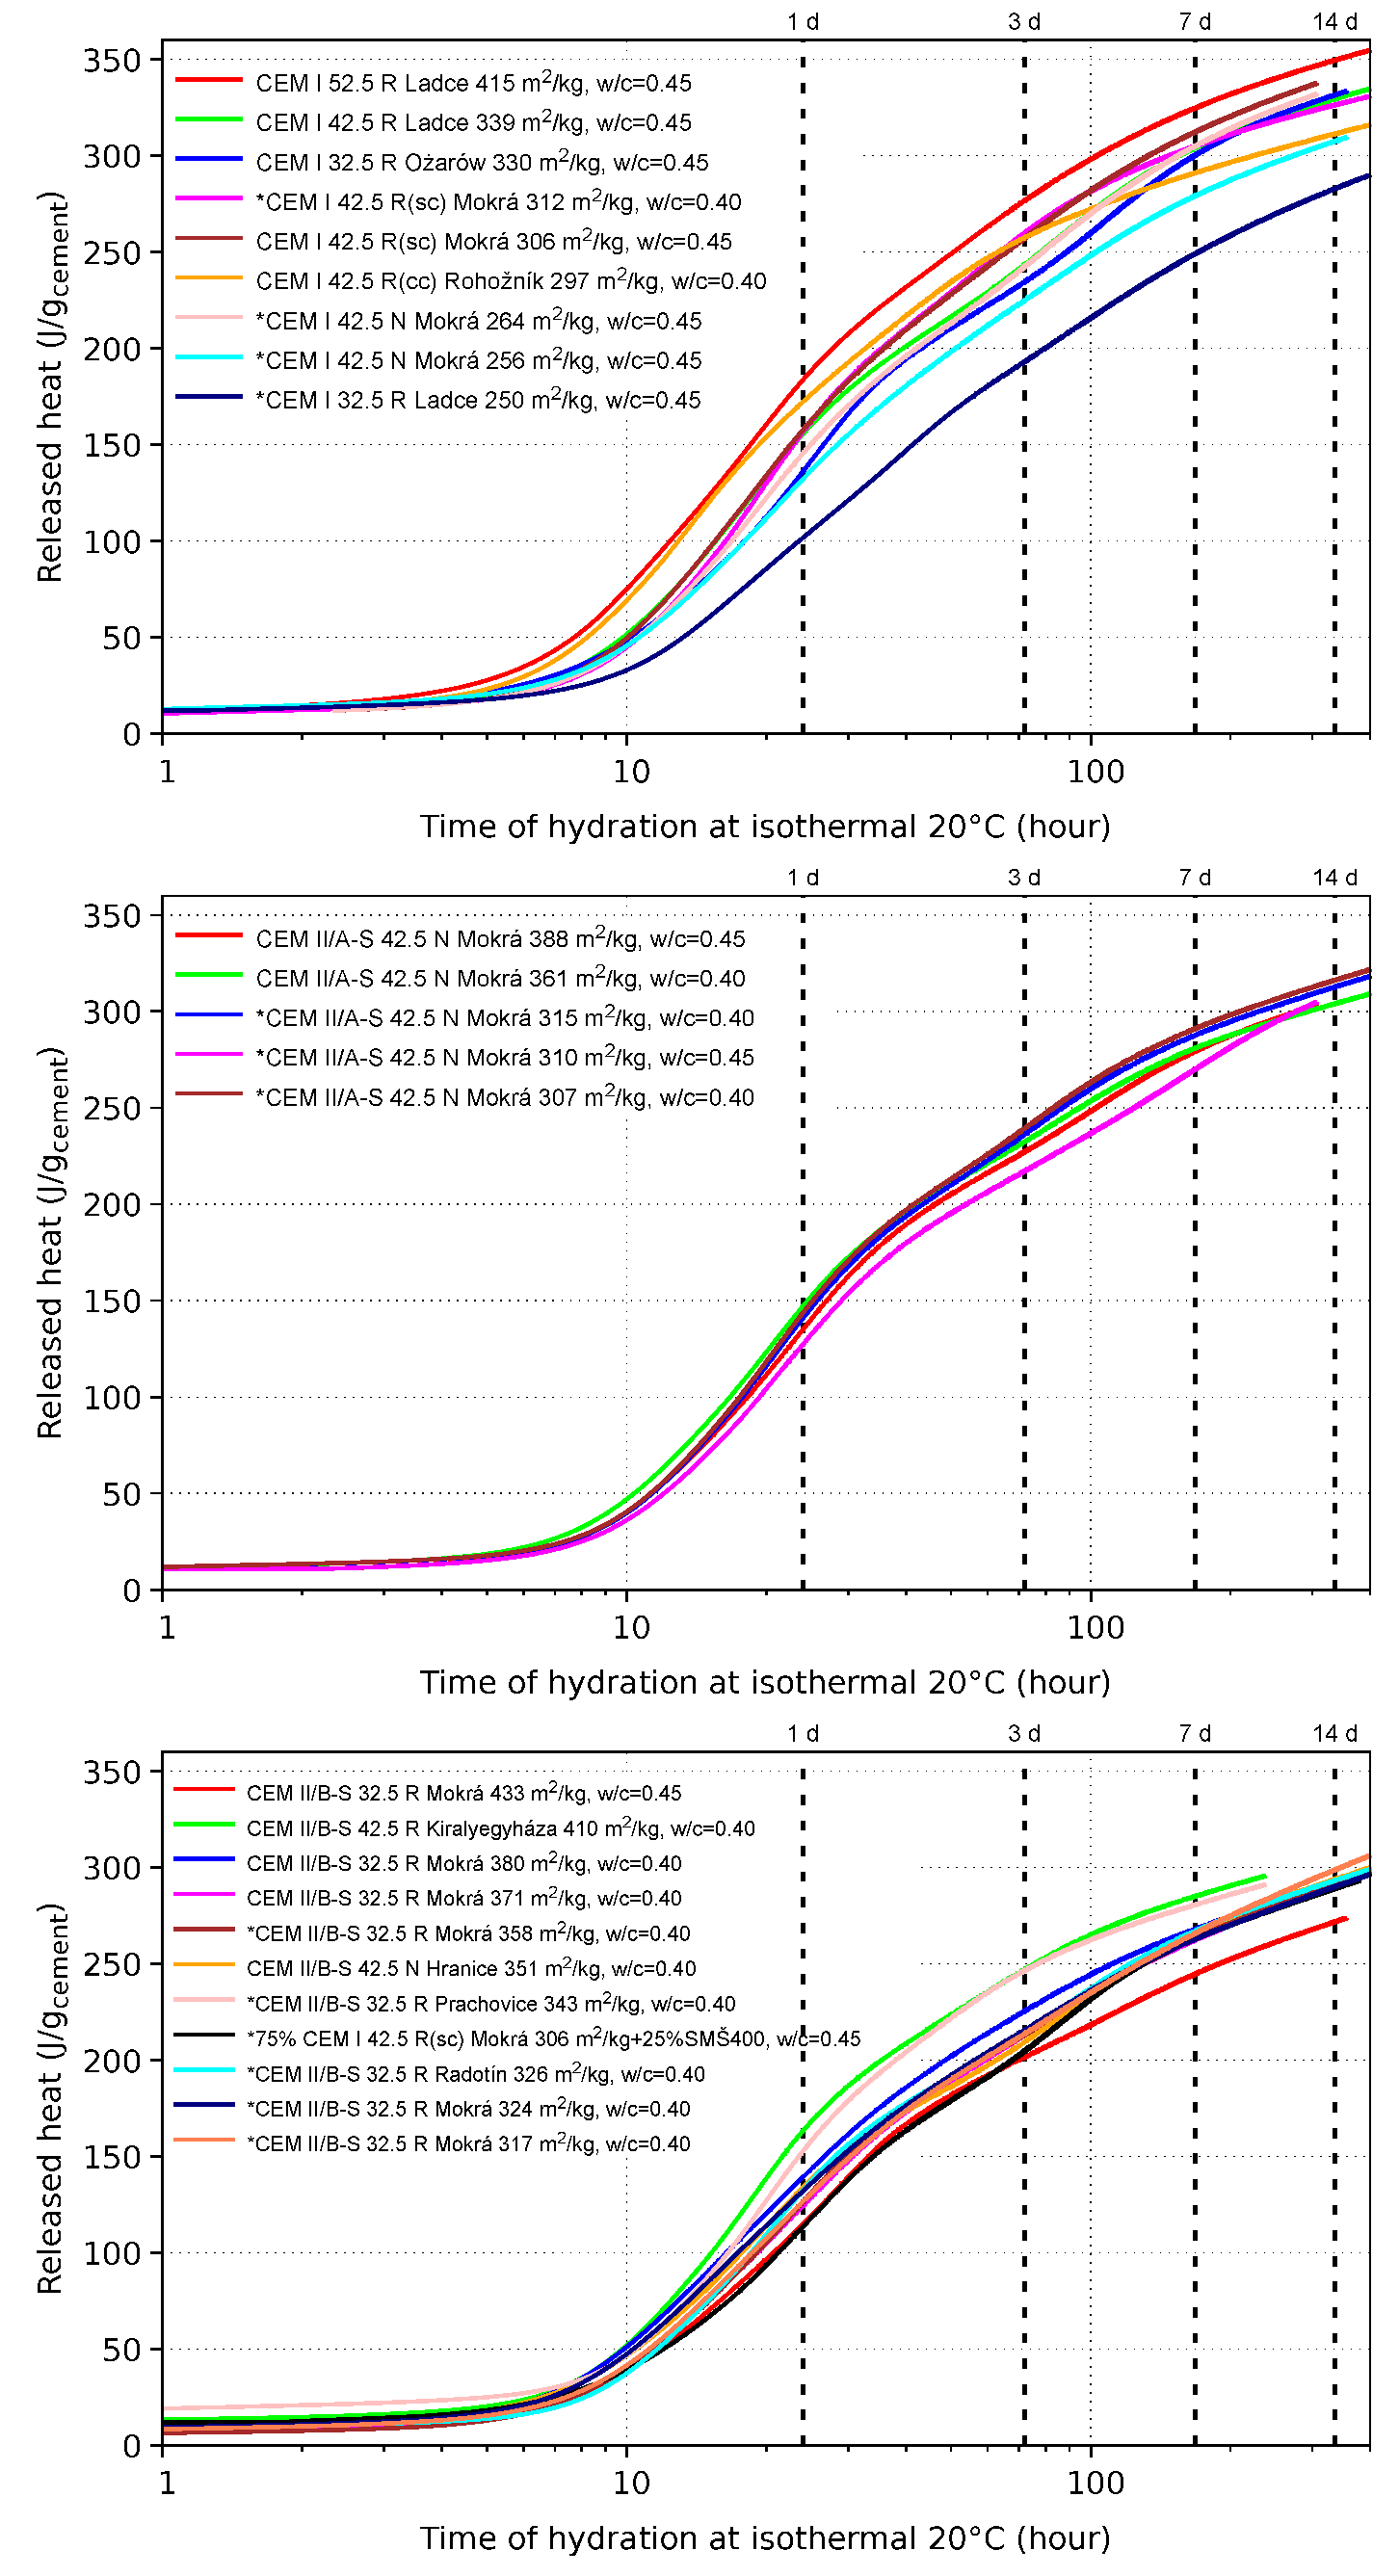
3.1. Isothermal Calorimetry
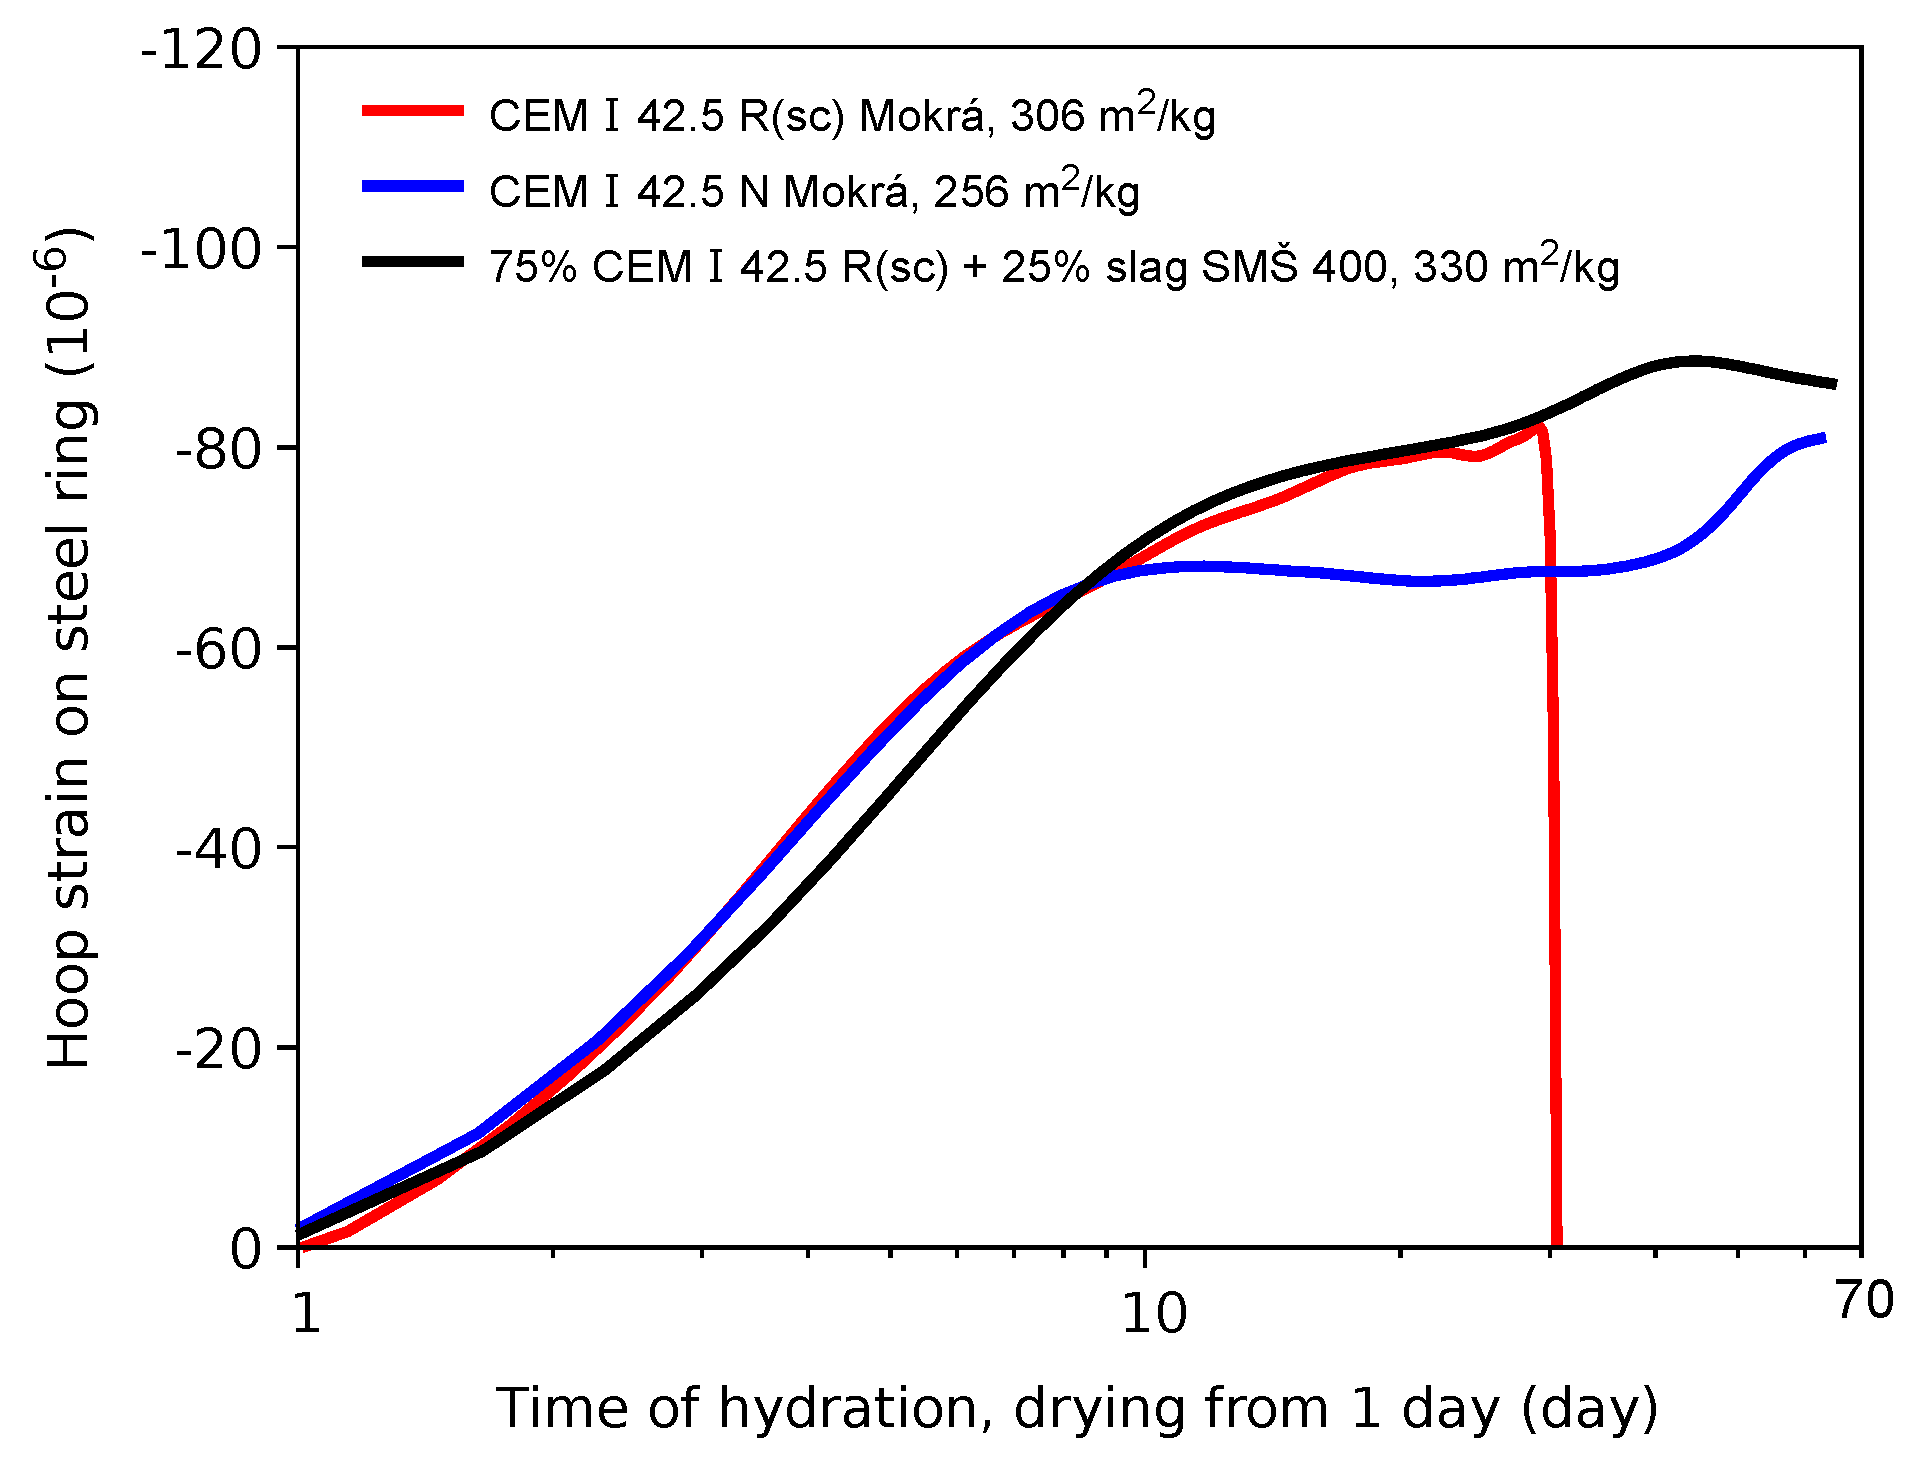
3.2. Ring Shrinkage Test
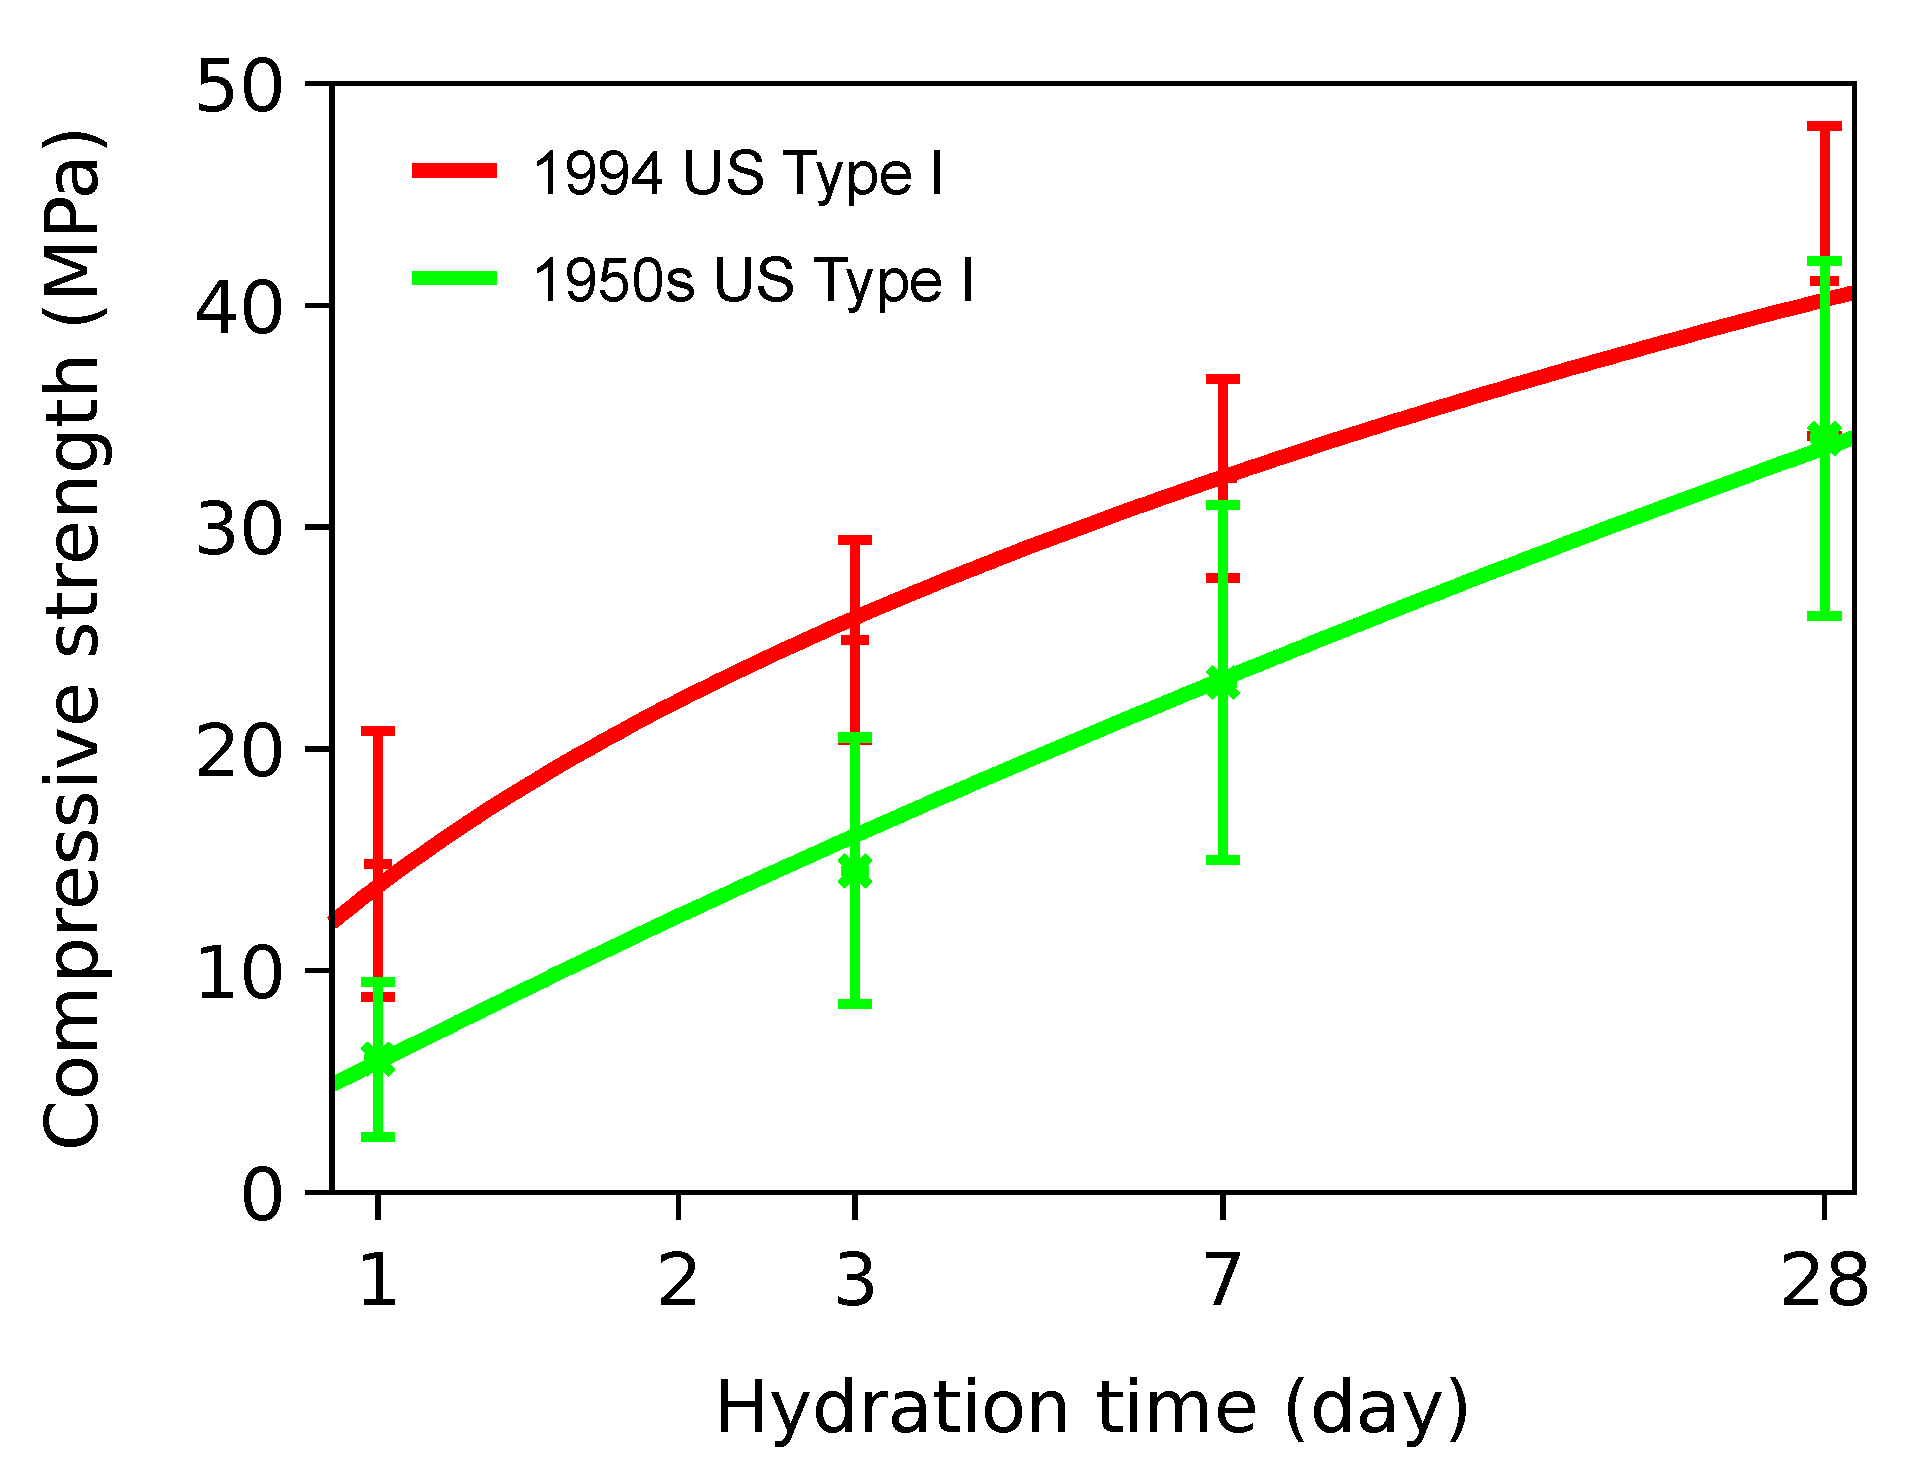
3.3. Compressive Strength
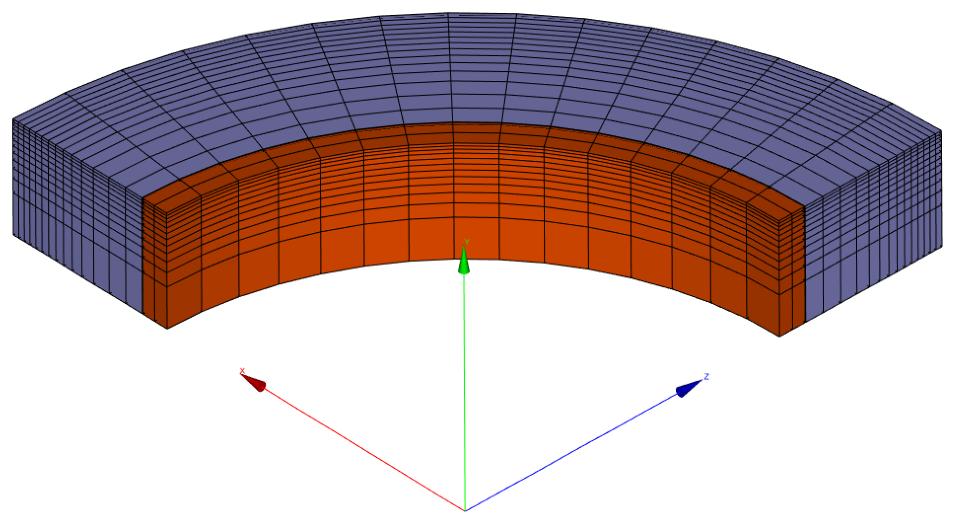
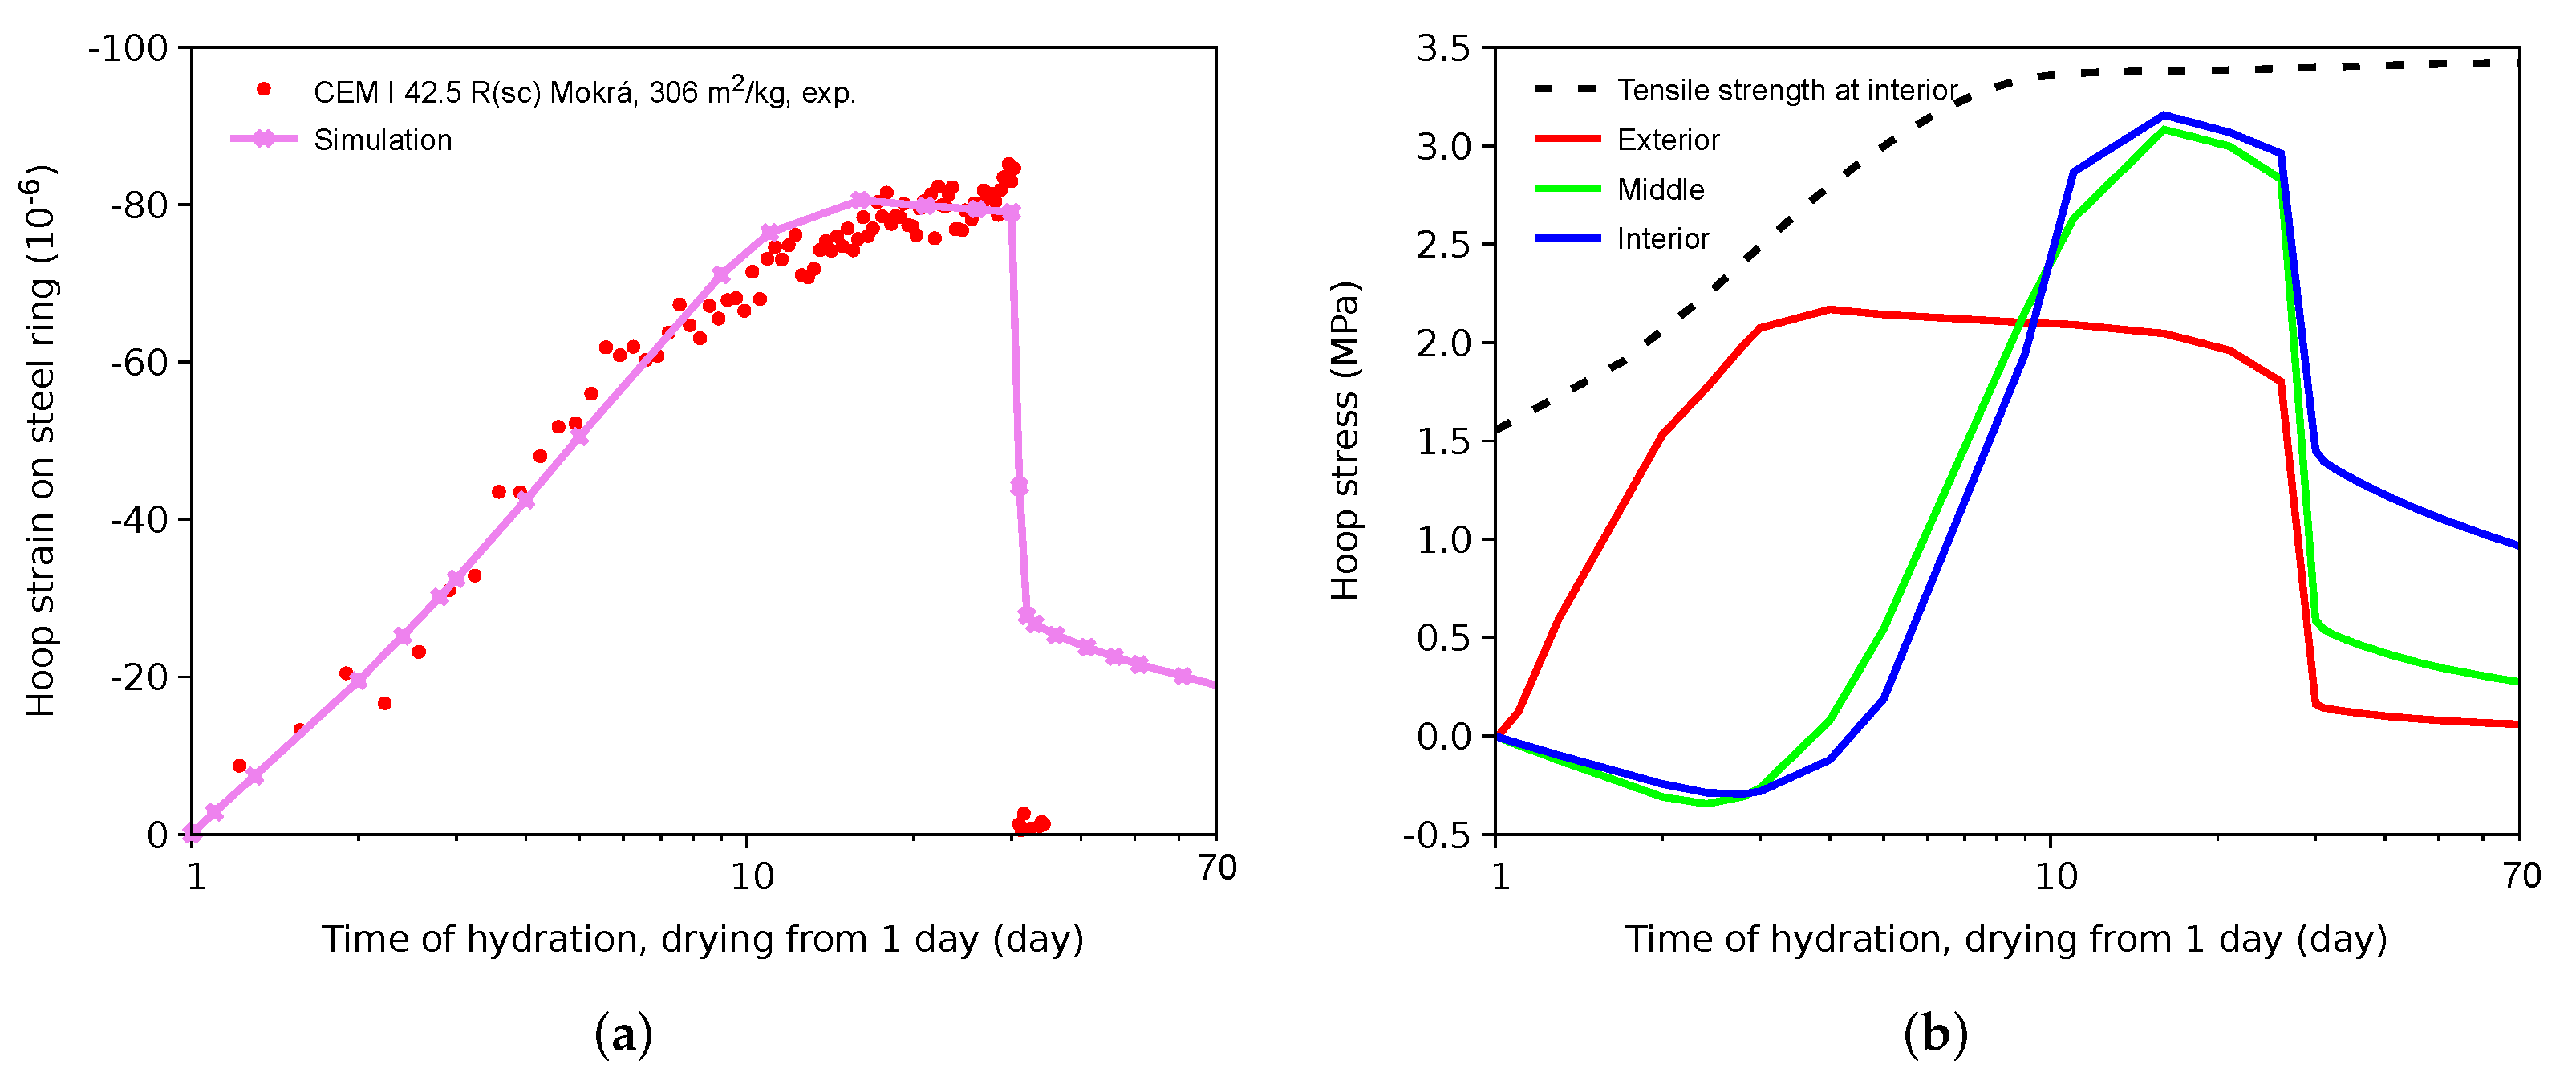
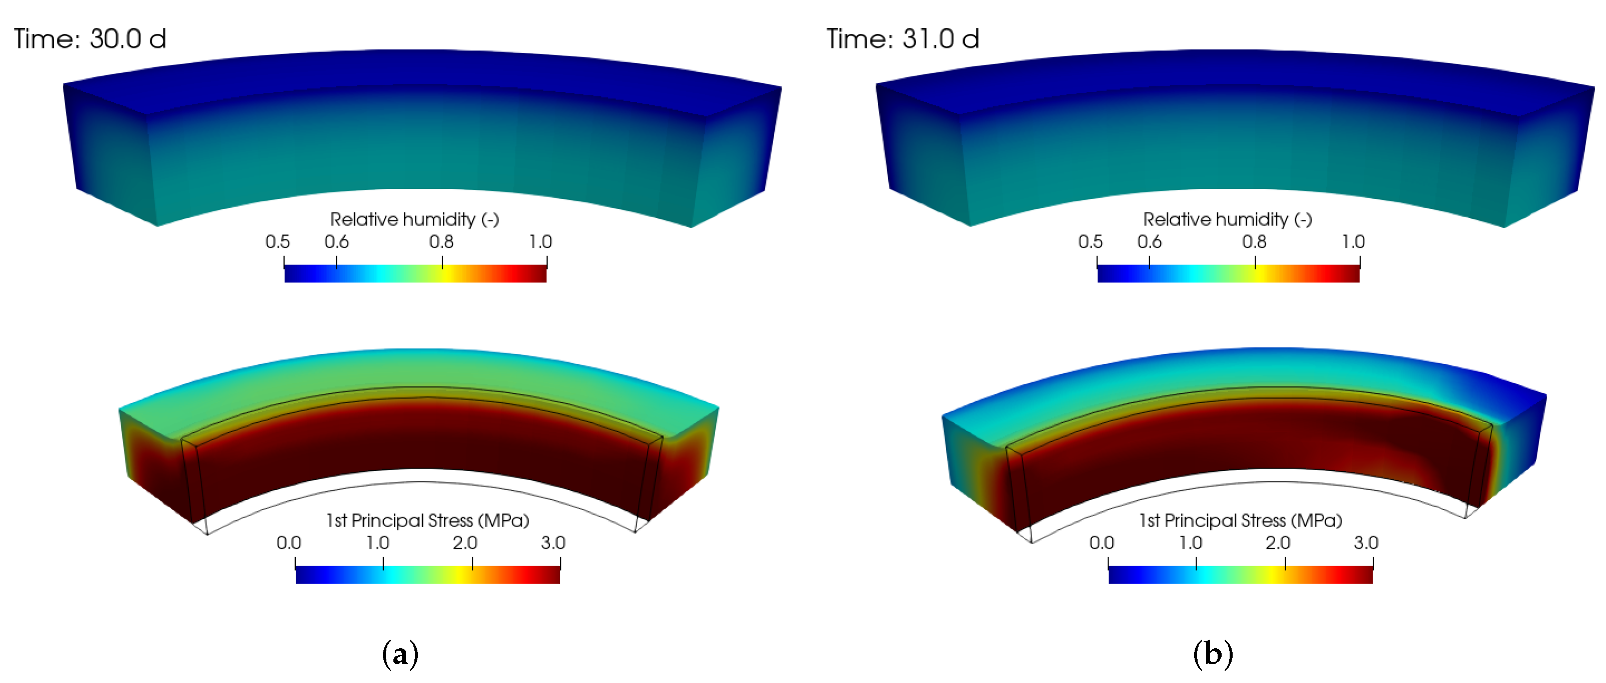
3.4. Hygro-Mechanical Model
4. Conclusions
Author Contributions
Funding
Institutional Review Board Statement
Informed Consent Statement
Data Availability Statement
Acknowledgments
Conflicts of Interest
References
- Scrivener, K.; Snellings, R.; Lothenbach, B. A Practical Guide to Microstructural Analysis of Cementitious Materials; CRC Press: Boca Raton, FL, USA, 2016. [Google Scholar]
- Bissonnette, B.; Pierre, P.; Pigeon, M. Influence of key parameters on drying shrinkage of cementitious materials. Cem. Concr. Res. 1999, 29, 1655–1662. [Google Scholar] [CrossRef]
- Baroghel-Bouny, V.; Mainguy, M.; Lassabatere, T.; Coussy, O. Characterization and identification of equilibrium and transfer moisture properties for ordinary and high-performance cementitious materials. Cem. Concr. Res. 1999, 29, 1225–1238. [Google Scholar] [CrossRef]
- Theiner, Y.; Drexel, M.; Neuner, M.; Hofstetter, G. Comprehensive study of concrete creep, shrinkage, and water content evolution under sealed and drying conditions. Strain 2017, 53, e12223. [Google Scholar] [CrossRef]
- Pickett, G. The effect of change in moisture-content on the creep of concrete under a sustained load. J. Am. Concr. Inst. 1942, 38, 333–355. [Google Scholar]
- Havlásek, P.; Jirásek, M. Multiscale modeling of drying shrinkage and creep of concrete. Cem. Concr. Res. 2016, 85, 55–74. [Google Scholar] [CrossRef]
- De Schutter, G.; Taerwe, L. Fictitious degree of hydration method for the basic creep of early age concrete. Mater. Struct. 2000, 33, 370–380. [Google Scholar] [CrossRef]
- Burrows, R.W. The Visible and Invisible Cracking of Concrete; ACI International: Farmington Hills, MI, USA, 1998. [Google Scholar]
- Burrows, R. Is American Portland cement inferior to European cement? Concr. Constr. 2012, 57. Available online: https://www.concreteconstruction.net/magazine/2012/ (accessed on 10 May 2022).
- Mehta, P.; Burrows, R. Building durable structures in the 21st century. Indian Concr. J. 2001, 75, 437–443. [Google Scholar]
- Bhatty, J.; Tennis, P. U.S. and Canadian Cement Characteristics: 2004; Technical Report; Portland Cement Association: Skokie, IL, USA, 2008. [Google Scholar]
- Zementbund, D. Betonstrassenbau in Deutschland; Zementverlag GmbH: Berlin-Charlottenburg, Germany, 1936. [Google Scholar]
- Breitenbücher, R.K. Zwangsspannungen und Rißbildung infolge Hydratationswärme. Ph.D. Thesis, Technical University of Munich, Munich, Germany, 1988. [Google Scholar]
- Burrows, R.W.; Kepler, W.F.; Hurcomb, D.R.; Schaffer, J.V.; Sellers, J.G. Three simple tests for selecting low-crack cement. Cem. Concr. Compos. 2004, 26, 509–519. [Google Scholar] [CrossRef]
- Hlavatý, J.; Šmilauer, V.; Slánský, B.; Dvořák, R. Opatření k prodloužení životnosti cementobetonových krytů vozovek-část I. Silniční Obz. 2019, 80, 164–168. [Google Scholar]
- Khan, A. Control of Cracking in Concrete. State of the Art; Technical Report; Transportation Research Board: Washington, DC, USA, 2006. [Google Scholar]
- Mac, M.; Wong, H.; Buenfeld, N. 3D characterisation of microcracks in concrete. In Proceedings of the Nanocem Spring Meeting, Leimen, Germany, 25 April 2017; Dalang-Secrétan, M., Ed.; Imperial College London: London, UK, 2017; pp. 135–139. [Google Scholar]
- Mac, M.; Yio, M.; Wong, H.; Buenfeld, N. Analysis of autogenous shrinkage-induced microcracks in concrete from 3D images. Cem. Concr. Res. 2021, 144, 106416. [Google Scholar] [CrossRef]
- Yio, M.; Mac, M.; Yeow, Y.; Wong, H.; Buenfeld, N. Effect of autogenous shrinkage on microcracking and mass transport properties of concrete containing supplementary cementitious materials. Cem. Concr. Res. 2021, 150, 106611. [Google Scholar] [CrossRef]
- Bažant, Z.; Ohtsubo, H.; Aoh, K. Stability and post-critical growth of a system of cooling or shrinkage cracks. Constr. Build. Mater. 1979, 15, 443–456. [Google Scholar] [CrossRef]
- Mehta, P.K. Concrete technology at the crossroads—Problems and opportunities. In SP-144: Concrete Technology Past, Present and Future; ACI: Detroit, MI, USA, 1994; pp. 1–31. [Google Scholar]
- Kanavaris, F.; Azenha, M.; Soutsos, M.; Kovler, K. Assessment of behaviour and cracking susceptibility of cementitious systems under restrained conditions through ring tests: A critical review. Cem. Concr. Compos. 2019, 95, 137–153. [Google Scholar] [CrossRef] [Green Version]
- Karagüler, M.; Yatağan, M. Effect of aggregate size on the restrained shrinkage of the concrete and mortar. MOJ Civ. Eng. 2018, 4, 15–21. [Google Scholar] [CrossRef] [Green Version]
- Bentur, A.; Kovler, K. Evaluation of early age cracking characteristics in cementitious systems. Mater. Struct. 2003, 36, 183–190. [Google Scholar] [CrossRef]
- Radlinska, A.; Weiss, J. Assessing the repeatability of the restrained ring test. In Brittle Matrix Composites 9; Brandt, A., Olek, J., Eds.; Woodhead Publishing: Sawston, UK, 2009; pp. 335–346. [Google Scholar] [CrossRef]
- Bentz, D.; Sant, G.; Weiss, J.W. Early-Age Properties of Cement-Based Materials. I: Influence of Cement Fineness. J. Mater. Civ. Eng. 2008, 20. [Google Scholar] [CrossRef] [Green Version]
- Šmilauer, V.; Havlásek, P.; Gasch, T.; Delaplace, A.; Bouhjiti, D.E.M.; Benboudjema, F.; Briffaut, M.; Kanavaris, F.; Azenha, M. Hygro-mechanical modeling of restrained ring test: COST TU1404 benchmark. Constr. Build. Mater. 2019, 229, 116543. [Google Scholar] [CrossRef]
- Mikhailova, O.; del Campo, A.; Rovnanik, P.; Fernández, J.; Torres-Carrasco, M. In situ characterization of main reaction products in alkali-activated slag materials by Confocal Raman Microscopy. Cem. Concr. Compos. 2019, 99, 32–39. [Google Scholar] [CrossRef]
- Carlson, R.; Reading, T. Model Study of Shrinkage Cracking in Concrete Building Walls. ACI Struct. J. 1988, 85, 395–404. [Google Scholar]
- Patzák, B. OOFEM—An object-oriented simulation tool for advanced modeling of materials and structures. Acta Polytech. 2012, 52, 59–66. [Google Scholar] [CrossRef]
- Patzák, B. Object Oriented Finite Element Method—OOFEM. Available online: http://www.oofem.org (accessed on 10 May 2022).
- Kiernożycki, W.; Błyszko, J. The Influence of Temperature on the Hydration Rate of Cements Based on Calorimetric Measurements. Materials 2021, 14, 3025. [Google Scholar] [CrossRef]
- Taylor, H.F.W. Cement Chemistry; Academic Press: New York, NY, USA, 1990. [Google Scholar]
- Shah, H.; Weiss, J. Quantifying shrinkage cracking in fiber reinforced concrete using the ring test. Mater. Struct. 2006, 39, 887–899. [Google Scholar] [CrossRef]
- Hossain, A.B.; Pease, B.; Weiss, J. Quantifying Early-Age Stress Development and Cracking in Low Water-to-Cement Concrete: Restrained-Ring Test with Acoustic Emission. Transp. Res. Rec. 2003, 1834, 24–32. [Google Scholar] [CrossRef]
- Moon, J.H.; Weiss, J. Estimating residual stress in the restrained ring test under circumferential drying. Cem. Concr. Compos. 2006, 28, 486–496. [Google Scholar] [CrossRef]
- Bažant, Z.P.; Najjar, L.J. Nonlinear water diffusion in nonsaturated concrete. Mater. Struct. 1972, 5, 3–20. [Google Scholar] [CrossRef]
- Jirásek, M.; Havlásek, P. Microprestress-Solidification Theory of Concrete Creep: Reformulation and Improvement. Cem. Concr. Res. 2014, 60, 51–62. [Google Scholar] [CrossRef]
- Bažant, Z.; Jirásek, M. Creep and Hygrothermal Effects in Concrete Structures; Springer: Berlin/Heidelberg, Germany, 2018. [Google Scholar]
- Bažant, Z.; Baweja, S. Creep and Shrinkage Prediction Model for Analysis and Design of Concrete Structures: Model B3; Al-Manaseer, A., Ed.; American Concrete Institute: Farmington Hills, MI, USA, 2000. [Google Scholar]


| Component | CEM I Mokrá | CEM I Ladce | CEM I Prachovice | GGBFS SMŠ 400 |
|---|---|---|---|---|
| SiO2 | 20.7 | 21.7 | 18.2 | 39.7 |
| Al2O3 | 4.8 | 5.3 | 5.1 | 6.5 |
| Fe2O3 | 3.4 | 2.8 | 2.9 | 0.47 |
| CaO | 63.8 | 66.1 | 62.8 | 40.1 |
| MgO | 1.4 | 1.4 | 2.2 | 9.5 |
| SO3 | 3.2 | 3.2 | 3.2 | 0.72 |
| K2O | 0.75 | 1.0 | 0.76 | 0.55 |
| Na2O | 0.16 | 0.04 | 0.31 | 0.33 |
| Na2O-eq. | 0.65 | 0.7 | 0.82 | 0.69 |
| LOI | 1.46 | 0.85 | 4.95 | 1.25 |
| Insoluble | 0.45 | - | 0.30 | - |
| C3S | 63.2 | 59.4 | 68.5 | - |
| C2S | 11.7 | 17.4 | 0.6 | - |
| C3A | 7.0 | 9.3 | 8.5 | - |
| C4AF | 10.3 | 8.6 | 5.5 | - |
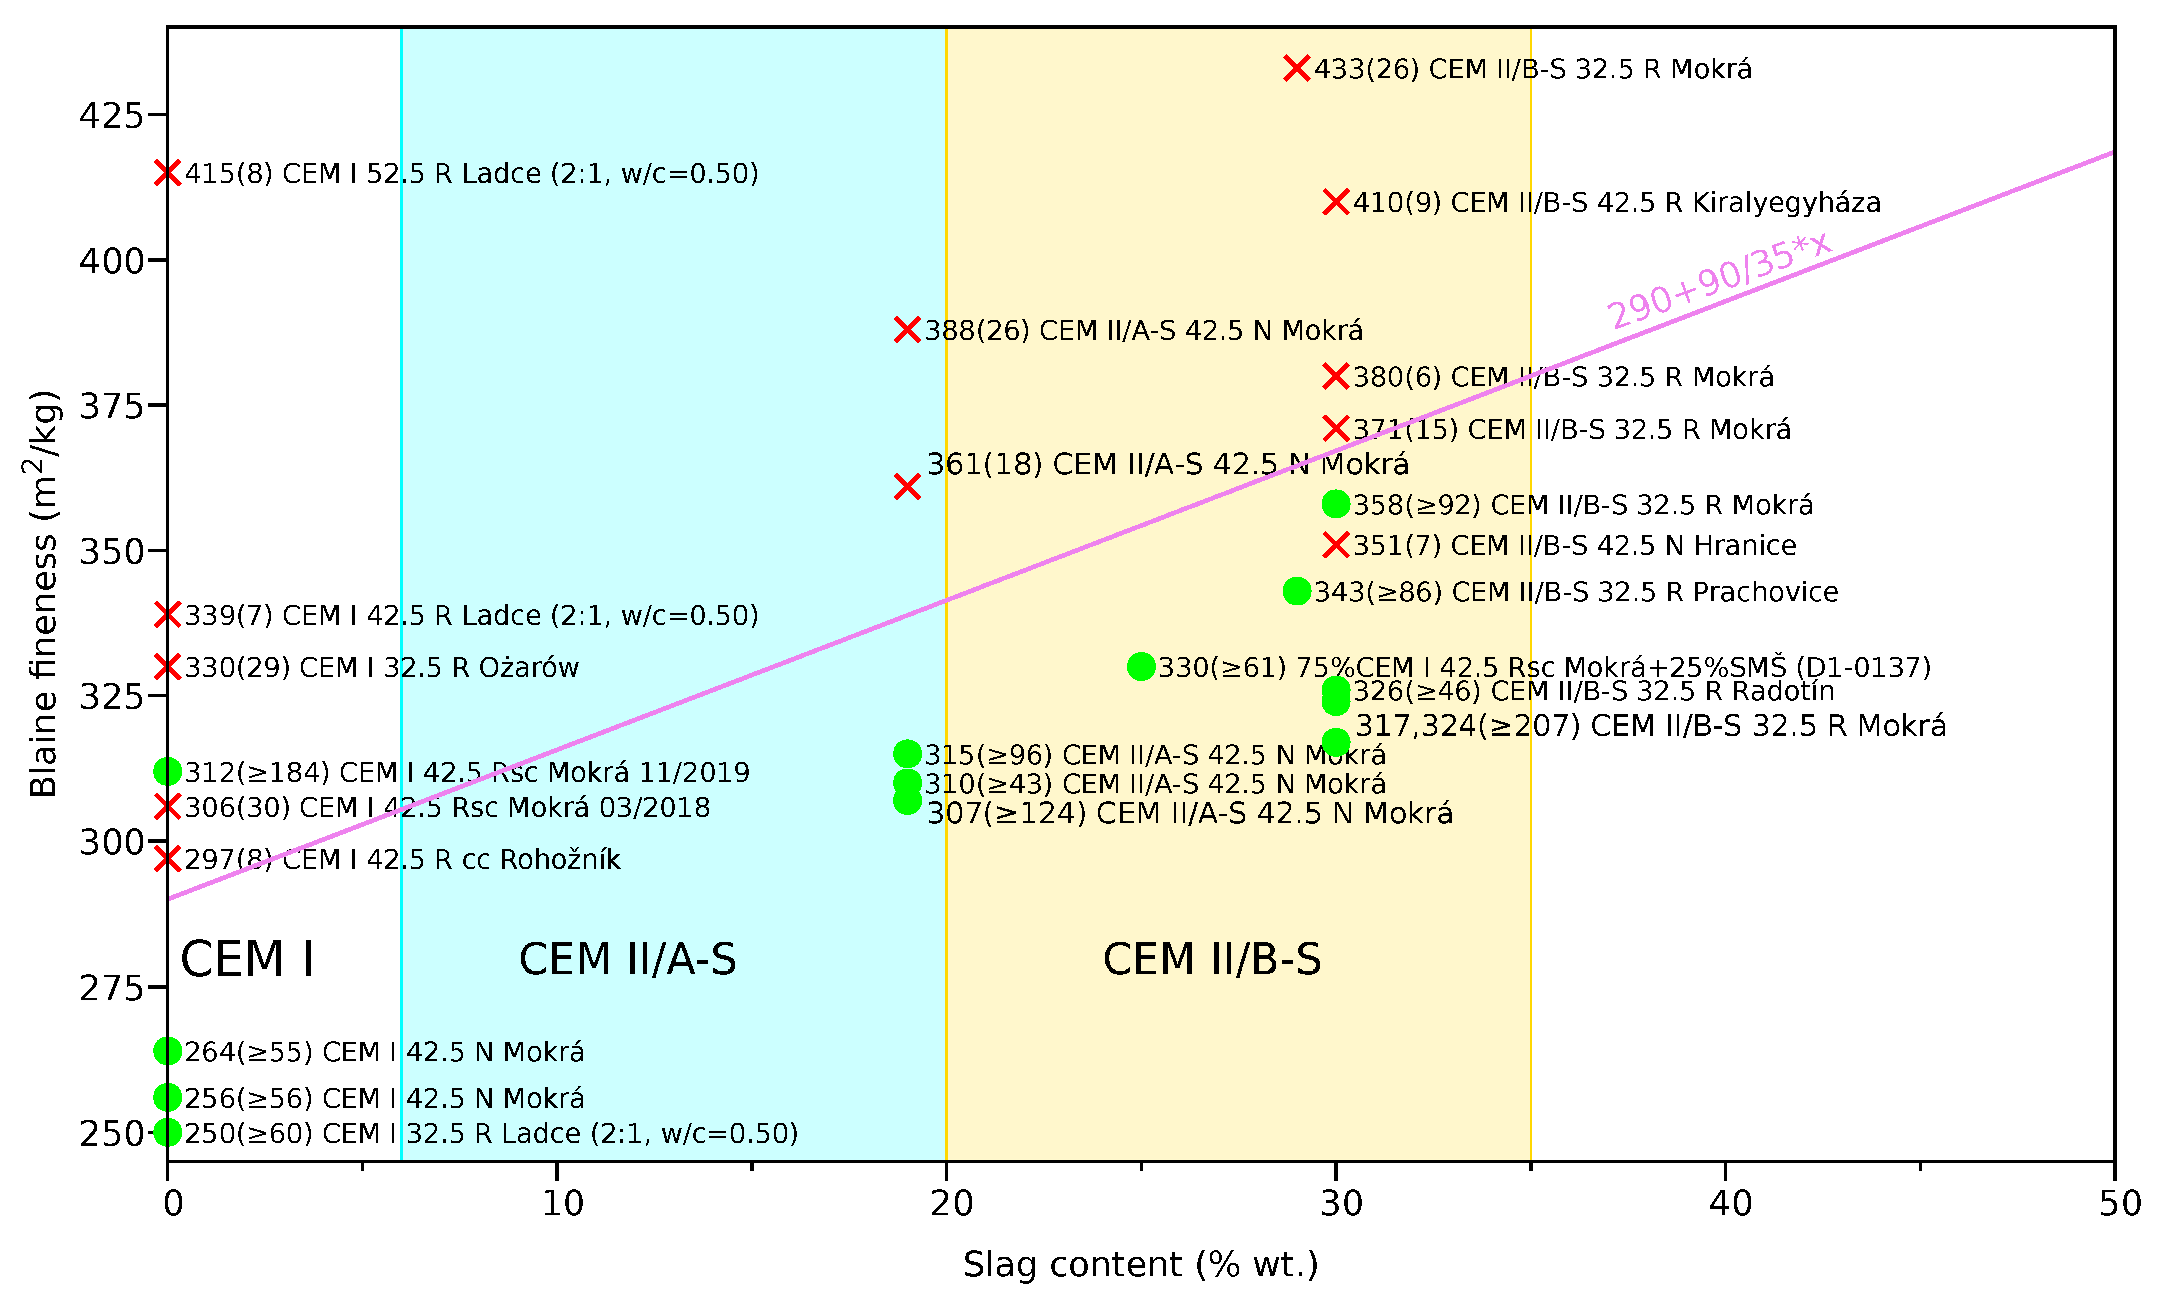
| Cement | Blaine Fineness | Compressive Strength | Released Heat at 24 h | Ring Crack Time ± st. dev. | |
|---|---|---|---|---|---|
| (m2/kg) | 2 d (MPa) | 28 d (MPa) | (J/g) | (day) | |
| *CEM I 32.5 R Ladce | 250 | 11.9 | 37.9 | 102 | ≥ |
| *CEM I 42.5 N Mokrá | 256 | 21.1 | 47.7 | 133 | ≥ |
| *CEM I 42.5 N Mokrá | 264 | 21.2 | 53.3 | 146 | ≥ |
| CEM I 42.5 R(cc) Rohožník b | 297 | 28.0 | 56.0 | 172 | |
| CEM I 42.5 R(sc) Mokrá, March 2018 b | 306 | 27.5 | 59.5 | 157 | |
| *CEM I 42.5 R(sc) Mokrá, November 2019 | 312 | 27.7 | 59.7 | 156 | ≥ |
| CEM I 32.5 R Ożarów b | 330 | 21.0 | 45.0 | 137 | |
| CEM I 42.5 R Ladce | 339 | 27.1 | 52.2 | 156 | |
| CEM I 52.5 R Ladce | 415 | 32.6 | 58.0 | 184 | |
| *CEM II/A-S 42.5 N Mokrá | 307 | 22.5 | 53.1 | 142 | ≥ |
| *CEM II/A-S 42.5 N Mokrá | 310 | 18.2 | 50.4 | 127 | ≥ |
| *CEM II/A-S 42.5 N Mokrá | 315 | 21.2 | 52.4 | 140 | ≥ |
| CEM II/A-S 42.5 N Mokrá | 361 | 22.6 | 52.5 | 147 | |
| CEM II/A-S 42.5 N Mokrá b | 388 | 21.0 | 54.0 | 135 | |
| *CEM II/B-S 32.5 R Mokrá | 317 | 14.9 | 46.6 | 126 | ≥ |
| *CEM II/B-S 32.5 R Mokrá | 324 | 16.4 | 48.5 | 133 | ≥ |
| *CEM II/B-S 32.5 R Radotín b | 326 | 18 | 48 | 133 | ≥46 a |
| *75% CEM I 42.5 R(sc) Mokrá + 25% SMŠ 400 | 330 | 18.0 | 48.5 | 113 | ≥ |
| *CEM II/B-S 32.5 R Prachovice b | 343 | 20.1 | 50.8 | 154 | ≥ |
| CEM II/B-S 42.5 N Hranice b | 351 | ∼21 | ∼52 | 134 | |
| *CEM II/B-S 32.5 R Mokrá | 358 | 19.2 | 52.3 | 126 | ≥ |
| CEM II/B-S 32.5 R Mokrá | 371 | 18.1 | 53.0 | 125 | |
| CEM II/B-S 32.5 R Mokrá | 380 | 20.0 | 53.9 | 139 | |
| CEM II/B-S 42.5 R Kiralyegyháza b | 410 | 18 | 50 | 164 | |
| CEM II/B-S 32.5 R Mokrá b | 433 | 17 | 51 | 115 | |
Publisher’s Note: MDPI stays neutral with regard to jurisdictional claims in published maps and institutional affiliations. |
© 2022 by the authors. Licensee MDPI, Basel, Switzerland. This article is an open access article distributed under the terms and conditions of the Creative Commons Attribution (CC BY) license (https://creativecommons.org/licenses/by/4.0/).
Share and Cite
Šmilauer, V.; Reiterman, P.; Šulc, R.; Schořík, P. Crack-Resistant Cements under Drying: Results from Ring Shrinkage Tests and Multi-Physical Modeling. Materials 2022, 15, 4040. https://doi.org/10.3390/ma15124040
Šmilauer V, Reiterman P, Šulc R, Schořík P. Crack-Resistant Cements under Drying: Results from Ring Shrinkage Tests and Multi-Physical Modeling. Materials. 2022; 15(12):4040. https://doi.org/10.3390/ma15124040
Chicago/Turabian StyleŠmilauer, Vít, Pavel Reiterman, Rostislav Šulc, and Petr Schořík. 2022. "Crack-Resistant Cements under Drying: Results from Ring Shrinkage Tests and Multi-Physical Modeling" Materials 15, no. 12: 4040. https://doi.org/10.3390/ma15124040
APA StyleŠmilauer, V., Reiterman, P., Šulc, R., & Schořík, P. (2022). Crack-Resistant Cements under Drying: Results from Ring Shrinkage Tests and Multi-Physical Modeling. Materials, 15(12), 4040. https://doi.org/10.3390/ma15124040