Abstract
In situ environmental transmission electron microscope (ETEM) could provide intuitive and solid proof for the local structure and chemical evolution of materials under practical working conditions. In particular, coupled with atmosphere and thermal field, the behavior of nano catalysts could be directly observed during the catalytic reaction. Through the change of lattice structure, it can directly correlate the relationship between the structure, size and properties of materials in the nanoscale, and further directly and accurately, which is of great guiding value for the study of catalysis mechanism and the optimization of catalysts. As an outstanding catalytic material in the application of methane reforming, molybdenum oxide (MoO3)-based materials and its deoxidation process were studied by in situ ETEM method. The corresponding microstructures and components evolution were analyzed by diffraction, high-resolution transmission electron microscopy (HRTEM) and electron energy loss spectrum (EELS) techniques. MoO3 had a good directional deoxidation process accompanied with the process of nanoparticles crushing and regrowth in hydrogen (H2) and thermal field. However, in the absence of H2, the samples would exhibit different structural evolution.
1. Introduction
Molybdenum (Mo)-based materials are often used as efficient catalysts for various heterogeneous gas-solid catalytic reactions [1,2]. Primarily, molybdenum oxide (MoO3)/molybdenum carbide (MoC) catalysts are widely used in the chemical industry due to their value in the carbon cycle catalysis [3,4], including methane reforming [5]. As an excellent catalytic and substrate material, MoC also perfectly compounds other materials to achieve better results. For example, Ding Ma et al. employed α-MoC in hydrogenation reaction, showing high selectivity and yield because α-MoC and nitrogen compounds preferentially activate the C=O and C−OH bonds over C=C and C−C [6]. Interestingly, MoO3 is also the raw material used to produce MoC [7]. Xinhe Bao and colleagues prepared a highly reactive Au/MoC catalyst using MoO3 and Au nanoparticles. In the process, the MoO3 to MoC transition and the intermediate states, such as MoOxCy and Au dispersion processes, were completed by the Strong Metal-Support Interaction (SMIS) [8]. The first step of the MoO3 deoxygenation process, both with MoO3/MoC catalysts and during the molybdenum carbide reaction, deserves to be explored in detail [9,10]. In addition, previous work pointed out the connection between deoxygenation sites and the active sites of the subsequent reaction, which helps explore the evolution of reaction sites [11]. Moreover, MoO3 and MoOx are two-dimensional materials widely used in devices, which is one of the significances of exploring MoO3 deoxidation [12,13].
It is of great significance to explore the generations of catalysts and process of reaction [14,15]. And there are many in situ methods, such as X-ray diffraction patterns (XRD), Fourier Transform Infrared (FTIR), and X-ray Absorption Fine Structure (XAFS) are widely used in catalytic research, also the thermodynamic experiments mostly analyze the structure from a macro perspective rather than directly observing the reaction [14]. At present, there are few means for direct observation of catalytic reactions [16]. However, the recent development of environmental transmission electron microscope (ETEM) makes it possible to observe the nanomaterials’ performances during chemical reactions at an atomic scale [17,18]. In situ techniques such as thermal, electrical, and force fields are used to study the dynamics under external conditions during catalyst evolution and track the catalyst motion at the atomic scale to observe the atomic dynamics in real-time [19]. Therefore, the structure-activity relationships and reasons for activity could be better understood. In catalysis, many catalytic mechanisms are not clearly comprehended. The catalytic experiment can only show that some reactions are promoted, but the reason for their activity is still unknown [18]. Moreover, selective exploration should also get enough attention at the atomic scale, to guide more targeted, cheaper, and sustainable new catalysts [14].
In recent years, ETEM has been widely used to study heterogeneous catalytic reactions to effectively observe surface reactions, according to the high-resolution transmission electron microscopy (HRTEM) images attained [20,21]. Many areas are explored in situ TEM, such as the oxidation and reduction of materials [22,23] and the evolution of the catalyst in reactions, like ammonia synthesis [24,25]. HRTEM captures the detailed information of the catalyst changes, analyzes the phase changes of the sample with diffraction information, then provides insight into the material’s structure and correlates its performance accordingly [26]. On this basis, the analysis of elements and valence states combined with electron energy loss spectrum (EELS) or energy Dispersive X-Ray Spectroscopy (EDX) analysis is an excellent complement to electron microscopy [20]. Therefore, in situ TEM has irreplaceable significance in understanding the structure-activity relationship [27].
In this article, MoO3 deoxidizing process was studied in situ by ETEM, under thermal heating and a hydrogen (H2) atmosphere. The deoxidization process starts with the temperature increasing, and the structure breaks down simultaneously. The deoxidization process continues with the continuous temperature increase, and the broken structure grows again. In contrast, different phenomena are present under pure thermal heating in a vacuum. Specifically, there are no splitting and growth phenomena, but the MoO3 sublimation is evident. Simultaneously, the pressure and reaction location may be related to the active site and catalytic activity. These phenomena were verified by electron diffraction maps and EELS plots. The deoxygenation process of MoO3 is carried out on the atomic scale, which is important for understanding and exploring the production process of MoC. Also, it is important to study the relationship between the evolution and structural properties of Mo-based catalysts in the catalytic process.
2. Results
2.1. Deoxidation of MoO3
The MoO3 used in this study is the commercially available MoO3 nanoparticles (NPs) with a 50–100 nm diameter dispersed in ethanol solution and cast on a SiNx-based heating chip. The NPs were loaded into the ETEM by an in situ heating holder (Wildfire S3, DENS solutions). For the in situ experiment, the temperature was controlled by a DENs heating system, and the atmosphere was controlled with an ETEM gas path system.
2.1.1. Characteristics Analysis of Molybdenum Oxide MoO3
Before the in situ experiment, the samples were preliminarily analyzed, and to obtain clearer images for the study, thinner NPs were chosen. Figure 1a shows a low magnification TEM image for MoO3 NPs dispersed on the carbon film, where the NPs size is uniform. Figure 1b is the spectrum of the sample collected using EELS, corresponding to the MoO3position. The Mo-M4,5 and M2,3 edges are attributed to Mo, and the O-K edge corresponds to O. Generally, the O/Mo ratio is obtained through quantitative analysis of the Mo-M3 and Ok edges [16]. Therefore, in the following in situ experiments, the variation characteristics were acquired in real-time with the structural analysis. The XRD data in Figure S1 shows that the main peak positions accurately correspond to each crystal plane. Apart from the spectroscopic analysis of MoO3 samples, static electron microscopy characterization was performed, and the structure and phase of samples were analyzed. Figure 1c shows the HRTEM images and diffraction patterns from the [10] direction of orthorhombic MoO3 samples. Figure 1d is the enlarged red rectangular area in Figure 1c. The (100) and (001) spots in the diffraction pattern in Figure 1c correspond to the crystal plane with 3.64 nm 3.92 nm spacings in Figure 1d, respectively [12]. According to TEM images analysis, the crystal direction of the dispersed sample is mostly displayed in the [10] direction.
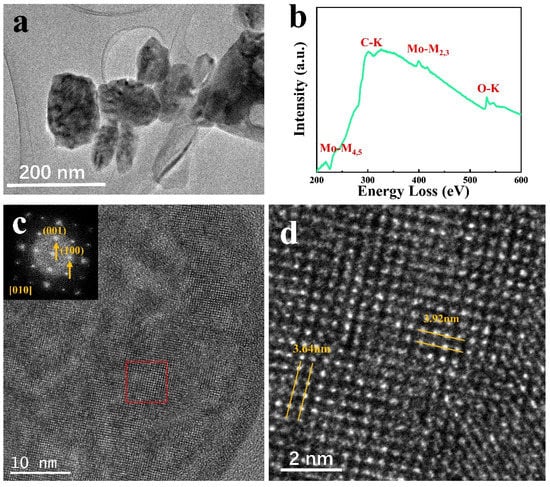
Figure 1.
(a) TEM images of MoO3; (b) EELS of MoO3; (c,d) HRTEM images of MoO3.
2.1.2. MoO3Structural Changes in H2 Atmosphere
Figure 2a shows the experimental schematic of the in situ ETEM and heated scaffold system. The ventilation function of the environmental in situ ETEM introduces H2 gaseous spheres as an external field. Meanwhile, the heating support system controls the temperature to achieve the heating of the sample. As shown in Figure 2a, the NPs dispersed on the silicon nitride chip and heated. Under these conditions, real-time information of samples, including HRTEM photos and EELS mapping data, was collected.
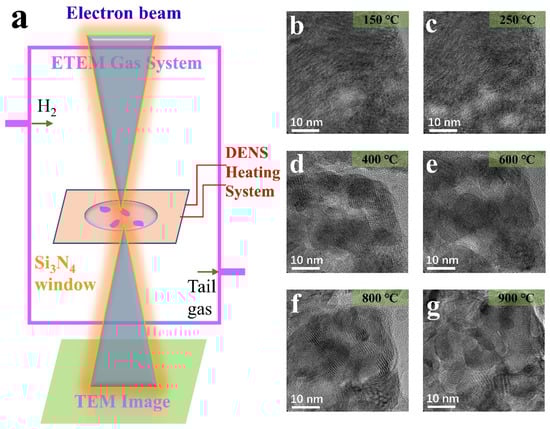
Figure 2.
(a) Diagram of the experimental installation; (b–g) HRTEM images of the MoO3 NP by heating in H2 (0.6 mbar) at different temperatures.
Starting from MoO3 NPs, the MoO3 response when the conditions changed from reduction to redox was studied. H2 pressures of 0.1 mbar and 0.6 mbar were applied, and the temperature was gradually increased from 25 °C to 900 °C. Previous studies have shown that pressure affects the phase transition at different temperatures [9,28]. Figure 2b–g shows the MoO3 evolution in a 0.6 mbar H2 atmosphere. Moire fringes were generated near the characteristic temperatures, 250 °C and 800 °C, around the diffraction temperature. However, it is not evident at other temperatures like 600 °C. In other words, the temperature at which Moire fringes are produced is the temperature at which the phase transition takes place violently. On the other hand, it is the temperature at which the particle’s shape changes dramatically at later heating especially after 600 °C. The Moire fringes are the sample splitting caused by temperature change and the particle dislocation caused by deoxidation and successive phase transition. However, during stability periods, such as 400–600 °C, the Moire fringes are not prominent. Therefore, it was considered the stabilizing period for MoO2. At this point, the deoxidation process continues, but the phase transition is not significant and is not a major concern. Combined with diffraction information at different temperatures, the phase transition conclusion is consistent with the above analysis.
In addition to the study of Moire fringes, this work mainly demonstrates the following: (1) The splitting and growth of NPs reflect the shape changes; (2) Changes in oxygen content cause Deoxidation resulting in structural and compositional changes; (3) The phase change is mainly reflected by diffraction; (4) The relationship between position and non-synchronous reaction. The following sections will discuss the detailed analysis of these aspects in detail.
2.1.3. Morphology and Phase Evolution during Deoxidation
The splitting and growth of the samples were revealed, and phase transition was analyzed by diffraction patterns and HRTEM. The images in Figure 2b–g show the splitting and growth process for a MoO3 NP. As the temperature increases to 450 °C, the overall shape of the NP splits into small fragments of ~10 nanometers. As the temperature rises to 550 °C, the NP regrows into 50 nm (Figure 3j) like the original structure before heating. Figure 3i shows the overall morphology of the reaction of the ~50 nm NP (the splitting and growth trends are consistent whether the size of NPs is different). From the changes in Figure 3a–h, the Moire fringe analysis in Figure 2 is also applicable under 0.1 mbar, except that the reaction temperature changes due to air pressure, and the overall trend remains unchanged. The fracture analysis may be driven by temperature or caused by structural recombination after the loss of oxygen.
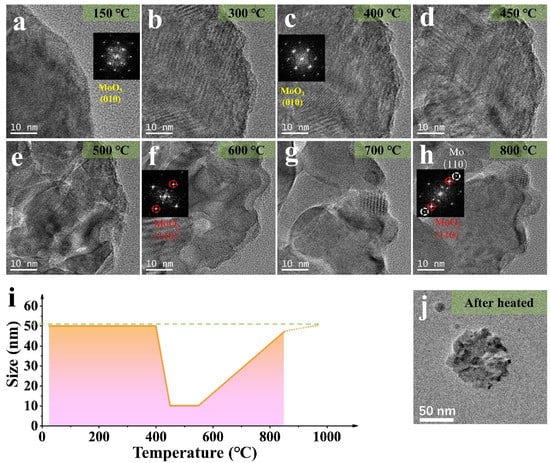
Figure 3.
(a–h) HRTEM images of the MoO3 NP (~50 nm) by heating in H2 (0.1 mbar) at different temperatures (in Figure 3a,c,f,h, the corresponding stable diffraction images and label are given respectively); (i) The size change of the NP in (a–h); (j) The TEM image of NP after heated in H2 (0.1 mbar).
The diffraction pattern at 400 °C, shows that the nanoparticle gradually changed into a mixed state of MoO3 and MoO2. When it reached 600 °C, MoO2 was present. At 800 °C, the presence of Mo simple substance could be confirmed, combined with the thermogravimetric experiment and the diffraction pattern analysis [29]. The Figure 3h and Figure S2 indicates the diffraction spots corresponding to MoO3, MoO2, and Mo materials, and Figure S3 proved the location of Mo by filtering analysis. The following comparative experiments were performed to discover whether the above changes are related to the H2 atmosphere or mainly dominated by temperature.
2.2. Compositional Evolution of MoO3
To verify the effect of the atmosphere on MoO3 NPs size change, in situ control experiments with heating from 25 °C to 900 °C were performed in a vacuum (Figure 4).
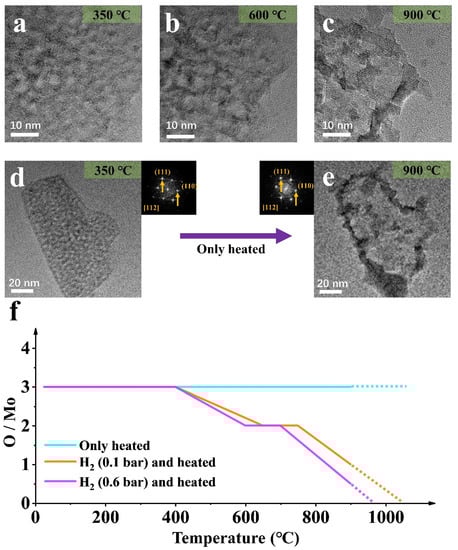
Figure 4.
(a–e) TEM images of the MoO3 NP by only heating at different temperatures (in (d,e), the corresponding stable diffraction images and label are given respectively); (f) The element scale diagram changes of the NP in (a–e) at different temperatures.
2.2.1. Non-Deoxidation Sublimation of MoO3
Firstly, simultaneous splitting behavior and a large amount of sublimation occurred [30,31], and the molybdenum oxide sample sublimated at 600 °C. However, the splitting is irreversible, unlike the deoxidation process under hydrogen atmospheres. In addition, the diffraction pattern does not change, proving that the orthonormal MoO3 is stable, and no deoxidation and phase transformation has taken place. However, sublimation greatly reduces the quality of the nanoparticle. Therefore, the splitting of the nanoparticle is directly related to temperature. To the contrary, phase transition and regrowth are mainly caused by hydrogen-induced deoxidation, which is expected by the controlled experimental design.
2.2.2. Composition Changes under Different Conditions
Combined with the analyses in Figure 2, Figure 3 and Figure 4, statistical analysis on the element proportion in sample evolution under the three conditions was conducts, as shown in Figure 4f. Hydrogen is the leading cause of deoxidation, and temperature is the condition to promote the reaction. Furthermore, a difference in air pressure will cause a change in the temperature at which the reaction occurs.
2.3. Evolution and Characterization of the Position
Figure 5 shows the structure, phase, and composition related to location evolution. Figure 5a is the TEM analysis of MoO3 NPs in the deoxidation process, and Figure 5b–g is the EELS mapping evolution in the red rectangular area at different temperatures. The EELS mapping gives a visual representation of the elemental processes, where the evolution of the oxygen content is evident, confirming the different oxidation states at different temperatures during the deoxygenation process. However, this process is accompanied by sublimation, as seen from the Mo region reduction, although the sublimation process under hydrogen is weak for pure heating (Figure 4).
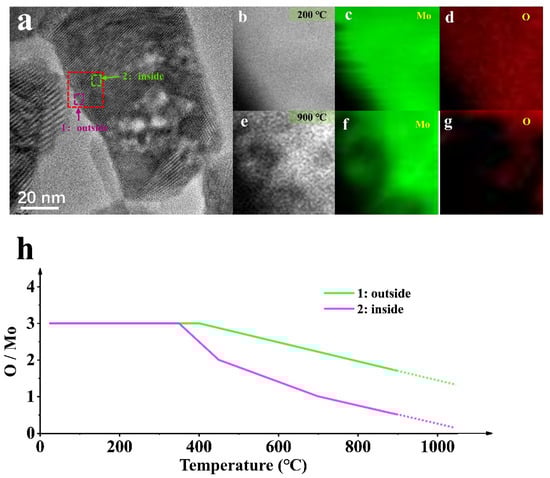
Figure 5.
(a) HRTEM images of the MoO3 NP by heating in H2 (0.6 mbar); (b–d) The EELS mapping of NP representing the location of the red dotted line in (a) at 200 °C; (e–g) The EELS mapping of NP representing the location of the red dotted line in (a) at 900 °C; (h) The element scale diagram changes of the NP in (a) at different temperatures.
Different phenomena will occur at different locations for the deoxidation reaction sample under the same conditions. The deoxidation processes at the edge (position 1) and inside (position 2) of the sample are asynchronous, where the deoxidation in the interior is much slower than that in the edge, shown by the EELS Mapping. In Figure 5, the deoxidation process at position 1 is performed rapidly compared with that at position 2. The reaction is violent because the edge is exposed first to theH2 atmosphere, and its thickness is relatively thin. The contact zone affects the internal deoxidation process and is related to the complex phase transition and mechanical structure changes. Notably, the deoxidation site is associated with the active site of the catalytic process [11], which needs to be further explored.
3. Discussion
The H2 pressure impacts the temperature at which the morphology changes, reflected by the splitting and growth of NPs, take place, as shown in Figure 2 and Figure 3 under different air pressures. This agrees well with the result of other studies [32]. The structure and composition changes caused by the oxygen content induced by the deoxidation were mainly analyzed by EELS. Temperature causes sublimation and splitting behavior. H2 atmosphere is the main factor determining the deoxidation conditions and the driving force of subsequent growth. When the reaction is at the nanometer scale, subtle position changes will also bring different reaction conditions, such as different deoxidation phenomena occurring at different positions with an area of a few nanometers. This behavior cannot be noticed in the macroscopic experiment, even if other means of exploration cannot directly explore the local phenomenon. The study of active sites is also an important aspect of catalytic reaction. In situ TEM could continue a complete experiment for MoC/MoO3 catalysts using methane reforming [33]. The detailed analysis of these aspects, which we will study in future research, is very important for studying the active sites of catalysts. The real-time information brought by in situ electron microscopy allows us to observe the direction of sample evolution in real-time during the experiment and directly corresponds to the nano-scale visual images to explain the structure-activity relationship.
4. Conclusions
In this work, in situ environmental TEM was used to reveal the deoxidation process of MoO3 at atomic scale in terms of structure and composition. The results show the sample underwent a deoxidation process with the increase of temperature in the H2 atmosphere. While in the absence of H2, MoO3 underwent sublimation only. In addition, it is also found that the H2 atmosphere in difference pressure leads to different deoxidation and phase transformation rates, suggesting that H2 is the main inducing condition for deoxidation. Besides, the deoxidation process is different at different locations of the same NPs; the edges tend to show more active reactions than the inside of the sample. The results have significant guidance for understanding the evolution process of molybdenum base materials and the relationship between the properties and structure of materials. The local evolution of samples is explored from a broader perspective, which provides a reliable experimental means for the future study of gas-solid catalysis, especially catalyst behavior.
Supplementary Materials
The following are available online at https://www.mdpi.com/article/10.3390/ma15010056/s1. Figure S1. XRD patterns of MoO3 nanosheets. Figure S2. Diffraction calibration of the sample in Figure 3 at 800 °C; Figure S3. Filtering analysis of the sample in Figure 3 at 800 °C.
Author Contributions
All authors contributed to the conceptualization and the methodology of this article, P.M., A.L., L.W. and K.Z.; writing—original draft preparation, P.M.; writing—review and editing, P.M., A.L. and K.Z. All authors have read and agreed to the published version of the manuscript.
Funding
This research received no external funding.
Institutional Review Board Statement
Not applicable.
Informed Consent Statement
Not applicable.
Data Availability Statement
No new data were created of analyzed in this study. Data sharing is not applicable to this article.
Acknowledgments
This work was supported by National Natural Science Foundation of China (11774016); Natural Science Foundation of Beijing Municipality (Z180014); Beijing Outstanding Young Scientists Projects (BJJWZYJH01201910005018).
Conflicts of Interest
The authors declare no conflict of interest.
References
- Li, X.; Wang, Y.; Wang, J.; Da, Y.; Zhang, J.; Li, L.; Zhong, C.; Deng, Y.; Han, X.; Hu, W. Sequential Electrodeposition of Bifunctional Catalytically Active Structures in MoO3 /Ni-NiO Composite Electrocatalysts for Selective Hydrogen and Oxygen Evolution. Adv. Mater. 2020, 3, 2003414. [Google Scholar] [CrossRef]
- Ma, Y.; Ren, Y.; Zhou, Y.; Liu, W.; Baaziz, W.; Ersen, O.; Pham-Huu, C.; Greiner, M.; Chu, W.; Wang, A.; et al. High-Density and Thermally Stable Palladium Single-Atom Catalysts for Chemoselective Hydrogenations. Angew. Chem. Int. Ed. Engl. 2020, 5, 21613–21619. [Google Scholar] [CrossRef]
- Yao, S.; Zhang, X.; Zhou, W.; Gao, R.; Xu, W.; Ye, Y.; Lin, L.; Wen, X.; Liu, P.; Chen, B.; et al. Atomic-layered Au clusters on a-MoC as catalysts for the low-temperature water-gas shift reaction. Science 2017, 357, 389–393. [Google Scholar] [CrossRef] [Green Version]
- Lin, L.; Zhou, W.; Gao, R.; Yao, I.; Zhang, I.; Xu, W.; Zheng, S.; Jiang, Z.; Yu, Q.; Li, Y.-W.; et al. Low-temperature hydrogen production from water and methanol using Pt/α-MoC catalysts. Nature 2017, 544, 80–83. [Google Scholar] [CrossRef]
- Ma, Y.; Guan, G.; Hao, X.; Cao, J.; Abudula, A. Molybdenum carbide as alternative catalyst for hydrogen production—A review. Renew. Sustain. Energy Rev. 2017, 75, 1101–1129. [Google Scholar] [CrossRef]
- Deng, Y.; Gao, R.; Lin, L.; Liu, T.; Wen, X.D.; Wang, S.; Ma, D. Solvent tunes the selectivity of hydrogenation reaction over alpha-MoC catalyst. J. Am. Chem. Soc. 2018, 14, 14481–14489. [Google Scholar] [CrossRef]
- Baddour, F.G.; Roberts, E.J.; To, A.T.; Wang, L.; Habas, S.E.; Ruddy, D.A.; Bedford, N.M.; Wright, J.; Nash, C.P.; Schaidle, J.A.; et al. An exceptionally mild and scalable solution-phase synthesis of molybdenum carbide nanoparticles for thermocatalytic CO2 hydrogenation. J. Am. Chem. Soc. 2020, 14, 1010–1019. [Google Scholar] [CrossRef]
- Dong, J.; Fu, Q.; Jiang, Z.; Mei, B.; Bao, X. Carbide-supported Au catalysts for water-gas shift reactions: A new territory for the Strong metal-support interaction effect. J. Am. Chem. Soc. 2018, 14, 13808–13816. [Google Scholar] [CrossRef]
- Cetinkaya, S.; Eroglu, S. Thermodynamic analysis and synthesis of porous Mo2C sponge by vapor-phase condensation and in situ carburization of MoO3. J. Alloys Compd. 2010, 48, 36–41. [Google Scholar] [CrossRef]
- Guzmán, H.J.; Xu, W.; Stacchiola, D.; Vitale, G.; Scott, C.E.; Rodríguez, J.A.; Pereira-Almao, P. Formation of β-Mo2C below 600 °C using MoO2 nanoparticles as precursor. J. Catal. 2015, 332, 83–94. [Google Scholar] [CrossRef] [Green Version]
- Huang, X.; Wang, J.; Bing Tao, H.; Tian, H.; Zhang, Z.; Xu, H. Unraveling the oxide layer on Mo2C as the active center for hydrogen evolution reaction. J. Catal. 2020, 389, 461–467. [Google Scholar] [CrossRef]
- Xie, W.; Su, M.; Zheng, Z.; Wang, Y.; Gong, L.; Xie, F.; Zhang, W.; Luo, Z.; Luo, J.; Liu, P.; et al. Nanoscale insights into the hydrogenation process of layered alpha-MoO3. ACS Nano 2016, 1, 1662–1670. [Google Scholar] [CrossRef]
- Wu, Z.; Liu, X.; Wang, D. Synthesis of high-performance Mo–La2O3 powder by hydrogen reduction of MoO2 originated from a self-reduction strategy. Mater. Res. Express. 2019, 6, 126586. [Google Scholar] [CrossRef]
- He, B.; Zhang, Y.; Liu, X.; Chen, L. In-situ Transmission Electron Microscope Techniques for Heterogeneous Catalysis. ChemCatChem 2020, 1, 1853–1872. [Google Scholar] [CrossRef]
- Yuan, W.; Zhu, B.; Li, X.-Y.; Hansen, T.W.; Ou, Y.; Fang, K.; Yang, H.; Zhang, Z.; Wagner, J.B.; Gao, Y.; et al. Visualizing H2O molecules reacting at TiO2 active sites with transmission electron microscopy. Science 2020, 36, 428–430. [Google Scholar] [CrossRef]
- Hanson, E.D.; Lajaunie, L.; Hao, S.; Myers, B.D.; Shi, F.; Murthy, A.A.; Wolverton, C.; Arenal, R.; Dravid, V.P. Systematic study of oxygen vacancy tunable transport properties of few-layer MoO3−x enabled by vapor-based synthesis. Adv. Funct. Mater. 2017, 2, 1605380. [Google Scholar] [CrossRef] [Green Version]
- Ledentu, V.; Dong, W.; Sautet, P. Heterogeneous catalysis through subsurface sites. J. Am. Chem. Soc. 2020, 122, 1796–1801. [Google Scholar] [CrossRef]
- Song, Z.; Xie, Z.H. A literature review of in situ transmission electron microscopy technique in corrosion studies. Micron 2018, 112, 69–83. [Google Scholar] [CrossRef]
- Yuan, W.; Zhu, B.; Fang, K.; Li, X.-Y.; Hansen, T.W.; Ou, Y.; Yang, H.; Wagner, J.B.; Gao, Y.; Wang, Y.; et al. In situ manipulation of the active Au-TiO2 interface with atomic precision during CO oxidation. Science 2021, 37, 517–521. [Google Scholar] [CrossRef]
- Jiang, Y.; Zhang, Z.; Yuan, W.; Zhang, X.; Wang, Y.; Zhang, Z. Recent advances in gas-involved in situ studies via transmission electron microscopy. Nano Res. 2017, 1, 42–67. [Google Scholar] [CrossRef]
- Carpena-Núñez, J.; Rao, R.; Kim, D.; Bets, K.V.; Zakharov, D.N.; Boscoboinik, J.A.; Stach, E.A.; Yakobson, B.I.; Tsapatsis, M.; Stacchiola, D.; et al. Zeolite Nanosheets Stabilize Catalyst Particles to Promote the Growth of Thermodynamically Unfavorable, Small-Diameter Carbon Nanotubes. Small 2020, 16, 1. [Google Scholar] [CrossRef]
- Zhai, Y.; Chen, Y.; Zhao, Y.; Long, H.; Li, X.; Deng, Q.; Lu, H.; Yang, X.; Yang, G.; Li, W.; et al. Initial oxidation of Ni-based superalloy and its dynamic microscopic mechanisms: The interface junction initiated outwards oxidation. Acta Mater. 2021, 215, 116991. [Google Scholar] [CrossRef]
- Chenna, S.; Banerjee, R.; Crozier, P.A. Atomic-Scale Observation of the Ni Activation Process for Partial Oxidation of Methane Using In Situ Environmental TEM. ChemCatChem 2011, 3, 1051–1059. [Google Scholar] [CrossRef]
- Ding, J.; Wang, L.; Wu, P.; Li, A.; Li, W.; Stampfl, C.; Liao, X.; Haynes, B.S.; Han, X.; Huang, J. Confined Ru Nanocatalysts on Surface to Enhance Ammonia Synthesis: An In situ ETEM Study. ChemCatChem 2020, 1, 534–538. [Google Scholar] [CrossRef]
- Ma, Z.; Sheng, L.; Wang, X.; Yuan, W.; Chen, S.; Xue, W.; Han, G.; Zhang, Z.; Yang, H.; Lu, Y.; et al. Oxide catalysts with ultrastrong resistance to SO2 deactivation for removing nitric oxide at low temperature. Adv. Mater. 2019, 3, 1903719. [Google Scholar] [CrossRef]
- Tao, F.F.; Crozier, P.A. Atomic-Scale Observations of Catalyst Structures under Reaction Conditions and during Catalysis. Chem. Rev. 2016, 11, 3487–3539. [Google Scholar] [CrossRef]
- Qu, X.; He, Y.; Qu, M.; Ruan, T.; Chu, F.; Zheng, Z.; Ma, Y.; Chen, Y.; Ru, X.; Xu, X.; et al. Identification of embedded nanotwins at c-Si/a-Si:H interface limiting the performance of high-efficiency silicon heterojunction solar cells. Nat. Energy 2021, 6, 194–202. [Google Scholar] [CrossRef]
- Zhang, X.; Zhang, M.; Deng, Y.; Xu, M.; Artiglia, L.; Wen, W.; Gao, R.; Chen, B.; Yao, S.; Zhang, X.; et al. A stable low-temperature H2-production catalyst by crowding Pt on alpha-MoC. Nature 2021, 58, 396–401. [Google Scholar] [CrossRef]
- Ku, J.-G.; Oh, J.-M.; Kwon, H.; Lim, J.-W. High-temperature hydrogen-reduction process for the preparation of low-oxygen Mo powder from MoO3. Int. J. Hydrogen Energy 2017, 4, 2139–2143. [Google Scholar] [CrossRef]
- Atuchin, V.V.; Gavrilova, T.A.; Grigorieva, T.I.; Kuratieva, N.V.; Okotrub, K.A.; Pervukhina, N.V.; Surovtsev, N.V. Sublimation growth and vibrational microspectrometry of α-MoO3 single crystals. J. Cryst. Growth 2011, 31, 987–990. [Google Scholar] [CrossRef]
- Wang, L.; Zhang, G.-H.; Sun, Y.-J.; Zhou, X.-W.; Chou, K.-C. Preparation of ultrafine β-MoO3 from industrial grade MoO3 powder by the method of sublimation. J. Phys. Chem. C 2016, 12, 19821–19829. [Google Scholar] [CrossRef]
- Hanif, A.; Xiao, T.; York, A.P.E.; Sloan, J.; Green, M.L.H. Study on the structure and formation mechanism of molybdenum carbides. Chem. Mater. 2002, 14, 1009–1015. [Google Scholar] [CrossRef]
- Xiao, T.; York, A.P.E.; Coleman, K.S.; Claridge, J.B.; Sloan, J.; Charnock, J.; Green, M.L.H. Effect of carburising agent on the structure of molybdenum carbides. J. Mater. Chem. 2001, 1, 3094–3098. [Google Scholar] [CrossRef]
Publisher’s Note: MDPI stays neutral with regard to jurisdictional claims in published maps and institutional affiliations. |
© 2021 by the authors. Licensee MDPI, Basel, Switzerland. This article is an open access article distributed under the terms and conditions of the Creative Commons Attribution (CC BY) license (https://creativecommons.org/licenses/by/4.0/).