
Experimental Study of Slag Changes during the Very Early Stages of Its Alkaline Activation

 , , ,
, , ,  , , and
Abstract
:1. Introduction
2. Materials and Methods
2.1. Materials and Mixing Procedure
2.2. Paste Characterization
2.3. Isolation of the Pore Solution and Its Characterization
2.4. Isolation of the Solids from the Pastes
Analyses of the Solid Phase
3. Results and Discussion
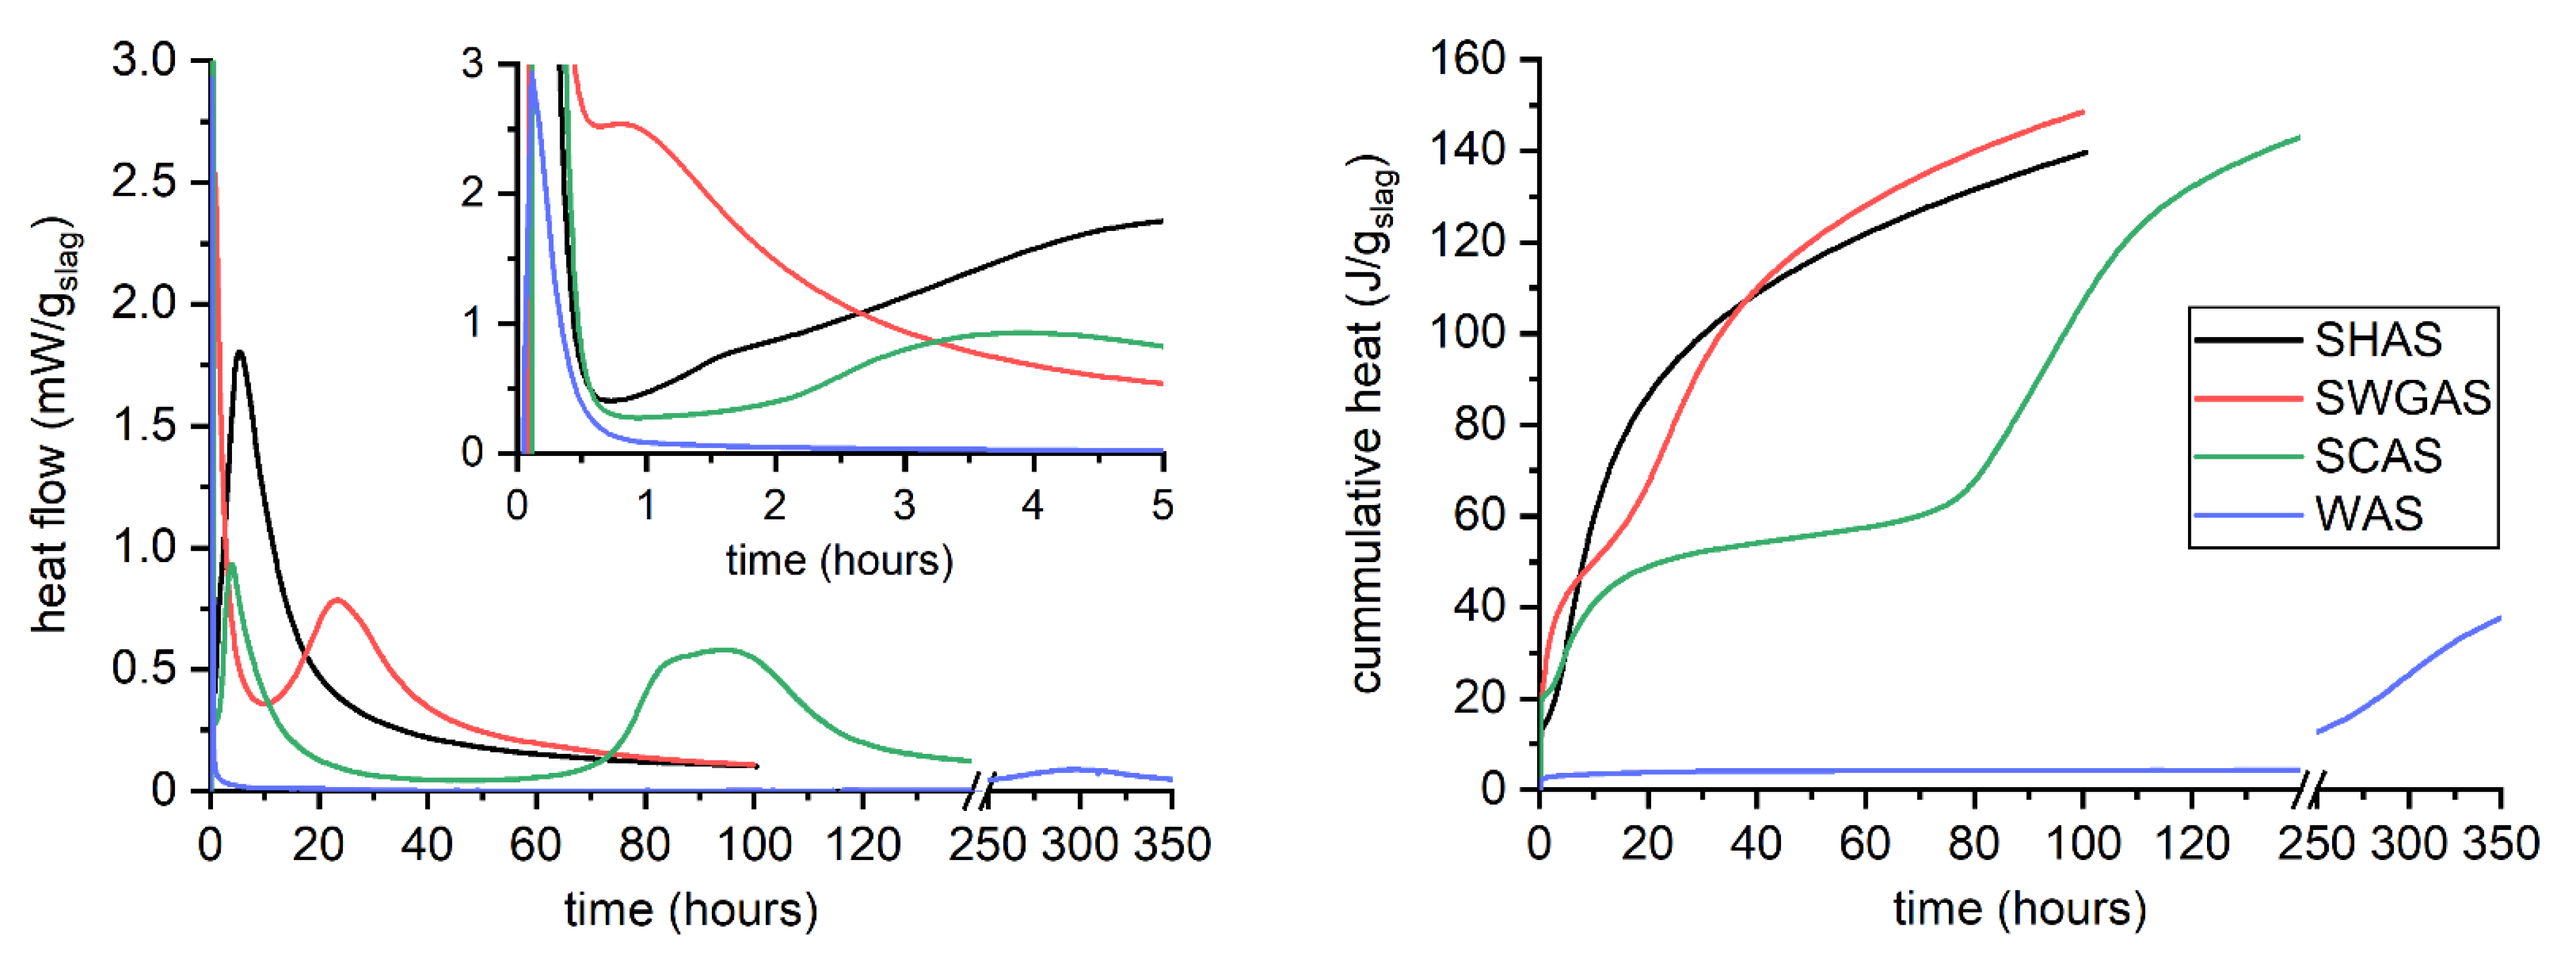
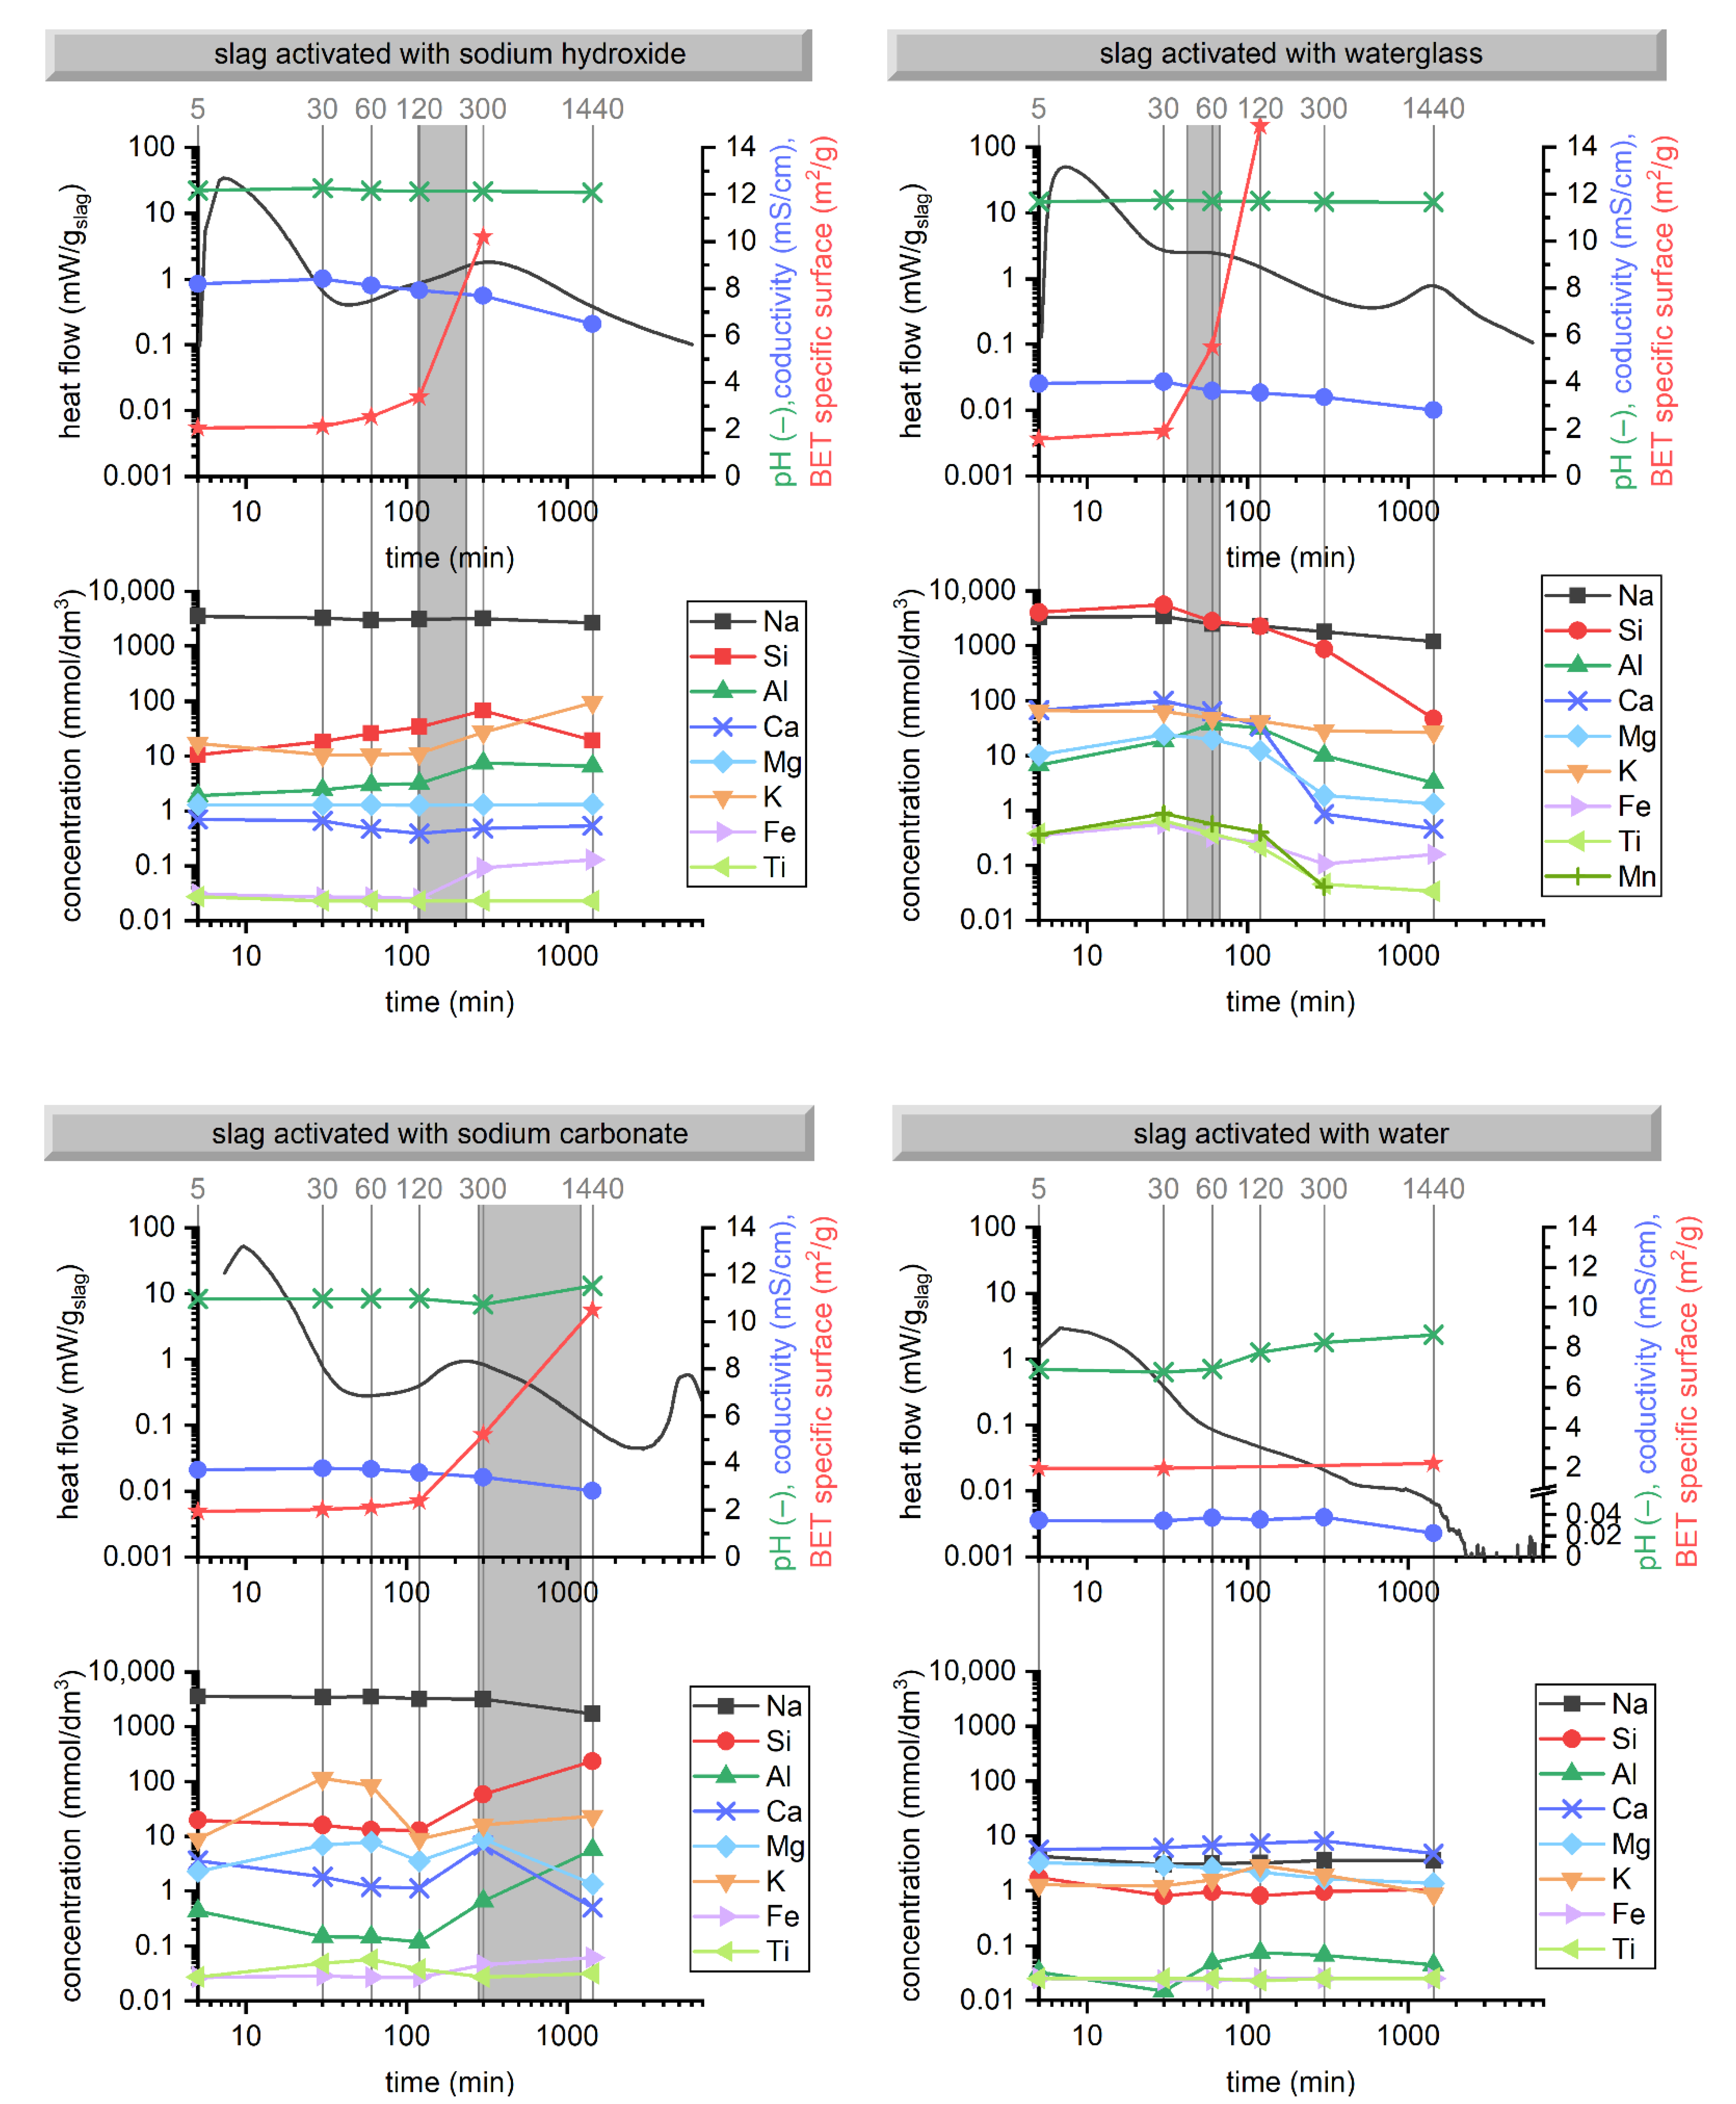
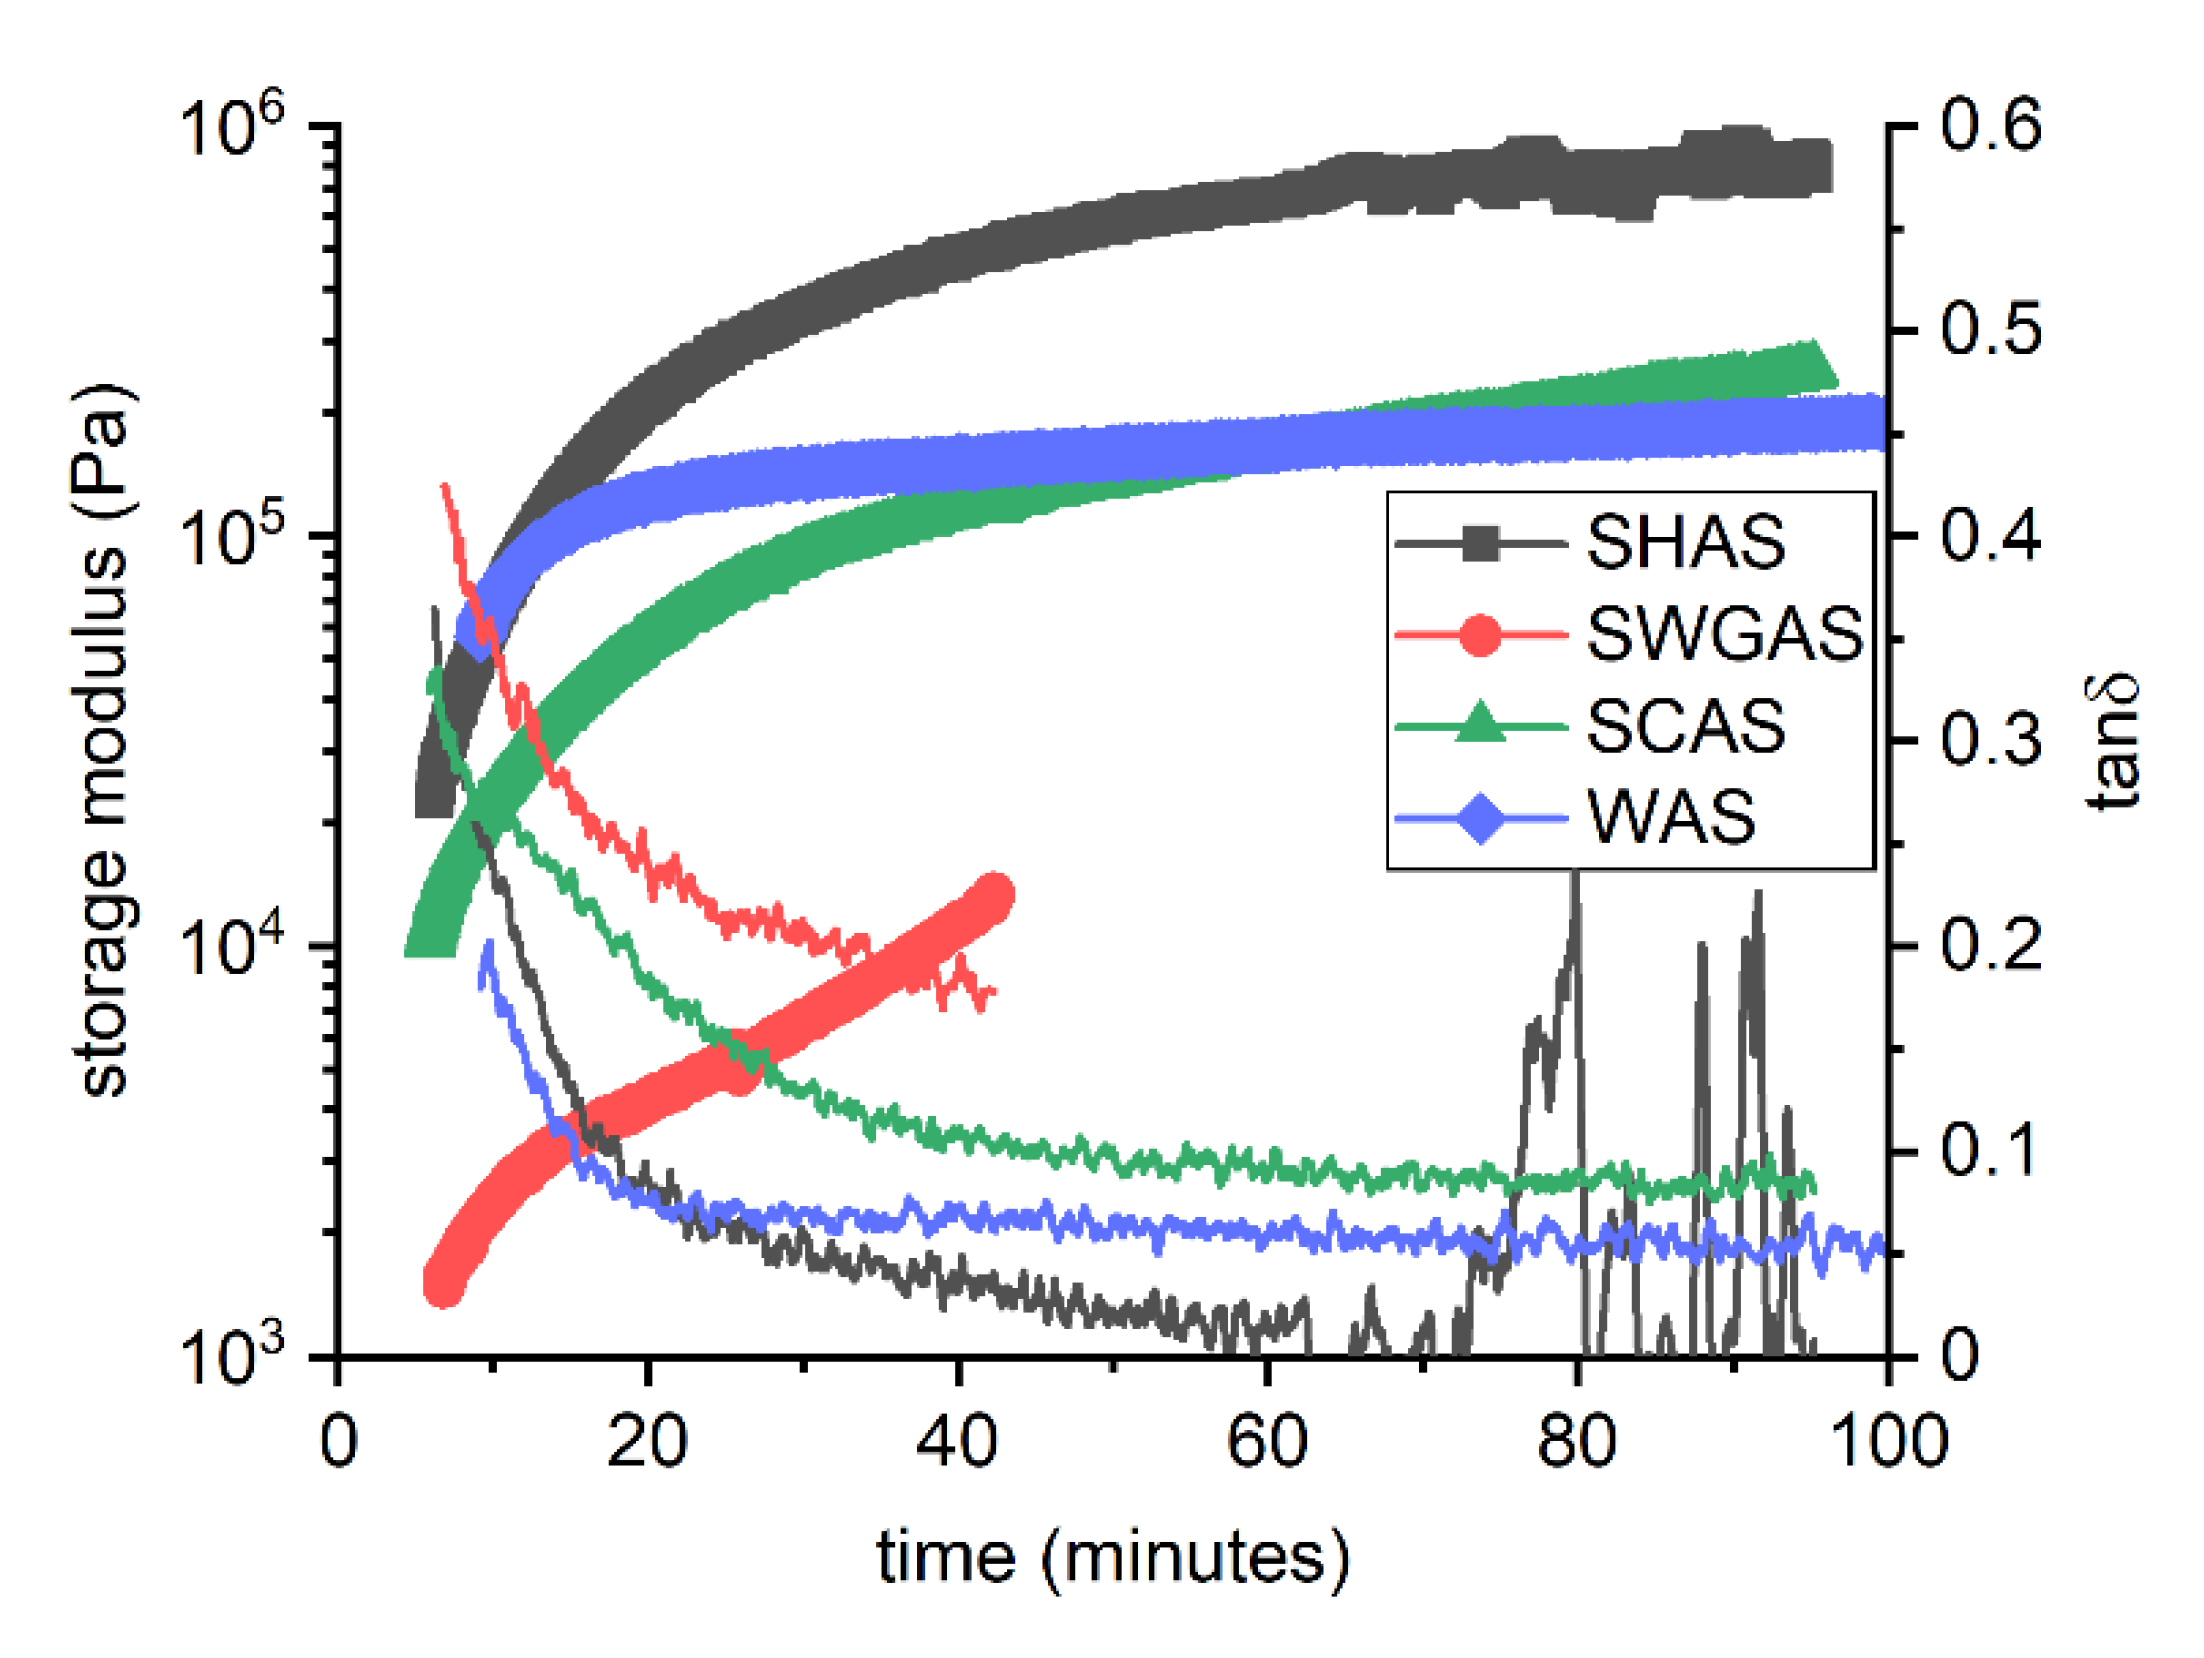
3.1. Hydration Kinetics
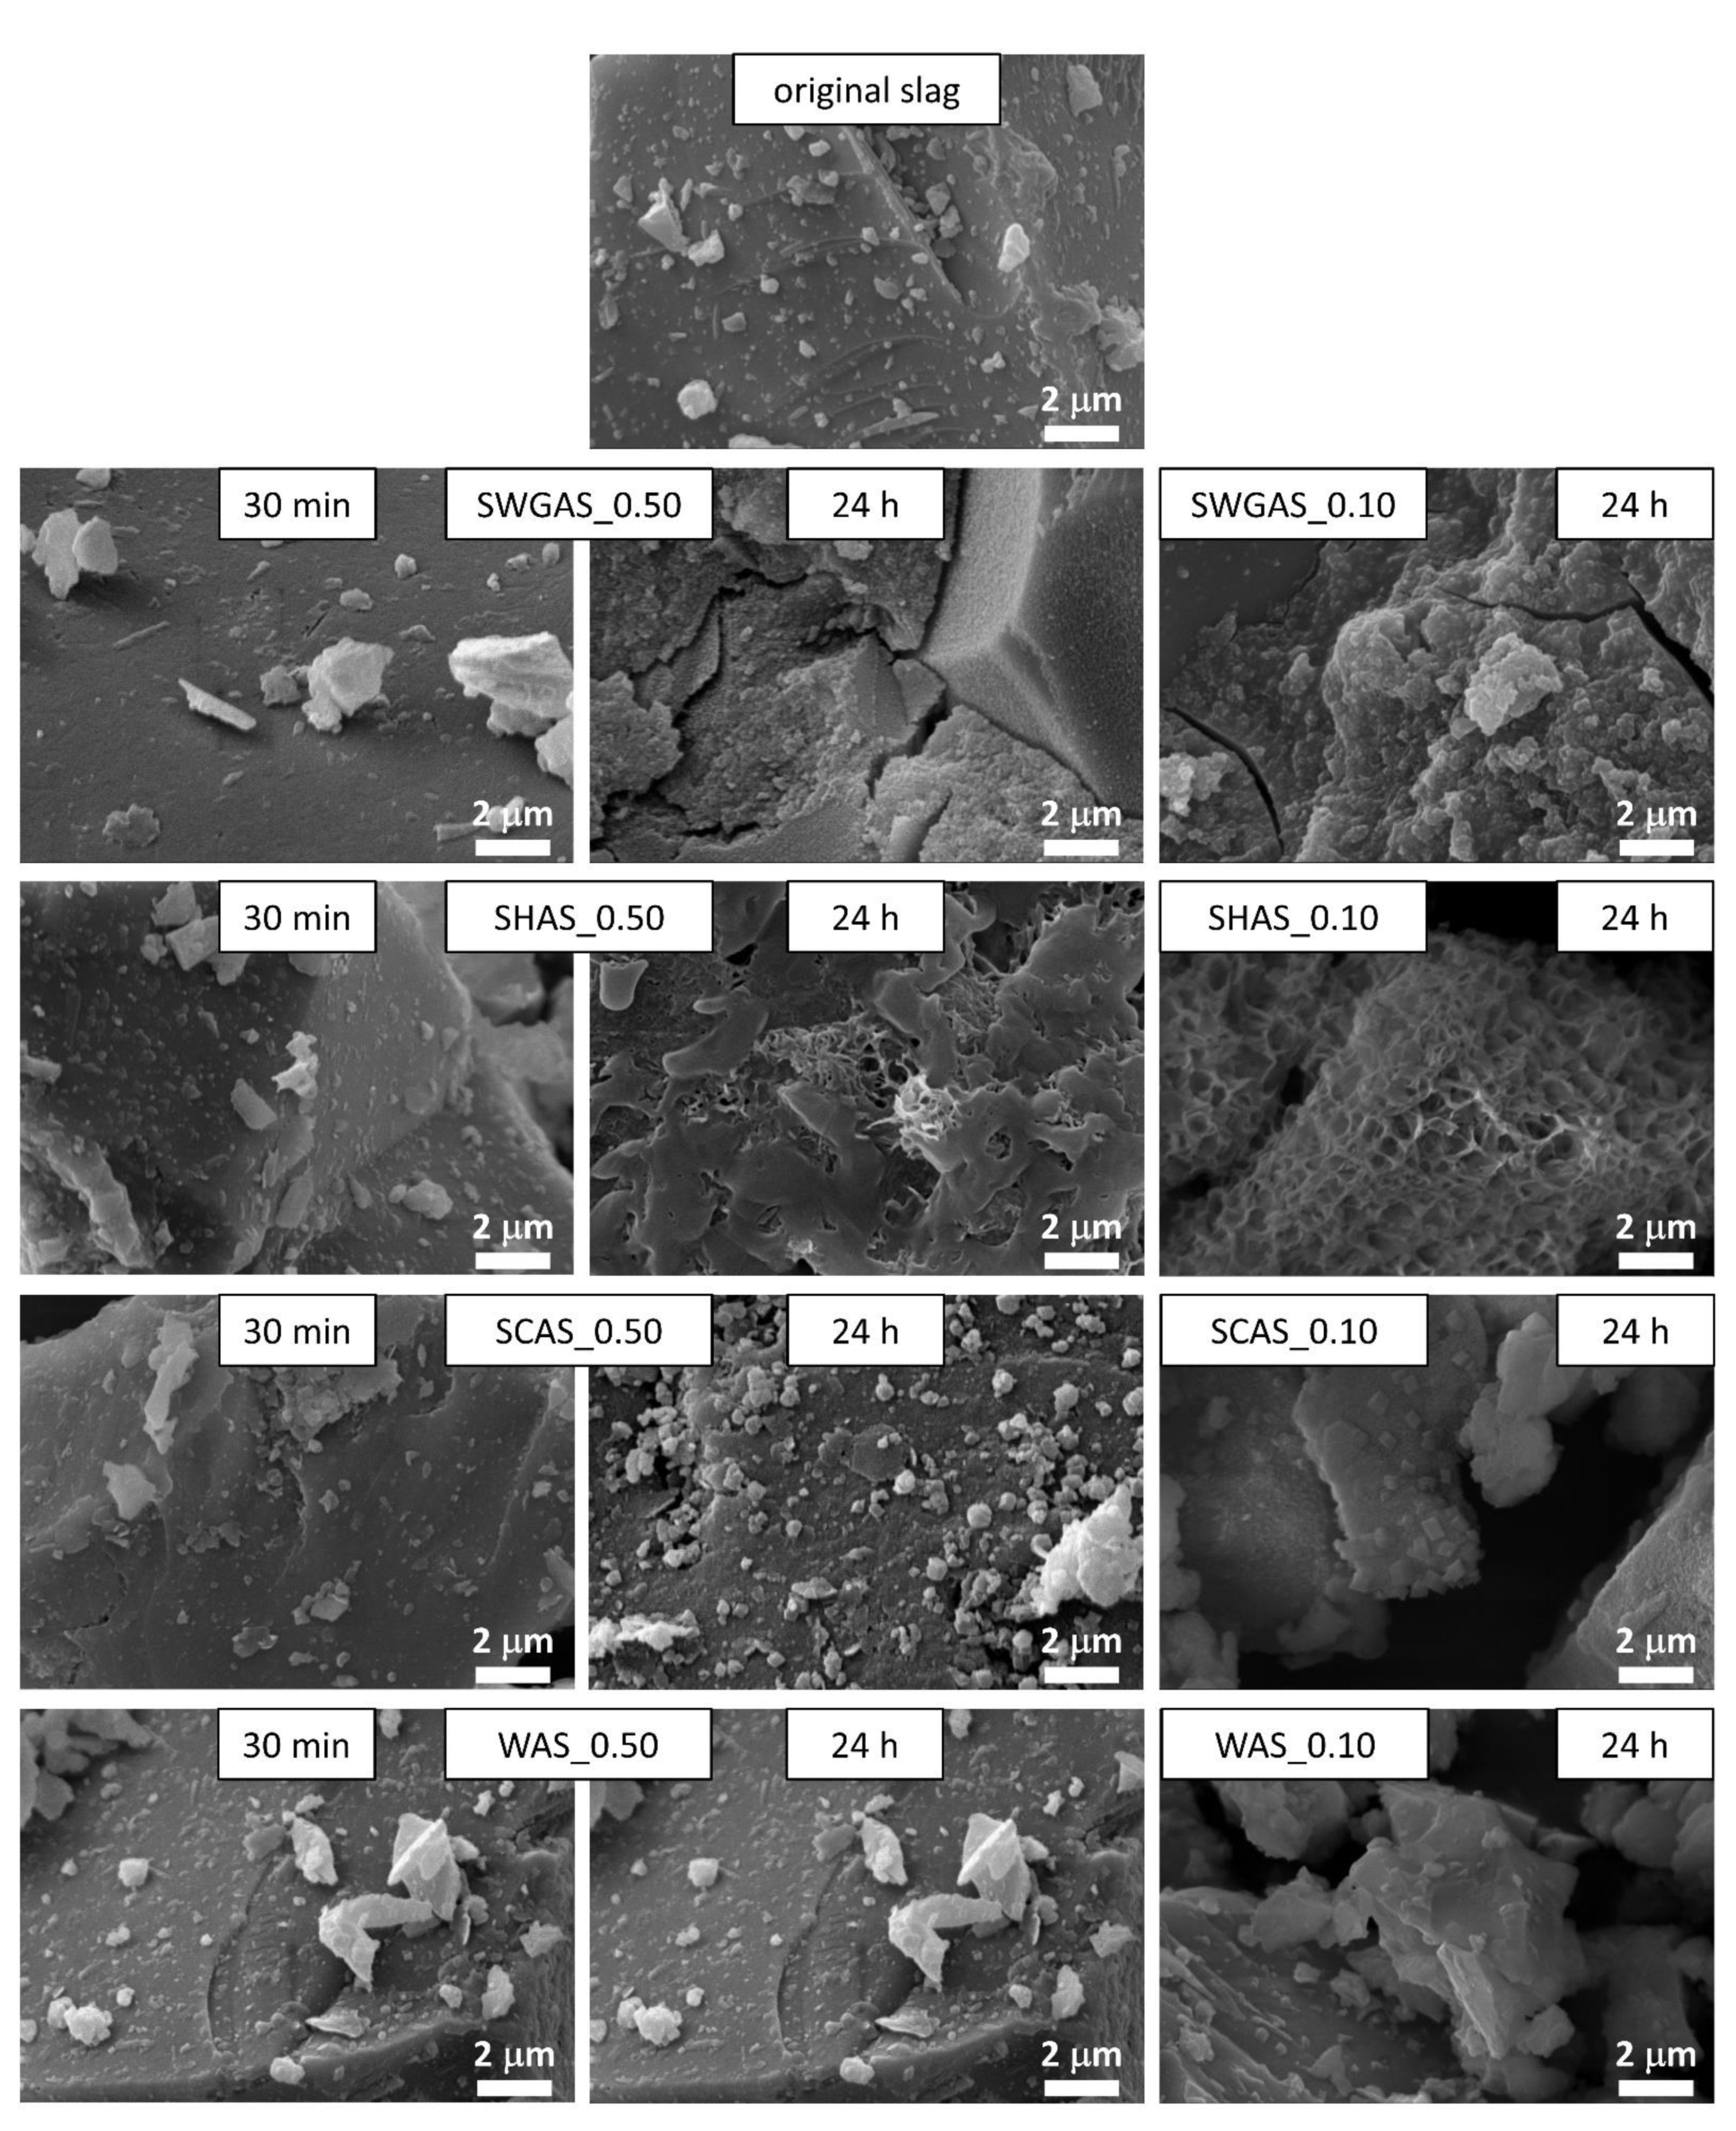
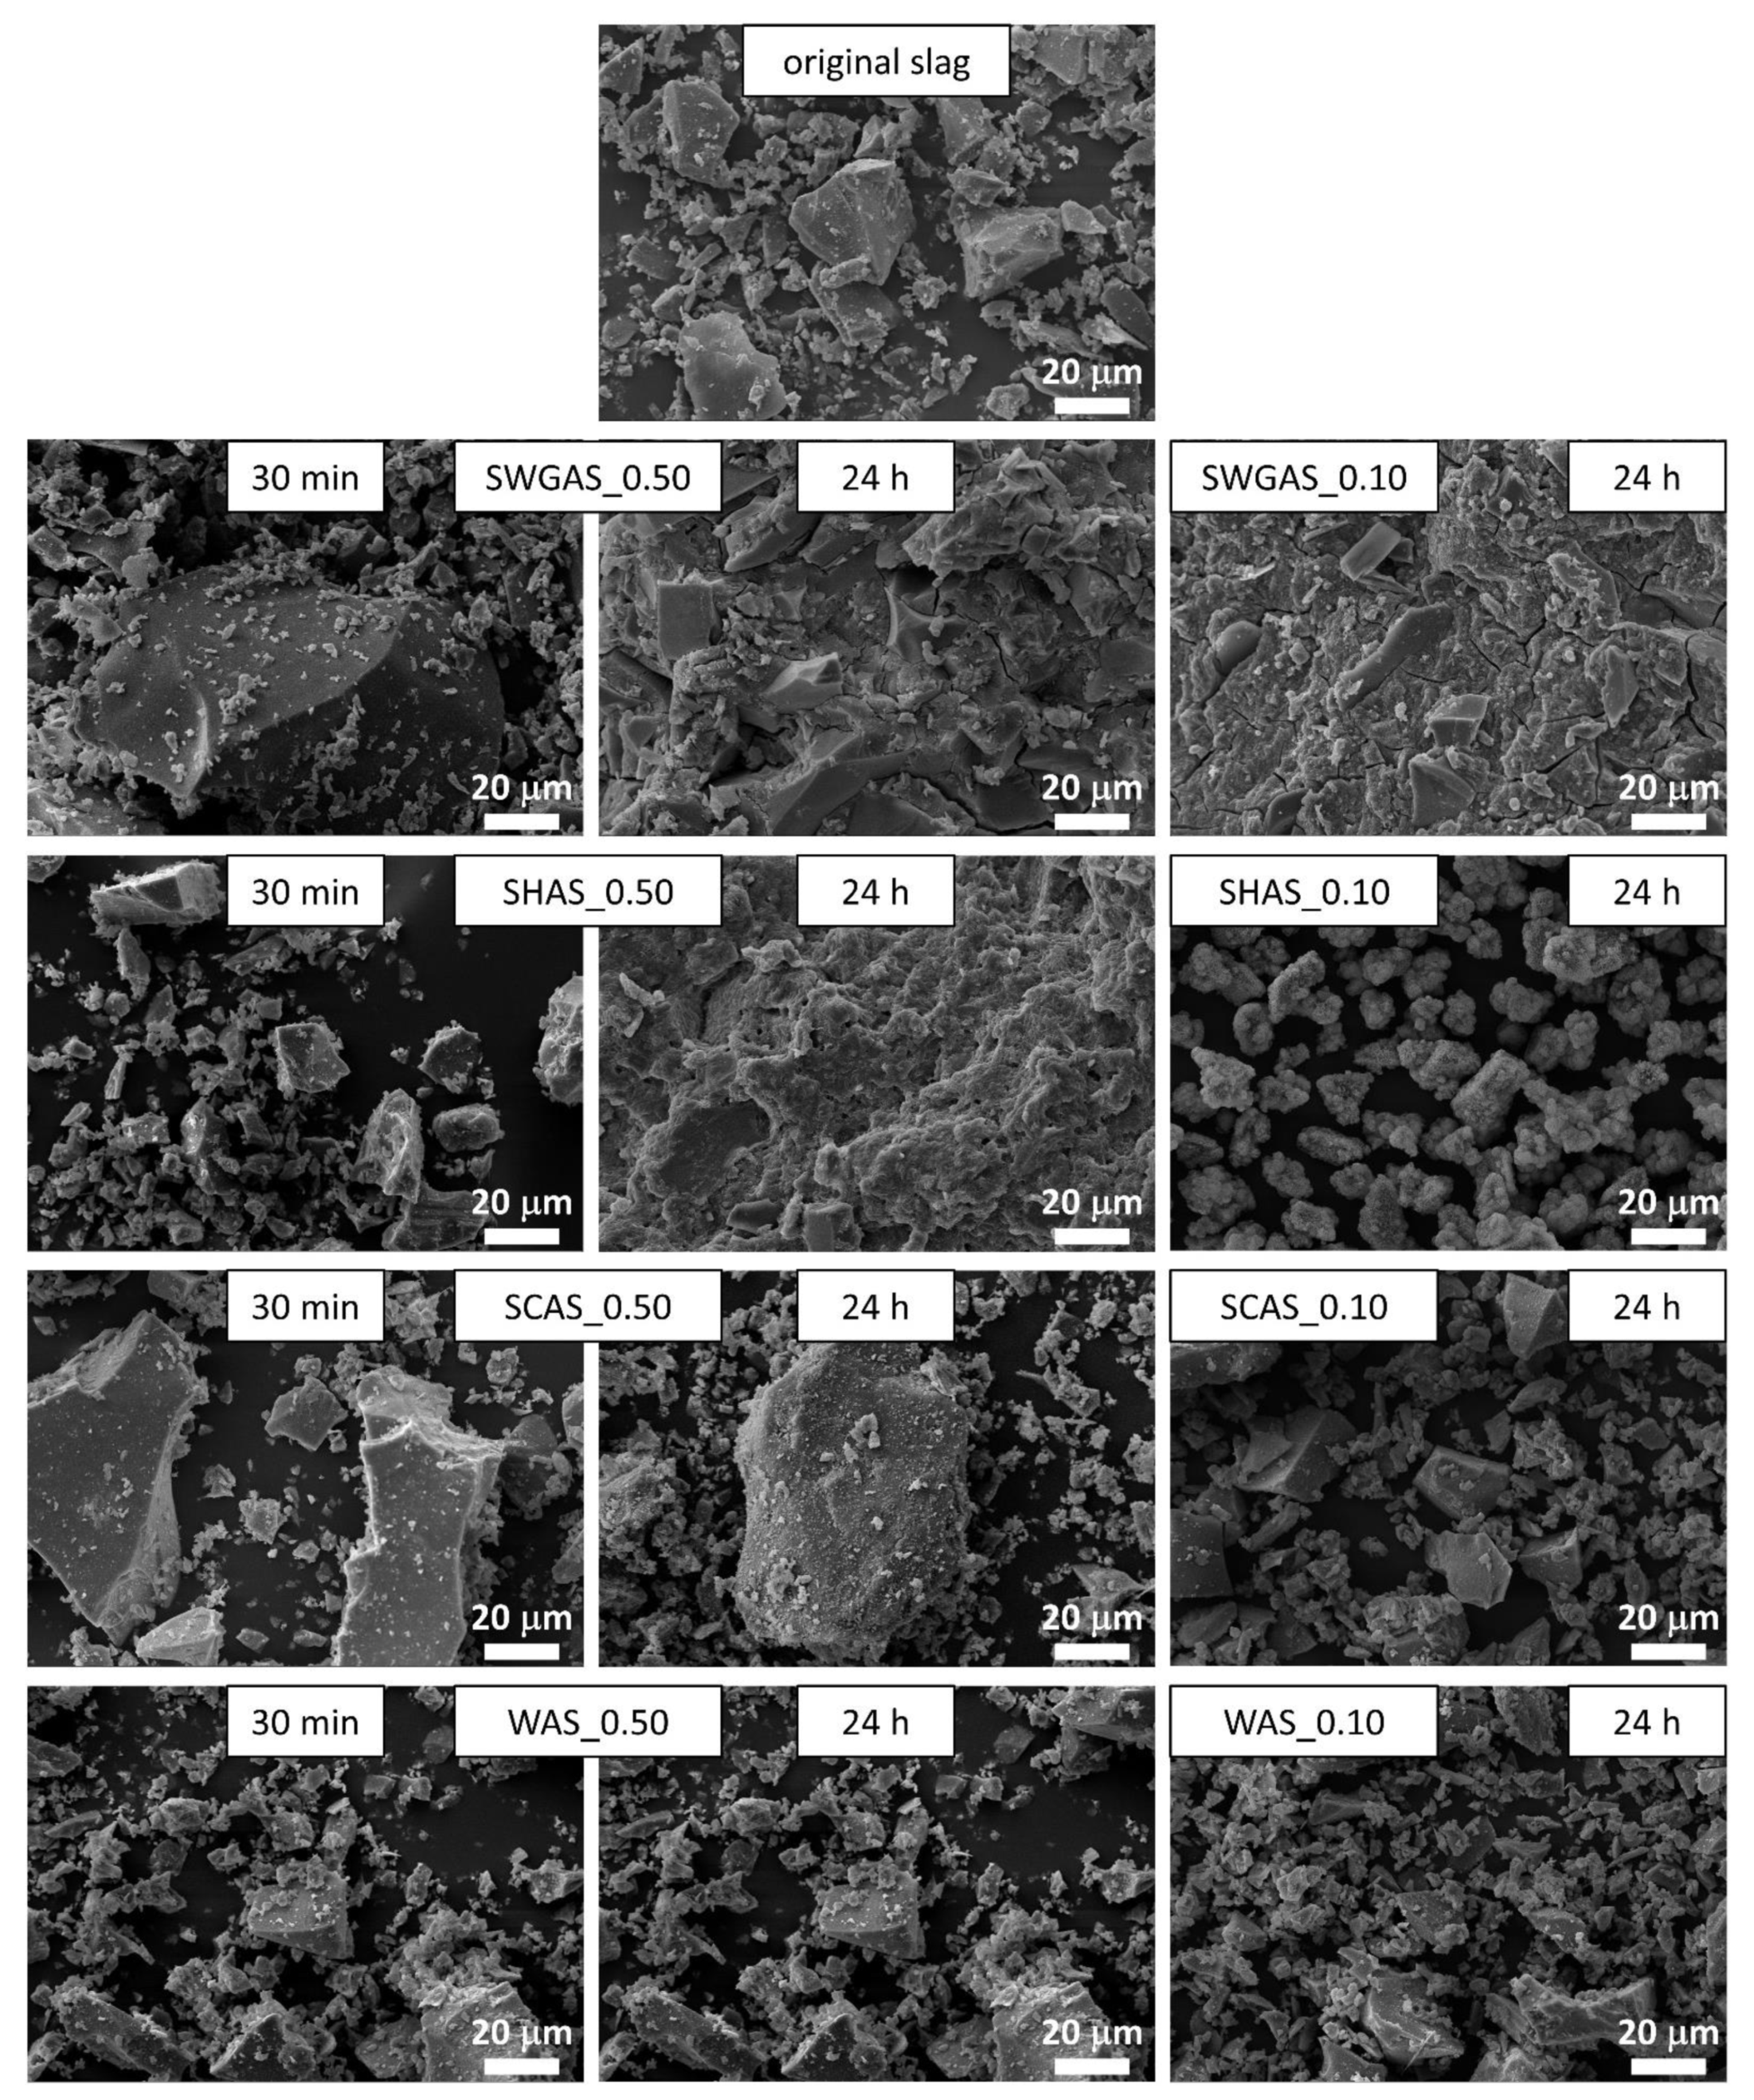
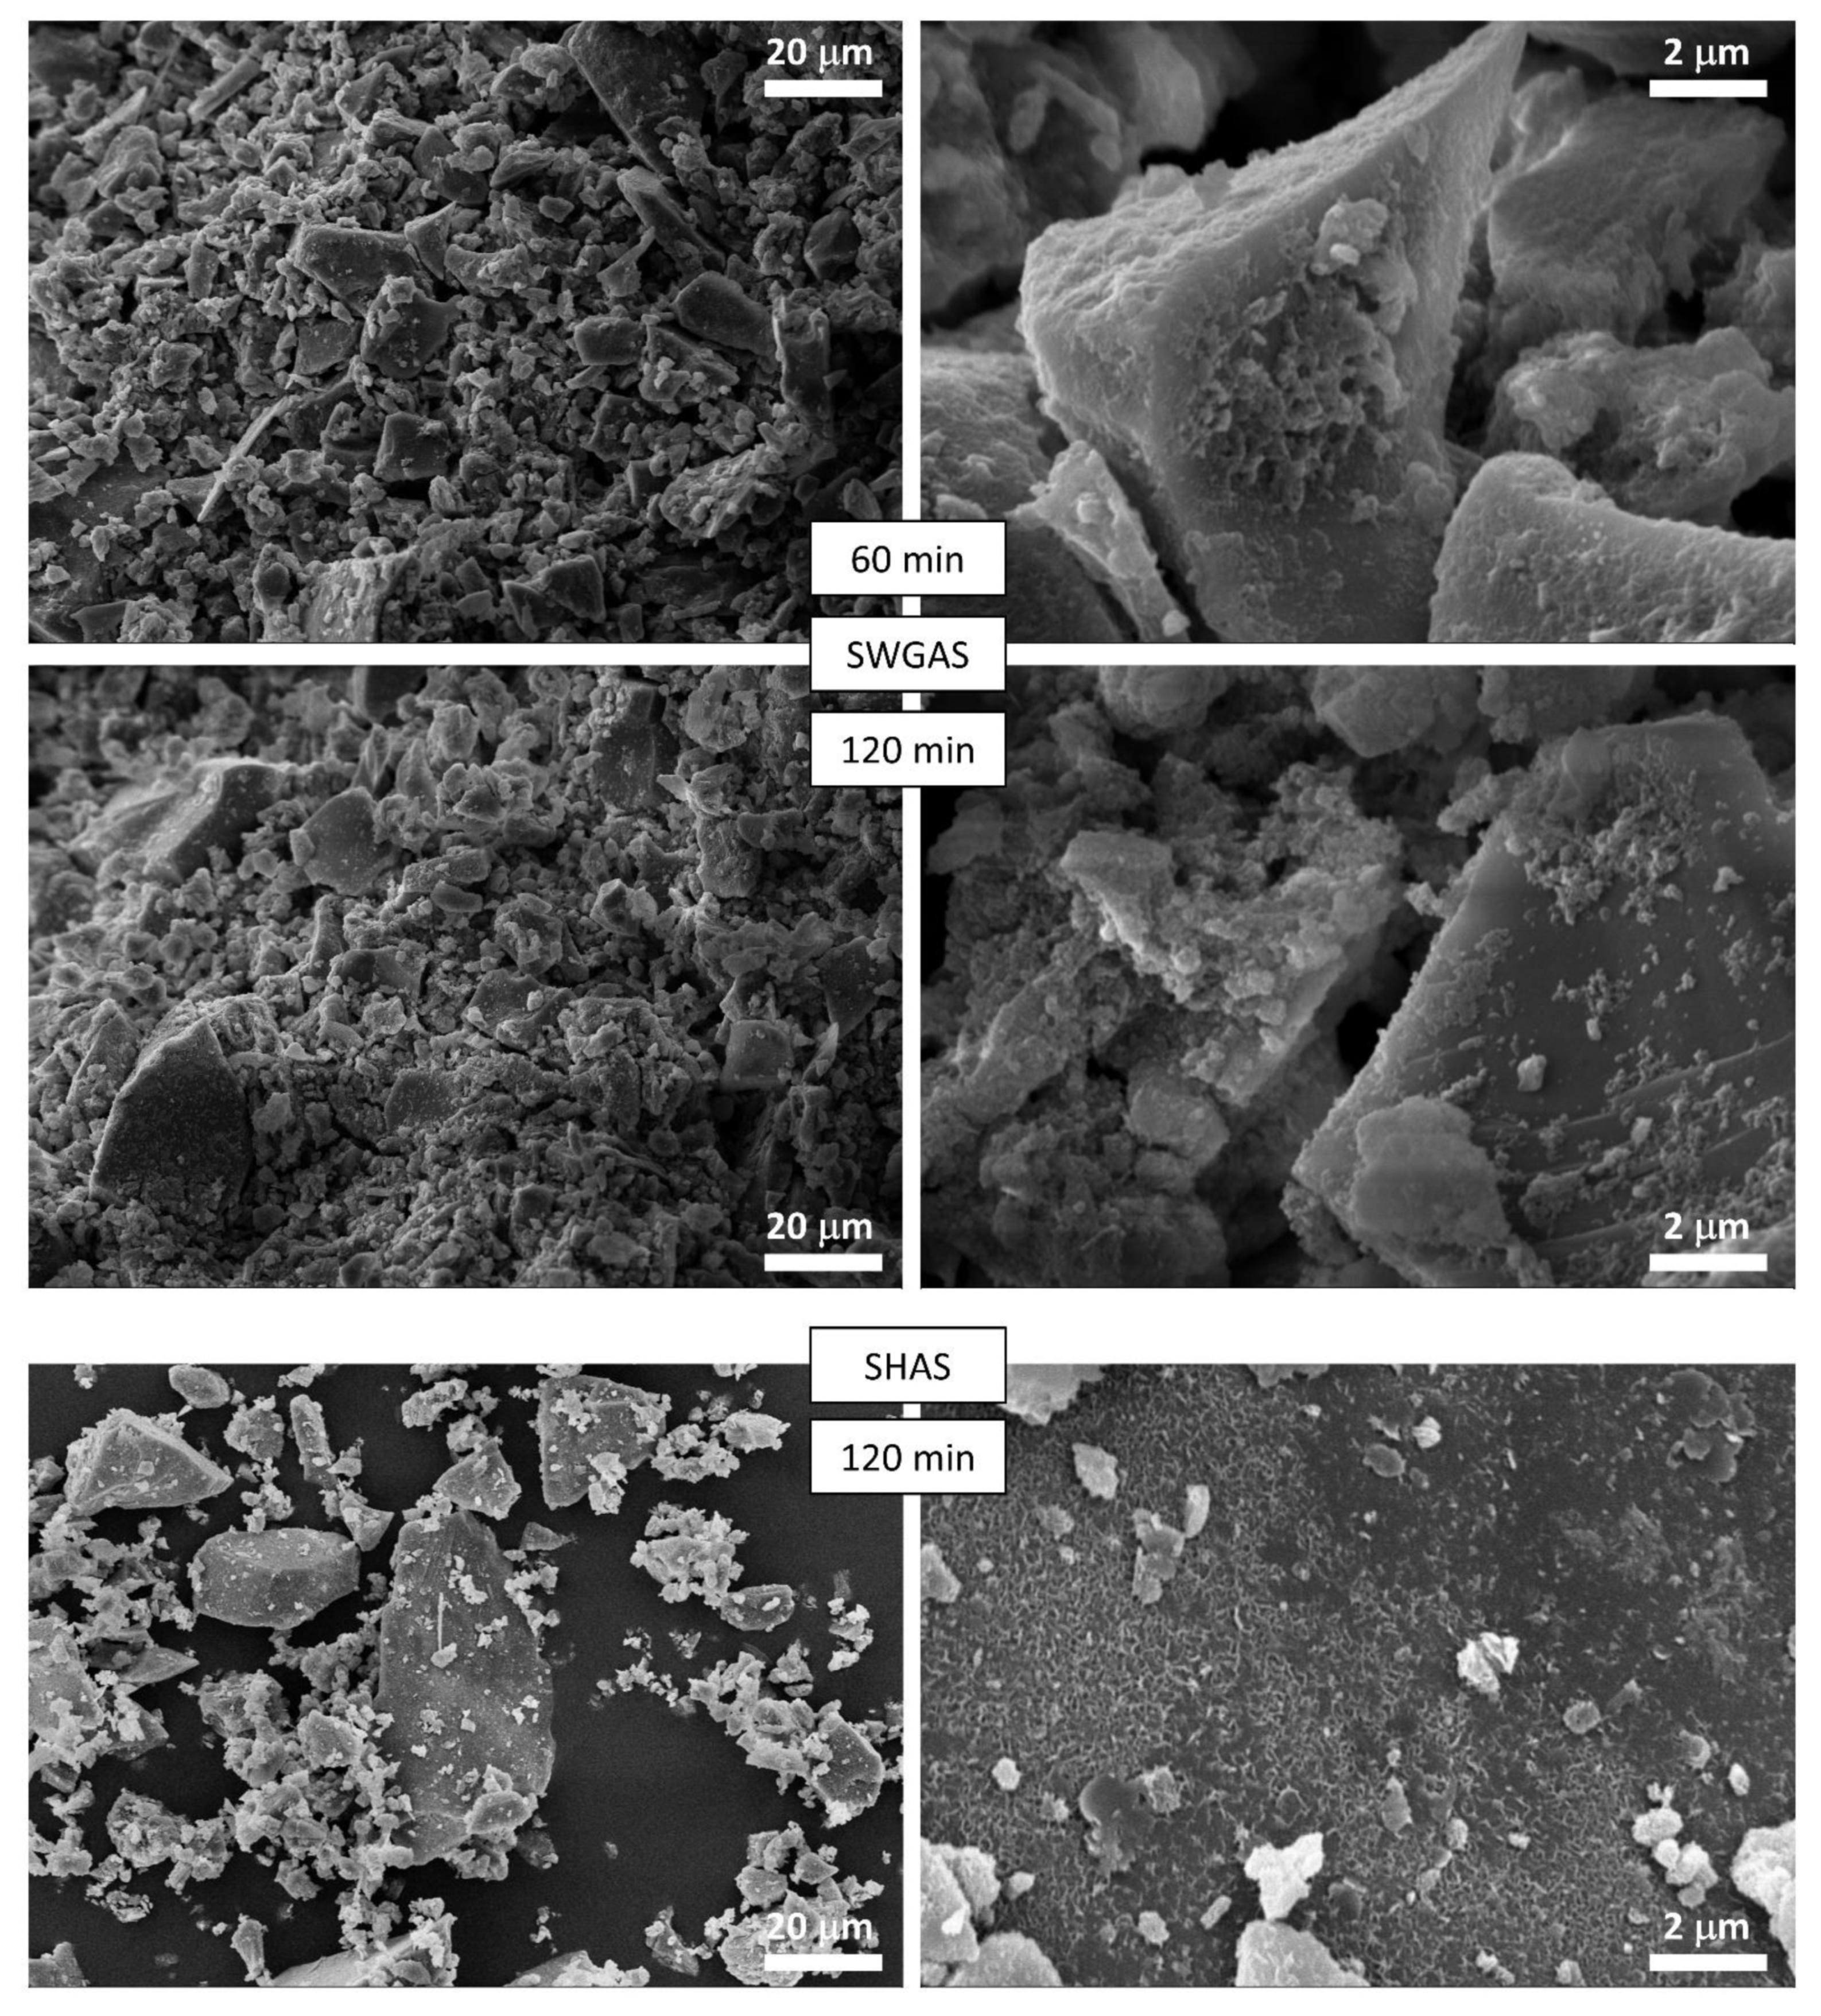
3.2. Evolution of Binder at Early Stages
4. Conclusions
Author Contributions
Funding
Institutional Review Board Statement
Informed Consent Statement
Data Availability Statement
Conflicts of Interest
Appendix A

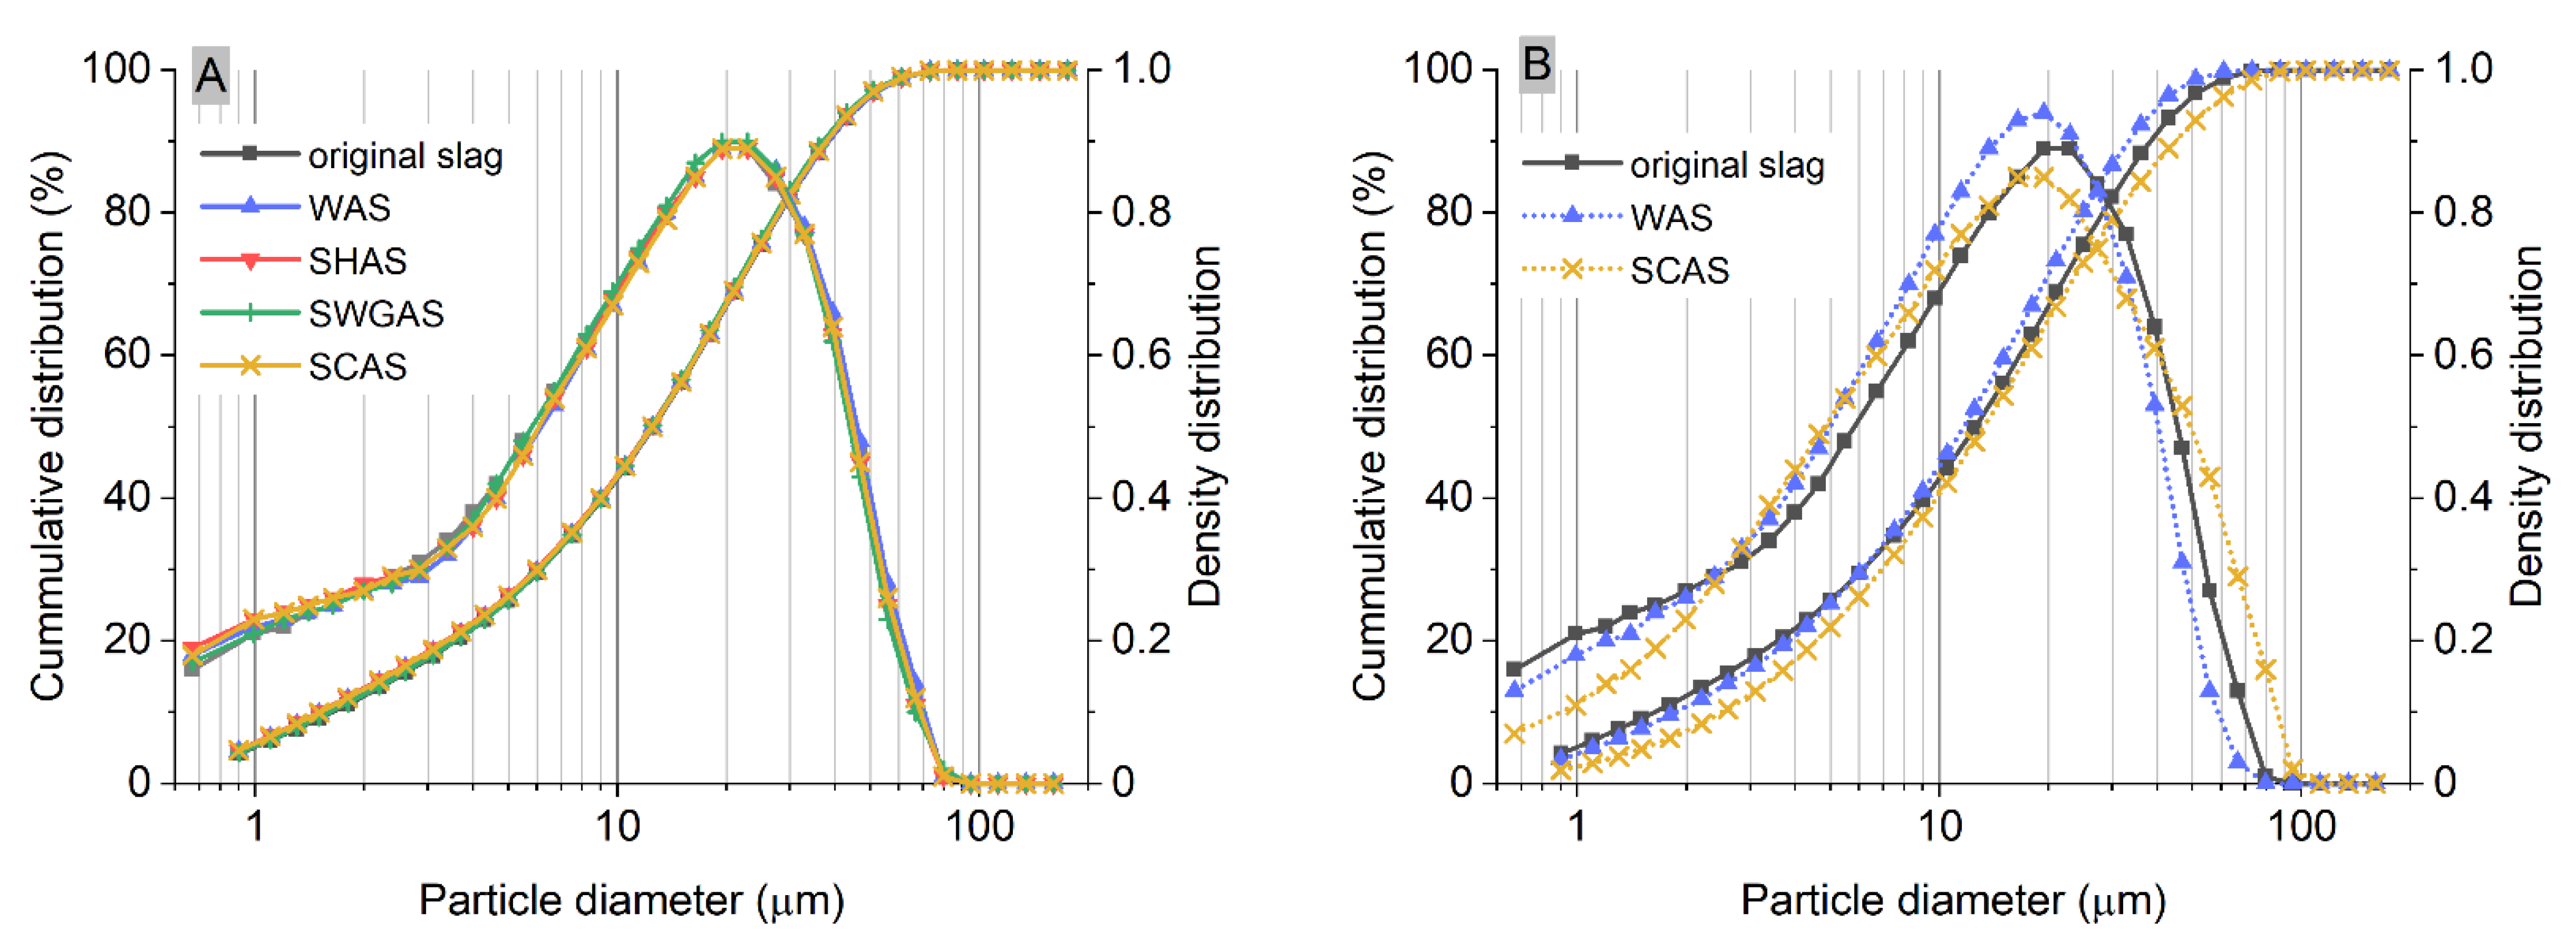
| Sample | Time | x10 | x30 | x50 | x90 | x99 | Modus | Geometric Mean |
|---|---|---|---|---|---|---|---|---|
| Original slag | – | 1.63 | 6.16 | 12.57 | 38.37 | 62.42 | 21.18 | 16.74 |
| WAS_0.50 | 5 min | 1.54 | 6.04 | 12.49 | 38.22 | 62.09 | 22.05 | 16.64 |
| 30 min | 1.54 | 6.04 | 12.52 | 38.36 | 62.20 | 22.91 | 16.69 | |
| 1 h | 1.54 | 6.05 | 12.49 | 38.12 | 61.77 | 22.91 | 16.62 | |
| 2 h | 1.56 | 6.14 | 12.61 | 38.38 | 62.40 | 22.91 | 16.75 | |
| 5 h | 1.53 | 5.99 | 12.39 | 37.90 | 61.54 | 22.05 | 16.51 | |
| 24 h | 1.53 | 6.01 | 12.33 | 37.43 | 61.03 | 19.44 | 16.37 | |
| WAS_0.10 | 24 h | 1.87 | 6.13 | 11.70 | 33.48 | 53.05 | 19.44 | 16.37 |
| SHAS_0.50 | 5 min | 1.52 | 6.07 | 12.58 | 38.12 | 61.38 | 22.91 | 16.65 |
| 30 min | 1.50 | 6.04 | 12.49 | 37.87 | 61.09 | 22.91 | 16.42 | |
| 1 h | 1.50 | 6.00 | 12.45 | 37.82 | 60.97 | 22.91 | 16.51 | |
| 2 h | 1.53 | 5.94 | 12.39 | 37.36 | 61.21 | 22.91 | 16.49 | |
| SWGAS_0.50 | 5 min | 1.62 | 6.20 | 12.50 | 37.48 | 60.97 | 20.6 | 16.50 |
| 30 min | 1.60 | 6.14 | 12.42 | 37.04 | 60.84 | 19.44 | 16.37 | |
| SCAS_0.50 | 5 min | 1.51 | 6.03 | 12.48 | 37.90 | 61.44 | 22.91 | 16.55 |
| 30 min | 1.51 | 6.02 | 12.49 | 37.82 | 60.90 | 22.91 | 16.52 | |
| 1 h | 1.51 | 6.05 | 12.53 | 37.85 | 61.35 | 21.76 | 16.56 | |
| 2 h | 1.51 | 6.13 | 12.76 | 38.36 | 61.90 | 22.91 | 16.78 | |
| 5 h | 1.42 | 5.59 | 11.96 | 37.20 | 60.67 | 21.76 | 16.09 | |
| 24 h | 1.43 | 5.43 | 11.83 | 37.03 | 60.80 | 21.76 | 15.99 | |
| SCAS_0.10 | 24 h | 2.52 | 6.96 | 13.29 | 44.91 | 77.81 | 19.44 | 18.99 |
Appendix B

Appendix C
| Activation with Sodium Hydroxide | |||||||||||
| Time | Na | Si | Ca | Mg | Al | K | Fe | Ti | Mn | pH | κ |
| 5 | 3481 | 10.42 | 0.7011 | 1.304 | 1.890 | 17.16 | 0.03044 | 0.02716 | 0.00546 | 12.17 | 8.202 |
| 30 | 3266 | 18.352 | 0.6562 | 1.304 | 2.394 | 10.56 | 0.02686 | 0.02298 | 0.00728 | 12.26 | 8.407 |
| 60 | 2989 | 25.91 | 0.4666 | 1.296 | 2.984 | 10.49 | 0.02686 | 0.02298 | 0.00364 | 12.16 | 8.126 |
| 120 | 3138 | 33.98 | 0.3892 | 1.292 | 3.187 | 11.19 | 0.02507 | 0.02298 | 0.00182 | 12.13 | 7.917 |
| 300 | 3194 | 67.53 | 0.4816 | 1.300 | 7.431 | 27.41 | 0.09132 | 0.02298 | n.d. | 12.13 | 7.695 |
| 1440 | 2647 | 19.28 | 0.5315 | 1.325 | 6.567 | 94.07 | 0.1289 | 0.02298 | n.d. | 12.08 | 6.486 |
| Activation with sodium waterglass | |||||||||||
| Time | Na | Si | Ca | Mg | Al | K | Fe | Ti | Mn | pH | κ |
| 5 | 3327 | 4063 | 67.20 | 10.37 | 6.794 | 66.33 | 0.3528 | 0.3823 | 0.35859 | 11.67 | 3.928 |
| 30 | 3411 | 5631 | 98.81 | 24.46 | 18.72 | 64.65 | 0.5623 | 0.6539 | 0.89009 | 11.76 | 4.016 |
| 60 | 2500 | 2805 | 63.89 | 20.06 | 38.46 | 47.83 | 0.3313 | 0.3781 | 0.56973 | 11.71 | 3.624 |
| 120 | 2293 | 2275 | 34.02 | 12.40 | 31.83 | 42.88 | 0.2632 | 0.2215 | 0.40045 | 11.7 | 3.540 |
| 300 | 1794 | 862.5 | 0.8708 | 1.884 | 10.01 | 28.63 | 0.1057 | 0.04596 | 0.04005 | 11.68 | 3.368 |
| 1440 | 1189 | 47.17 | 0.4616 | 1.333 | 3.236 | 26.90 | 0.1594 | 0.03343 | n.d. | 11.65 | 2.806 |
| Activation with sodium carbonate | |||||||||||
| Time | Na | Si | Ca | Mg | Al | K | Fe | Ti | Mn | pH | κ |
| 5 | 3529 | 19.84 | 3.603 | 2.279 | 0.4336 | 8.959 | 0.02686 | 0.02716 | n.d. | 10.97 | 3.698 |
| 30 | 3451 | 15.94 | 1.821 | 6.850 | 0.1483 | 113.1 | 0.02865 | 0.04805 | n.d. | 10.98 | 3.764 |
| 60 | 3520 | 13.14 | 1.193 | 7.838 | 0.1445 | 84.84 | 0.02686 | 0.05641 | 0.00182 | 10.99 | 3.739 |
| 120 | 3239 | 12.92 | 1.123 | 3.547 | 0.1186 | 8.939 | 0.02686 | 0.0376 | n.d. | 10.99 | 3.598 |
| 300 | 3169 | 58.22 | 6.734 | 8.866 | 0.6597 | 16.30 | 0.04477 | 0.02716 | n.d. | 10.74 | 3.397 |
| 1440 | 1711 | 232.8 | 0.5015 | 1.350 | 5.656 | 23.04 | 0.06088 | 0.03134 | n.d. | 11.53 | 2.827 |
| Activation with demineralized water | |||||||||||
| Time | Na | Si | Ca | Mg | Al | K | Fe | Ti | Mn | pH | κ |
| 5 | 4.276 | 1.755 | 5.554 | 3.271 | 0.03336 | 1.276 | 0.02507 | 0.02507 | n.d. | 6.92 | 0.03437 |
| 30 | 2.997 | 0.8118 | 6.041 | 2.876 | 0.01482 | 1.215 | 0.02328 | 0.02507 | n.d. | 6.77 | 0.03404 |
| 60 | 3.149 | 0.9578 | 6.732 | 2.604 | 0.04818 | 1.576 | 0.02328 | 0.02507 | n.d. | 6.92 | 0.03718 |
| 120 | 3.236 | 0.8189 | 7.318 | 2.172 | 0.07412 | 2.918 | 0.02507 | 0.02298 | n.d. | 7.75 | 0.03515 |
| 300 | 3.636 | 0.9542 | 8.157 | 1.650 | 0.06671 | 1.944 | 0.02507 | 0.02507 | n.d. | 8.25 | 0.03728 |
| 1440 | 3.589 | 1.050 | 4.713 | 1.358 | 0.04447 | 0.8722 | 0.02507 | 0.02507 | n.d. | 8.63 | 0.02247 |
References
- Provis, J.L.; van Deventer, J.S.J. Alkali Activated Materials State-of-the-Art Report, RILEM TC 224-AAM; Springer: Berlin/Heidelberg, Germany, 2014. [Google Scholar]
- Provis, J.L. Alkali-activated materials. Cem. Concr. Res. 2018, 114, 40–48. [Google Scholar] [CrossRef]
- Bakharev, T.; Sanjayan, J.G.; Cheng, Y.B. Resistance of alkali-activated slag concrete to acid attack. Cem. Concr. Res. 2003, 33, 1607–1611. [Google Scholar] [CrossRef]
- Bernal, S.A.; Rodríguez, E.D.; Mejía de Gutiérrez, R.; Provis, J.L. Performance of alkali-activated slag mortars exposed to acids. J. Sustain. Cem. Based. Mater. 2012, 1, 138–151. [Google Scholar] [CrossRef]
- Komljenović, M.; Baščarević, Z.; Marjanović, N.; Nikolić, V. External sulfate attack on alkali-activated slag. Constr. Build. Mater. 2013, 49, 31–39. [Google Scholar] [CrossRef]
- Bakharev, T.; Sanjayan, J.G.; Cheng, Y.-B. Sulfate attack on alkali-activated slag concrete. Cem. Concr. Res. 2002, 32, 211–216. [Google Scholar] [CrossRef]
- Komljenovic, M.M.; Bascarevic, Z.; Marjanovic, N.; Nikolic, V. Decalcification resistance of alkali-activated slag. J. Hazard. Mater. 2012, 233–234, 112–121. [Google Scholar] [CrossRef]
- Varga, C.; Alonso, M.M.; Mejía de Gutierrez, R.; Mejía, J.; Puertas, F. Decalcification of alkali-activated slag pastes. Effect of the chemical composition of the slag. Mater. Struct. 2014, 48, 541–555. [Google Scholar] [CrossRef]
- Shi, C.; Krivenko, P.V.; Roy, D. Alkali-Activated Cements and Concretes; CRC Press: Boca Raton, FL, USA, 2006. [Google Scholar]
- Pacheco-Torgal, F.; Abdollahnejad, Z.; Camões, A.F.; Jamshidi, M.; Ding, Y. Durability of alkali-activated binders: A clear advantage over Portland cement or an unproven issue? Constr. Build. Mater. 2012, 30, 400–405. [Google Scholar] [CrossRef] [Green Version]
- Pan, Z.; Sanjayan, J.G.; Kong, D.L.Y. Effect of aggregate size on spalling of geopolymer and Portland cement concretes subjected to elevated temperatures. Constr. Build. Mater. 2012, 36, 365–372. [Google Scholar] [CrossRef]
- Zhao, R.; Sanjayan, J.G. Geopolymer and Portland cement concretes in simulated fire. Mag. Concr. Res. 2011, 63, 163–173. [Google Scholar] [CrossRef]
- Provis, J.L. Geopolymers—Structure, Processing, Properties and Industrial Applications, 1st ed.; Woodhead Publishing: Cambridge, UK, 2009. [Google Scholar]
- Rashad, A.M.; Bai, Y.; Basheer, P.A.M.; Collier, N.C.; Milestone, N.B. Chemical and mechanical stability of sodium sulfate activated slag after exposure to elevated temperature. Cem. Concr. Res. 2012, 42, 333–343. [Google Scholar] [CrossRef]
- San Nicolas, R.; Bernal, S.A.; Mejía de Gutiérrez, R.; van Deventer, J.S.J.; Provis, J.L. Distinctive microstructural features of aged sodium silicate-activated slag concretes. Cem. Concr. Res. 2014, 65, 41–51. [Google Scholar] [CrossRef]
- Melo Neto, A.A.; Cincotto, M.A.; Repette, W. Drying and autogenous shrinkage of pastes and mortars with activated slag cement. Cem. Concr. Res. 2008, 38, 565–574. [Google Scholar] [CrossRef]
- Palacios, M.; Puertas, F. Effectiveness of Mixing Time on Hardened Properties of Waterglass-Activated Slag Pastes and Mortars. ACI Mater. J. 2011, 108, 73–78. [Google Scholar]
- Pacheco-Torgal, F.; Labrincha, J.; Leonelli, C.; Palomo, A.; Chindaprasirt, P. Handbook of Alkali-Activated Cements, Mortars and Concretes, 1st ed.; Woodhead Publishing: Cambridge, UK, 2014. [Google Scholar]
- Zhang, S.; Li, Z.; Ghiassi, B.; Yin, S.; Ye, G. Fracture properties and microstructure formation of hardened alkali-activated slag/fly ash pastes. Cem. Concr. Res. 2021, 144, 106447. [Google Scholar] [CrossRef]
- Fang, G.; Bahrami, H.; Zhang, M. Mechanisms of autogenous shrinkage of alkali-activated fly ash-slag pastes cured at ambient temperature within 24 h. Constr. Build. Mater. 2018, 171, 377–387. [Google Scholar] [CrossRef]
- Nedeljkovic, M.; Li, Z.; Ye, G. Setting, Strength, and Autogenous Shrinkage of Alkali-Activated Fly Ash and Slag Pastes: Effect of Slag Content. Materials 2018, 11, 2121. [Google Scholar] [CrossRef] [Green Version]
- Jang, J.G.; Lee, N.K.; Lee, H.K. Fresh and hardened properties of alkali-activated fly ash/slag pastes with superplasticizers. Constr. Build. Mater. 2014, 50, 169–176. [Google Scholar] [CrossRef]
- Marjanović, N.; Komljenović, M.; Baščarević, Z.; Nikolić, V.; Petrović, R. Physical–mechanical and microstructural properties of alkali-activated fly ash–blast furnace slag blends. Ceram. Int. 2015, 41, 1421–1435. [Google Scholar] [CrossRef]
- Lu, C.; Zhang, Z.; Shi, C.; Li, N.; Jiao, D.; Yuan, Q. Rheology of alkali-activated materials: A review. Cem. Concr. Compos. 2021, 121, 104061. [Google Scholar] [CrossRef]
- Kovalchuk, G.; Fernández-Jiménez, A.; Palomo, A. Alkali-activated fly ash: Effect of thermal curing conditions on mechanical and microstructural development—Part II. Fuel 2007, 86, 315–322. [Google Scholar] [CrossRef]
- Bakharev, T. Geopolymeric materials prepared using Class F fly ash and elevated temperature curing. Cem. Concr. Res. 2005, 35, 1224–1232. [Google Scholar] [CrossRef]
- Duxson, P.; Provis, J.L. Designing Precursors for Geopolymer Cements. J. Am. Ceram. Soc. 2008, 91, 3864–3869. [Google Scholar] [CrossRef]
- Nie, S.; Thomsen, R.M.; Skibsted, J. Impact of Mg substitution on the structure and pozzolanic reactivity of calcium aluminosilicate (CaO-Al2O3-SiO2) glasses. Cem. Concr. Res. 2020, 138, 106231. [Google Scholar] [CrossRef]
- Blotevogel, S.; Montouillout, V.; Canizares, A.; Simon, P.; Chesneau, E.; Danezan, A.; Wattez, T.; Ehrenberg, A.; Poirier, M.; Patapy, C.; et al. Glass structure of industrial ground granulated blast furnace slags (GGBS) investigated by time-resolved Raman and NMR spectroscopies. J. Mater. Sci. 2021, 56, 17490–17504. [Google Scholar] [CrossRef]
- Zuo, Y.; Ye, G. Lattice Boltzmann simulation of the dissolution of slag in alkaline solution using real-shape particles. Cem. Concr. Res. 2021, 140, 106313. [Google Scholar] [CrossRef]
- Blotevogel, S.; Steger, L.; Hart, D.; Doussang, L.; Kaknics, J.; Poirier, M.; Bornhöft, H.; Deubener, J.; Patapy, C.; Cyr, M. Effect of TiO2 and 11 minor elements on the reactivity of ground-granulated blast-furnace slag in blended cements. J. Am. Ceram. Soc. 2020, 104, 128–139. [Google Scholar] [CrossRef]
- Zuo, Y.; Nedeljković, M.; Ye, G. Coupled thermodynamic modelling and experimental study of sodium hydroxide activated slag. Constr. Build. Mater. 2018, 188, 262–279. [Google Scholar] [CrossRef]
- Zuo, Y.; Ye, G. Preliminary Interpretation of the Induction Period in Hydration of Sodium Hydroxide/Silicate Activated Slag. Materials 2020, 13, 4796. [Google Scholar] [CrossRef] [PubMed]
- Wagner, T.; Kulik, D.A.; Hingerl, F.F.; Dmytrieva, S.V. GEM-Selektor Geochemical Modeling Package: TSolMod Library and Data Interafce for Multicomponent Phase Models. Can. Mineral. 2012, 50, 1173–1195. [Google Scholar] [CrossRef]
- Kulik, D.A.; Wagner, T.; Dmytrieva, S.V.; Kosakowski, G.; Hingerl, F.F.; Chudnenko, K.V.; Berner, U.R. GEM-Selektor geochemical modeling package: Revised algorithm and GEMS3K numerical kernel for coupled simulation codes. Computat. Geosci. 2012, 17, 1–24. [Google Scholar] [CrossRef] [Green Version]
- Myers, R.J.; Bernal, S.A.; Provis, J.L. A thermodynamic model for C-(N-)A-S-H gel: CNASH_ss. Derivation and validation. Cem. Concr. Res. 2014, 66, 27–47. [Google Scholar] [CrossRef]
- Garcia-Lodeiro, I.; Palomo, A.; Fernández-Jiménez, A.; Macphee, D.E. Compatibility studies between N-A-S-H and C-A-S-H gels. Study in the ternary diagram Na2O-CaO-Al2O3-SiO2-H2O. Cem. Concr. Res. 2011, 41, 923–931. [Google Scholar] [CrossRef]
- Zhou, Y.; Hou, D.; Manzano, H.; Orozco, C.A.; Geng, G.; Monteiro, P.J.M.; Liu, J. Interfacial Connection Mechanisms in Calcium−Silicate−Hydrates/Polymer Nanocomposites: A Molecular Dynamics Study. ACS Appl. Mater. Inter. 2017, 9, 41014–41025. [Google Scholar] [CrossRef] [PubMed]
- Zhou, Y.; Cai, J.; Chen, R.; Hou, D.; Xu, J.; Lv, K.; Zheng, Q. The design and evaluation of a smart polymer-based fluids transport inhibitor. J. Clean. Prod. 2020, 257, 120528. [Google Scholar] [CrossRef]
- Zhou, Y.; Tang, L.; Liu, J.; Miao, C. Interaction mechanisms between organic and inorganic phases in calcium silicate hydrates/poly(vinyl alcohol) composites. Cem. Concr. Res. 2019, 125, 105891. [Google Scholar] [CrossRef]
- Bernal, S.A.; Provis, J.L.; Myers, R.J.; San Nicolas, R.; van Deventer, J.S.J. Role of carbonates in the chemical evolution of sodium carbonate-activated slag binders. Mater. Struct. 2014, 48, 517–529. [Google Scholar] [CrossRef]
- Kashani, A.; Provis, J.L.; Qiao, G.G.; van Deventer, J.S.J. The interrelationship between surface chemistry and rheology in alkali activated slag paste. Constr. Build. Mater. 2014, 65, 583–591. [Google Scholar] [CrossRef]
- Palacios, M.; Gismera, S.; Alonso, M.M.; d’Espinose de Lacaillerie, J.B.; Lothenbach, B.; Favier, A.; Brumaud, C.; Puertas, F. Early reactivity of sodium silicate-activated slag pastes and its impact on rheological properties. Cem. Concr. Res. 2021, 140, 106302. [Google Scholar] [CrossRef]
- Mantellato, S.; Palacios, M.; Flatt, R.J. Reliable specific surface area measurements on anhydrous cements. Cem. Concr. Res. 2015, 67, 286–291. [Google Scholar] [CrossRef]
- Shi, C.; Day, R.L. A calorimetric study of early hydration of alkali-slag cement. Cem. Concr. Res. 1995, 25, 1333–1346. [Google Scholar] [CrossRef]
- Deir, E.; Gebregziabiher, B.S.; Peethamparan, S. Influence of starting material on the early age hydration kinetics, microstructure and composition of binding gel in alkali activated binder systems. Cem. Concr. Compos. 2014, 48, 108–117. [Google Scholar] [CrossRef]
- Gebregziabiher, B.S.; Thomas, R.; Peethamparan, S. Very early-age reaction kinetics and microstructural development in alkali-activated slag. Cem. Concr. Compos. 2015, 55, 91–102. [Google Scholar] [CrossRef]
- Gebregziabiher, B.S.; Thomas, R.J.; Peethamparan, S. Temperature and activator effect on early-age reaction kinetics of alkali-activated slag binders. Constr. Build. Mater. 2016, 113, 783–793. [Google Scholar] [CrossRef] [Green Version]
- Bilek, V.; Kalina, L.; Novotny, R.; Tkacz, J.; Parizek, L. Some Issues of Shrinkage-Reducing Admixtures Application in Alkali-Activated Slag Systems. Materials 2016, 9, 462. [Google Scholar] [CrossRef]
- Ravikumar, D.; Neithalath, N. Reaction kinetics in sodium silicate powder and liquid activated slag binders evaluated using isothermal calorimetry. Thermochim. Acta 2012, 546, 32–43. [Google Scholar] [CrossRef]
- Chithiraputhiran, S.; Neithalath, N. Isothermal reaction kinetics and temperature dependence of alkali activation of slag, fly ash and their blends. Constr. Build. Mater. 2013, 45, 233–242. [Google Scholar] [CrossRef]
- Yuan, B.; Yu, Q.L.; Brouwers, H.J.H. Evaluation of slag characteristics on the reaction kinetics and mechanical properties of N2CO3 activated slag. Constr. Build. Mater. 2017, 131, 334–346. [Google Scholar] [CrossRef]
- Fernández Jiménez, A.; Puertas, F. Setting of alkali-activated slag cement. Influence of activator nature. Adv. Cem. Res. 2001, 13, 115–121. [Google Scholar] [CrossRef]
- Brough, A.R.; Atkinson, A. Sodium silicate-based, alkali-activated slag mortars Part I. Strength, hydration and microstructure. Cem. Concr. Res. 2002, 32, 865–879. [Google Scholar] [CrossRef]
- Brough, A.R.; Holloway, M.; Sykes, J.; Atkinson, A. Sodium silicate-based alkali-activated slag mortars Part II. The retarding effect of additions of sodium chloride or malic acid. Cem. Concr. Res. 2000, 30, 1375–1379. [Google Scholar] [CrossRef]
- Ke, X.; Bernal, S.A.; Provis, J.L. Controlling the reaction kinetics of sodium carbonate-activated slag cements using calcined layered double hydroxides. Cem. Concr. Res. 2016, 81, 24–37. [Google Scholar] [CrossRef] [Green Version]
- Dai, X.; Aydin, S.; Yardimci, M.Y.; Qiang, R.E.N.; Lesage, K. Rheology, early-age hydration and microstructure of alkali-activated GGBFS-Fly ash-limestone mixtures. Cem. Concr. Compos. 2021, 124, 104244. [Google Scholar] [CrossRef]
- Yuan, Q.; Lu, X.; Khayat, K.H.; Feys, D.; Shi, C. Small amplitude oscillatory shear technique to evaluate structural build-up of cement paste. Mater. Struct. 2016, 50, 112. [Google Scholar] [CrossRef]
- Habbaba, A.; Plank, J. Interaction Between Polycarboxylate Superplasticizers and Amorphous Ground Granulated Blast Furnace Slag. J. Am. Ceram. Soc. 2010, 93, 2857–2863. [Google Scholar] [CrossRef]
- Newlands, K.C.; Foss, M.; Matchei, T.; Skibsted, J.; Macphee, D.E. Early stage dissolution characteristics of aluminosilicate glasses with blast furnace slag- and fly-ash-like compositions. J. Am. Ceram. Soc. 2017, 100, 1941–1955. [Google Scholar] [CrossRef]
- Palacios, M.; Banfill, P.F.G.; Puertas, F. Rheology and Setting of Alkali-Activated Slag Pastes and Mortars: Effect of Organic Admixture. ACI Mater. J. 2008, 105, 140. [Google Scholar]
- Chang, J.J. A study on the setting characteristics of sodium silicate-activated slag pastes. Cem. Concr. Res. 2003, 33, 1005–1011. [Google Scholar] [CrossRef]
- Ben Haha, M.; Le Saout, G.; Winnefeld, F.; Lothenbach, B. Influence of activator type on hydration kinetics, hydrate assemblage and microstructural development of alkali activated blast-furnace slags. Cem. Concr. Res. 2011, 41, 301–310. [Google Scholar] [CrossRef]
- Tashima, M.M.; Reig, L.; Santini, M.A.; Moraes, J.C.B.; Akasaki, J.L.; Payá, J.; Borrachero, M.V.; Soriano, L. Compressive Strength and Microstructure of Alkali-Activated Blast Furnace Slag/Sewage Sludge Ash (GGBS/SSA) Blends Cured at Room Temperature. Waste Biomass Valori. 2016, 8, 1441–1451. [Google Scholar] [CrossRef] [Green Version]
- Dai, X.; Aydın, S.; Yardımcı, M.Y.; Lesage, K.; De Schutter, G. Effects of activator properties and GGBFS/FA ratio on the structural build-up and rheology of AAC. Cem. Concr. Res. 2020, 138, 106253. [Google Scholar] [CrossRef]
- Zuo, Y.; Nedeljković, M.; Ye, G. Pore solution composition of alkali-activated slag/fly ash pastes. Cem. Concr. Res. 2019, 115, 230–250. [Google Scholar] [CrossRef]
- Gruskovnjak, A.; Lothenbach, B.; Holzer, L.; Figi, R.; Winnefeld, F. Hydration of alkali-activated slag: Comparison with ordinary Portland cement. Adv. Cem. Res. 2006, 18, 119–128. [Google Scholar] [CrossRef]
- Myers, R.J.; Lothenbach, B.; Bernal, S.A.; Provis, J.L. Thermodynamic modelling of alkali-activated slag cements. Appl. Geochem. 2015, 61, 233–247. [Google Scholar] [CrossRef]


| SiO2 | Al2O3 | Fe2O3 | CaO | MgO | SO3 | K2O | Na2O | TiO2 | Mn2O3 | SrO | LOI |
|---|---|---|---|---|---|---|---|---|---|---|---|
| 39.4 | 8.08 | 0.73 | 37.0 | 8.56 | 1.36 | 1.18 | 0.40 | 0.30 | 0.88 | 0.06 | 2.0 |
| Activator | SWGAS | SHAS | SCAS | WAS |
|---|---|---|---|---|
| initial setting time | 42 ± 2.8 min | 118 ± 2 min | 281 ± 4 min | >3 days |
| final setting time | 67 ± 1.4 min | 235 ± 7 min | 1219 ± 11 min | >3 days |
| Activator | Original Slag | Time of Hydration | |||||
|---|---|---|---|---|---|---|---|
| 5 min | 30 min | 1 h | 2 h | 5 h | 24 h | ||
| Water | 1.85 | 1.98 | 1.98 | n.d. | n.d. | n.d. | 2.22 |
| NaOH | 2.06 | 2.13 | 2.54 | 3.37 | 10.2 | n.d. | |
| Sodium waterglass | 1.57 | 1.90 | 5.50 | 14.9 | n.d. | n.d. | |
| Na2CO3 | 1.93 | 2.02 | 2.11 | 2.37 | 5.20 | 10.5 | |
Publisher’s Note: MDPI stays neutral with regard to jurisdictional claims in published maps and institutional affiliations. |
© 2021 by the authors. Licensee MDPI, Basel, Switzerland. This article is an open access article distributed under the terms and conditions of the Creative Commons Attribution (CC BY) license (https://creativecommons.org/licenses/by/4.0/).
Share and Cite
Bílek, V., Jr.; Hrubý, P.; Iliushchenko, V.; Koplík, J.; Kříkala, J.; Marko, M.; Hajzler, J.; Kalina, L. Experimental Study of Slag Changes during the Very Early Stages of Its Alkaline Activation. Materials 2022, 15, 231. https://doi.org/10.3390/ma15010231
Bílek V Jr., Hrubý P, Iliushchenko V, Koplík J, Kříkala J, Marko M, Hajzler J, Kalina L. Experimental Study of Slag Changes during the Very Early Stages of Its Alkaline Activation. Materials. 2022; 15(1):231. https://doi.org/10.3390/ma15010231
Chicago/Turabian StyleBílek, Vlastimil, Jr., Petr Hrubý, Valeriia Iliushchenko, Jan Koplík, Jakub Kříkala, Michal Marko, Jan Hajzler, and Lukáš Kalina. 2022. "Experimental Study of Slag Changes during the Very Early Stages of Its Alkaline Activation" Materials 15, no. 1: 231. https://doi.org/10.3390/ma15010231
APA StyleBílek, V., Jr., Hrubý, P., Iliushchenko, V., Koplík, J., Kříkala, J., Marko, M., Hajzler, J., & Kalina, L. (2022). Experimental Study of Slag Changes during the Very Early Stages of Its Alkaline Activation. Materials, 15(1), 231. https://doi.org/10.3390/ma15010231