
Experimental and Numerical Verification of the Railway Track Substructure with Innovative Thermal Insulation Materials


Abstract
1. Introduction
2. Characteristics of Tested Materials and Used Methods
2.1. Foamed Concrete Development
2.2. Properties of Used Materials
- (a)
- (b)
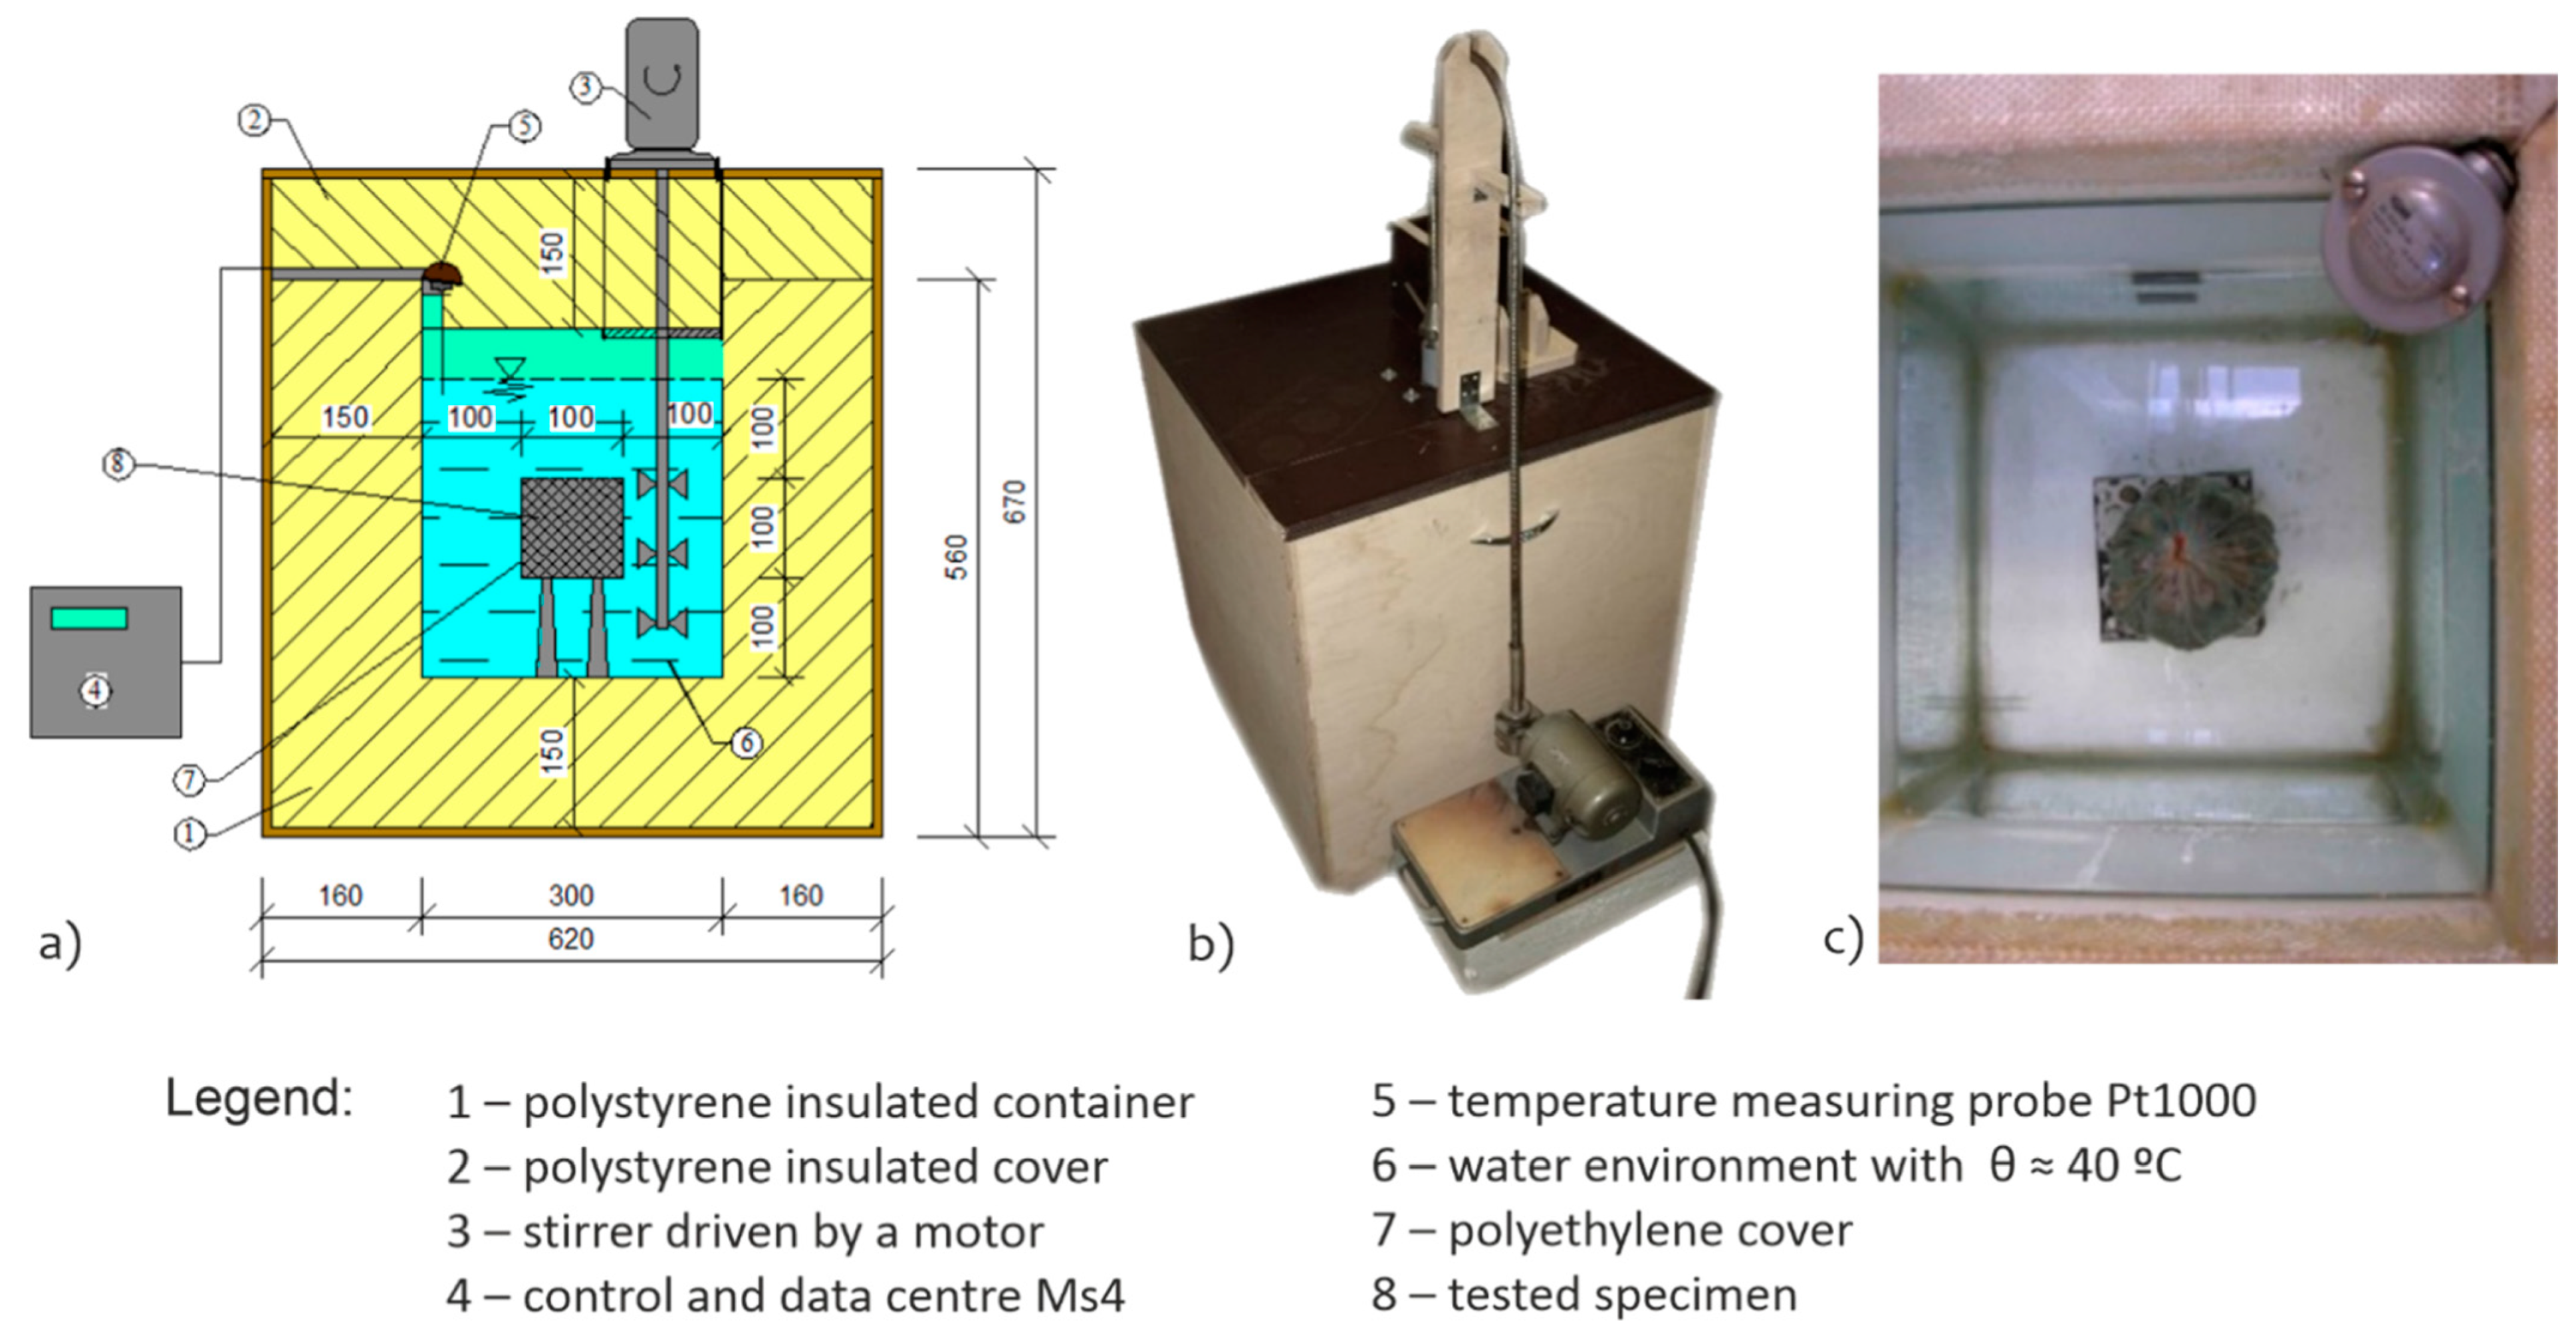
- Modulus of elasticity and Poisson’s ratio of foamed concrete were determined on the samples with dimension of 150 mm and height of 300 mm according to EN 12390-13:2021 [92]. Three samples were used.
- (c)
- Compressive strength of foamed concrete was measured on samples 150 mm × 150 mm × 150 mm, according to EN 12390-3:2019 [93] using infraTest Compress Test Machine (Infratest Prüftechnik GmbH, Brackenheim, Germany) with force range 0–2000 kN. Three samples were used.
- (d)
- Flexural strength of foamed concrete was tested on samples of 100 mm × 100 mm × 500 mm according to EN ISO 12390-5:2019 [94] using infraTest Compress Test machine with DigiMaxx C30 (FORM+TEST Seidner&Co. GmbH, Riedlingen, Germany) with infraTest double roller 35-0170. Three samples were used.
- cement class CEM II/B-S 32.5 R—317 kg,
- sand fr. 0/2 mm—210 kg,
- water—160 kg,
- foam concentrate iwtech FC1 (iwtech Ltd., Trenčín, Slovakia)—1.56 kg.
2.3. Methods of Testing in Experimental Field
2.3.1. Description of Experimental Field
2.3.2. Determination of Bearing Capacity of the Modified Railway Sub-Ballast Layers
2.3.3. Determination of Climate Characteristics of the Modified Structure of the Sub-Ballast Layers
2.3.4. Numerical Thermal Analysis of Structures
3. Results and Discussion
3.1. Bearing Capacity of the Sub-Ballast Layers
3.2. Validation of Thermal Numerical Model
3.3. Nomogram for the Design of the Modified Construction of Railway Sub-Ballast Layers
- if IF ≤ 800 °C, day, θm ≥ 5 °C, XPS plates of thickness 0.05 m are required up to 1.85 m from the edge of the embankment slope;
- if IF ≤ 1000 °C, day, θm ≥ 3 °C, XPS plates of thickness 0.06 m are required up to 2.50 m from the edge of the embankment slope;
- if IF ≤ 1200 °C, day, θm ≥ 2 °C, XPS plates of thickness 0.08 m are required up to 2.50 m from the edge of the embankment slope;
- if IF ≤ 1400 °C, day, θm ≥ 2 °C, XPS plates of thickness 0.10 m are required up to 2.50 m from the edge of the embankment slope.
3.4. Mathematical Model for the Design of the Modified Structure of the Sub-Ballast Layers
4. Conclusions
- Application of composite FC in the railway sub-ballast layers makes it possible to increase its bearing capacity (see Figure 8). In case of a subgrade with sufficiently high bearing capacity (static modulus of deformation E0 = 40 ± 2 MPa), it is possible through application of a composite FC layer of thickness 0.10 m to increase the value of static modulus of deformation after 28 days of its maturation twice (Emat > 80 MPa). After two winter periods, it is possible to detect up to 3.5 times the value of the original static modulus of deformation (Emat > 140 MPa) on the surface of composite foamed concrete. In the case of a subgrade with low bearing capacity (static modulus of deformation E0 = 10 ± 2 MPa), it is possible through application of a composite FC layer of thickness 0.15 m to increase the value of static modulus of deformation after 28 days of its maturation by ten-times (Emat > 100 MPa). After two winter periods, it is possible to detect up to 18 times the value of the original static modulus of deformation (Emat > 180 MPa) on the surface of composite FC. The use of composite FC therefore seems to be suitable especially in the case of subgrades with low bearing capacity, where a reduction in the thickness of the sub-ballast (saving natural materials—gravels or gravel-sand) and a long-term guarantee of the required geometric position of the track is expected according to [100].
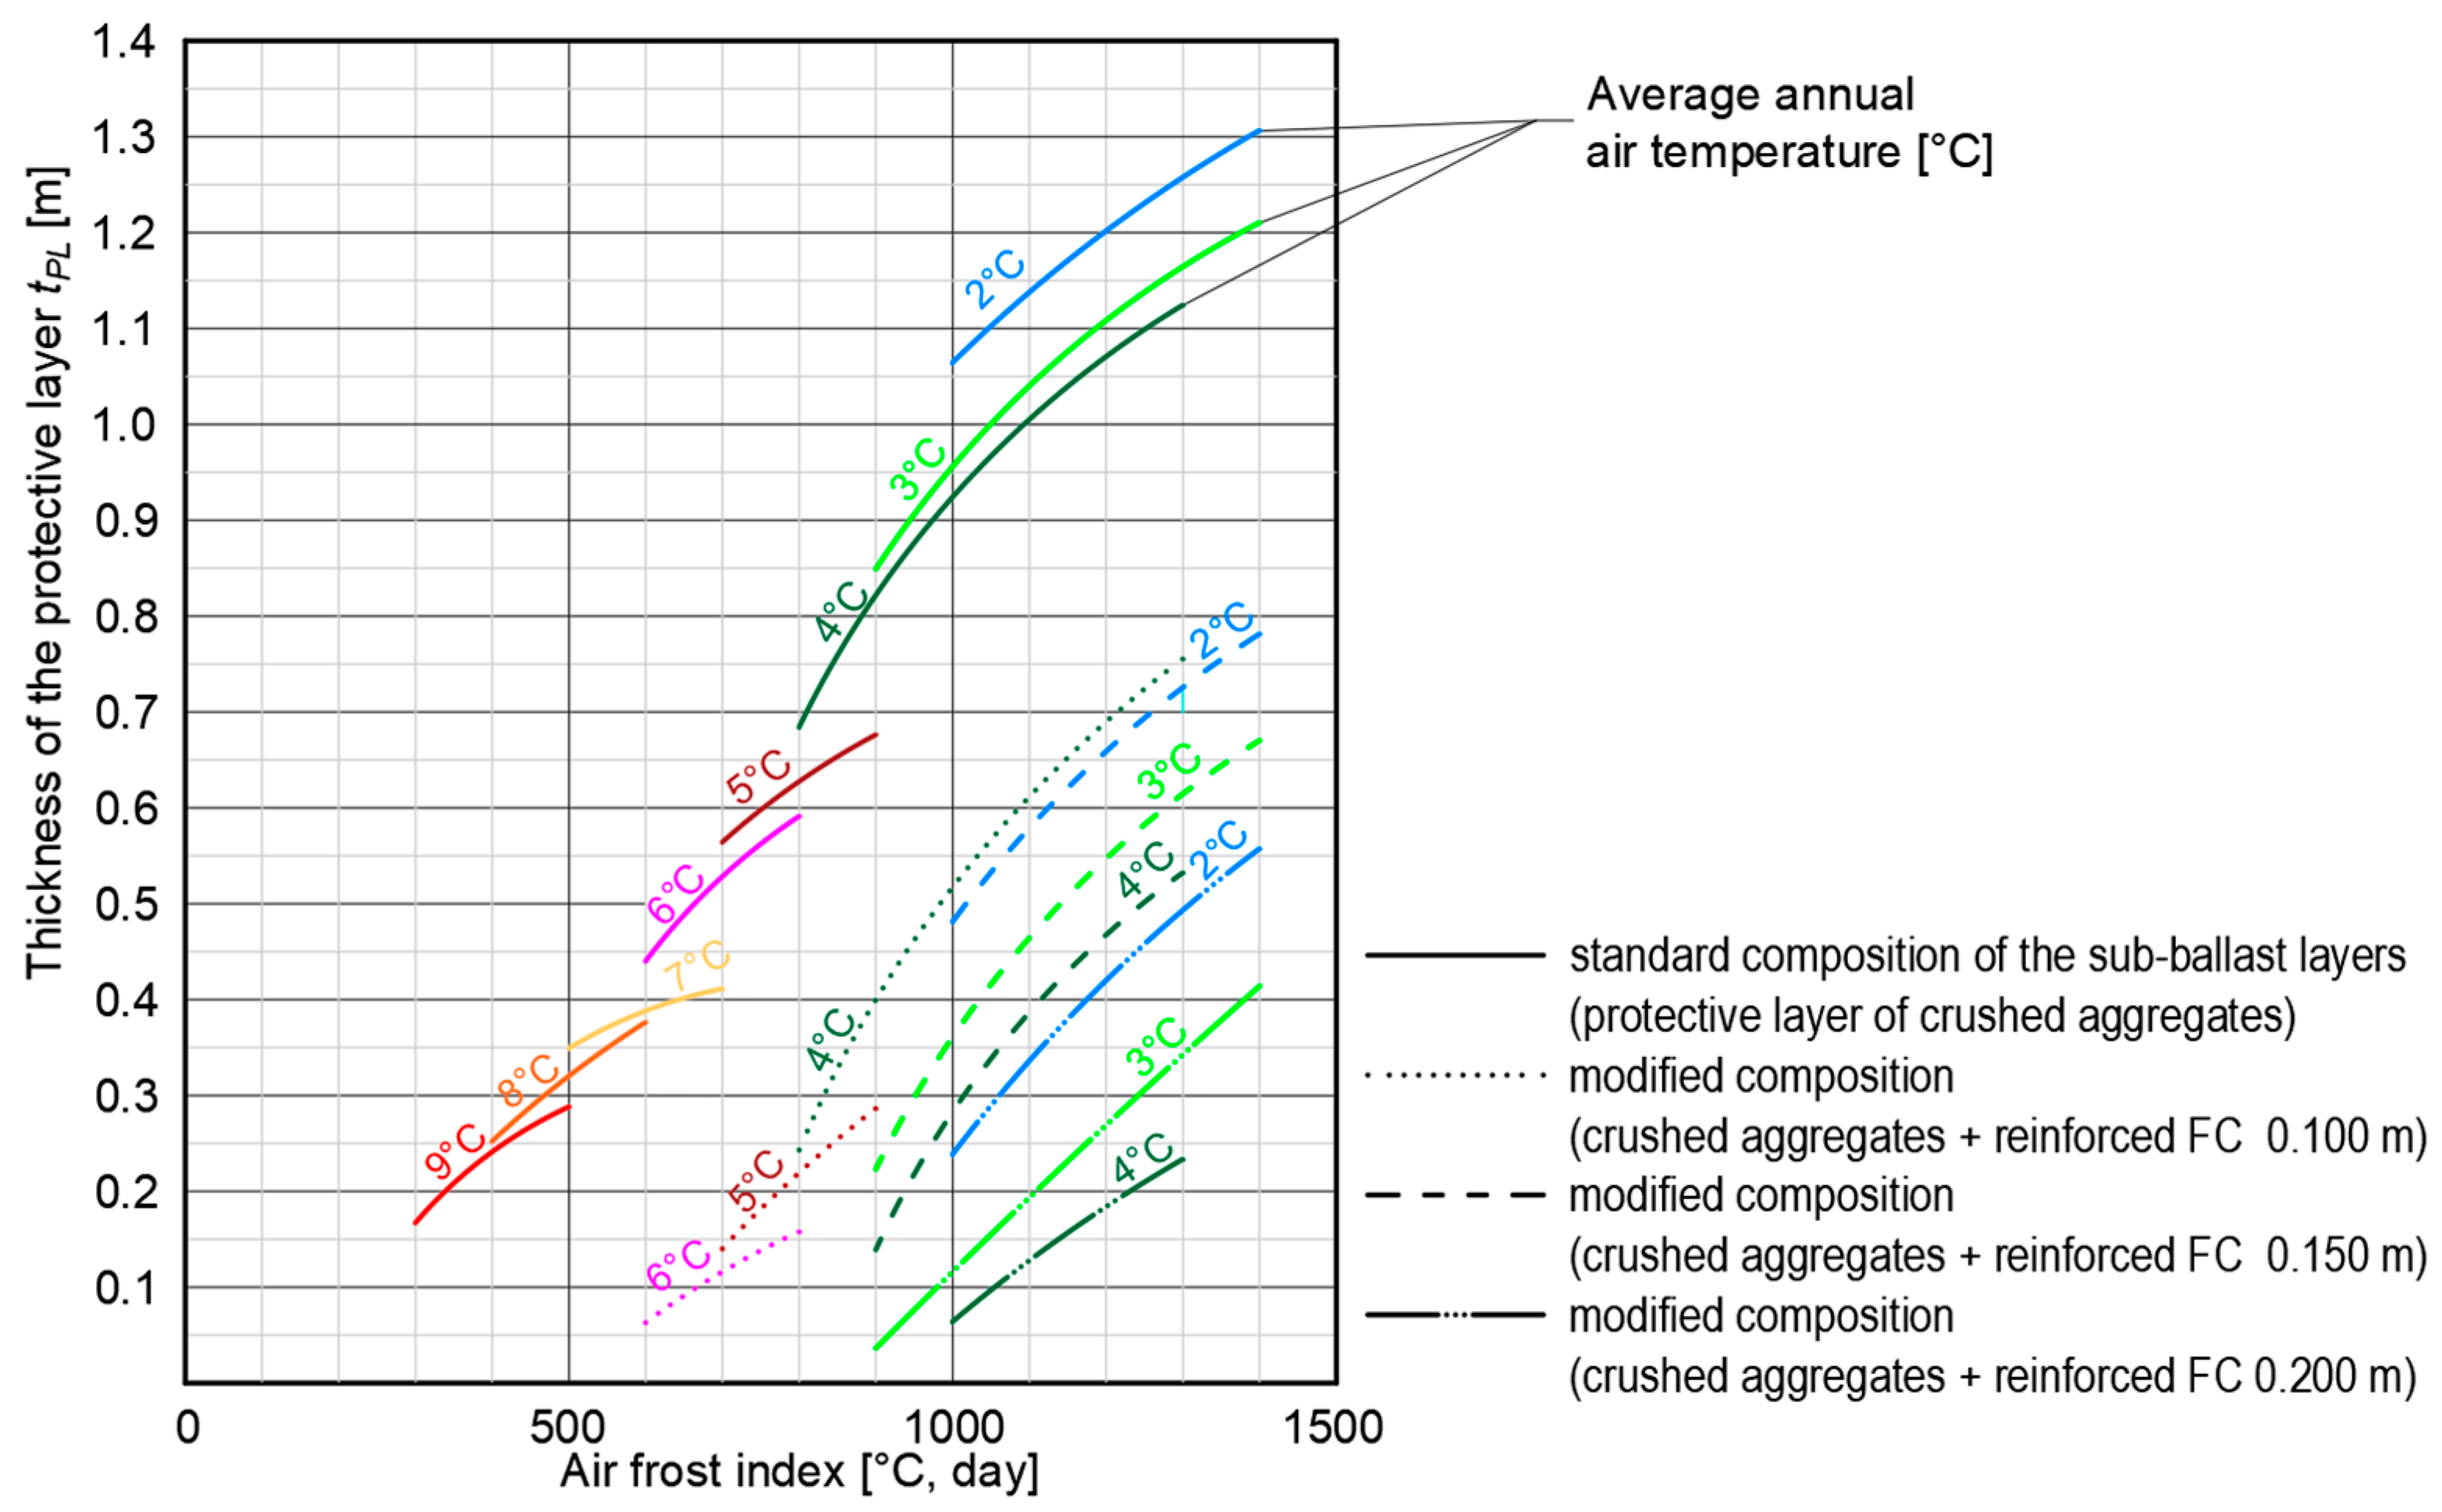
- The system of the modified construction of the sub-ballast layers for the double-track railway (application of composite foamed concrete—see Figure 8 and Figure 9) allows a significant reduction of the protective layer consisting of natural materials (crushed aggregates or gravel-sand), especially in areas with unfavorable climate conditions (IF > 1000 °C, day and θm < 4 °C). For example, for air freezing index IF = 1000 °C, day and average annual air temperature θm = 3 °C it is possible to save a thickness of 0.60 m of natural materials and replace the crushed aggregate or gravel-sand layer with a layer of composite foamed concrete of thickness 0.15 m. In case of air freezing index IF = 1400 °C, day and average annual air temperature θm = 2 °C, it is possible to save a thickness of 0.75 m of natural resources and replace these with a layer of composite foamed concrete with a thickness of 0.20 m (see Figure 15).
- In the case of a combination of freezing susceptible soils in the subgrade surface of the railway line and unfavorable environmental conditions (IF > 600 °C, day and θm < 6 °C), there is a significant penetration of frost to the subgrade surface from the track bench and the slope of the embankment. In order to protect the subgrade surface from freezing, it is necessary to ensure that the zero-degree isotherm does not fall below the subgrade surface level in the entire active zone of the traffic load. For example, as depicted in Figure 12b, it is possible to observe that in the area of the track axis there was no freezing of the subgrade surface, but at the end of the active zone (in this case it is about 2.50 m from the track axis), significant freezing can be seen. For this reason, in addition to composite FC, it is appropriate to apply XPS plates (Figure 13) in the structural composition of the railway sub-ballast layers, which will prevent this unfavorable phenomenon.
- Due to greater savings of natural resources (gravels or crushed aggregates), a different way of implementing the design of the sub-ballast upper surface (horizontal—Figure 10 or in a roof-like 5% slope—Figure 14) was assessed within the numerical modelling. From the point of view of the protection of the subgrade surface against freezing in the area of the active zone of the traffic load, both of these cases of implementation can be considered practically equivalent. Figure 14 (numerical model No. 4 with a roof-like way of implementing the sub-ballast upper surface design) was therefore chosen as a reference (allows greater savings of sub-ballast materials and at the same time increasing the volume of material behind the sleepers leads to better contactless track stability).
- The nomogram shown in Figure 15 was created to determine the required construction thickness of composite FC and the protective layer of crushed aggregates depending on the climate conditions (non-traffic load). In addition, to protect the subgrade surface against freezing in the entire active zone, it is also necessary to design different thicknesses and locations of the XPS plates. The detailed design procedure is described in Section 3.
- The relations given in Section 4 (Equations (10)–(21)) were determined to estimate the freezing depth of the railway structure or the required thickness of the protective layer of crushed aggregate for the standard structure of the sub-ballast layers (without the use of thermal insulation material in the sub-ballast layers) or for the modified structure of the sub-ballast layers (installation of 0.10 m, 0.15 m, or 0.20 m thick composite FC layers). Within the design, it is necessary to take into account the boundary conditions of the calculation, as during the course of winter period at the value of the air freezing index IF = 900 °C, day, there is a change in the relations for calculating the necessary parameters.
Author Contributions
Funding
Institutional Review Board Statement
Informed Consent Statement
Data Availability Statement
Acknowledgments
Conflicts of Interest
References
- Torres, J.; Olafsen, S.; Fernandez, E.T. Noise from Urban Transport, Noise Emission of Trams. In Internoise 2019, Proceedings of the 48th International Congress and Exhibition on Noise Control Engineering, Madrid, Spain, 16–19 June 2019; Calvo-Manzano, A., Ed.; Spanish Acoustical Society: Madrid, Spain, 2019; Available online: http://www.sea-acustica.es/fileadmin/INTERNOISE_2019/Fchrs/Proceedings/1499.pdf (accessed on 15 October 2021).
- Republic of Slovenia Statistical Office. Available online: https://www.stat.si/StatWeb/en/News/Index/9805 (accessed on 15 October 2021).
- Liu, C.; Thompson, D.; Griffin, M.J.; Entezami, M. Effect of train speed and track geometry on the ride comfort in high-speed railways based on ISO 2631-1. Proc. Inst. Mech. Eng. Part F J. Rail Rapid Transit 2019, 234, 765–778. [Google Scholar] [CrossRef]
- Naeini, M.; Mohammadinia, A.; Arulrajah, A.; Horpibulsuk, S. Recycled Glass Blends with Recycled Concrete Aggregates in Sustainable Railway Geotechnics. Sustainability 2021, 13, 2463. [Google Scholar] [CrossRef]
- Tawk, M.; Qi, Y.; Indraratna, B.; Rujikiatkamjorn, C.; Heitor, A. Behavior of a Mixture of Coal Wash and Rubber Crumbs under Cyclic Loading. J. Mater. Civ. Eng. 2021, 33, 04021054. [Google Scholar] [CrossRef]
- Indraratna, B.; Qi, Y.; Jayasuriya, C.; Rujikiatkamjorn, C.; Arachchige, C.M. Use of recycled rubber inclusions with granular waste for enhanced track performance. Transp. Eng. 2021, 6, 100093. [Google Scholar] [CrossRef]
- Ižvolt, L.; Dobeš, P.; Holešová, M.; Navikas, D. Numerical modelling of thermal regime of railway track-structure with thermal insulation (styrodur). J. Civ. Eng. Manag. 2021, 27, 525–538. [Google Scholar] [CrossRef]
- Esveld, C.; Markine, V. Use of expanded polystyrene (EPS) sub-base in railway track design. In Structures for High-Speed Railway Transportation; IABSE Symposium: Antwerp, Belgium, 2003; pp. 1–6. [Google Scholar]
- Woodward, P.K.; El Kacimi, A.; Laghrouche, O.; Medero, G.; Banimahd, M. Application of polyurethane geocomposites to help maintain track geometry for high-speed ballasted railway tracks. J. Zhejiang Univ. A 2012, 13, 836–849. [Google Scholar] [CrossRef]
- BASF. Styrodur. Technical Data. Application, Recommendations, Dimensioning Aids. 2019. Available online: https://www.styrodur.com/portal/streamer?fid=1225078 (accessed on 15 October 2021).
- Ižvolt, L.; Dobeš, P.; Mečár, M. Testing the suitability of the extruded polystyrene (styrodur) application in the track substructure. Acta Polytech. 2020, 60, 243–251. [Google Scholar] [CrossRef]
- Nurmikolu, A.; Kolisoja, P. Extruded polystyrene (XPS) foam frost insulation boards in railway structures. In Proceedings of the 16th International Conference on Soil Mechanics and Geotechnical Engineering, Osaka, Japan, 12–15 September 2005; pp. 1761–1764. [Google Scholar] [CrossRef]
- Sadrinezhad, A.; Tehrani, F.M.; Jeevanlal, B. Shake Table Test of Railway Embankment Consisting of TDA and LECA. In Proceedings of the Eighth International Conference on Case Histories in Geotechnical Engineering (Geo-Congress 2019), Philadelphia, PA, USA, 24–27 March 2019; pp. 31–39. [Google Scholar] [CrossRef]
- Loranger, B.; Kuznetsova, E.; Hoff, I.; Aksnes, J.; Skoglund, K.A. Evaluation of Norwegian gradation based regulation for frost susceptibility of crushed rock aggregates in roads and railways. In Bearing Capacity of Roads, Railways and Airfields; Sha, A., Liu, Z., Zhao, W., Hu, L., Wang, J., Han, Z., Eds.; CRC Press: Boca Raton, FL, USA, 2017; pp. 2077–2085. [Google Scholar] [CrossRef]
- Lazorenko, G.; Kasprzhitskii, A.; Kukharskii, A.; Kochur, A.; Yavna, V. Failure analysis of widened railway embankment with different reinforcing measures under heavy axle loads: A comparative FEM study. Transp. Eng. 2020, 2, 100028. [Google Scholar] [CrossRef]
- Das, B.M. Use of geogrid in the construction of railroads. Innov. Infrastruct. Solut. 2016, 1, 1–12. [Google Scholar] [CrossRef]
- Zaki, M.F.M.; Ramli, M.F.; Ayob, A.; Ahmad, M.T. Analysis of Raft Foundation with EPS Geofoam for Earthquake Resistant. Appl. Mech. Mater. 2014, 695, 613–616. [Google Scholar] [CrossRef]
- Sulong, N.H.R.; Mustapa, S.A.S.; Rashid, M.K.A. Application of expanded polystyrene (EPS) in buildings and constructions: A review. J. Appl. Polym. Sci. 2019, 136, 47529. [Google Scholar] [CrossRef]
- Siabil, S.M.A.G.; Tafreshi, S.N.M.; Dawson, A.R.; Omran, M.P. Behavior of expanded polystyrene (EPS) blocks under cyclic pavement foundation loading. Geosynth. Int. 2019, 26, 1–25. [Google Scholar] [CrossRef]
- Othuman, A.; Wang, Y. Elevated-temperature thermal properties of lightweight foamed concrete. Constr. Build. Mater. 2011, 25, 705–716. [Google Scholar] [CrossRef]
- Tada, S. Material design of aerated concrete—An optimum performance design. Mater. Struct. 1986, 19, 21–26. [Google Scholar] [CrossRef]
- Kim, H.-K.; Jeon, J.; Lee, H. Workability, and mechanical, acoustic and thermal properties of lightweight aggregate concrete with a high volume of entrained air. Constr. Build. Mater. 2012, 29, 193–200. [Google Scholar] [CrossRef]
- Huang, Z.; Zhang, T.; Wen, Z. Proportioning and characterization of Portland cement-based ultra-lightweight foam concretes. Constr. Build. Mater. 2015, 79, 390–396. [Google Scholar] [CrossRef]
- Amran, Y.M.; Farzadnia, N.; Ali, A.A. Properties and applications of foamed concrete; a review. Constr. Build. Mater. 2015, 101, 990–1005. [Google Scholar] [CrossRef]
- Ramamurthy, K.; Nambiar, E.K.; Ranjani, G.I.S. A classification of studies on properties of foam concrete. Cem. Concr. Compos. 2009, 31, 388–396. [Google Scholar] [CrossRef]
- Zhang, Z.; Provis, J.; Reid, A.; Wang, H. Mechanical, thermal insulation, thermal resistance and acoustic absorption properties of geopolymer foam concrete. Cem. Concr. Compos. 2015, 62, 97–105. [Google Scholar] [CrossRef]
- Sun, H.; Wang, Q.; Zhang, P.; Zhong, Y.; Yue, X. Spatialtemporal Characteristics of Tunnel Traffic Accidents in China from 2001 to Present. Adv. Civ. Eng. 2019, 2019, 4536414. [Google Scholar] [CrossRef]
- Wang, L.; Li, C.; Qiu, J.; Wang, K.; Liu, T.; Li, H. Treatment and Effect of Loess Metro Tunnel under Surrounding Pressure and Water Immersion Environment. Geofluids 2020, 2020, 7868157. [Google Scholar] [CrossRef]
- Li, Y.; Sun, Y.; Qiu, J.; Liu, T.; Yang, L.; She, H. Moisture absorption characteristics and thermal insulation performance of thermal insulation materials for cold region tunnels. Constr. Build. Mater. 2019, 237, 117765. [Google Scholar] [CrossRef]
- Tarasov, A.; Kearsley, E.; Kolomatskiy, A.; Mostert, H. Heat evolution due to cement hydration in foamed concrete. Mag. Concr. Res. 2010, 62, 895–906. [Google Scholar] [CrossRef]
- Li, X.; Qi, C.; Zhang, P. A micro-macro confined compressive fatigue creep failure model in brittle solids. Int. J. Fatigue 2019, 130, 105278. [Google Scholar] [CrossRef]
- Zhang, Z.; Yang, J. Improving safety of runway overrun through foamed concrete aircraft arresting system: An experimental study. Int. J. Crashworthiness 2015, 20, 448–463. [Google Scholar] [CrossRef]
- Hájek, M.; Decký, M. Homomorphic Model Pavement with Sub Base Layer of Foam Concrete. In Proceedings of the 12th International Scientific Conference of Young Scientists on Sustainable, Modern and Safe Transport (TRANSCOM 2017), High Tatras, Slovakia, 31 May–2 June 2017; Volume 192, pp. 283–288. [Google Scholar] [CrossRef]
- Valašková, V.; Vlček, J. Stress Response Analysis of Concrete Pavement Under Tire of Heavy Vehicle. Civ. Environ. Eng. 2018, 14, 146–152. [Google Scholar] [CrossRef]
- Tian, W.; Li, L.; Zhao, X.; Zhou, M.; Wang, N. Application of Foamed Concrete in Road Engineering. In Proceedings of the Second International Conference on Transportation Engineering, Chengdu, China, 25–27 July 2009; Southwest Jiaotong University: Chengdu, China, 2009. [Google Scholar] [CrossRef]
- Huang, J.-J.; Su, Q.; Zhao, W.-H.; Li, T.; Zhang, X.-X. Experimental study on use of lightweight foam concrete as subgrade bed filler of ballastless track. Constr. Build. Mater. 2017, 149, 911–920. [Google Scholar] [CrossRef]
- Li, T.; Chen, F.; Li, Z. Lightweight Foamed Concrete Subgrade for Heavy Haul Railway. Geosynth. 2020. Available online: https://www.geosynthetica.com/lightweight-foamed-concrete-subgrade-railways (accessed on 15 October 2021).
- Liu, K.-W.; Yue, F.; Su, Q.; Zhou, C.; Xiong, Z.; He, Y. Assessment of the use of fiberglass-reinforced foam concrete in high-speed railway bridge approach involving foundation cost comparison. Adv. Struct. Eng. 2019, 23, 388–396. [Google Scholar] [CrossRef]
- IWtech. Available online: https://www.iwtech.sk/vysledky (accessed on 15 October 2021).
- Łach, M. Geopolymer Foams—Will They Ever Become a Viable Alternative to Popular Insulation Materials?—A Critical Opinion. Materials 2021, 14, 3568. [Google Scholar] [CrossRef]
- Valašková, V.; Vlček, J. Laboratory and In situ Investigation of Modulus of Elasticity of Foam Concrete. E3S Web Conf. 2020, 157, 06013. [Google Scholar] [CrossRef]
- Izvolt, L.; Dobes, P.; Mecar, M. Testing the Suitability of the Reinforced Foam Concrete Layer Application in the Track Bed Structure. IOP Conf. Ser. Mater. Sci. Eng. 2019, 661, 012014. [Google Scholar] [CrossRef]
- Valaskova, V.; Vlcek, J.; Gago, F.; Drusa, M. Dynamic testing of the sub-base layer made from foam concrete using light weight deflectometer. Vibroengineering Procedia 2019, 25, 139–142. [Google Scholar] [CrossRef][Green Version]
- Xu, Q.; Sun, H.; Wang, L.; Xu, L.; Chen, W.; Lou, P. Influence of Vehicle Number on the Dynamic Characteristics of High-Speed Train-CRTS III Slab Track-Subgrade Coupled System. Materials 2021, 14, 3662. [Google Scholar] [CrossRef]
- Hájek, M.; Decký, M.; Scherfel, W. Objectification of Modulus Elasticity of Foam Concrete Poroflow 17-5 on the Subbase Layer. Civ. Environ. Eng. 2016, 12, 55–62. [Google Scholar] [CrossRef]
- Drusa, M. Testing of foam concrete for definition of layer interacting with subsoil in geotechnical applications. Int. J. Geomate 2019, 17. [Google Scholar] [CrossRef]
- Han, S.H.; Hwang, S.H.; Kim, H.J.; Cho, S.J.; Lim, N.H. Numerical study on the characteristics of temperature distribution in continuous welded rail by solar radiation and rail orientation. J. Mech. Sci. Technol. 2020, 34, 4819–4829. [Google Scholar] [CrossRef]
- Hong, S.U.; Kim, H.U.; Lim, N.H.; Kim, K.H.; Kim, H.; Cho, S.J. A Rail-Temperature-Prediction Model Considering Meteorological Conditions and the Position of the Sun. Int. J. Precis. Eng. Manuf. 2019, 20, 337–346. [Google Scholar] [CrossRef]
- Chapman, L.; Thornes, J.E.; Huang, Y.; Cai, X.; Sanderson, V.L.; White, S.P. Modelling of rail surface temperatures: A preliminary study. Theor. Appl. Clim. 2007, 92, 121–131. [Google Scholar] [CrossRef]
- Gao, M.; Su, C.; Cong, J.; Yang, F.; Wang, Y.; Wang, P. Harvesting thermoelectric energy from railway track. Energy 2019, 180, 315–329. [Google Scholar] [CrossRef]
- Van Dijk, S. Foam Concrete. Concrete 1991, 25, 49–54. Available online: https://trid.trb.org/view/373199 (accessed on 15 October 2021).
- Karakurt, C.; Kurama, H.; Topçu, I.B. Utilization of natural zeolite in aerated concrete production. Cem. Concr. Compos. 2010, 32, 1–8. [Google Scholar] [CrossRef]
- Kočí, V.; Maděra, J.; Cerny, R. Computer aided design of interior thermal insulation system suitable for autoclaved aerated concrete structures. Appl. Therm. Eng. 2013, 58, 165–172. [Google Scholar] [CrossRef]
- Shang, H.-S.; Song, Y.-P. Triaxial compressive strength of air-entrained concrete after freeze–thaw cycles. Cold Reg. Sci. Technol. 2013, 90–91, 33–37. [Google Scholar] [CrossRef]
- Luca Industries International. LITHOPORE 75-150. Available online: http://www.dr-luca.de/pages/en/lithopore_building_solution/lithopore75_150/index.html (accessed on 15 October 2021).
- Fu, Y.; Wang, X.; Wang, L.; Li, Y. Foam Concrete: A State-of-the-Art and State-of-the-Practice Review. Adv. Mater. Sci. Eng. 2020, 2020, 6153602. [Google Scholar] [CrossRef]
- Valore, R.C. Cellular Concrete Part 1 Composition and Methods of Production. ACI J. Proc. 1954, 50, 773–796. Available online: https://www.concrete.org/publications/internationalconcreteabstractsportal/m/details/id/11794 (accessed on 15 October 2021).
- Valore, R.C. Cellular Concrete Part 2 Physical Properties. ACI J. Proc. 1954, 50, 817–836. Available online: https://www.concrete.org/publications/internationalconcreteabstractsportal/m/details/id/11795 (accessed on 15 October 2021).
- Dhir, R.K.; Newlands, M.D.; McCarthy, A. Use of Foamed Concrete in Construction. In Proceedings of the Conference Held at the University of Dundee, Scotland, UK, 5 July 2005; Thomas Telford: Dundee, UK, 2005. [Google Scholar]
- Yu, W.; Liang, X.; Ni, F.M.-W.; Oyeyi, A.G.; Tighe, S. Characteristics of Lightweight Cellular Concrete and Effects on Mechanical Properties. Materials 2020, 13, 2678. [Google Scholar] [CrossRef]
- Ma, C.; Chen, B. Experimental study on the preparation and properties of a novel foamed concrete based on magnesium phosphate cement. Constr. Build. Mater. 2017, 137, 160–168. [Google Scholar] [CrossRef]
- Falliano, D.; De Domenico, D.; Ricciardi, G.; Gugliandolo, E. Experimental investigation on the compressive strength of foamed concrete: Effect of curing conditions, cement type, foaming agent and dry density. Constr. Build. Mater. 2018, 165, 735–749. [Google Scholar] [CrossRef]
- Sun, C.; Zhu, Y.; Guo, J.; Zhang, Y.; Sun, G. Effects of foaming agent type on the workability, drying shrinkage, frost resistance and pore distribution of foamed concrete. Constr. Build. Mater. 2018, 186, 833–839. [Google Scholar] [CrossRef]
- Kadela, M.; Kukiełka, A.; Małek, M. Characteristics of Lightweight Concrete Based on a Synthetic Polymer Foaming Agent. Materials 2020, 13, 4979. [Google Scholar] [CrossRef] [PubMed]
- Hilal, A.A.; Thom, N.H.; Dawson, A.R. On entrained pore size distribution of foamed concrete. Constr. Build. Mater. 2015, 75, 227–233. [Google Scholar] [CrossRef]
- Nguyen, T.T.; Bui, H.H.; Ngo, T.D.; Nguyen, G.D. Experimental and numerical investigation of influence of air-voids on the compressive behaviour of foamed concrete. Mater. Des. 2017, 130, 103–119. [Google Scholar] [CrossRef]
- Chung, S.-Y.; Lehmann, C.; Elrahman, M.A.; Stephan, D. Pore Characteristics and Their Effects on the Material Properties of Foamed Concrete Evaluated Using Micro-CT Images and Numerical Approaches. Appl. Sci. 2017, 7, 550. [Google Scholar] [CrossRef]
- Namsone, E.; Šahmenko, G.; Korjakins, A.; Namsone, E. Influence of Porous Aggregate on the Properties of Foamed Concrete. Constr. Sci. 2016, 19, 13–20. [Google Scholar] [CrossRef]
- Zhang, X.; Yang, Q.; Li, Q.; Chen, H.; Zheng, G.; Cheng, X. Effect of Phenolic Particles on Mechanical and Thermal Conductivity of Foamed Sulphoaluminate Cement-Based Materials. Materials 2019, 12, 3596. [Google Scholar] [CrossRef] [PubMed]
- Chung, S.-Y.; Sikora, P.; Stephan, D.; Elrahman, M.A.A. The Effect of Lightweight Concrete Cores on the Thermal Performance of Vacuum Insulation Panels. Materials 2020, 13, 2632. [Google Scholar] [CrossRef]
- Kozłowski, M.; Kadela, M. Mechanical Characterization of Lightweight Foamed Concrete. Adv. Mater. Sci. Eng. 2018, 2018, 6801258. [Google Scholar] [CrossRef]
- Rommel, E.; Prasetyo1, L.; Rusdianto, Y.; Karimah, R.; Riyanto, A.; Cahyo, S.N. The insulation properties of foam concrete with the use of foam-agent and fly-ash. IOP Conf. Ser. Mater. Sci. Eng. 2020, 821, 012013. [Google Scholar] [CrossRef]
- Lesovik, V.; Voronov, V.; Glagolev, E.; Fediuk, R.; Alaskhanov, A.; Amran, Y.M.; Murali, G.; Baranov, A. Improving the behaviors of foam concrete through the use of composite binder. J. Build. Eng. 2020, 31, 101414. [Google Scholar] [CrossRef]
- Wongkvanklom, A.; Posi, P.; Kasemsiri, P.; Sata, V.; Cao, T.; Chindaprasirt, P. Strength, Thermal Conductivity and Sound Absorption of Cellular Lightweight High Calcium Fly Ash Geopolymer Concrete. Eng. Appl. Scie. Res. 2021, 48, 487–496. Available online: https://ph01.tci-thaijo.org/index.php/easr/article/view/243363 (accessed on 15 October 2021).
- Kozłowski, M.; Kadela, M.; Kukiełka, A. Fracture Energy of Foamed Concrete Based on Three-Point Bending Test on Notched Beams. Procedia Eng. 2015, 108, 349–354. [Google Scholar] [CrossRef]
- Amran, M.; Fediuk, R.; Vatin, N.; Lee, Y.H.; Murali, G.; Ozbakkaloglu, T.; Klyuev, S.; Alabduljabber, H. Fibre-Reinforced Foamed Concretes: A Review. Materials 2020, 13, 4323. [Google Scholar] [CrossRef] [PubMed]
- Huang, J.; Tian, G.; Huang, P.; Chen, Z. Flexural Performance of Sisal Fiber Reinforced Foamed Concrete under Static and Fatigue Loading. Materials 2020, 13, 3098. [Google Scholar] [CrossRef] [PubMed]
- Castillo-Lara, J.F.; Flores-Johnson, E.A.; Valadez-Gonzalez, A.; Herrera-Franco, P.J.; Carrillo, J.G.; Gonzalez-Chi, P.I.; Li, Q.M. Mechanical Properties of Natural Fiber Reinforced Foamed Concrete. Materials 2020, 13, 3060. [Google Scholar] [CrossRef]
- Wang, X.; Liu, L.; Shen, W.; Zhou, H. CFRP Reinforced Foam Concrete Subjected to Dynamic Compression at Medium Strain Rate. Materials 2019, 13, 10. [Google Scholar] [CrossRef] [PubMed]
- Krzywoń, R.; Dawczyński, S. Strength Parameters of Foamed Geopolymer Reinforced with GFRP Mesh. Materials 2021, 14, 689. [Google Scholar] [CrossRef]
- Short, A.; Kinniburgh, W. Lightweight Concrete; Asia Publishing House: Delhi, India, 1963. [Google Scholar]
- Lee, H.-S.; Ismail, M.A.; Woo, Y.-J.; Min, T.-B.; Choi, H.-K. Fundamental Study on the Development of Structural Lightweight Concrete by Using Normal Coarse Aggregate and Foaming Agent. Materials 2014, 7, 4536–4554. [Google Scholar] [CrossRef]
- Othman, R.; Jaya, R.; Muthusamy, K.; Sulaiman, M.; Duraisamy, Y.; Abdullah, M.; Przybył, A.; Sochacki, W.; Skrzypczak, T.; Vizureanu, P.; et al. Relation between Density and Compressive Strength of Foamed Concrete. Materials 2021, 14, 2967. [Google Scholar] [CrossRef]
- Flores-Johnson, E.A.; Company-Rodríguez, B.A.; Koh-Dzul, J.F.; Carrillo, J.G. Shaking Table Test of U-Shaped Walls Made of Fiber-Reinforced Foamed Concrete. Materials 2020, 13, 2534. [Google Scholar] [CrossRef]
- Kadela, M.; Kozłowski, M.; Kukiełka, A. Application of Foamed Concrete in Road Pavement–Weak Soil System. Procedia Eng. 2017, 193, 439–446. [Google Scholar] [CrossRef]
- Kadela, M.; Kozłowski, M. Foamed Concrete Layer as Sub-structure of Industrial Concrete Floor. Procedia Eng. 2016, 161, 468–476. [Google Scholar] [CrossRef]
- Decký, M.; Drusa, M.; Zgútová, K.; Blaško, M.; Hájek, M.; Scherfel, W. Foam Concrete as New Material in Road Constructions. Procedia Eng. 2016, 161, 428–433. [Google Scholar] [CrossRef]
- Vlcek, J.; Drusa, M.; Scherfel, W.; Sedlar, B. Experimental Investigation of Properties of Foam Concrete for Industrial Floors in Testing Field. IOP Conf. Ser. Earth Environ. Sci. 2017, 95, 022049. [Google Scholar] [CrossRef]
- Lee, Y.L.; Goh, K.S.; Koh, H.B.; Ismail, B. Foamed aggregate pervious concrete—An option for road on peat. In Proceedings of the Malaysian Technical Universities Conference on Engineering and Technology (MUCEET 2009), MS Garden, Kuantan, Malaysia, 20–22 June 2009; Universiti Malaysia Pahang: Pekan, Malezja, 2009; Available online: http://dspace.unimap.edu.my/123456789/8705 (accessed on 15 October 2021).
- ASTM C29/C29M-07 Standard Test Method for Bulk Density ("Unit Weight") and Voids in Aggregate; ASTM International: West Conshohocken, PA, USA, 2007.
- EN 12390-7:2019/AC:2020-Testing Hardened Concrete-Part 7: Density of Hardened Concrete; European Parliament: Strasburg, France, 2020.
- EN 12390-13:2021-Testing Hardened Concrete-Part 13: Determination of Secant Modulus of Elasticity in Compression; European Parliament: Strasburg, France, 2021.
- EN 12390-3:2019-Testing Hardened Concrete-Part 3: Compressive Strength of Test Specimens; European Parliament: Strasburg, France, 2019.
- EN 12390-5:2019-Testing Hardened Concrete-Part 5: Flexural Strength of Test Specimens; European Parliament: Strasburg, France, 2019.
- Filtek. Property Statement No. 14/20/2018-04-30. Available online: https://cdn1.idek.cz/dek/document/1656372044 (accessed on 15 December 2021).
- Proposed Construction Design of the Subgrade Layers (TNŽ 73 6312); Directorate General of the Railways of the Slovak Republic: Bratislava, Slovakia, 2005. (In Slovak)
- ORLIBIT, s.r.o. Available online: https://orlitech.cz/site/ (accessed on 15 October 2021).
- Dobeš, P. Optimization of the Design of Sleeper Subgrade. Ph.D. Thesis, University of Žilina, Žilina, Slovakia, 2015. (In Slovak). [Google Scholar]
- Pieš, J. Numerical and Experimental Analysis of the Impact of Non-Traffic Load to the Construction Thickness of the Underlayment Protective Layer. Ph.D. Thesis, University of Žilina, Žilina, Slovakia, 2015. (In Slovak). [Google Scholar]
- Slovak Railway Regulation TS4, Track Substructure-Appendix 6; Directorate General of the Railways of the Slovak Republic: Bratislava, Slovakia, 2018. (In Slovak)
- Thode, R. 2D/3D Geothermal Modeling Software, Tutorial Manual; SVHEAT: Saskatoon, SK, Canada, 2012; Available online: https://manualzilla.com/doc/5907794/svheat-tutorial-manual (accessed on 15 October 2021).
- Rieksts, K.; Hoff, I.; Kuznetsova, E.; Côté, J. Laboratory investigations of thermal properties of crushed rock materials. In Bearing Capacity of Roads, Railways and Airfield; CRC Press: Boca Raton, FL, USA, 2017; pp. 143–149. [Google Scholar]
- Fredlund, M.; Haihua, L. 2D/3D Visualization Software, User’s Manual; ACUMESH: Saskatoon, SK, Canada, 2011. [Google Scholar]
- Zhou, S.; Wang, B.; Shan, Y. Review of research on high-speed railway subgrade settlement in soft soil area. Railw. Eng. Sci. 2020, 28, 129–145. [Google Scholar] [CrossRef]
- Guo, Y.; Zhai, W.M.; Sun, Y. A mechanical model of vehicle–slab track coupled system with differential subgrade settlement. Struct. Eng. Mech. 2018, 66, 15–25. [Google Scholar] [CrossRef]
- Guo, Y.; Zhai, W. Long-term prediction of track geometry degradation in high-speed vehicle–ballastless track system due to differential subgrade settlement. Soil Dyn. Earthq. Eng. 2018, 113, 1–11. [Google Scholar] [CrossRef]
- Wang, H.; Markine, V. Modelling of the long-term behaviour of transition zones: Prediction of track settlement. Eng. Struct. 2018, 156, 294–304. [Google Scholar] [CrossRef]
- Lenart, S.; Klompmaker, J. Geogrid reinforced railway embankment on soft soil–Experiences from 5 years of field monitoring. In Proceedings of the 10th International Conference on Geosynthetics, Berlin, Germany, 21–25 September 2014. [Google Scholar]
- Ižvolt, L.; Dobeš, P.; Pieš, J. Verification of boundary conditions of numerical modeling of the track substructure thermal regime–influence of the snow cover. J. Pol. Acad. Sci. 2018, 4, 51–60. [Google Scholar] [CrossRef]


| Material | Density (kg/m3) | Elasticity Modulus (MPa) | Poisson’s Ratio (−) | Compressive Strength (MPa) | Flexural Strength (kN/m) | Tensile Strength (kN/m) |
|---|---|---|---|---|---|---|
| Gravel fr. 31.5/63 mm | 1900 | - | 0.15 1 | - | - | - |
| Crushed aggregate fr. 0/31.5 mm | 1930 | - | 0.20 1 | - | - | - |
| Composite FC 600 | 600 | 1400 | 0.22 | 2.0 | 0.5 | - |
| Geofiltex 63/20 T | 200 ± 20 2 | - | - | - | - | 5.0 3 |
| Construction Layer/Material Characteristics | Ballast Bed—New | Protective Layer | Reinforcing, Thermal Insulation Layer | Levelling Layer | Subsoil |
|---|---|---|---|---|---|
| Material of the layer | gravel fr. 31.5/63 mm | crushed aggregate fr. 0/31.5 mm | composite FC 600 | crushed aggregate fr. 0/31.5 mm | clay |
| Bulk density (kg/m3) | 1900 | 1930 | 600 | 1930 | 1650 |
| Specific heat capacity (J/(kg·K)) | 980 | 1090 | 1100 | 1090 | 1095 |
| Thermal conductivity coefficient (W/(m·K)) | 0.7 | 1.73 | 0.25 | 1.73 | 1.55 |
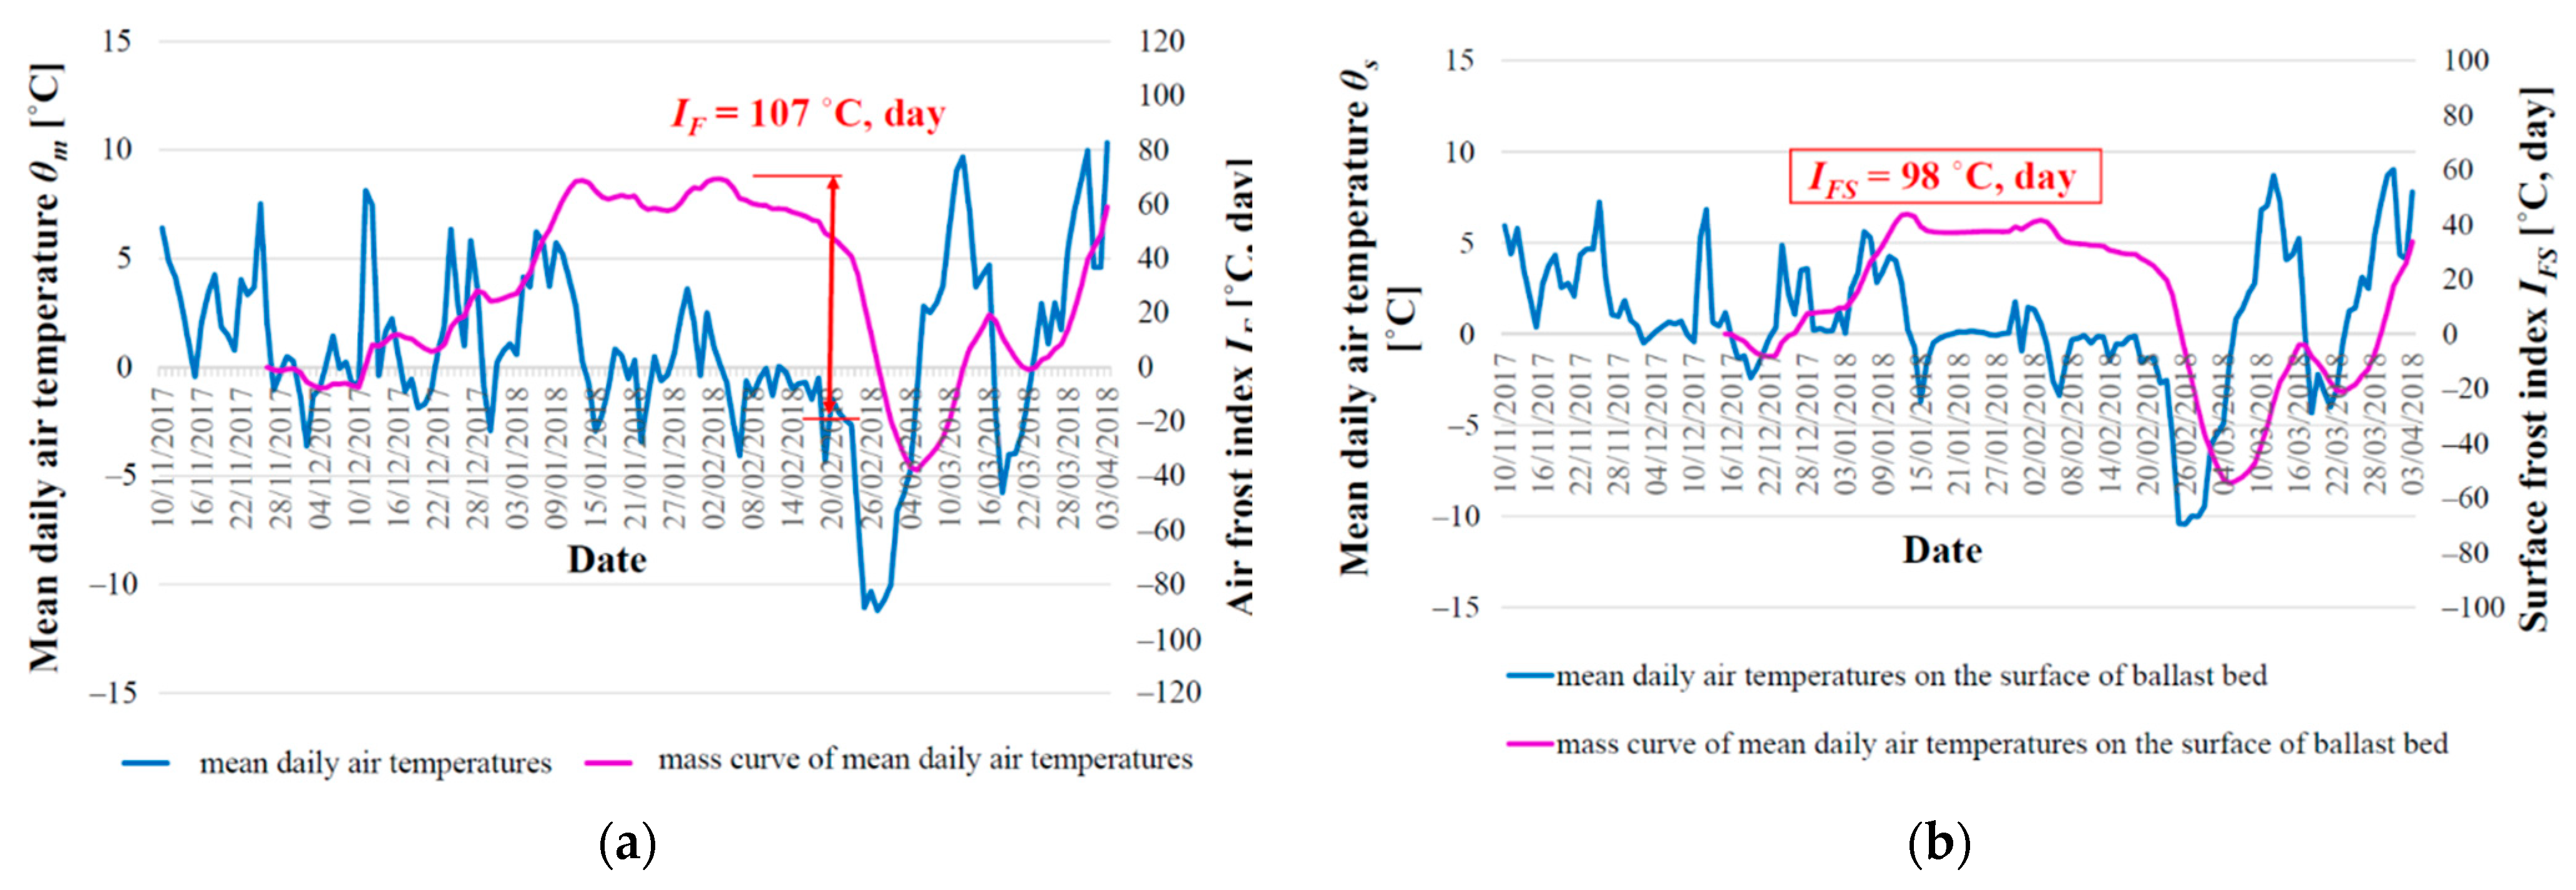
| Winter Period | θs,max (°C) | θs,min (°C) | θm (°C) | IF (°C, day) | IFs (°C, day) | DF (m) |
|---|---|---|---|---|---|---|
| 2017/2018 | 8.1 | −11.2 | 9.0 | 107 | 98 | 0.692 |
| Construction Layer/Material Characteristics | Ballast Bed—New | Protective Layer | Reinforcing, Thermal Insulation Layer | Levelling Layer | Subsoil |
|---|---|---|---|---|---|
| Material of the layer | gravel fr. 31.5/63 mm | crushed aggregate fr. 0/31.5 mm | composite FC 600 | crushed aggregate fr. 0/31.5 mm | clay |
| Temperature (°C) | −2 | 3 | 4 | 5 | 10 |
| Humidity (%) 1 | 1 | 5.5 | 30 | 5.5 | 26 |
| Date (Time in Numerical Model) | θ2 (°C) | θSVH,2 (°C) | ∆θ2 (°C) | θ3 (°C) | θSVH,3 (°C) | ∆θ3 (°C) | θ4 (°C) | θSVH,4 (°C) | ∆θ4 (°C) | θ5 (°C) | θSVH,5 (°C) | ∆θ5 (°C) |
|---|---|---|---|---|---|---|---|---|---|---|---|---|
| 4 Febuary 2018 (400) | 2.79 | 3.00 | 0.21 | 3.02 | 3.10 | 0.08 | 4.09 | 4.00 | −0.09 | 4.72 | 4.40 | −0.32 |
| 9 Febuary 2018 (405) | 1.76 | 1.90 | 0.14 | 2.04 | 2.00 | −0.04 | 3.56 | 3.40 | −0.16 | 4.38 | 3.90 | −0.48 |
| 14 Febuary 2018 (410) | 1.82 | 2.30 | 0.48 | 2.08 | 2.40 | 0.32 | 3.39 | 3.40 | 0.01 | 4.12 | 3.80 | −0.32 |
| 19 Febuary 2018 (415) | 1.62 | 2.10 | 0.48 | 1.90 | 2.30 | 0.40 | 3.24 | 3.30 | 0.06 | 3.94 | 3.70 | −0.24 |
| 24 Febuary 2018 (420) | 1.23 | 1.60 | 0.37 | 1.36 | 1.70 | 0.34 | 2.88 | 3.00 | 0.12 | 3.64 | 3.50 | −0.14 |
| 1 March 2018 (425) | −0.56 | −0.7 | −0.14 | −0.27 | −0.7 | −0.43 | 1.94 | 1.70 | −0.24 | 2.99 | 2.60 | −0.39 |
| 5 March 2018 (429) | −1.12 | −0.90 | 0.22 | −0.78 | −0.80 | −0.02 | 1.20 | 1.20 | 0.00 | 2.34 | 1.90 | −0.44 |
| 6 March 2018 (430) | −0.86 | −0.80 | 0.06 | −0.54 | −0.60 | −0.06 | 1.20 | 1.20 | 0.00 | 2.26 | 1.90 | −0.36 |
| 11 March 2018 (435) | 0.06 | 0.00 | −0.06 | 0.05 | 0.20 | 0.15 | 1.52 | 1.50 | −0.02 | 2.29 | 2.00 | −0.29 |
| 16 March 2018 (440) | 3.59 | 3.80 | 0.21 | 3.38 | 3.70 | 0.32 | 3.23 | 3.20 | −0.03 | 3.18 | 3.00 | −0.18 |
| 21 March 2018 (445) | 0.99 | 1.10 | 0.11 | 1.31 | 1.20 | −0.11 | 2.70 | 2.60 | −0.10 | 3.35 | 3.00 | −0.35 |
| 26 March 2018 (450) | 1.63 | 1.50 | −0.13 | 1.74 | 1.50 | −0.24 | 2.54 | 2.30 | −0.24 | 3.08 | 2.70 | −0.38 |
| Construction Layer/Material Characteristics | Ballast Bed—Moderate Pollution | Protective Layer | Reinforcing, Thermal Insulation Layer | Thermal Insulation Layer | Levelling Layer | Subsoil |
|---|---|---|---|---|---|---|
| Material of the layer | gravel fr. 31.5/63 mm | crushed aggregate fr. 0/31.5 mm | composite foamed concrete FC 600 | extruded polystyrene | crushed aggregate fr. 0/31.5 mm | clay |
| Temperature (°C) | −2 | 3 | 4 | −2 | 5 | 10 |
| Humidity (%) | 4 | 5.5 | 30 | 12 | 5.5 | 26 |
| Bulk density (kg·m−3) | 1900 | 1930 | 600 | 35 | 1930 | 1650 |
| Specific heat capacity (J·kg−1·K−1) | 980 | 1090 | 1100 | 2060 | 1090 | 1095 |
| Thermal conductivity coefficient (W·m−1·K−1) | 1.0 | 1.73 | 0.25 | 0.04 | 1.73 | 1.55 |
| Without Thermal Insulation Layer zi = 0 mm | With Thermal Insulation Layer zi = 200 mm | ||||||||
|---|---|---|---|---|---|---|---|---|---|
| IF (°C, Day) | θm (°C) | DF,mat. (m) | DF,num. (m) | ΔDF (m) | IF (°C, day) | θm (°C) | DF,mat. (m) | DF,num. (m) | ΔDF (m) |
| 1000 | 2.0 | 1.560 | 1.564 | 0.002 | 1000 | 2.0 | 0.940 | 0.933 | 0.007 |
| 1100 | 2.0 | 1.620 | 1.642 | −0.022 | 1100 | 2.0 | 1.030 | 1.027 | 0.003 |
| 1200 | 2.0 | 1.690 | 1.196 | −0.006 | 1200 | 2.0 | 1.110 | 1.120 | −0.010 |
| 900 | 3.0 | 1.340 | 1.338 | 0.002 | 1300 | 2.0 | 1.190 | 1.175 | 0.015 |
| 1000 | 3.0 | 1.480 | 1.470 | 0.010 | 1400 | 2.0 | 1.270 | 1.264 | 0.006 |
| 1100 | 3.0 | 1.550 | 1.542 | 0.008 | 900 | 3.0 | 0.750 | 0.738 | 0.012 |
| 1000 | 4.0 | 1.430 | 1.428 | −0.015 | 1000 | 3.0 | 0.830 | 0.817 | 0.013 |
| 700 | 5.0 | 1.060 | 1.064 | −0.004 | 1100 | 3.0 | 0.900 | 0.888 | 0.012 |
| 800 | 5.0 | 1.110 | 1.129 | −0.019 | 1200 | 3.0 | 0.970 | 0.981 | −0.011 |
| 900 | 5.0 | 1.170 | 1.176 | −0.006 | 1300 | 3.0 | 1.050 | 1.034 | 0.016 |
| 600 | 6.0 | 0.950 | 0.944 | 0.006 | 1400 | 3.0 | 1.120 | 1.113 | 0.007 |
| 700 | 6.0 | 1.010 | 1.026 | −0.016 | 1000 | 4.0 | 0.760 | 0.768 | −0.008 |
| 500 | 7.0 | 0.850 | 0.849 | 0.001 | 1100 | 4.0 | 0.820 | 0.819 | 0.001 |
| 400 | 8.0 | 0.750 | 0.752 | −0.002 | 1200 | 4.0 | 0.890 | 0.883 | 0.007 |
| 500 | 8.0 | 0.820 | 0.820 | 0.000 | 1300 | 4.0 | 0.950 | 0.933 | 0.017 |
Publisher’s Note: MDPI stays neutral with regard to jurisdictional claims in published maps and institutional affiliations. |
© 2021 by the authors. Licensee MDPI, Basel, Switzerland. This article is an open access article distributed under the terms and conditions of the Creative Commons Attribution (CC BY) license (https://creativecommons.org/licenses/by/4.0/).
Share and Cite
Izvolt, L.; Dobes, P.; Drusa, M.; Kadela, M.; Holesova, M. Experimental and Numerical Verification of the Railway Track Substructure with Innovative Thermal Insulation Materials. Materials 2022, 15, 160. https://doi.org/10.3390/ma15010160
Izvolt L, Dobes P, Drusa M, Kadela M, Holesova M. Experimental and Numerical Verification of the Railway Track Substructure with Innovative Thermal Insulation Materials. Materials. 2022; 15(1):160. https://doi.org/10.3390/ma15010160
Chicago/Turabian StyleIzvolt, Libor, Peter Dobes, Marian Drusa, Marta Kadela, and Michaela Holesova. 2022. "Experimental and Numerical Verification of the Railway Track Substructure with Innovative Thermal Insulation Materials" Materials 15, no. 1: 160. https://doi.org/10.3390/ma15010160
APA StyleIzvolt, L., Dobes, P., Drusa, M., Kadela, M., & Holesova, M. (2022). Experimental and Numerical Verification of the Railway Track Substructure with Innovative Thermal Insulation Materials. Materials, 15(1), 160. https://doi.org/10.3390/ma15010160