
Assessment of Polymer Concrete Sample Geometry Effect on Ultrasonic Wave Velocity and Spectral Characteristics


Abstract
:1. Introduction
- − repair maintenance and anti-corrosion protection (protective and decorative coatings) of building structures;
- − flooring, especially industrial floors, as well as floors in hospitals, schools, indoor and outdoor sports facilities and other public utility structures;
- − precast elements—acid tanks, drains, manholes, pipes, slabs, highway median barriers, etc.
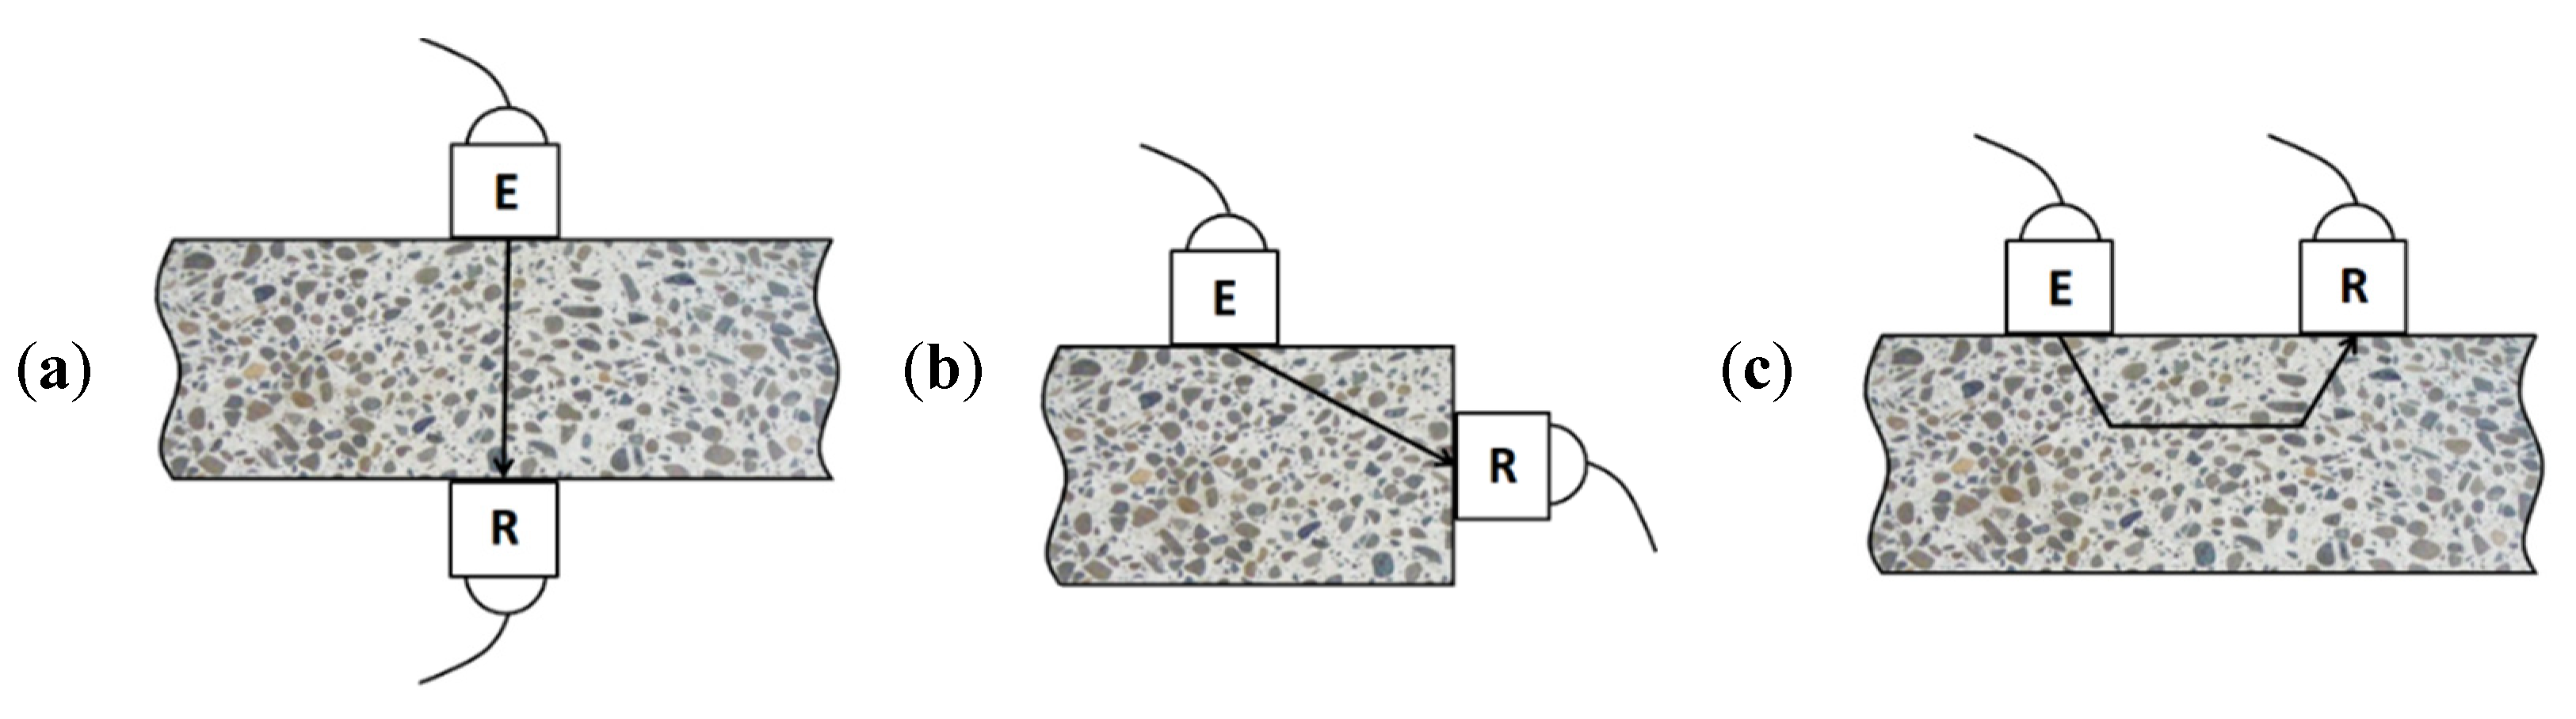
2. An Influence of Sample Shape and Dimensions on the Ultrasonic Pulse Velocity (UPV) and Frequency Spectrum of the Ultrasonic Signal
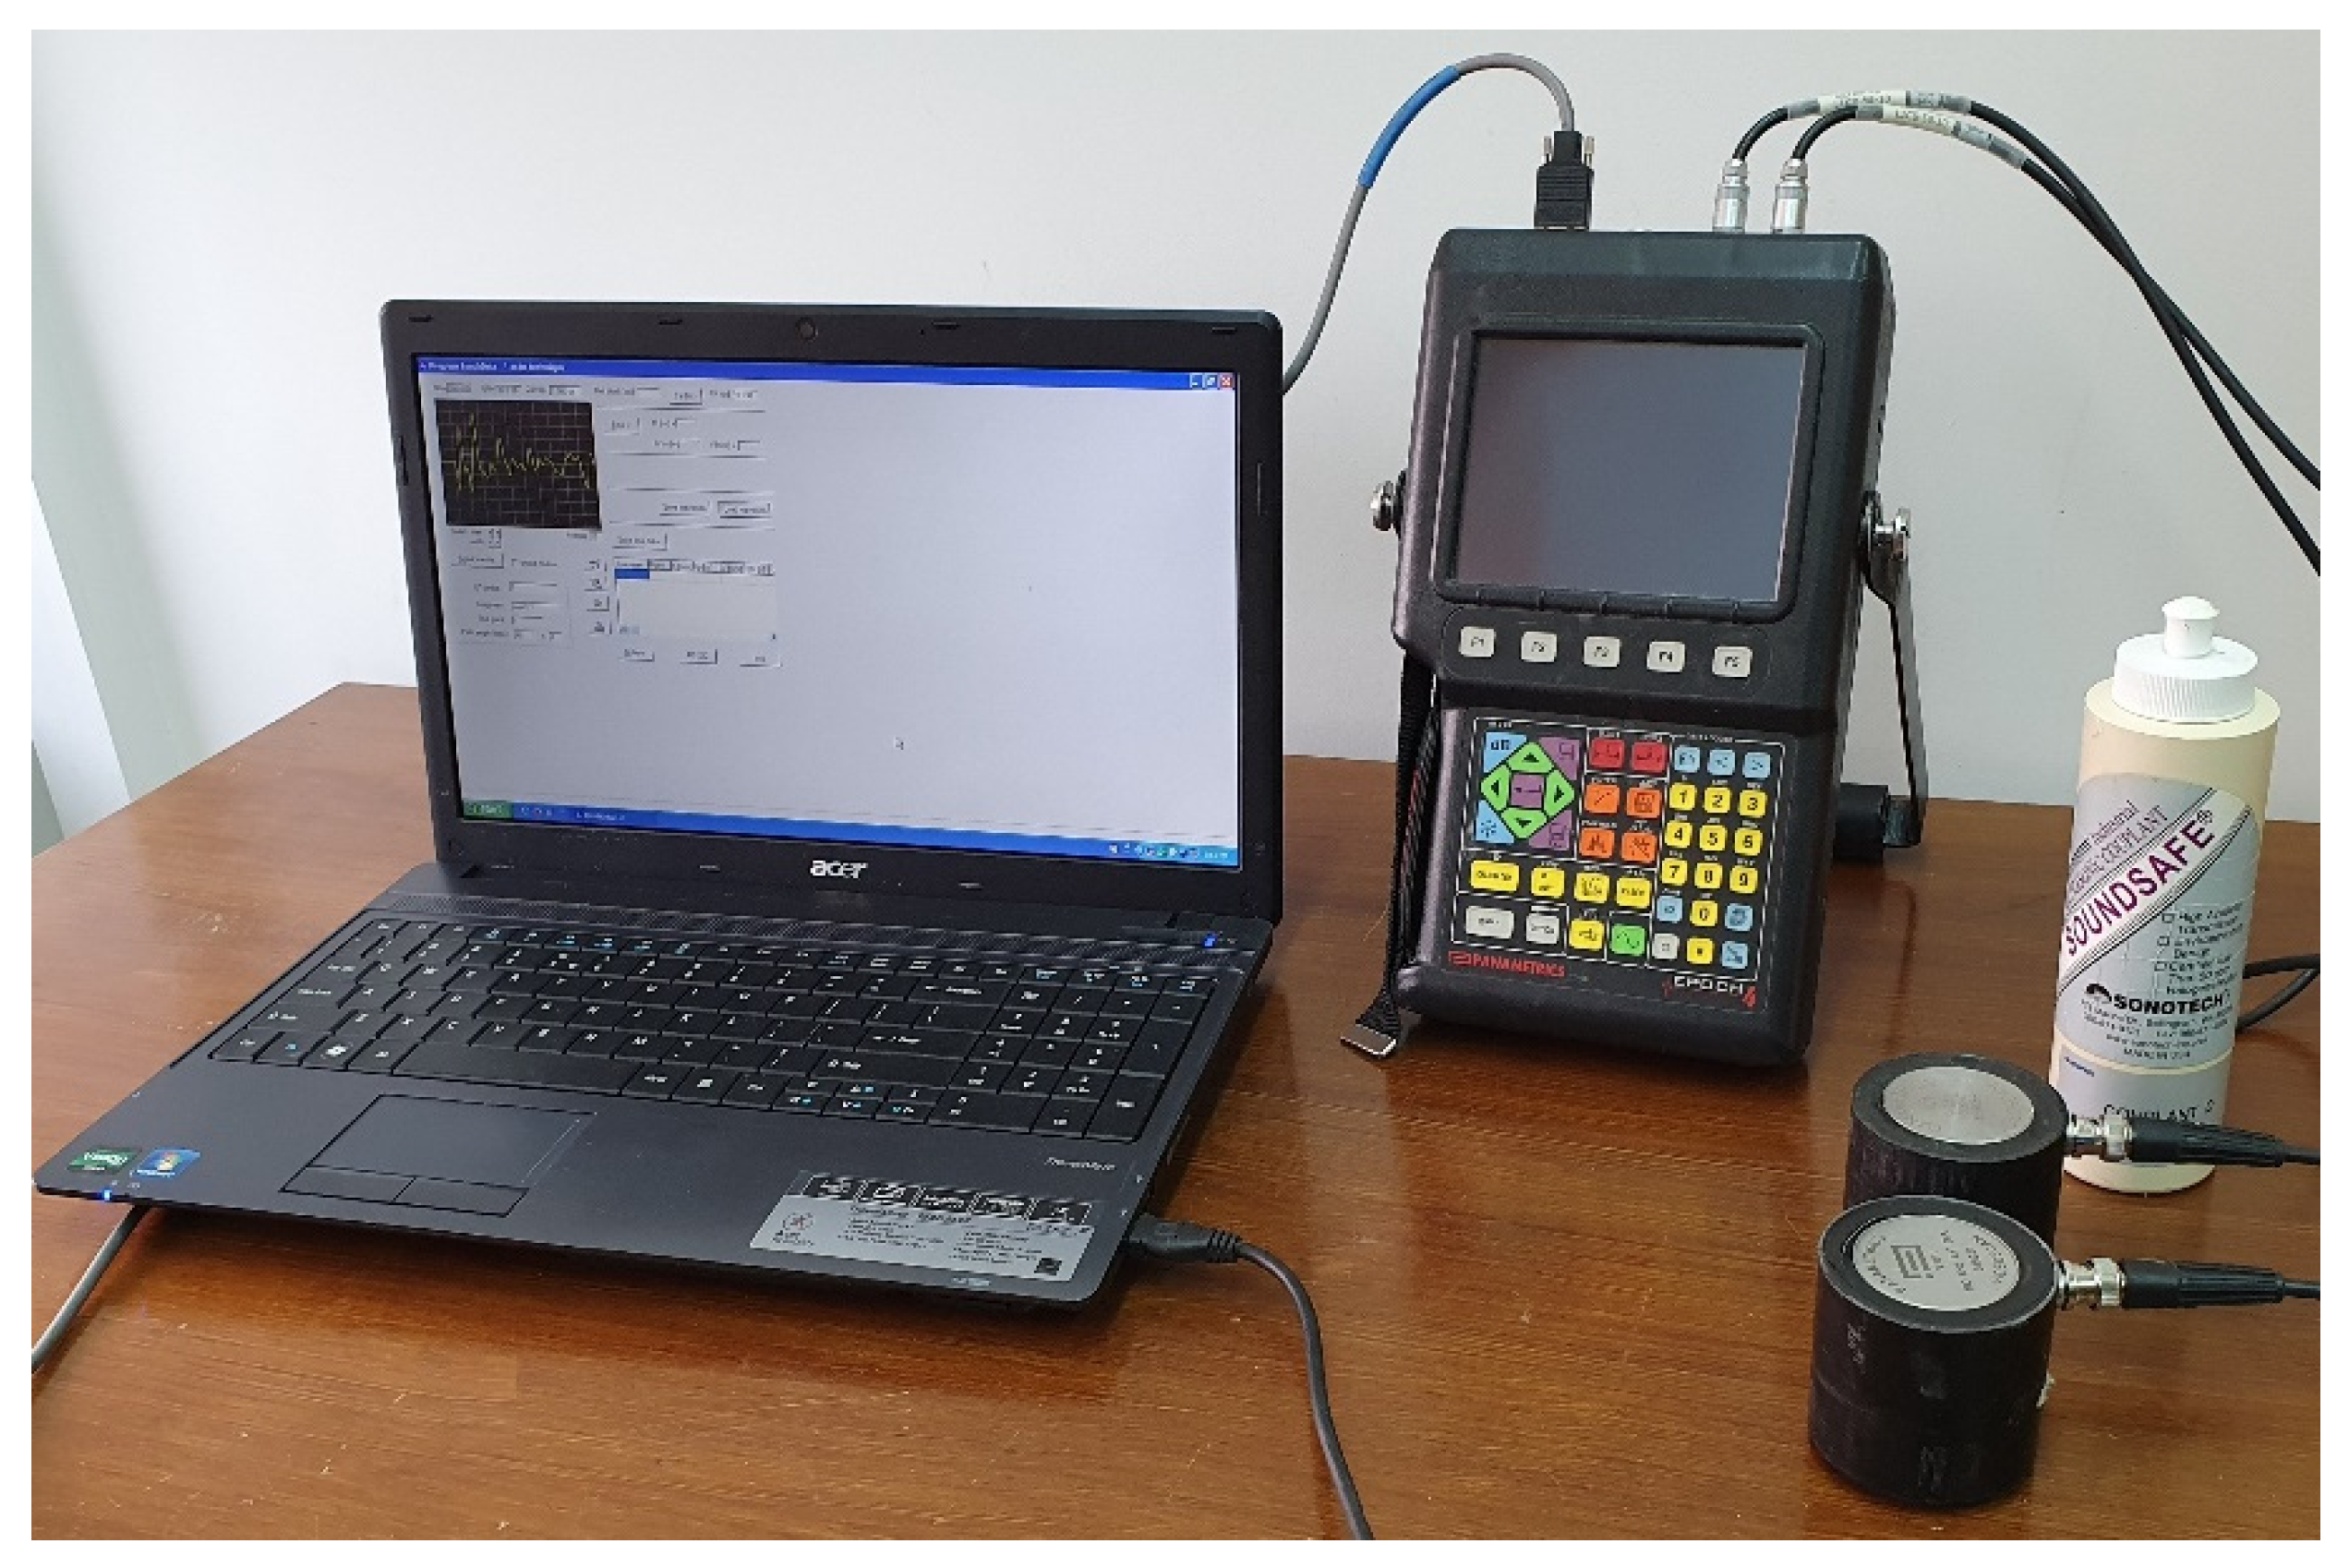
3. Materials and Methods
4. Results and Discussion
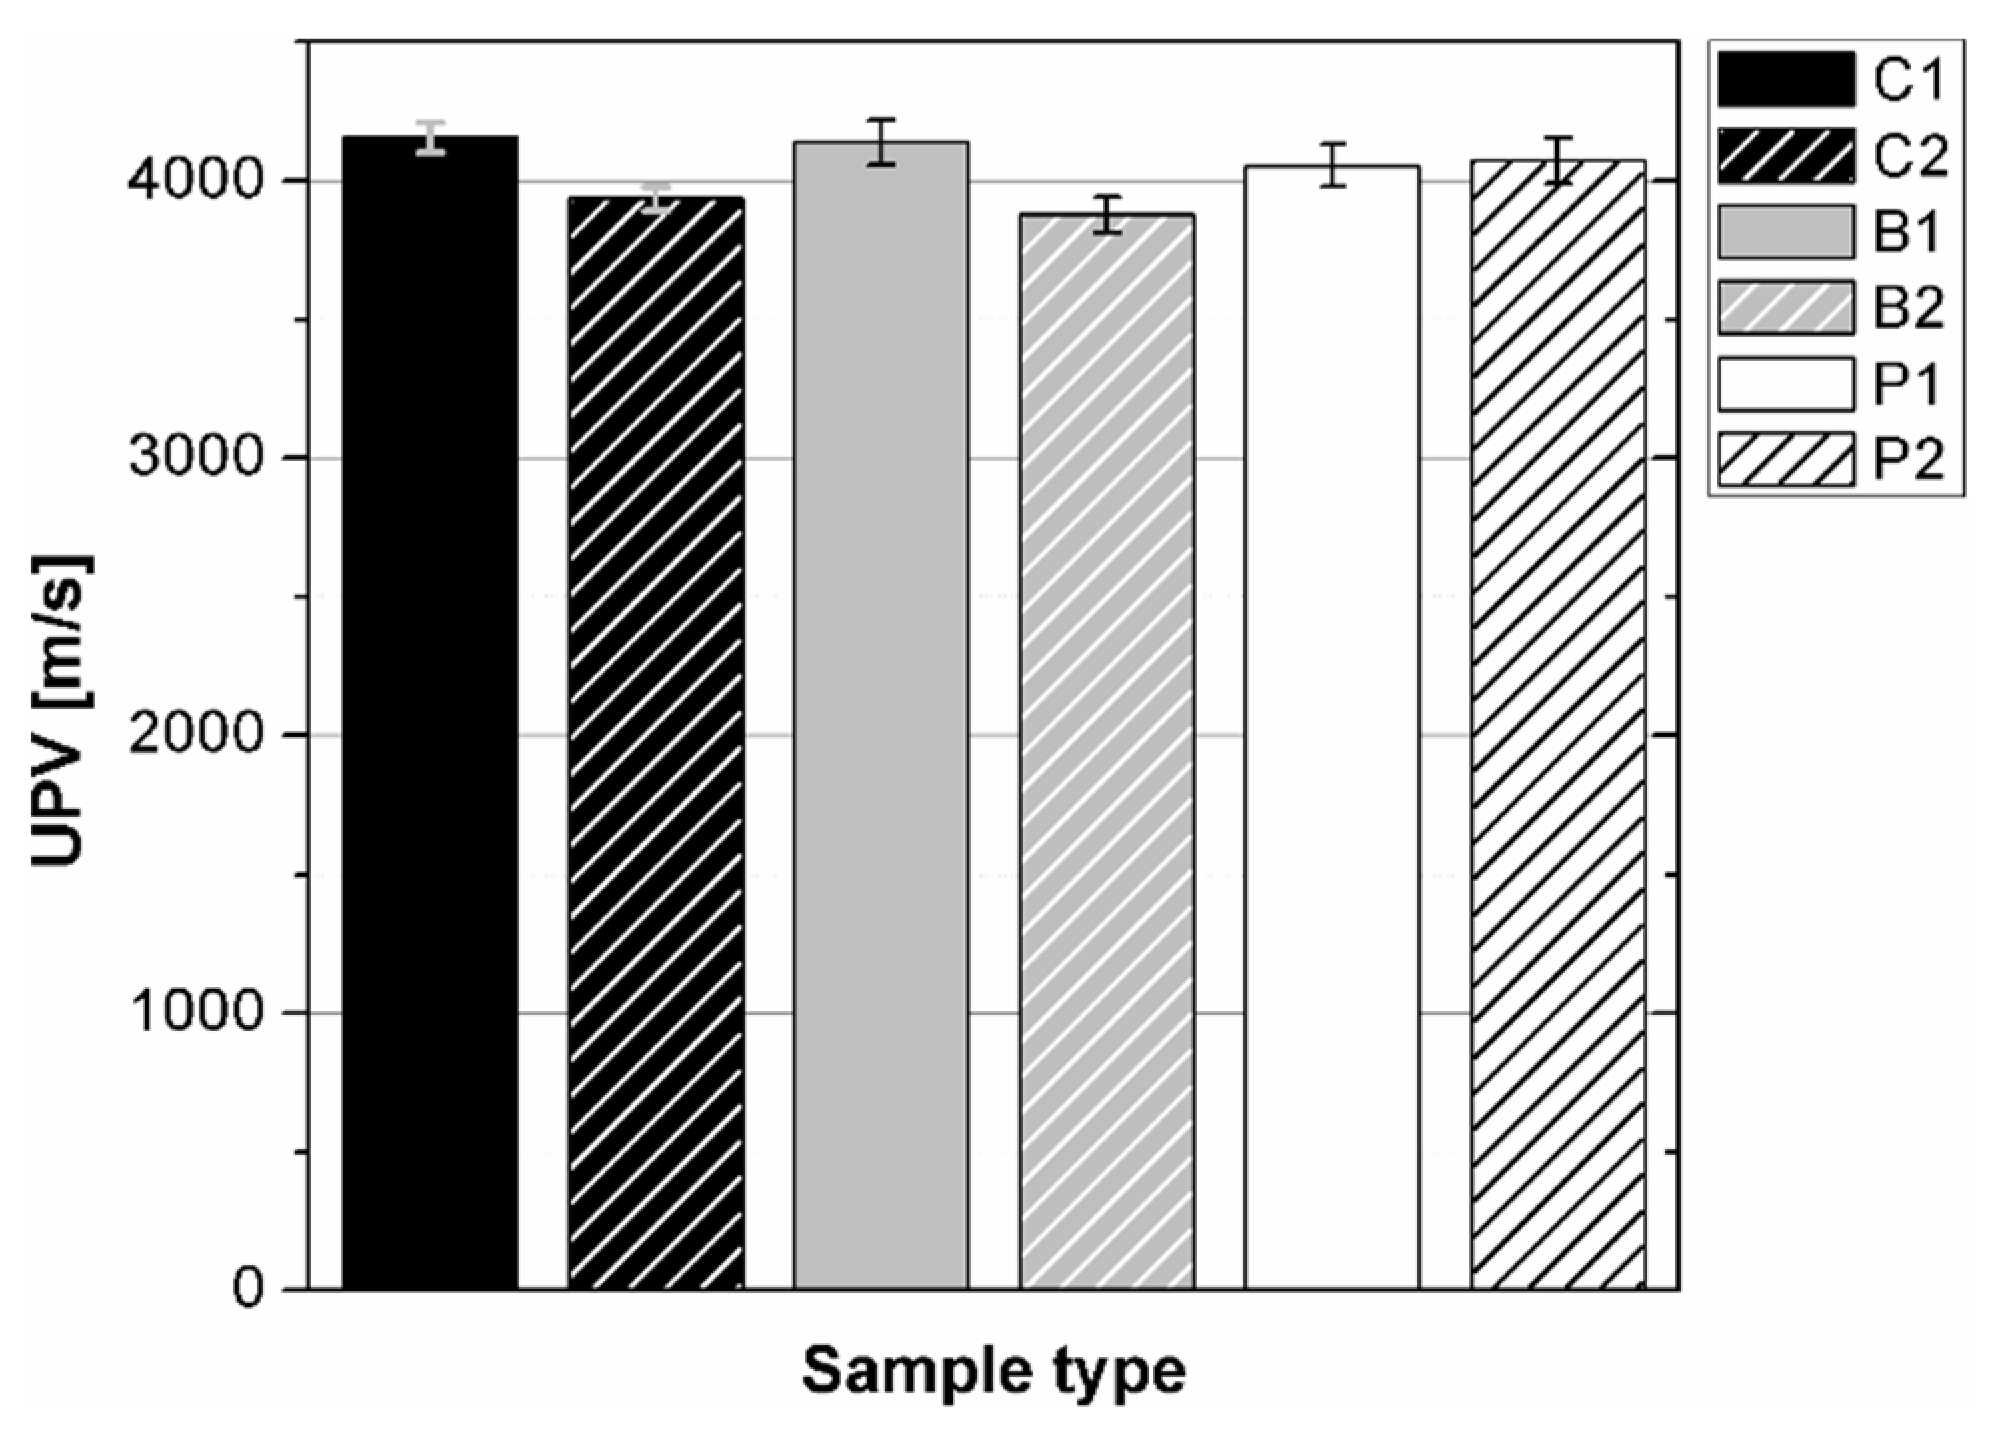
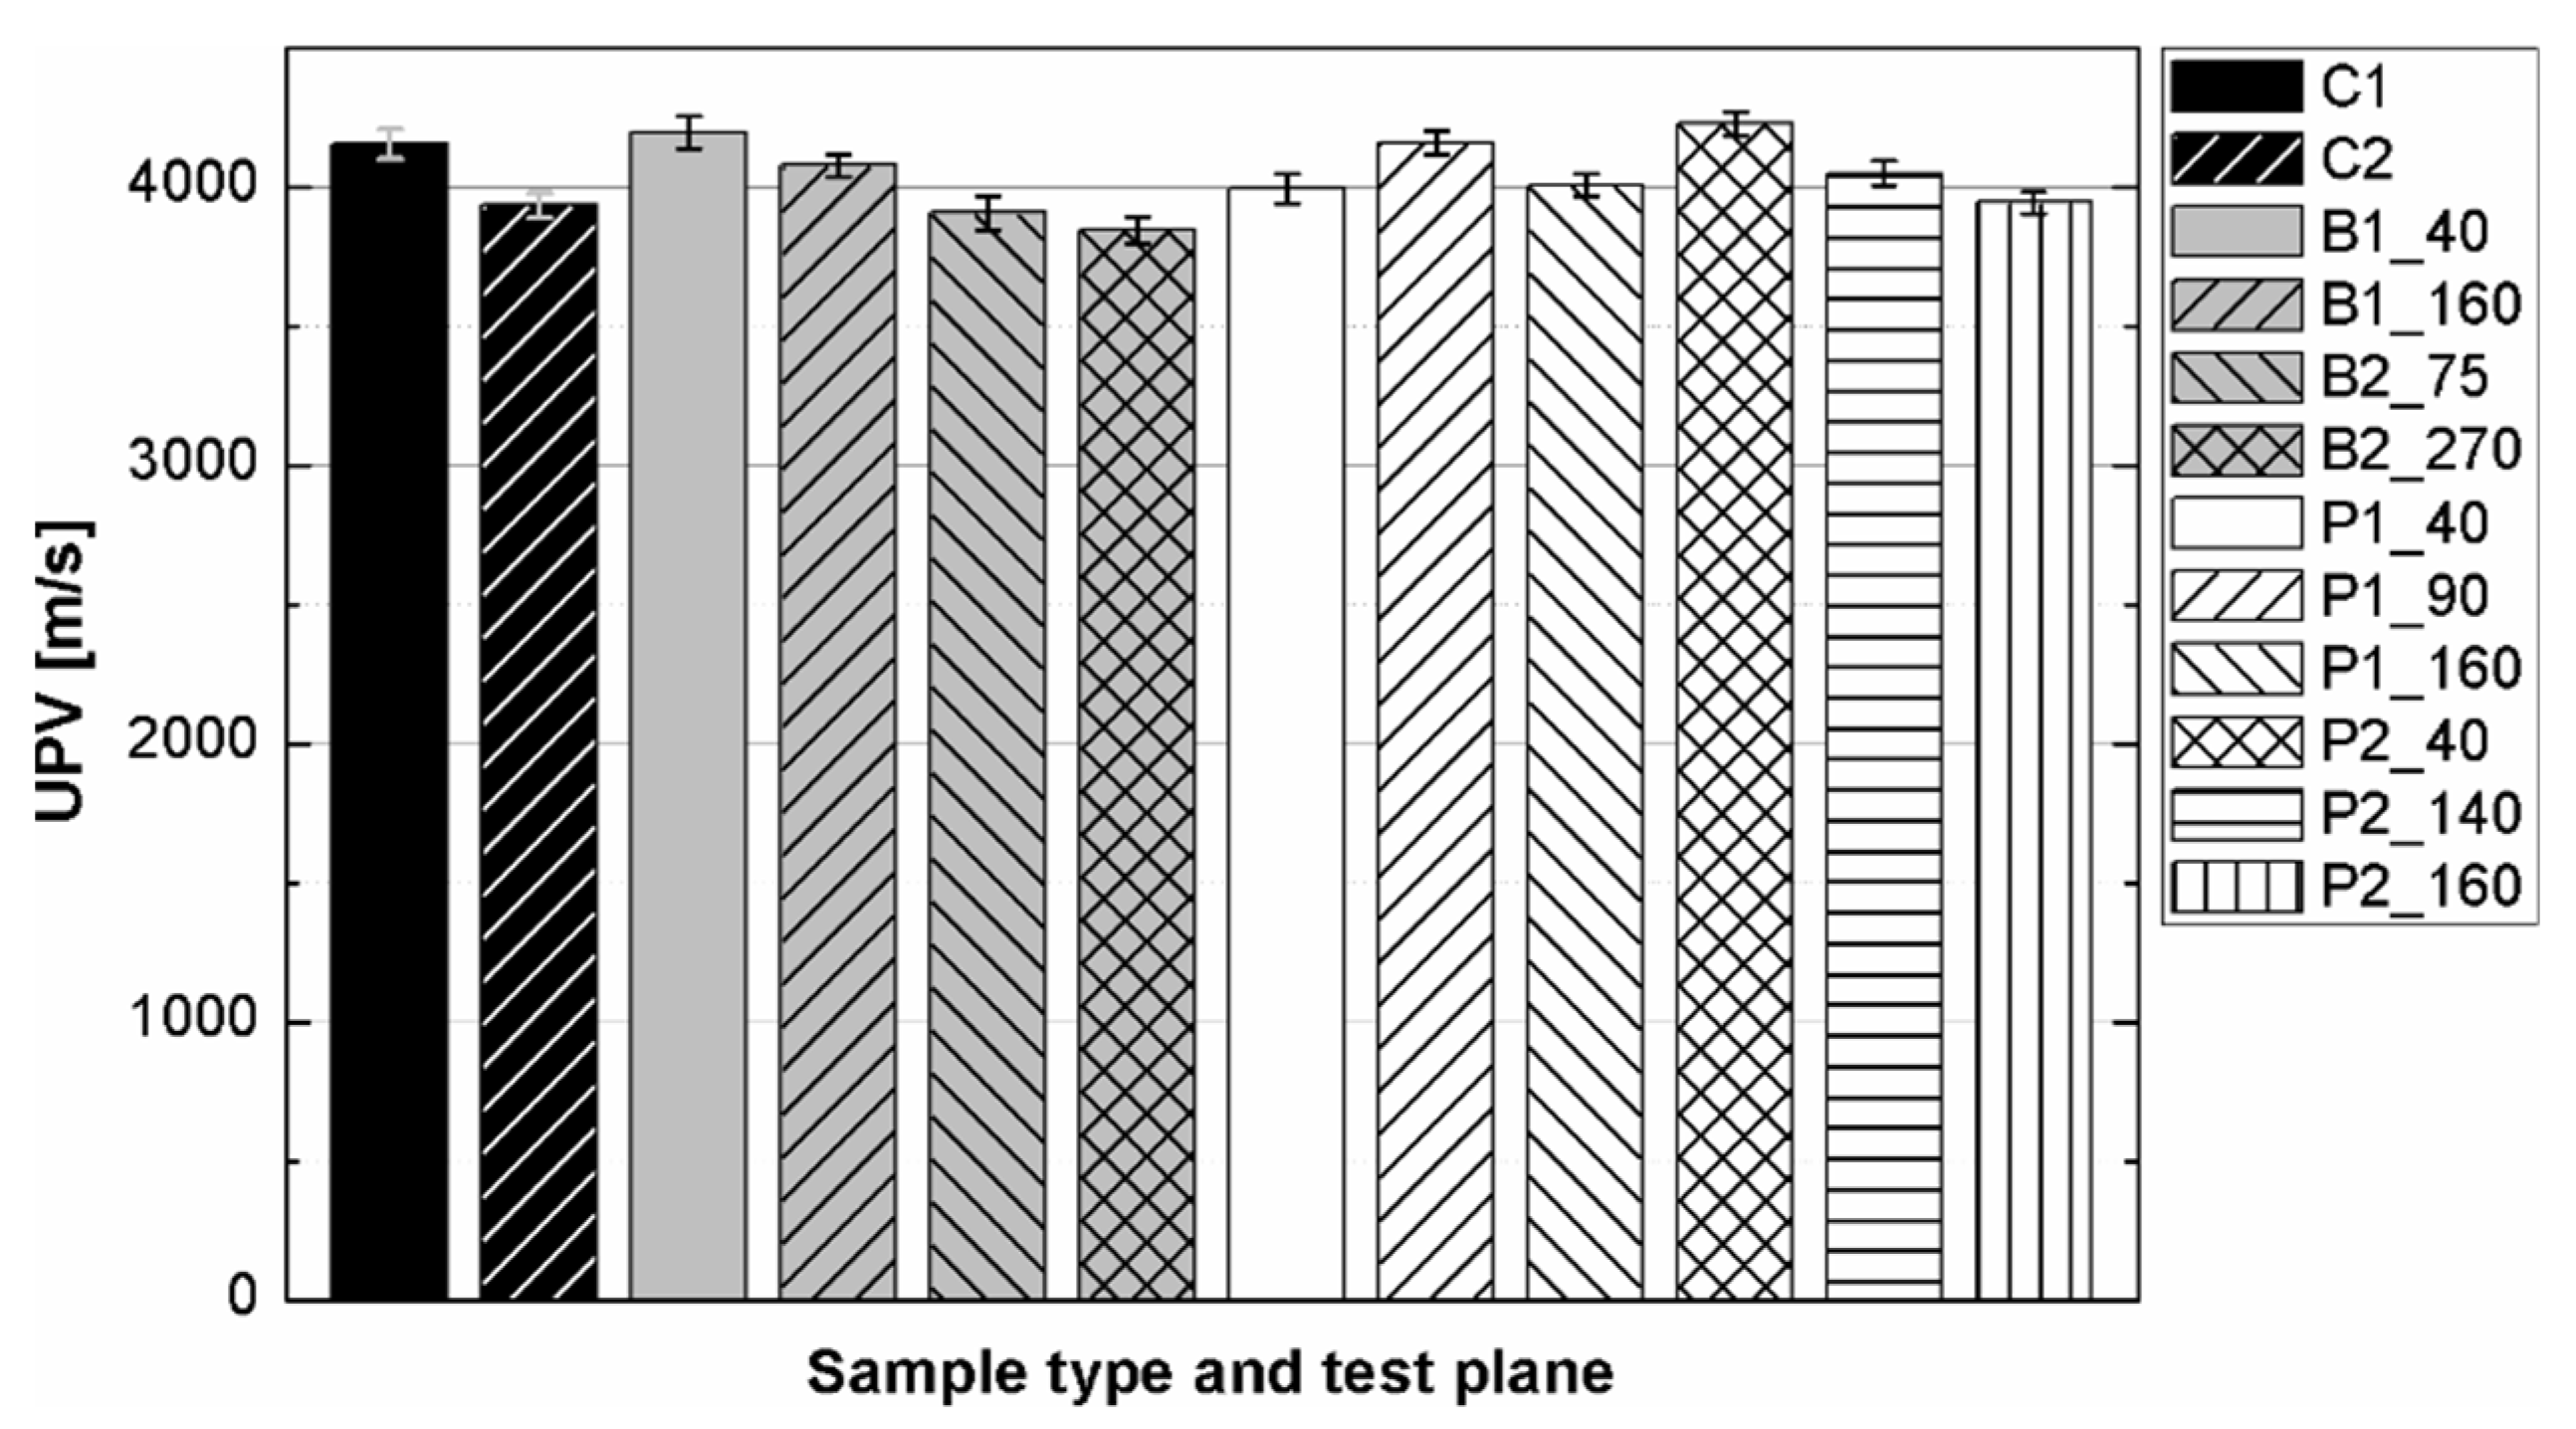
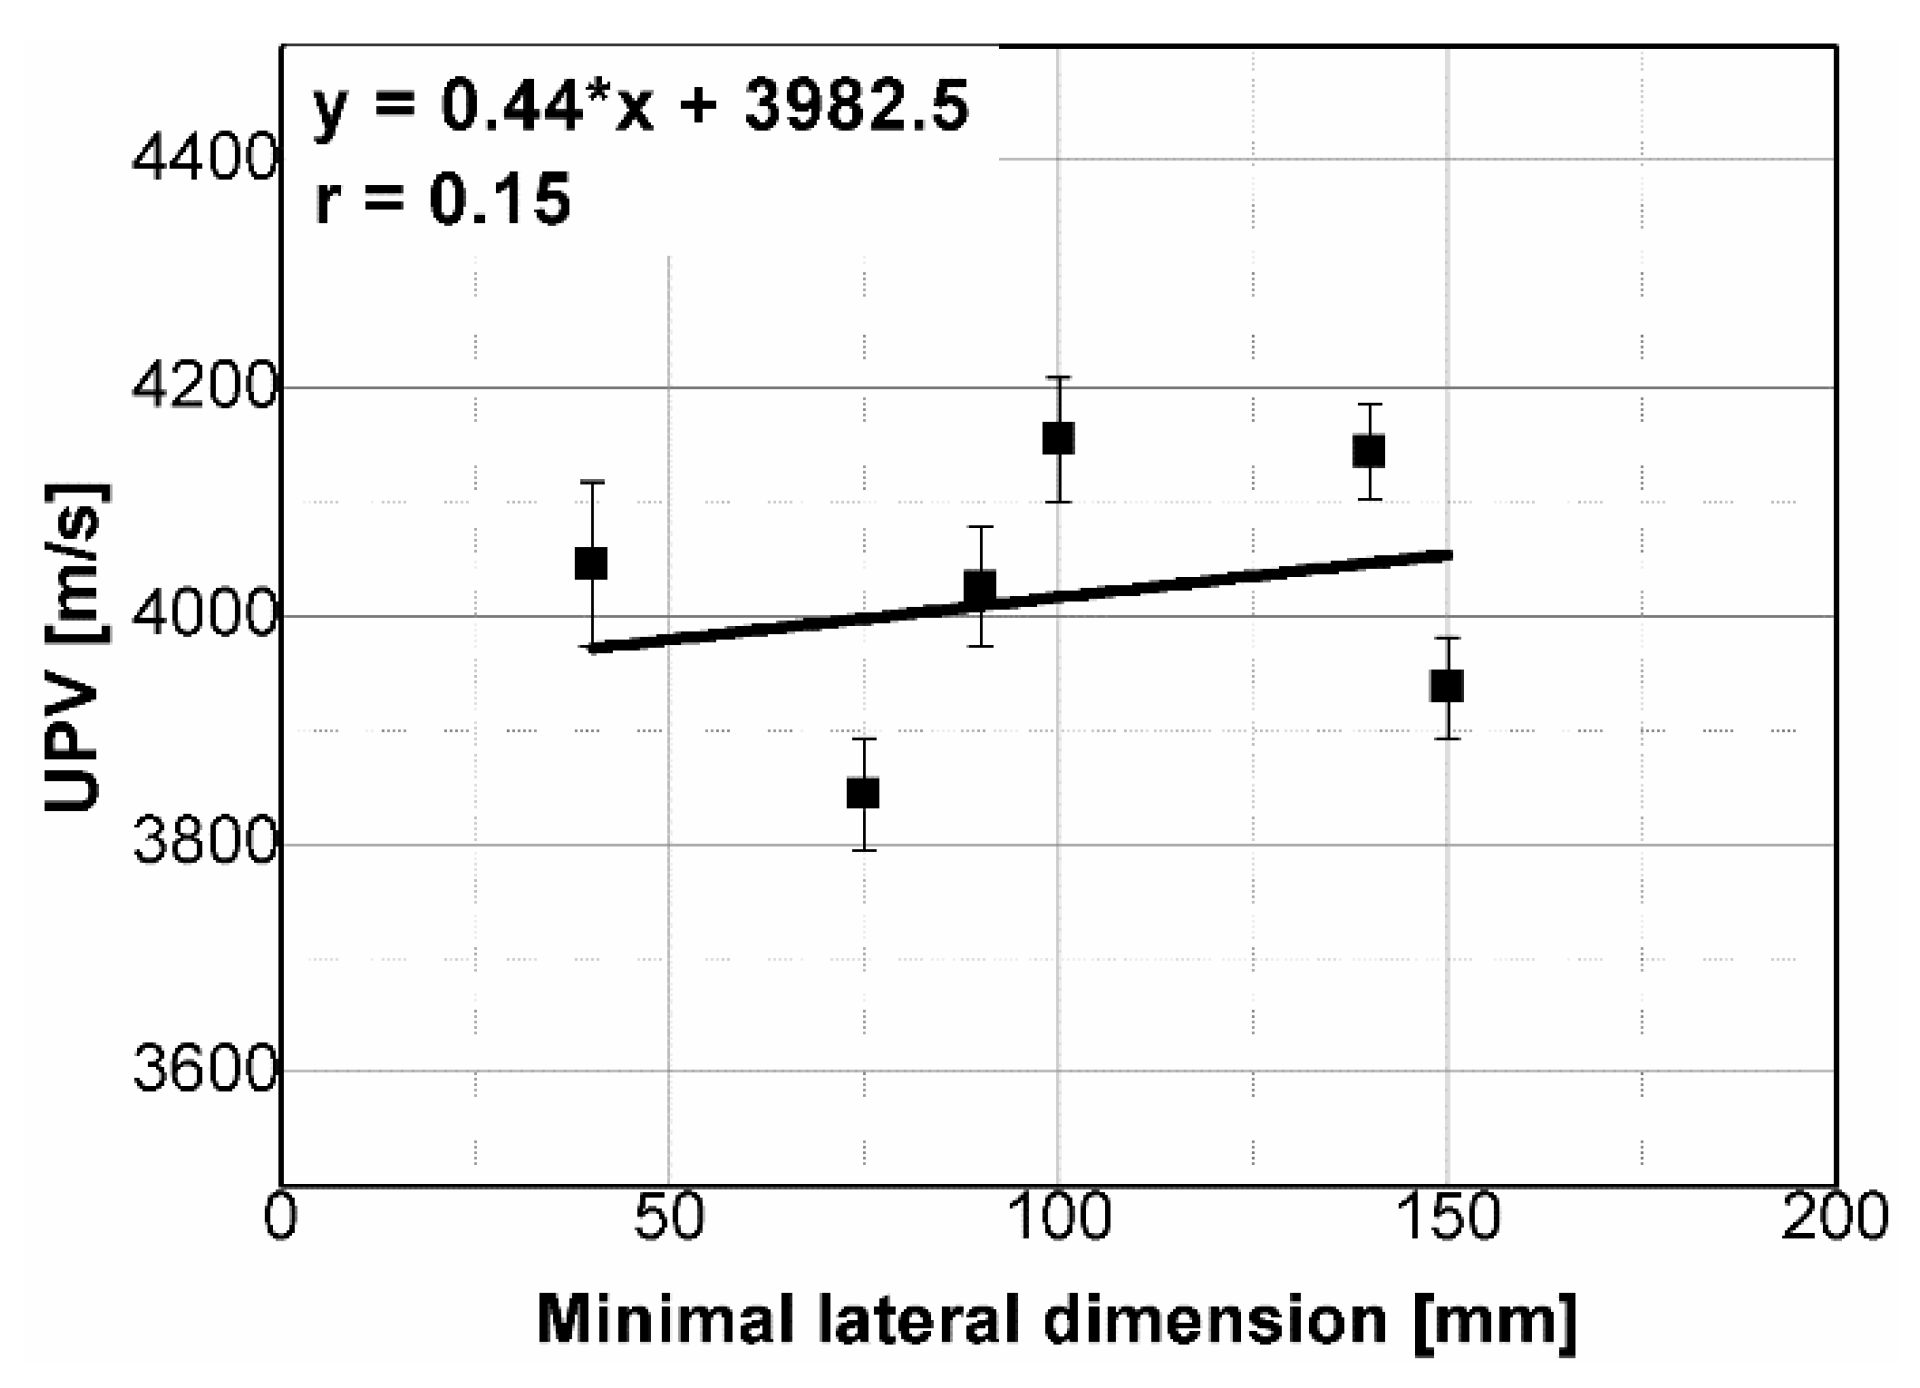
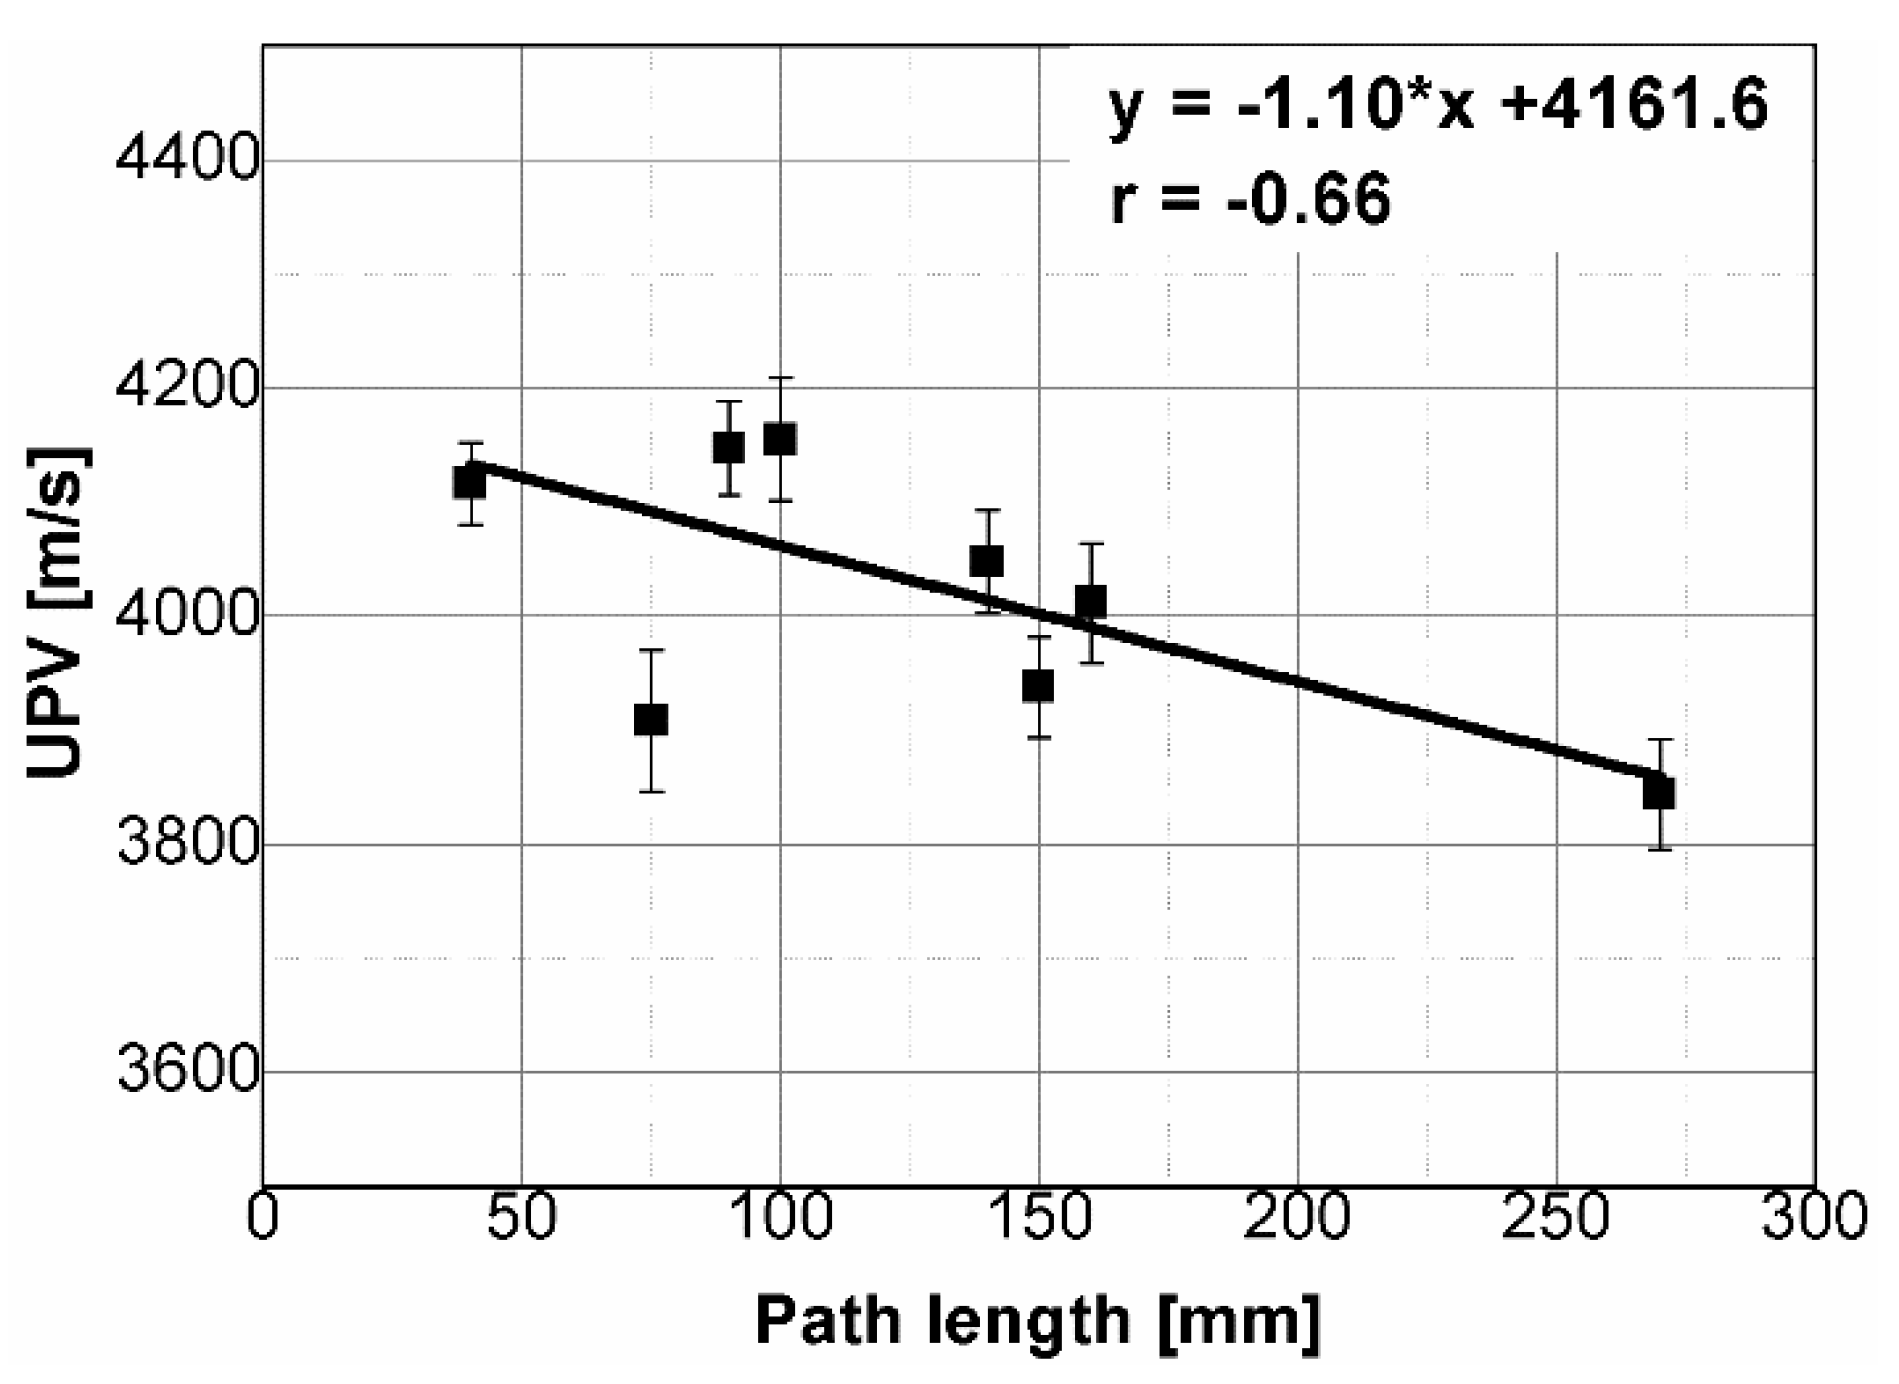
4.1. An Effect of Sample Shape and Dimensions on the Ultrasonic UPV
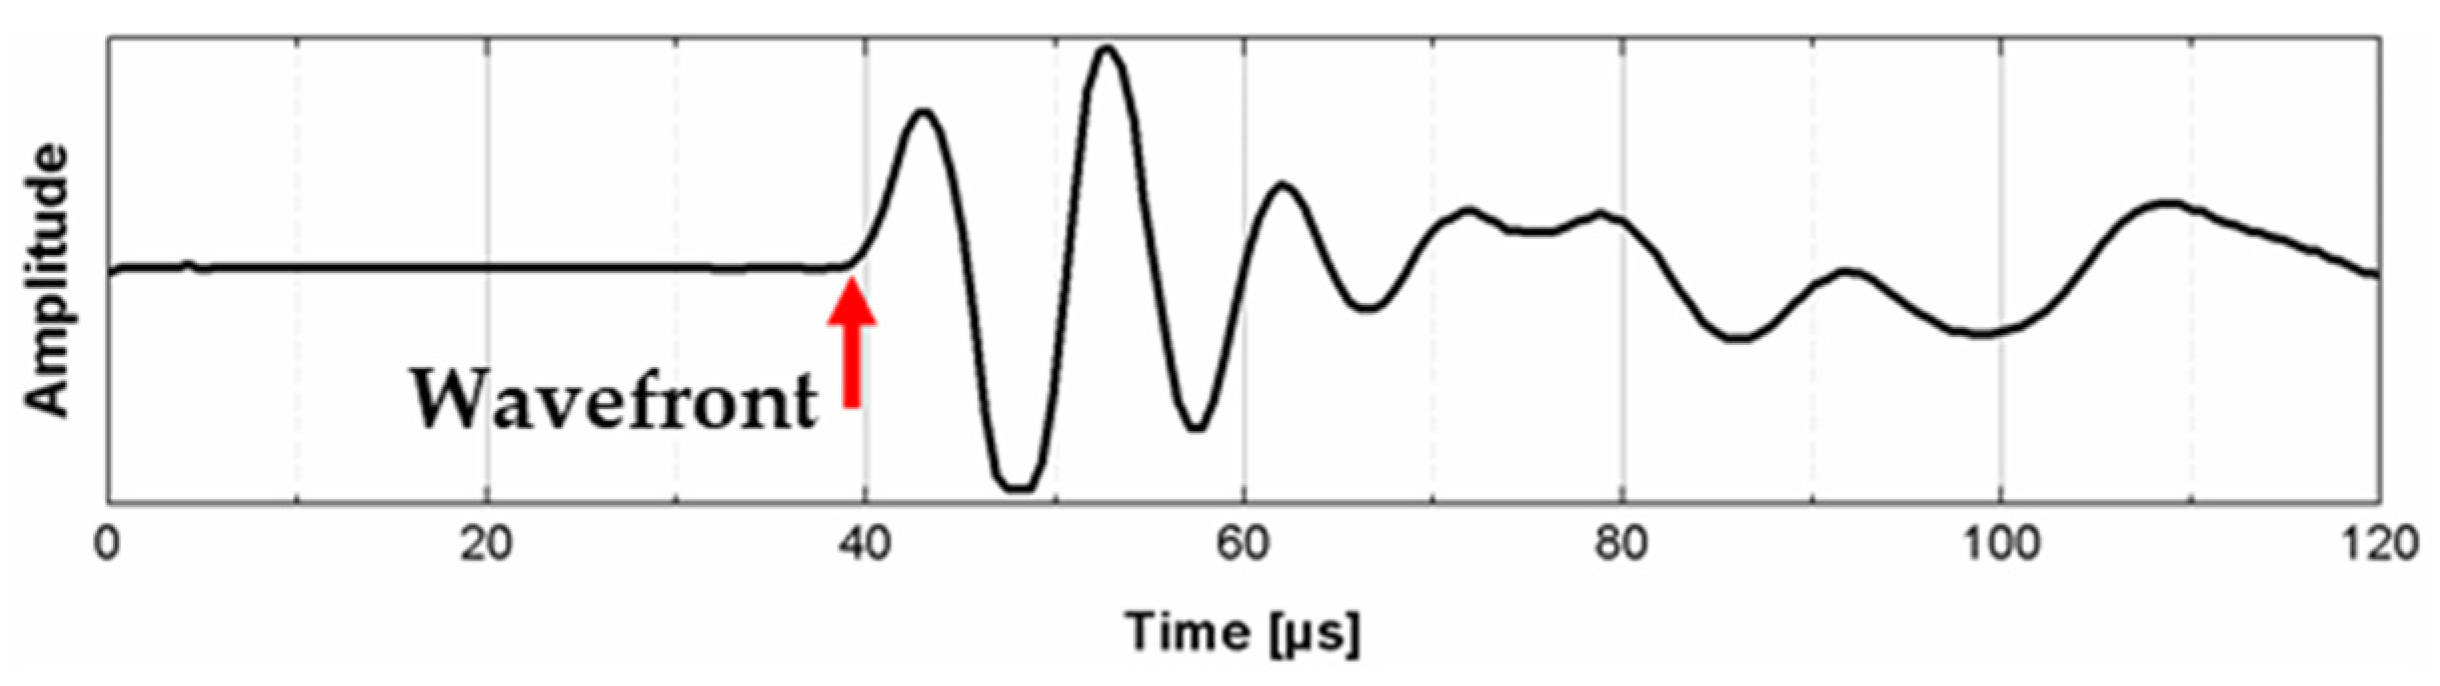
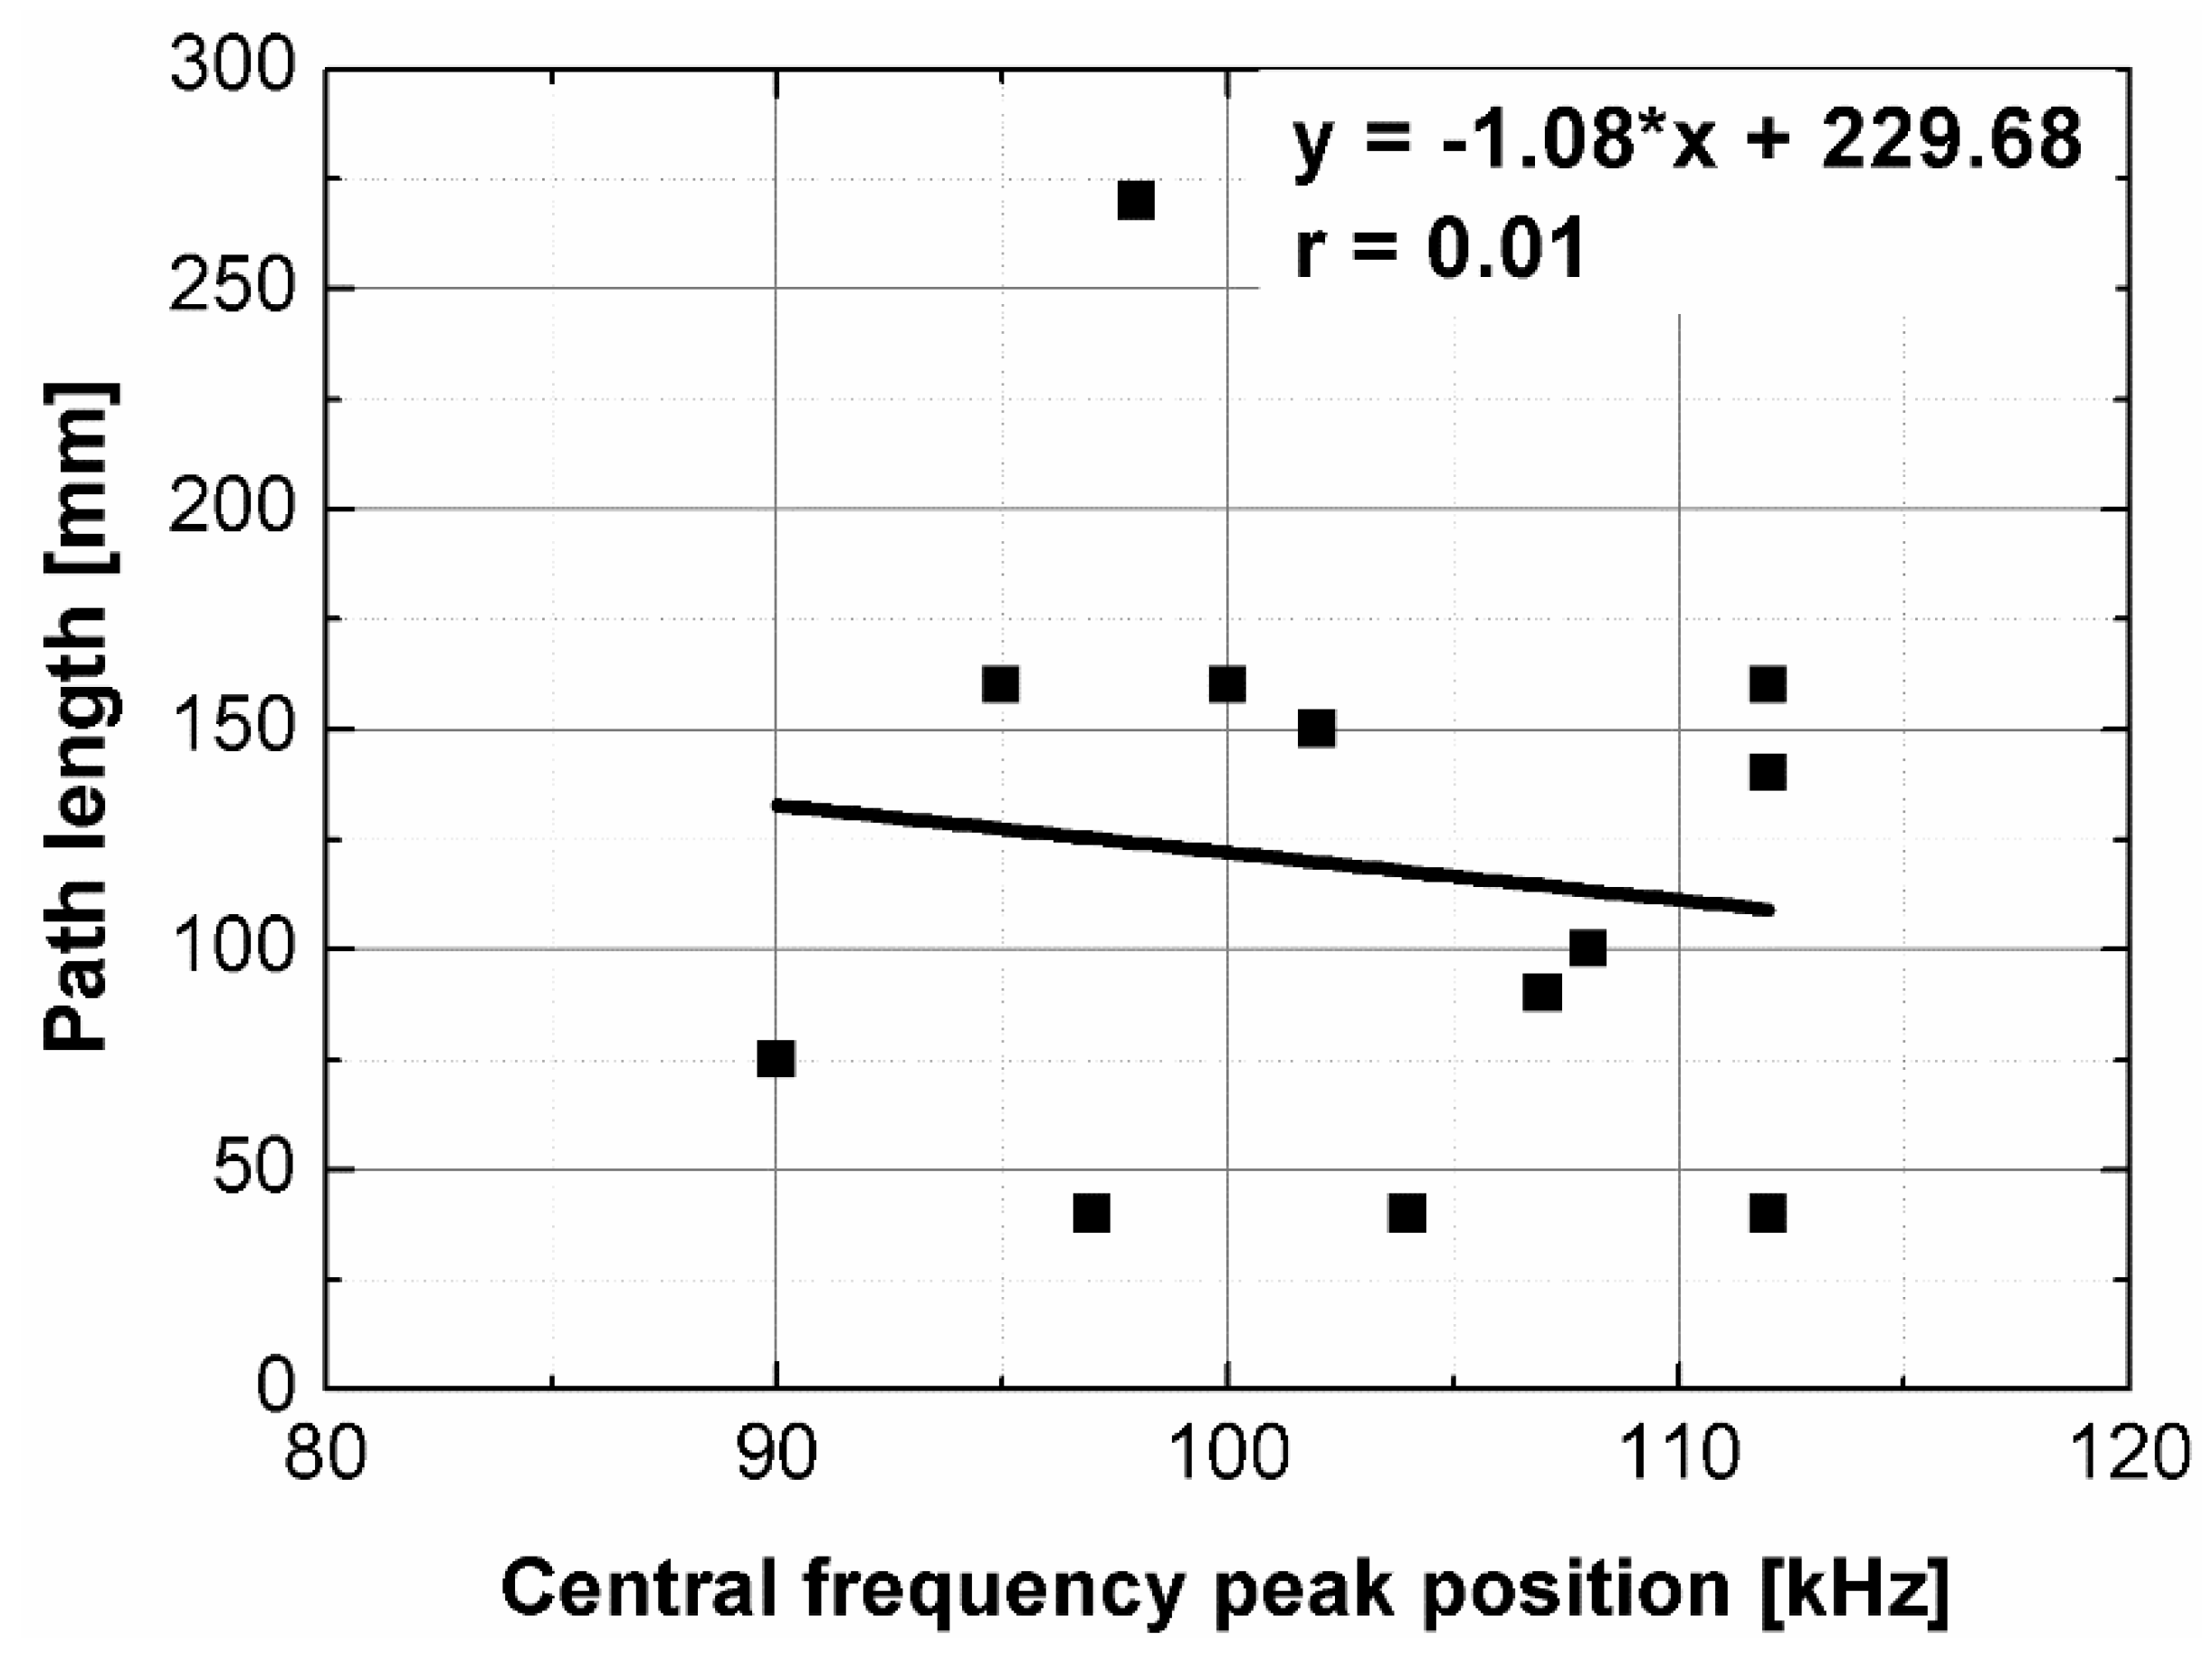
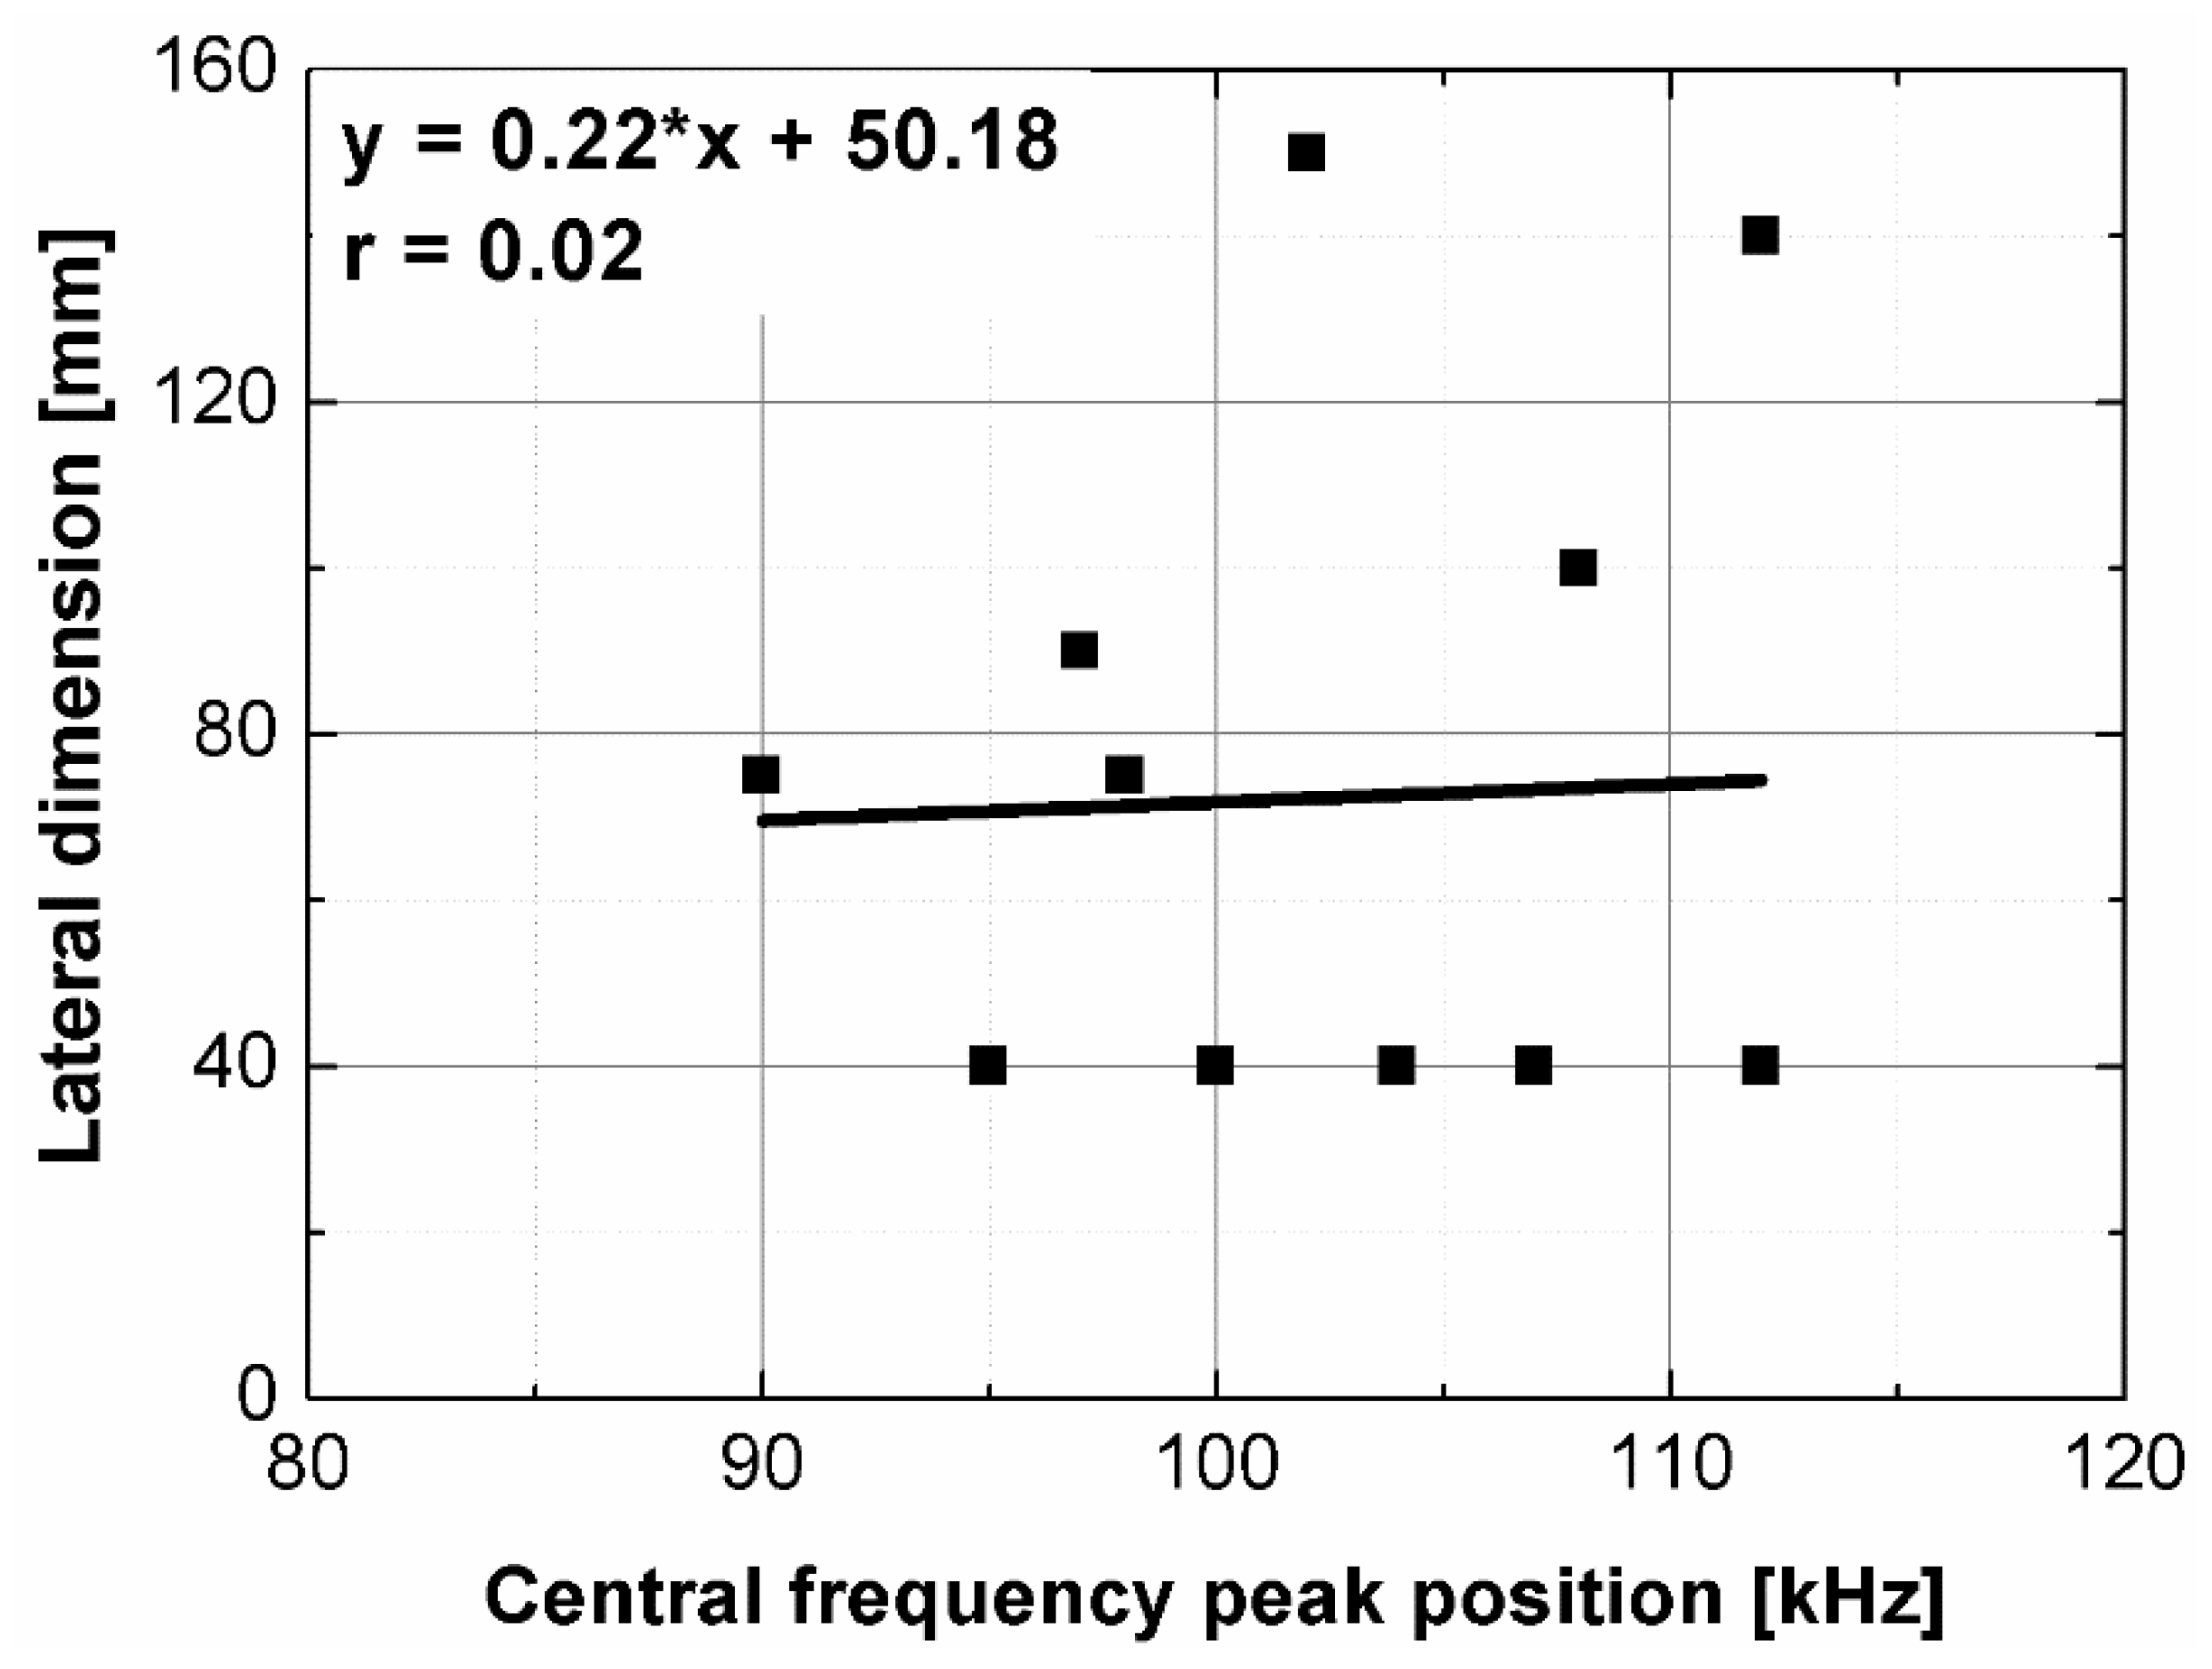
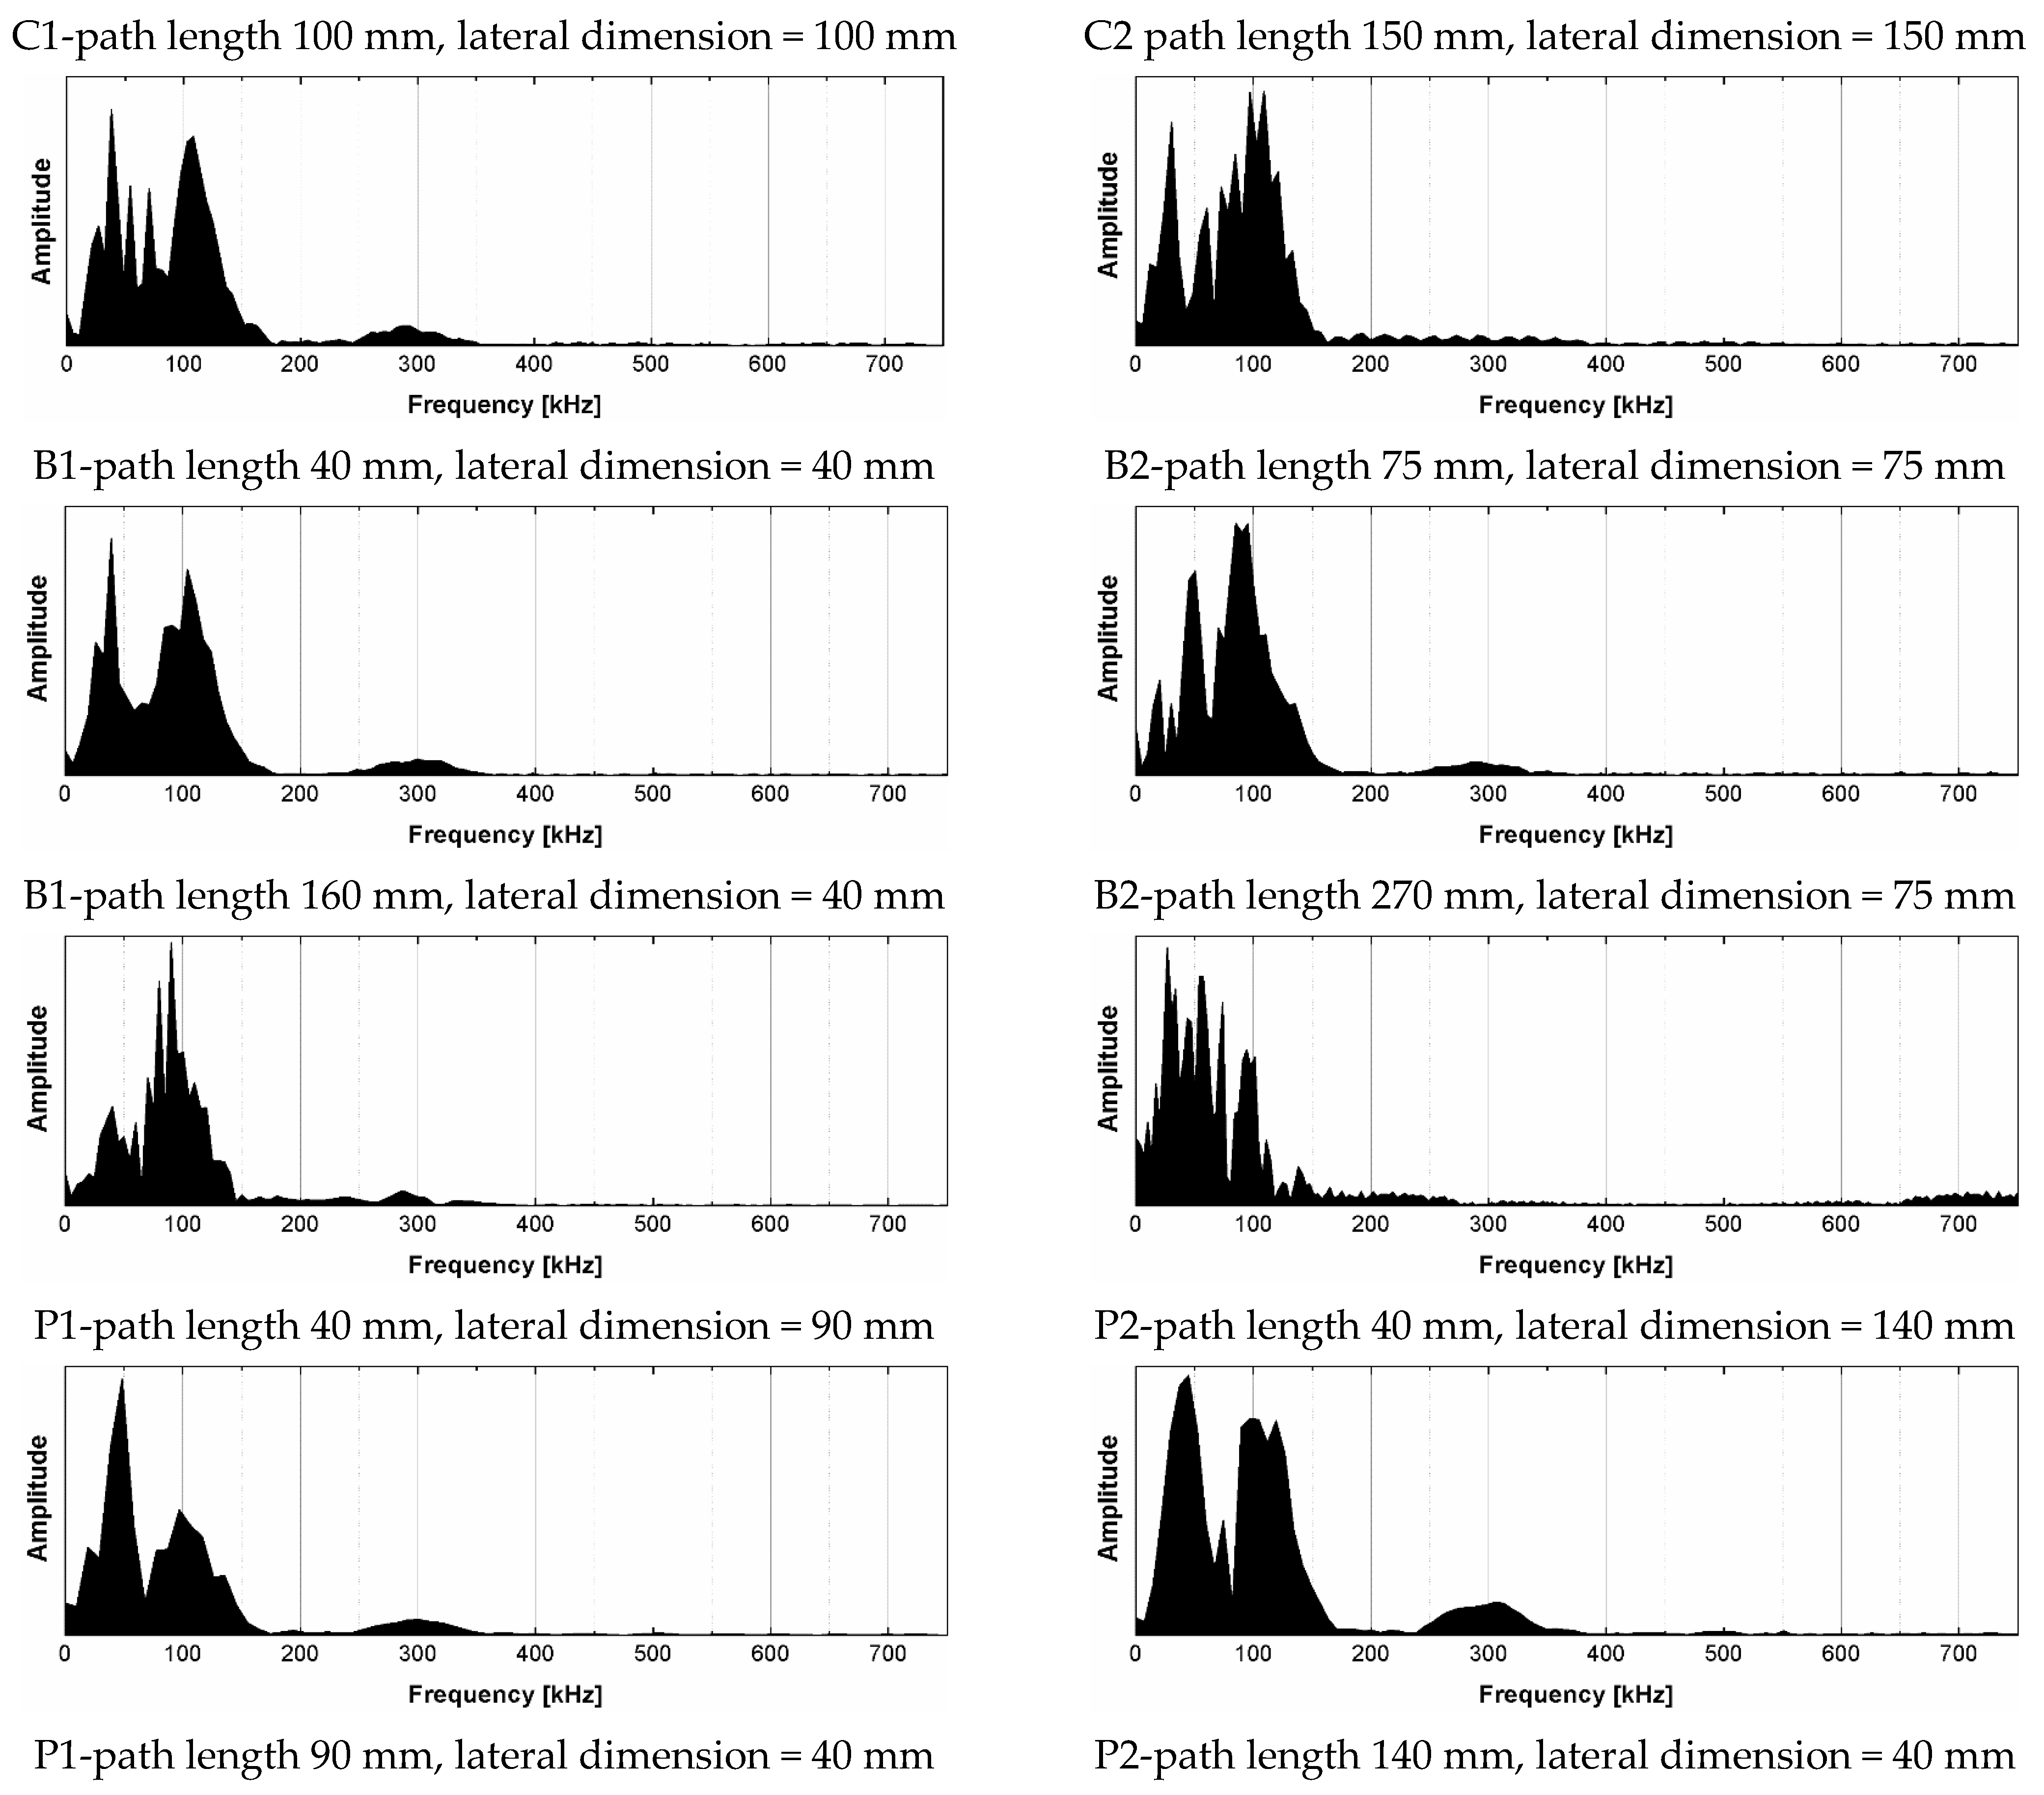
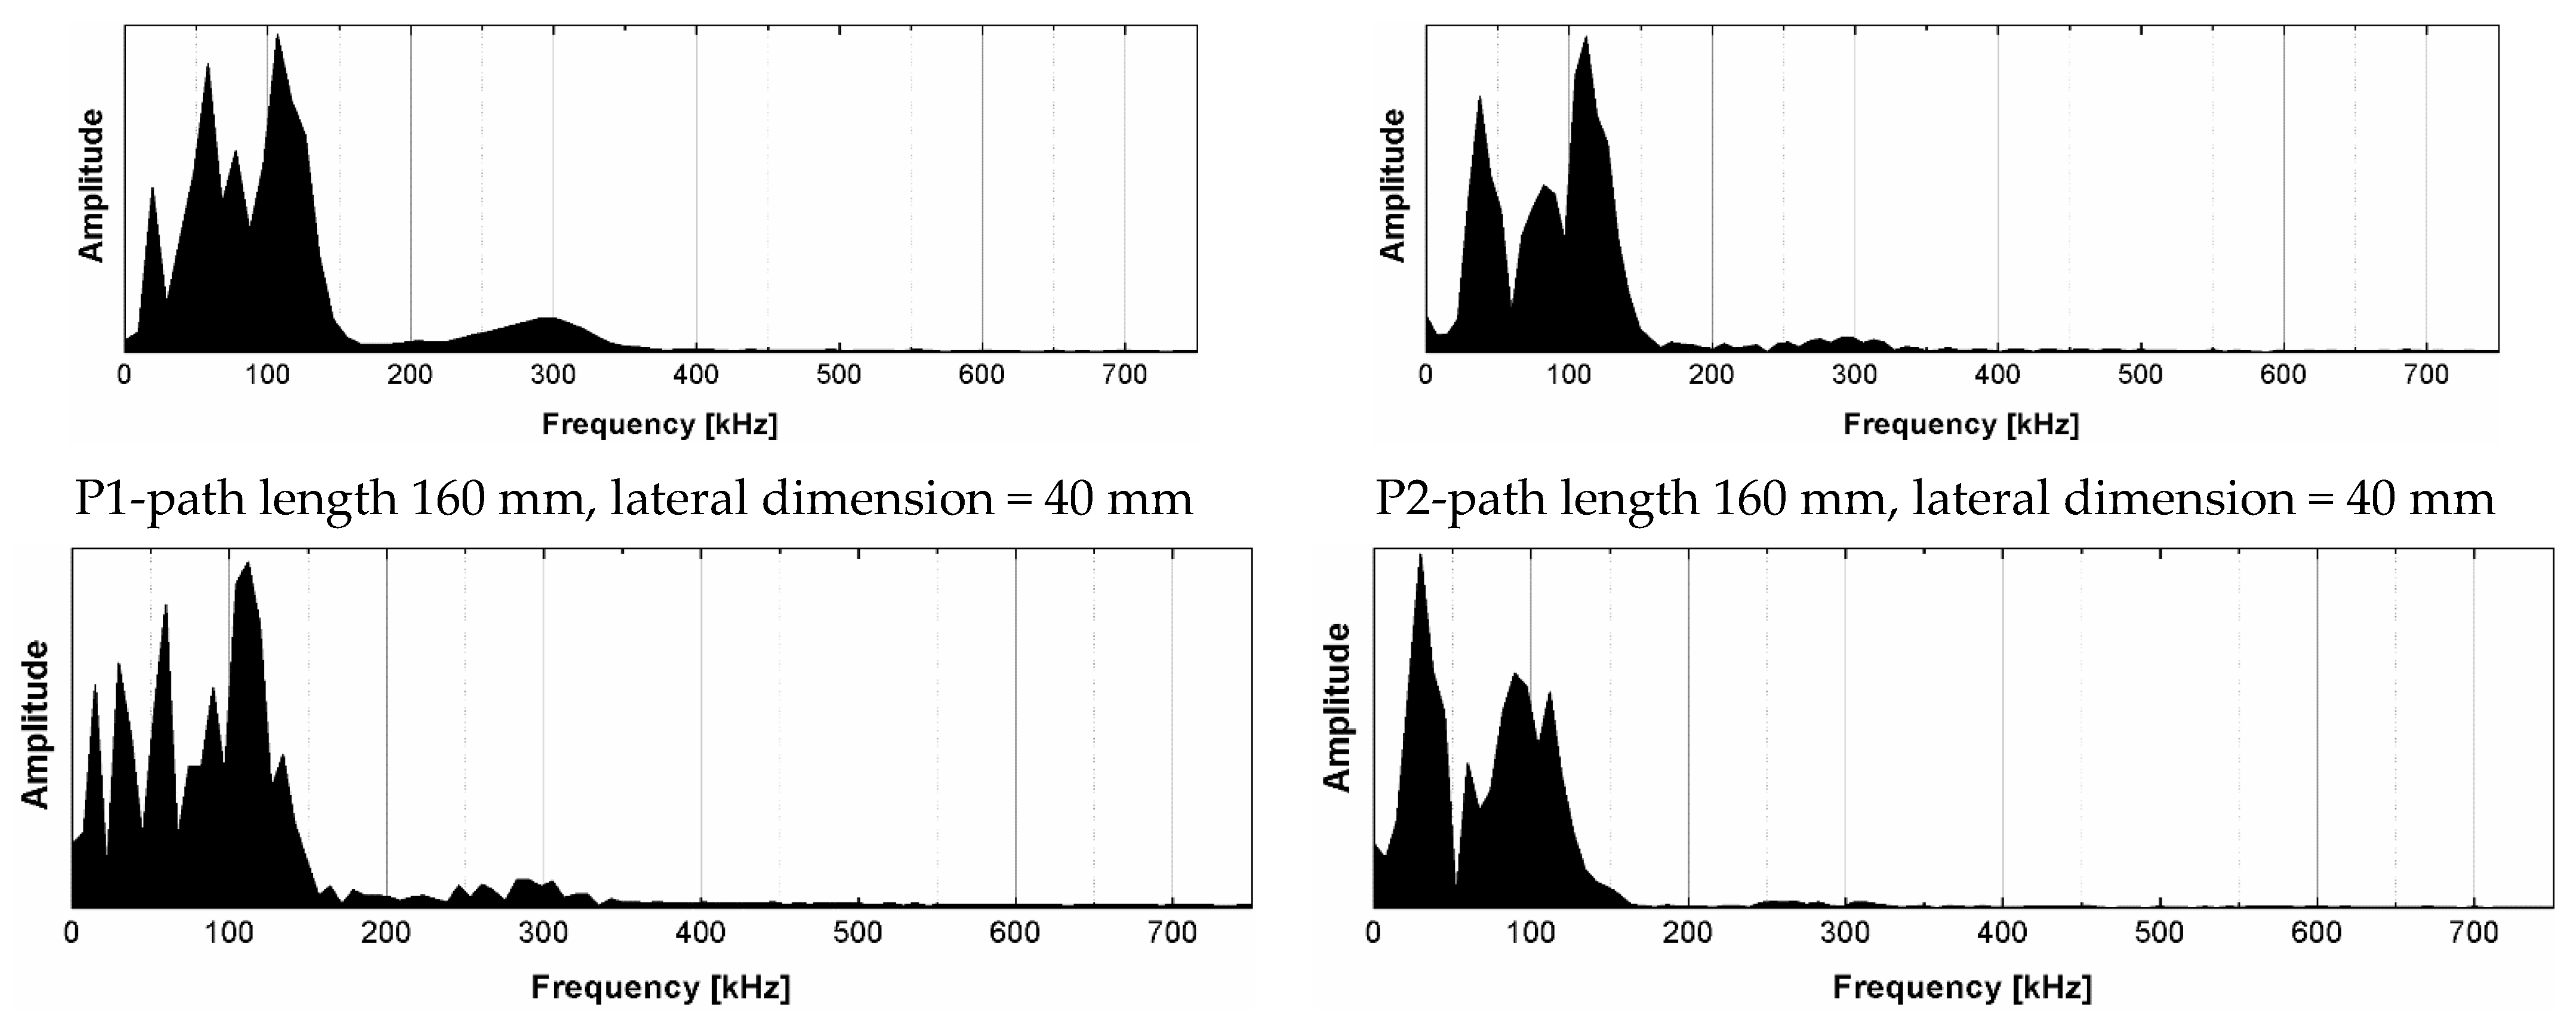
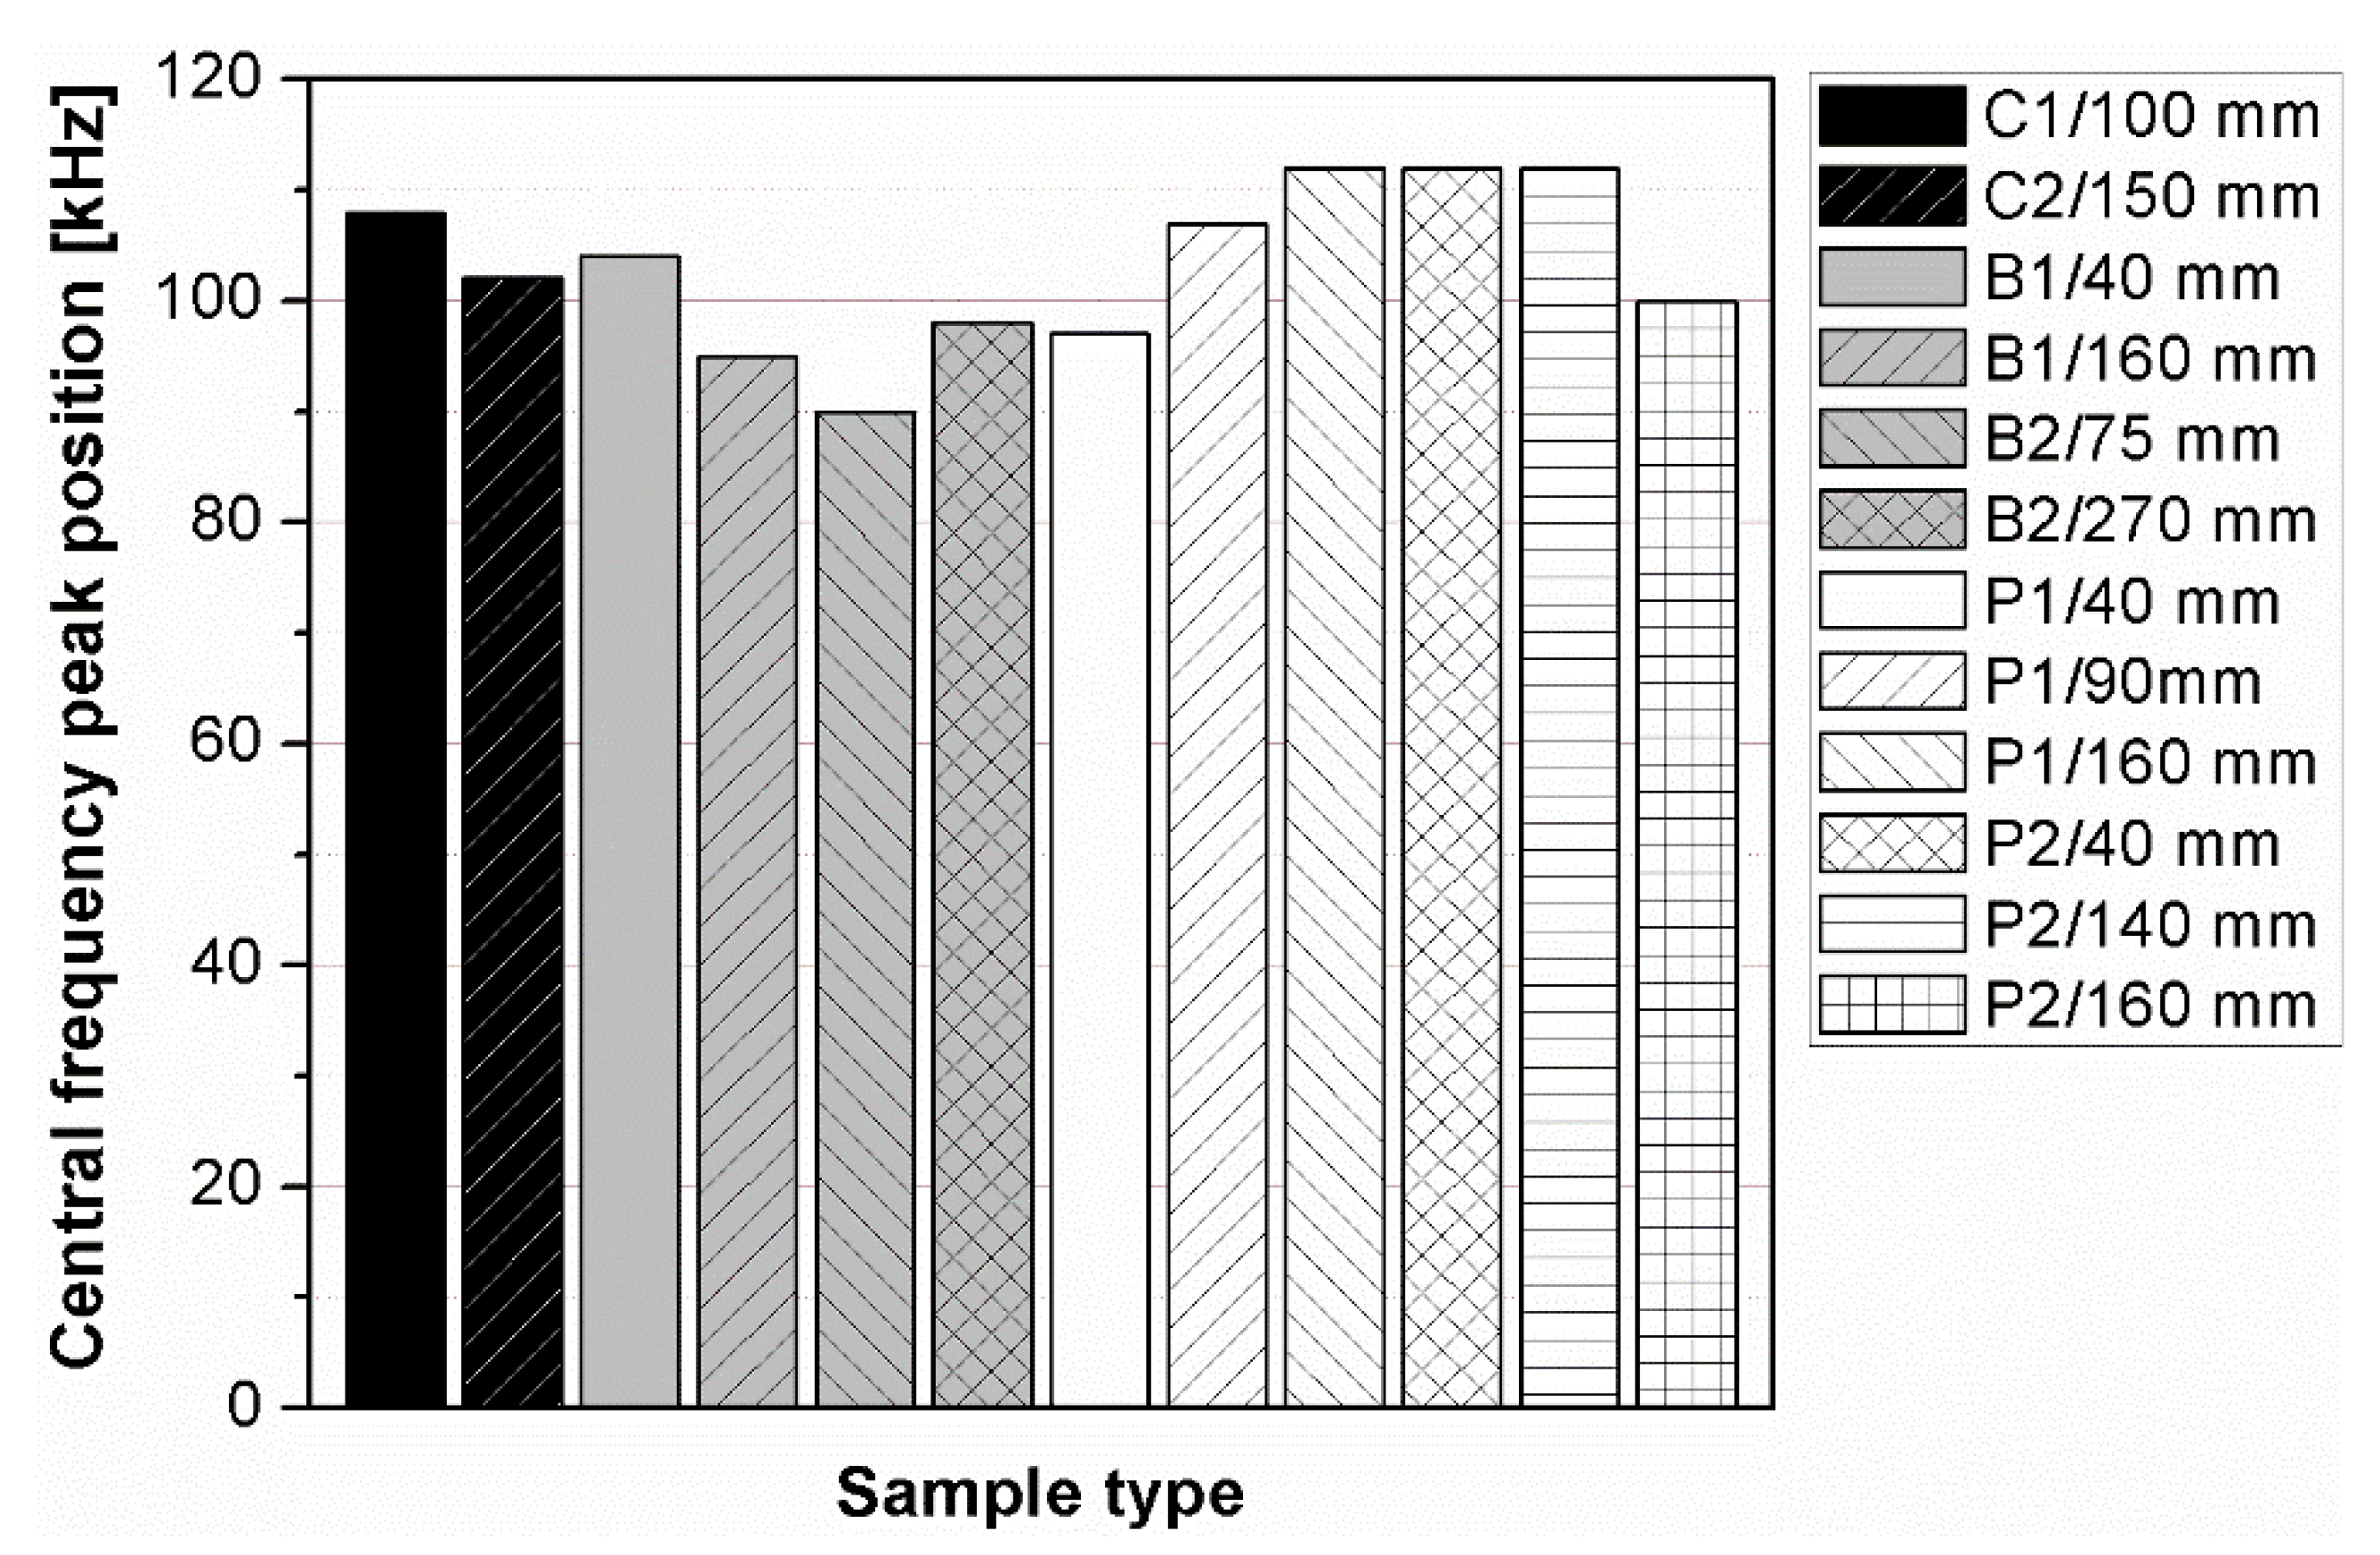
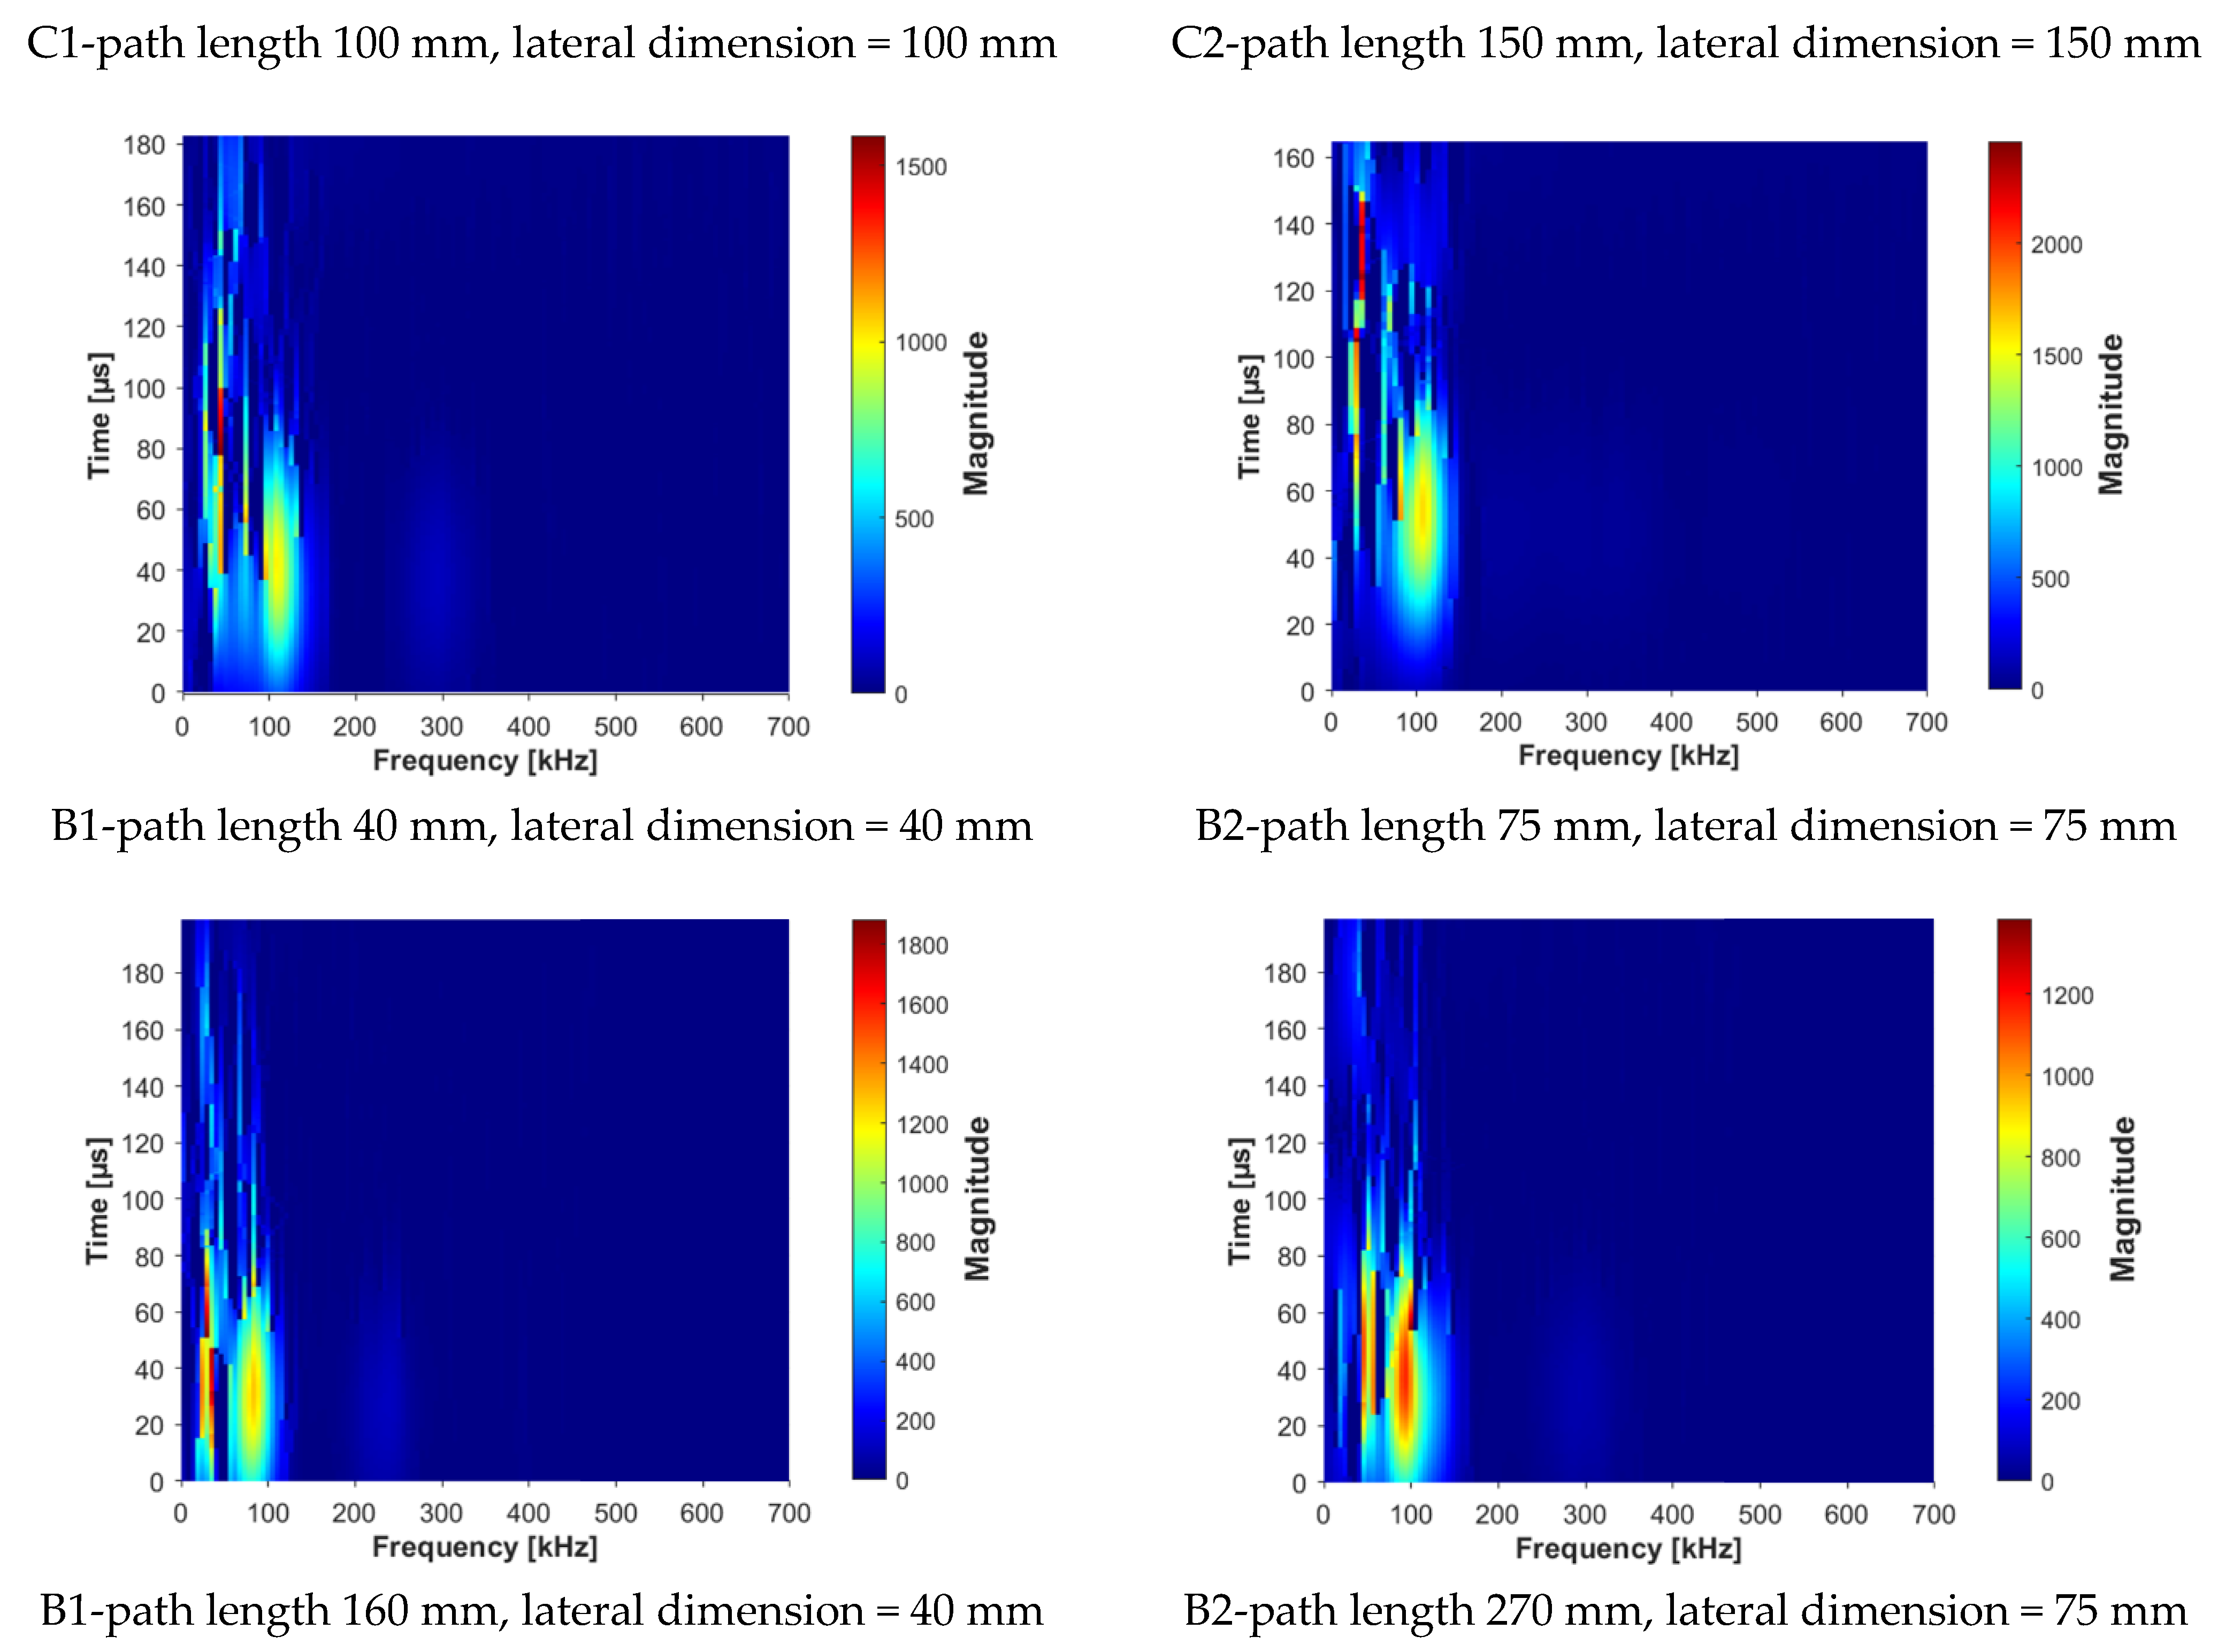
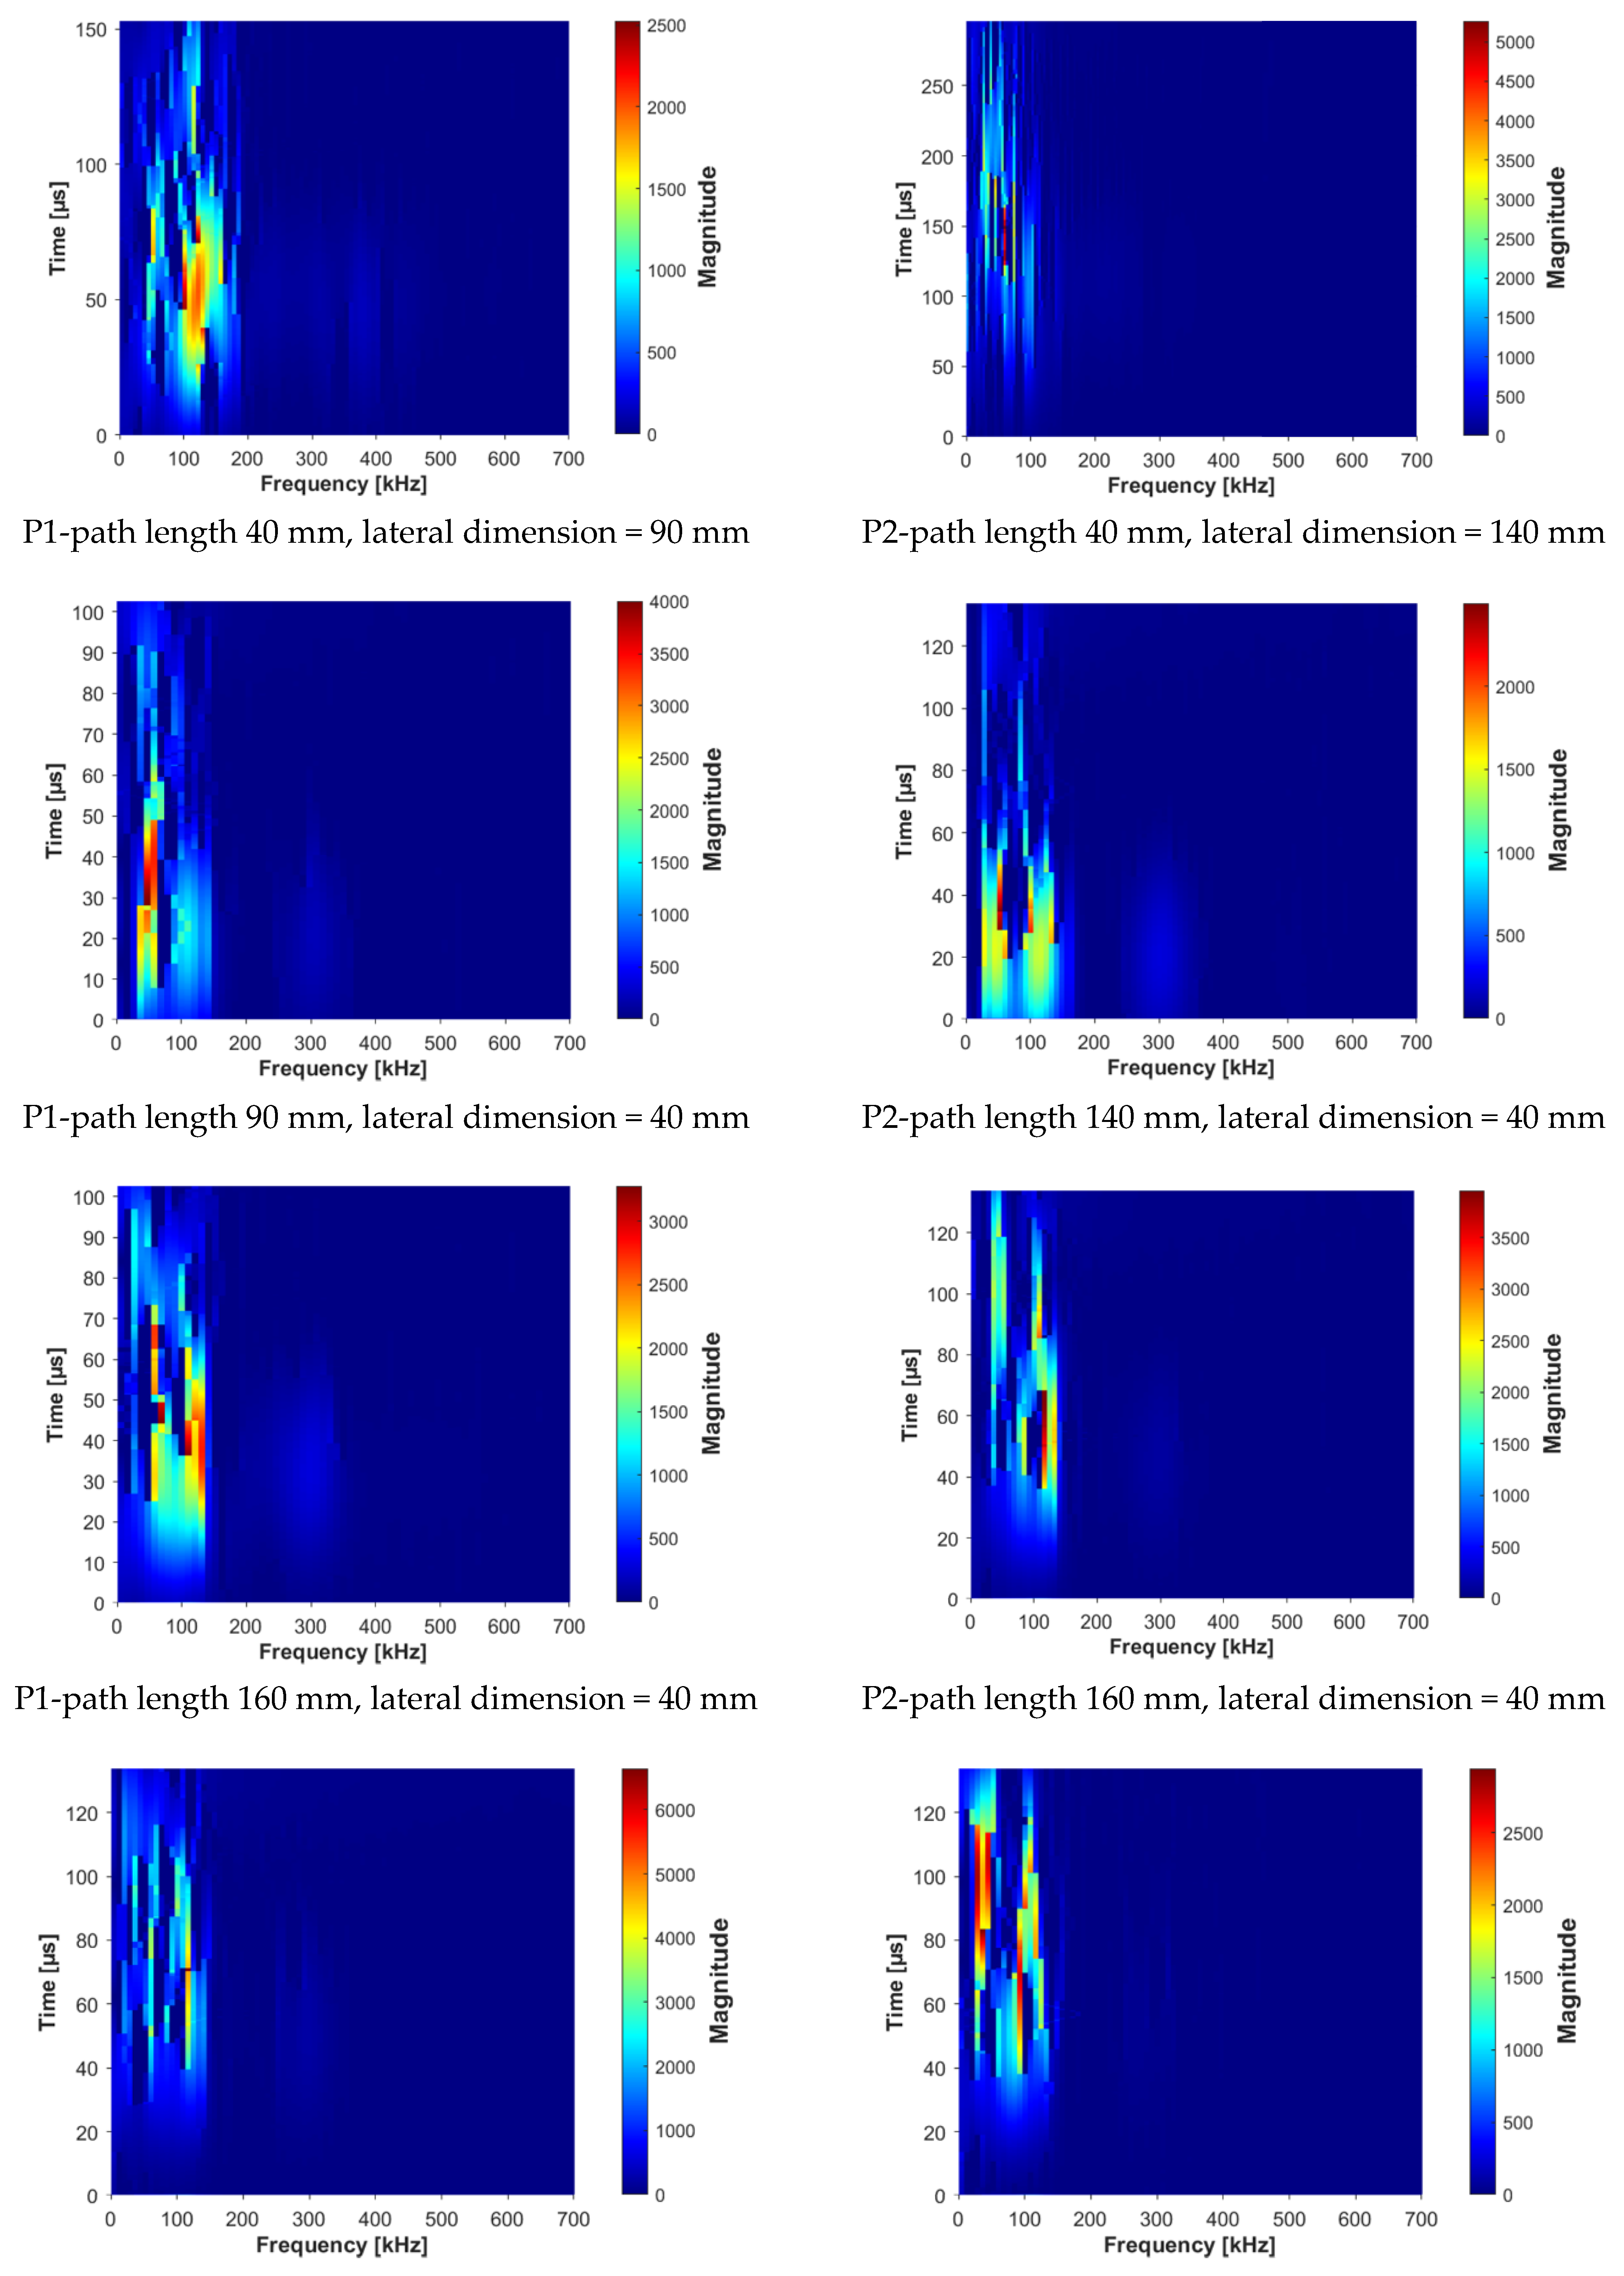
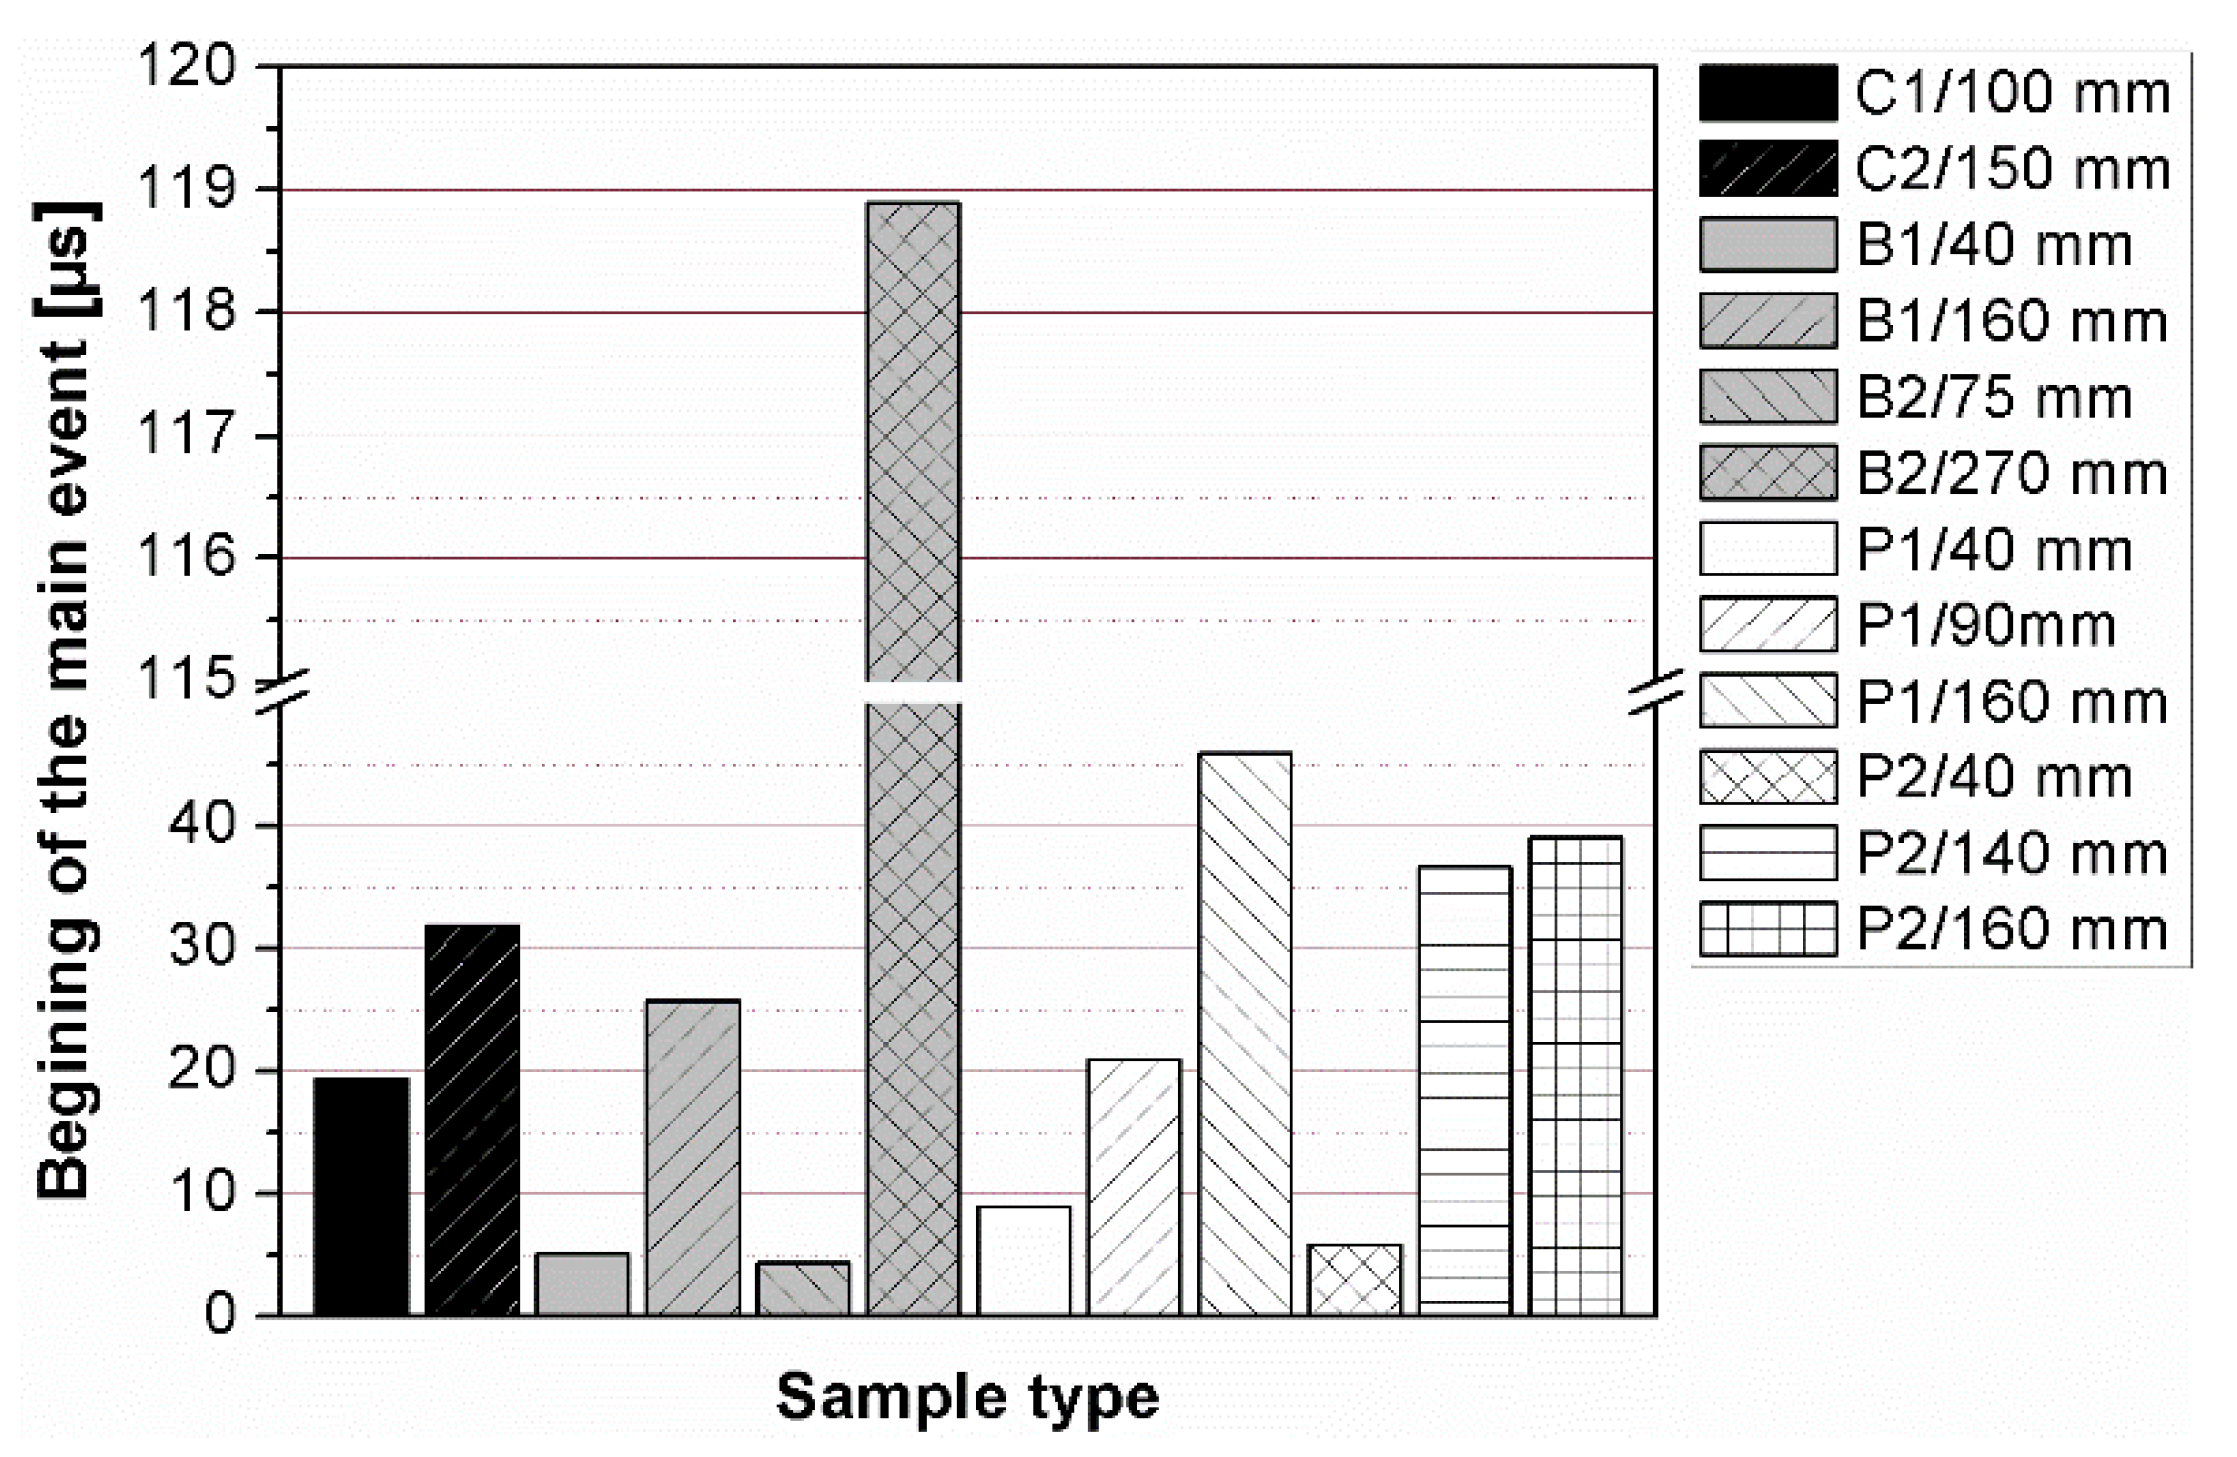
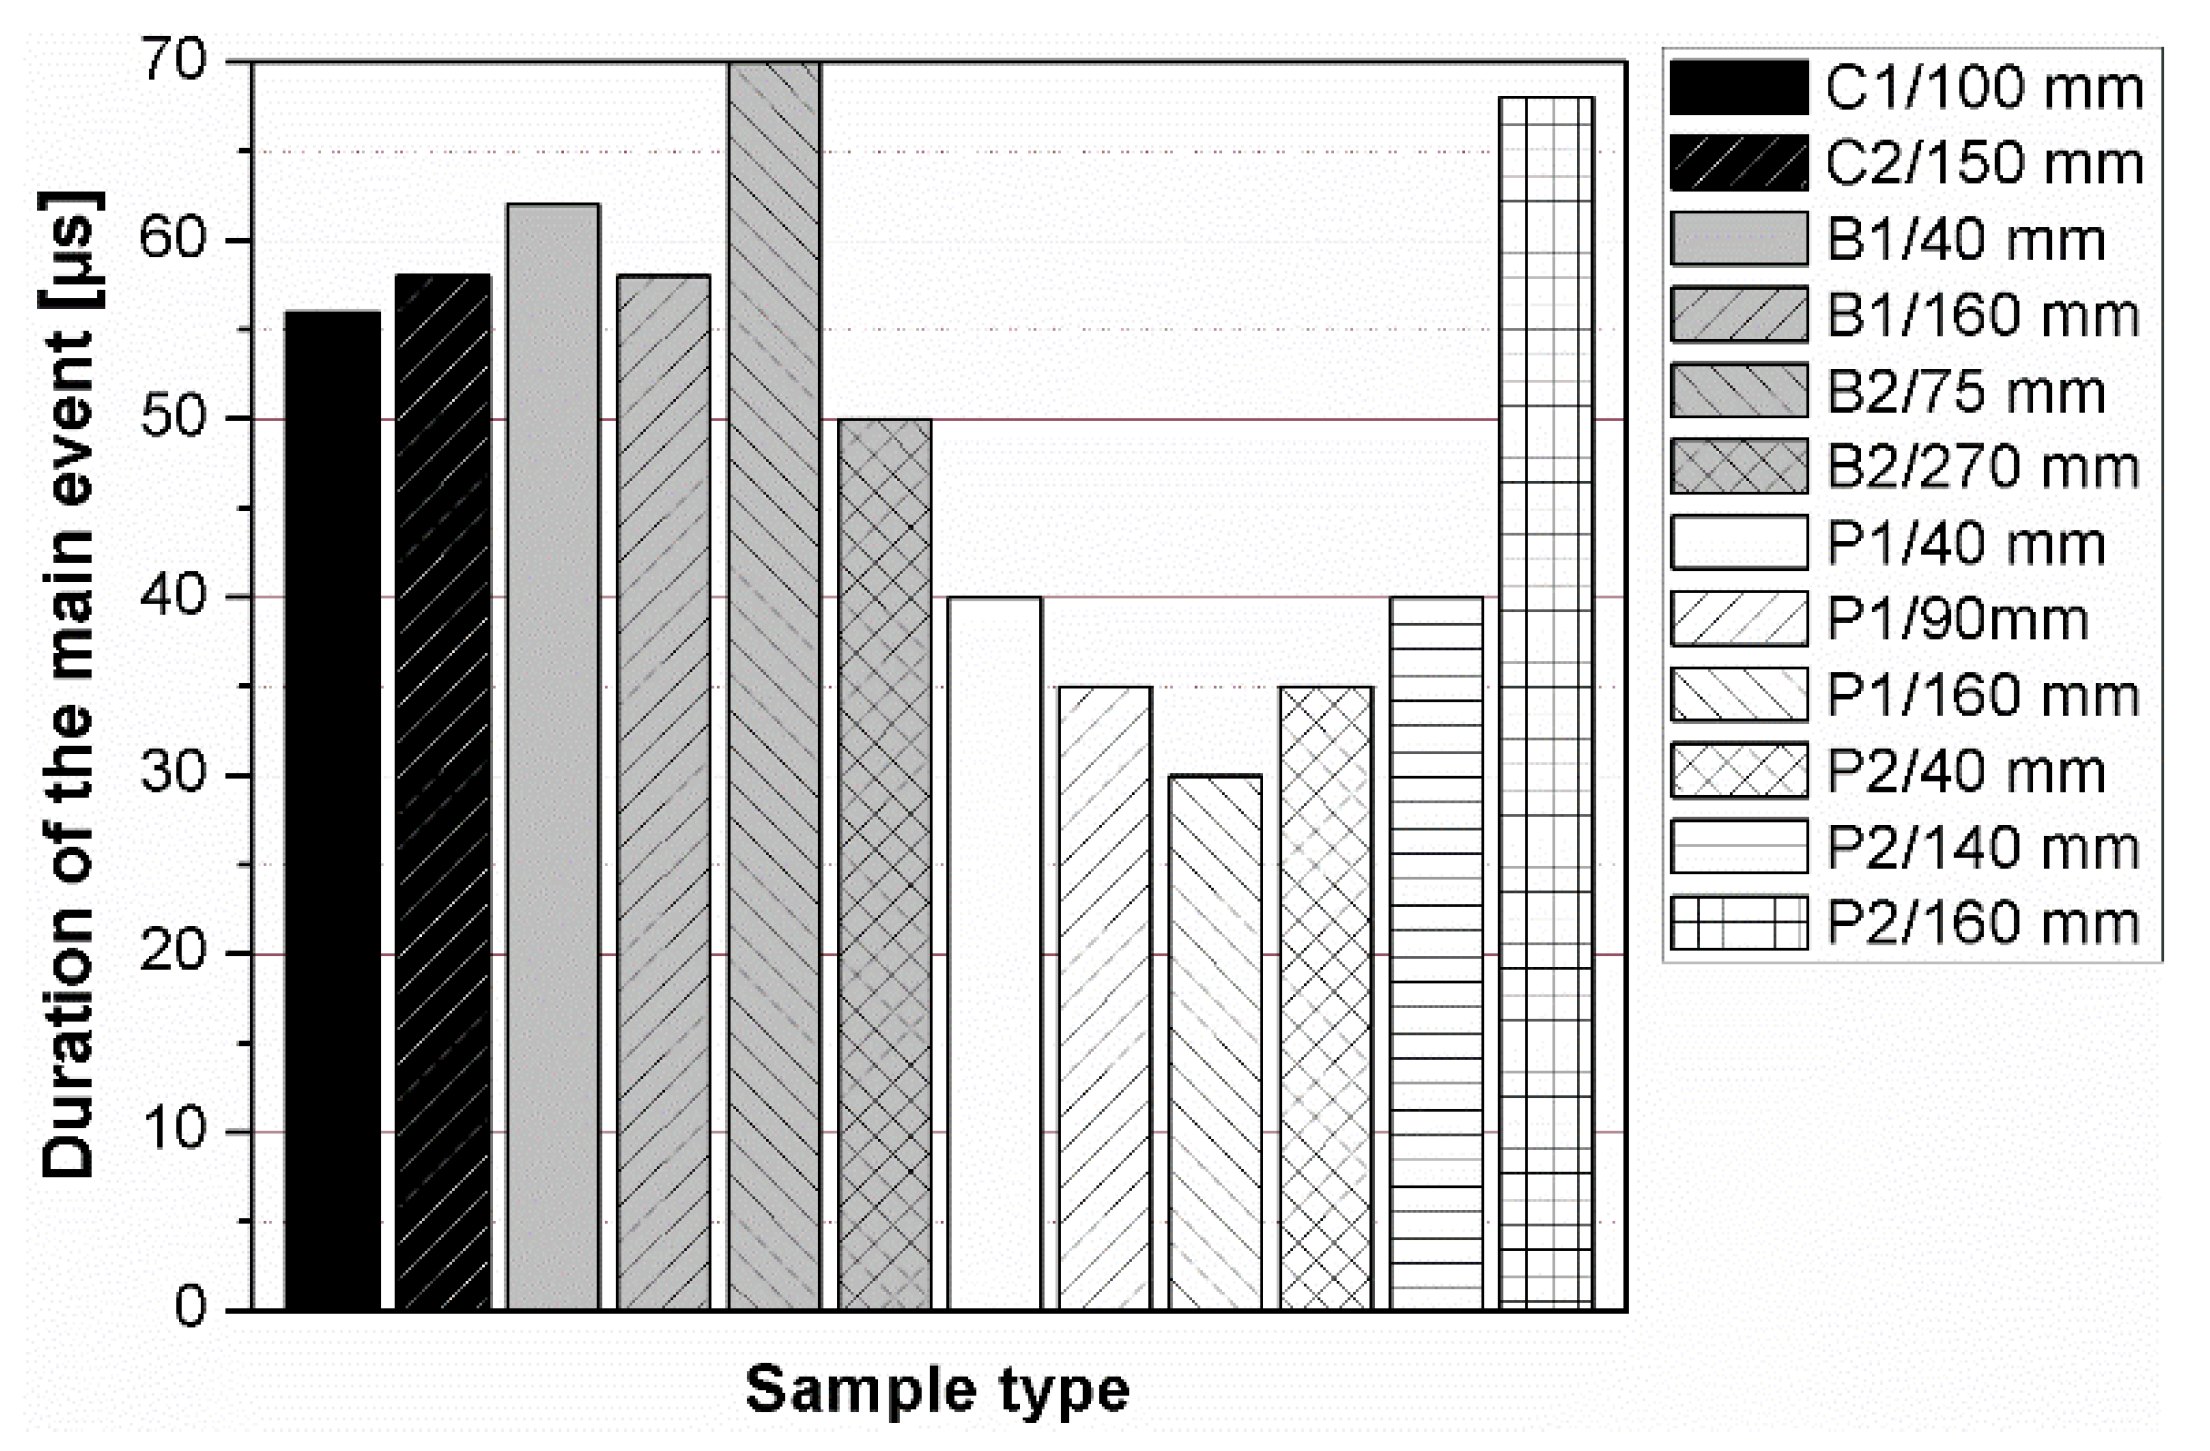
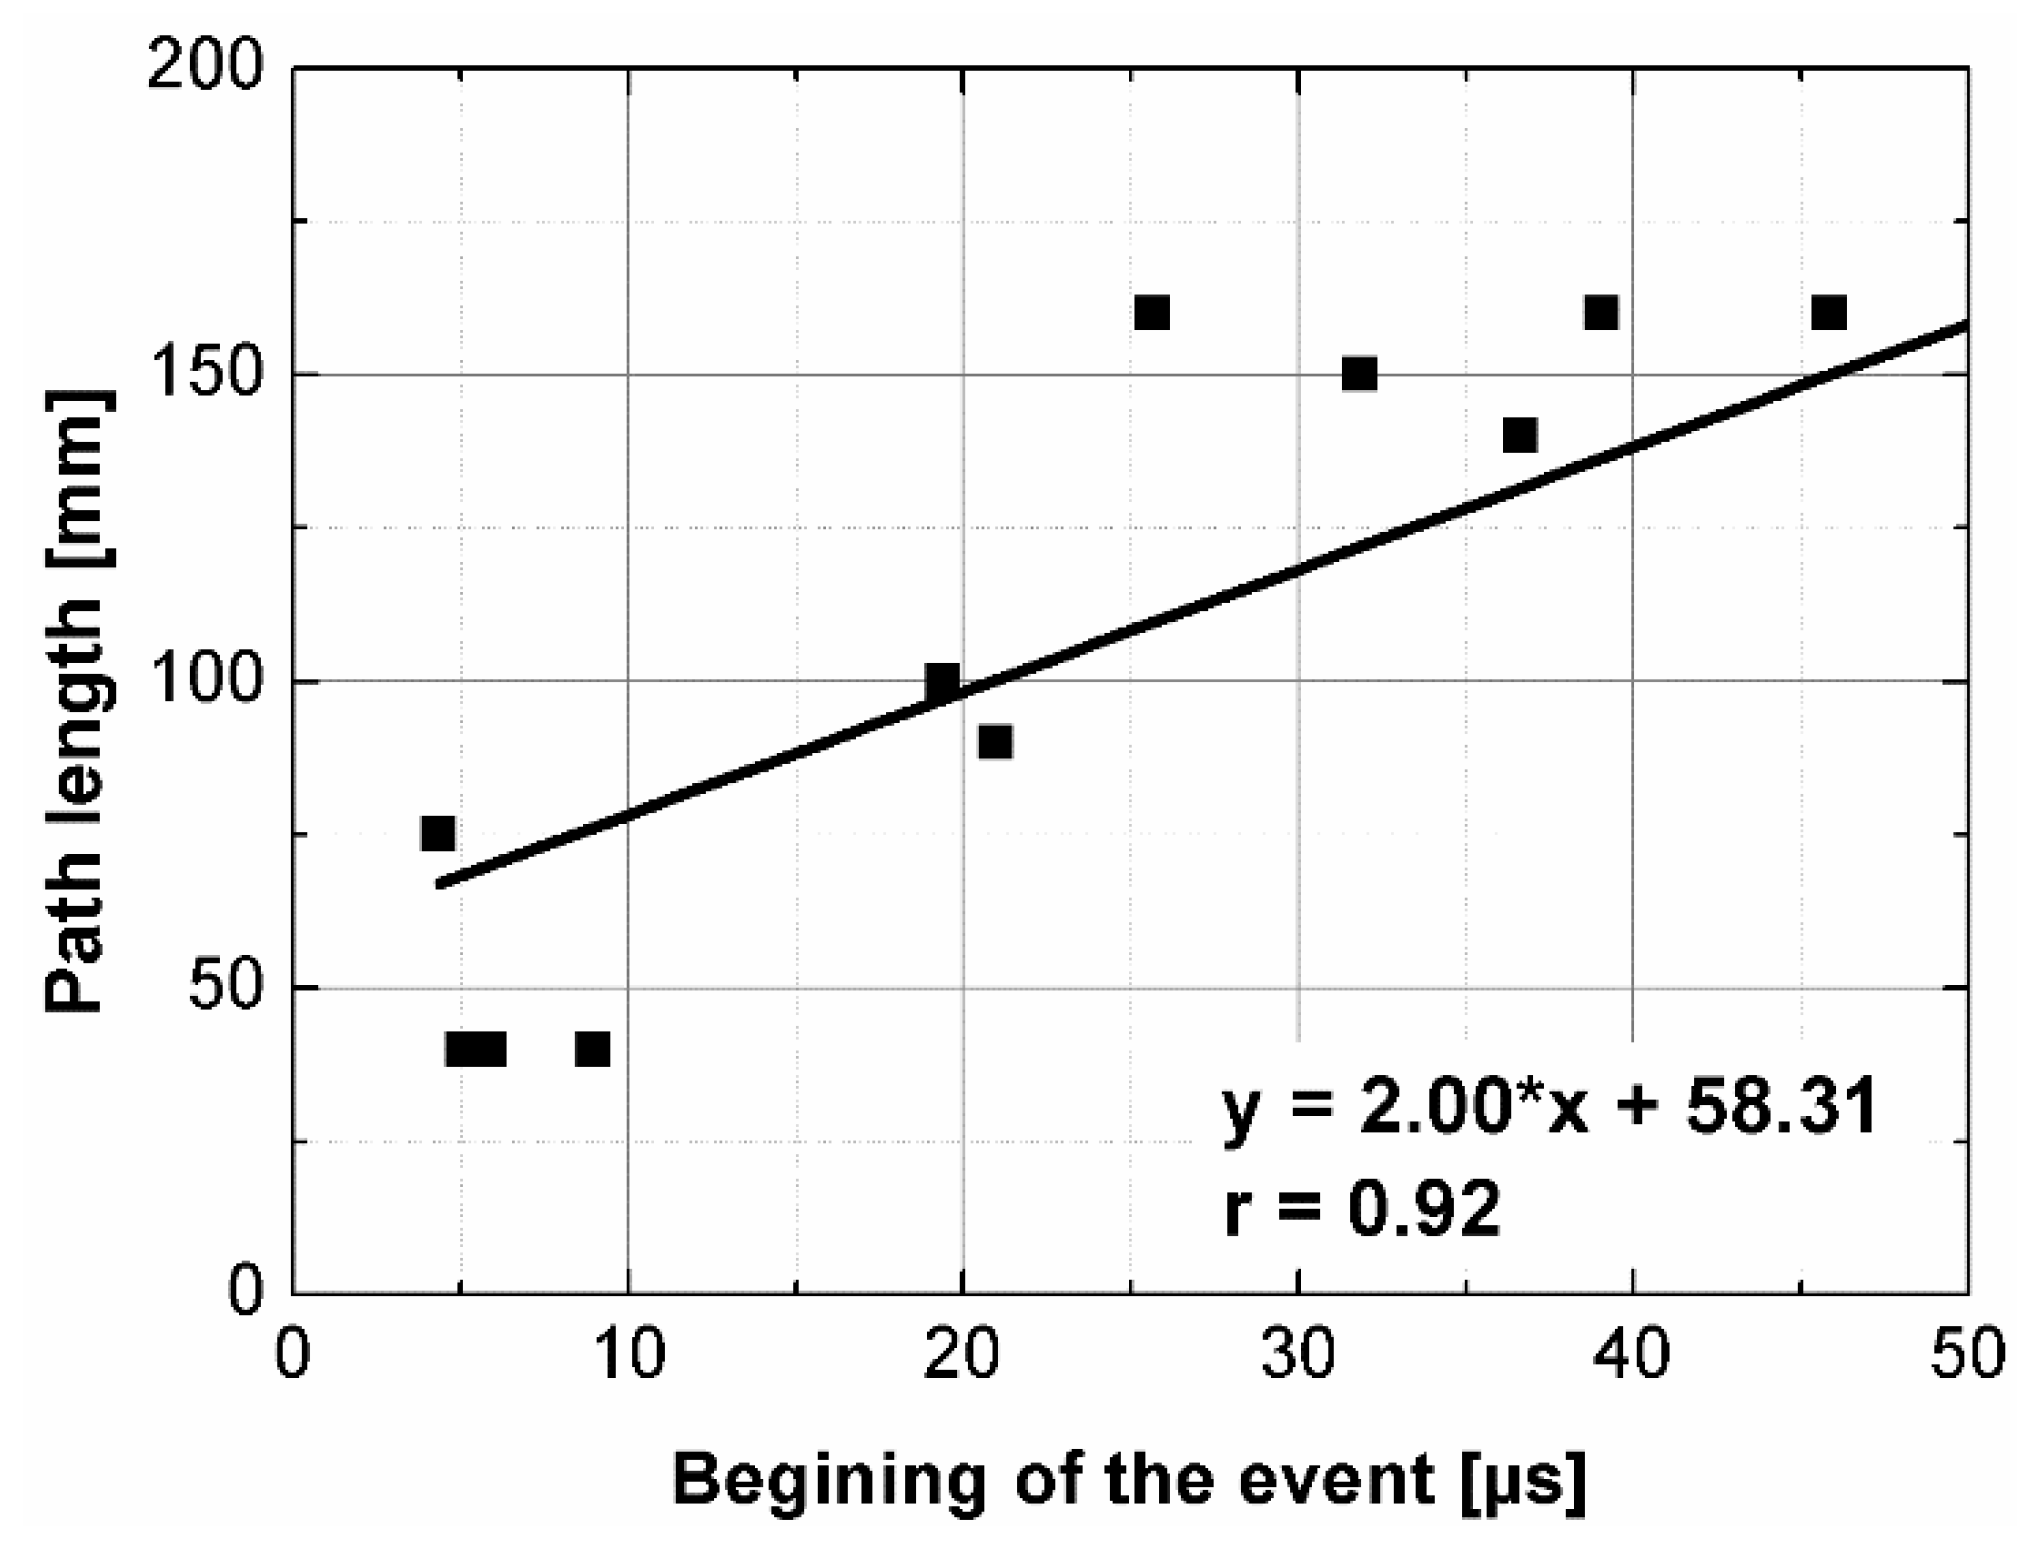
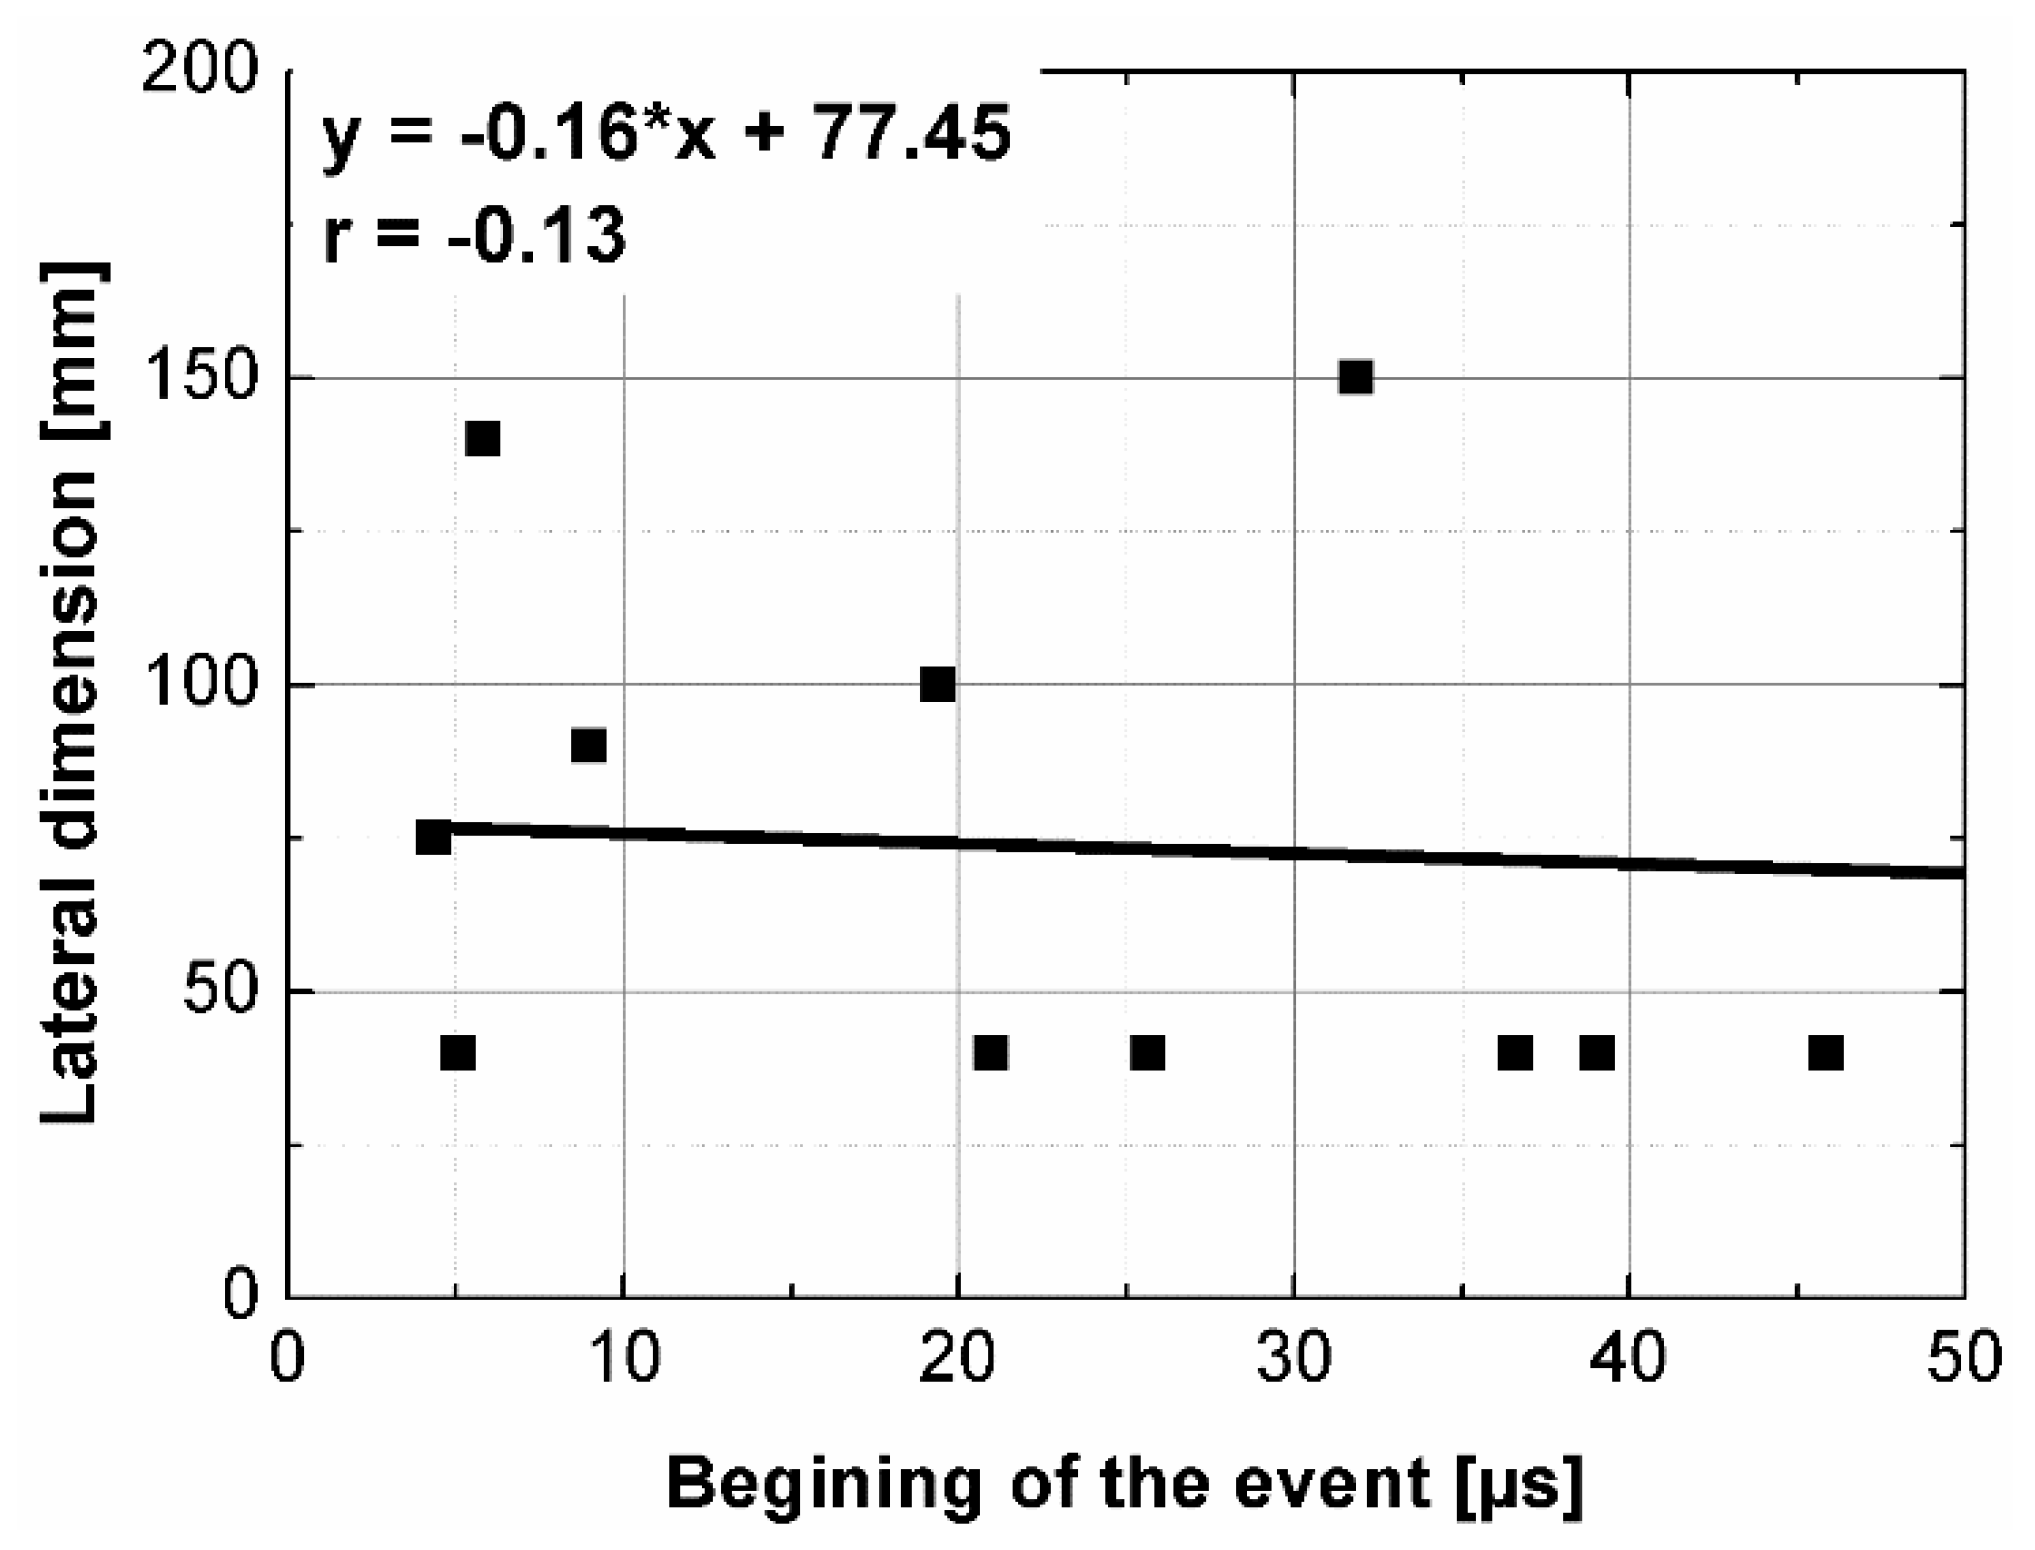
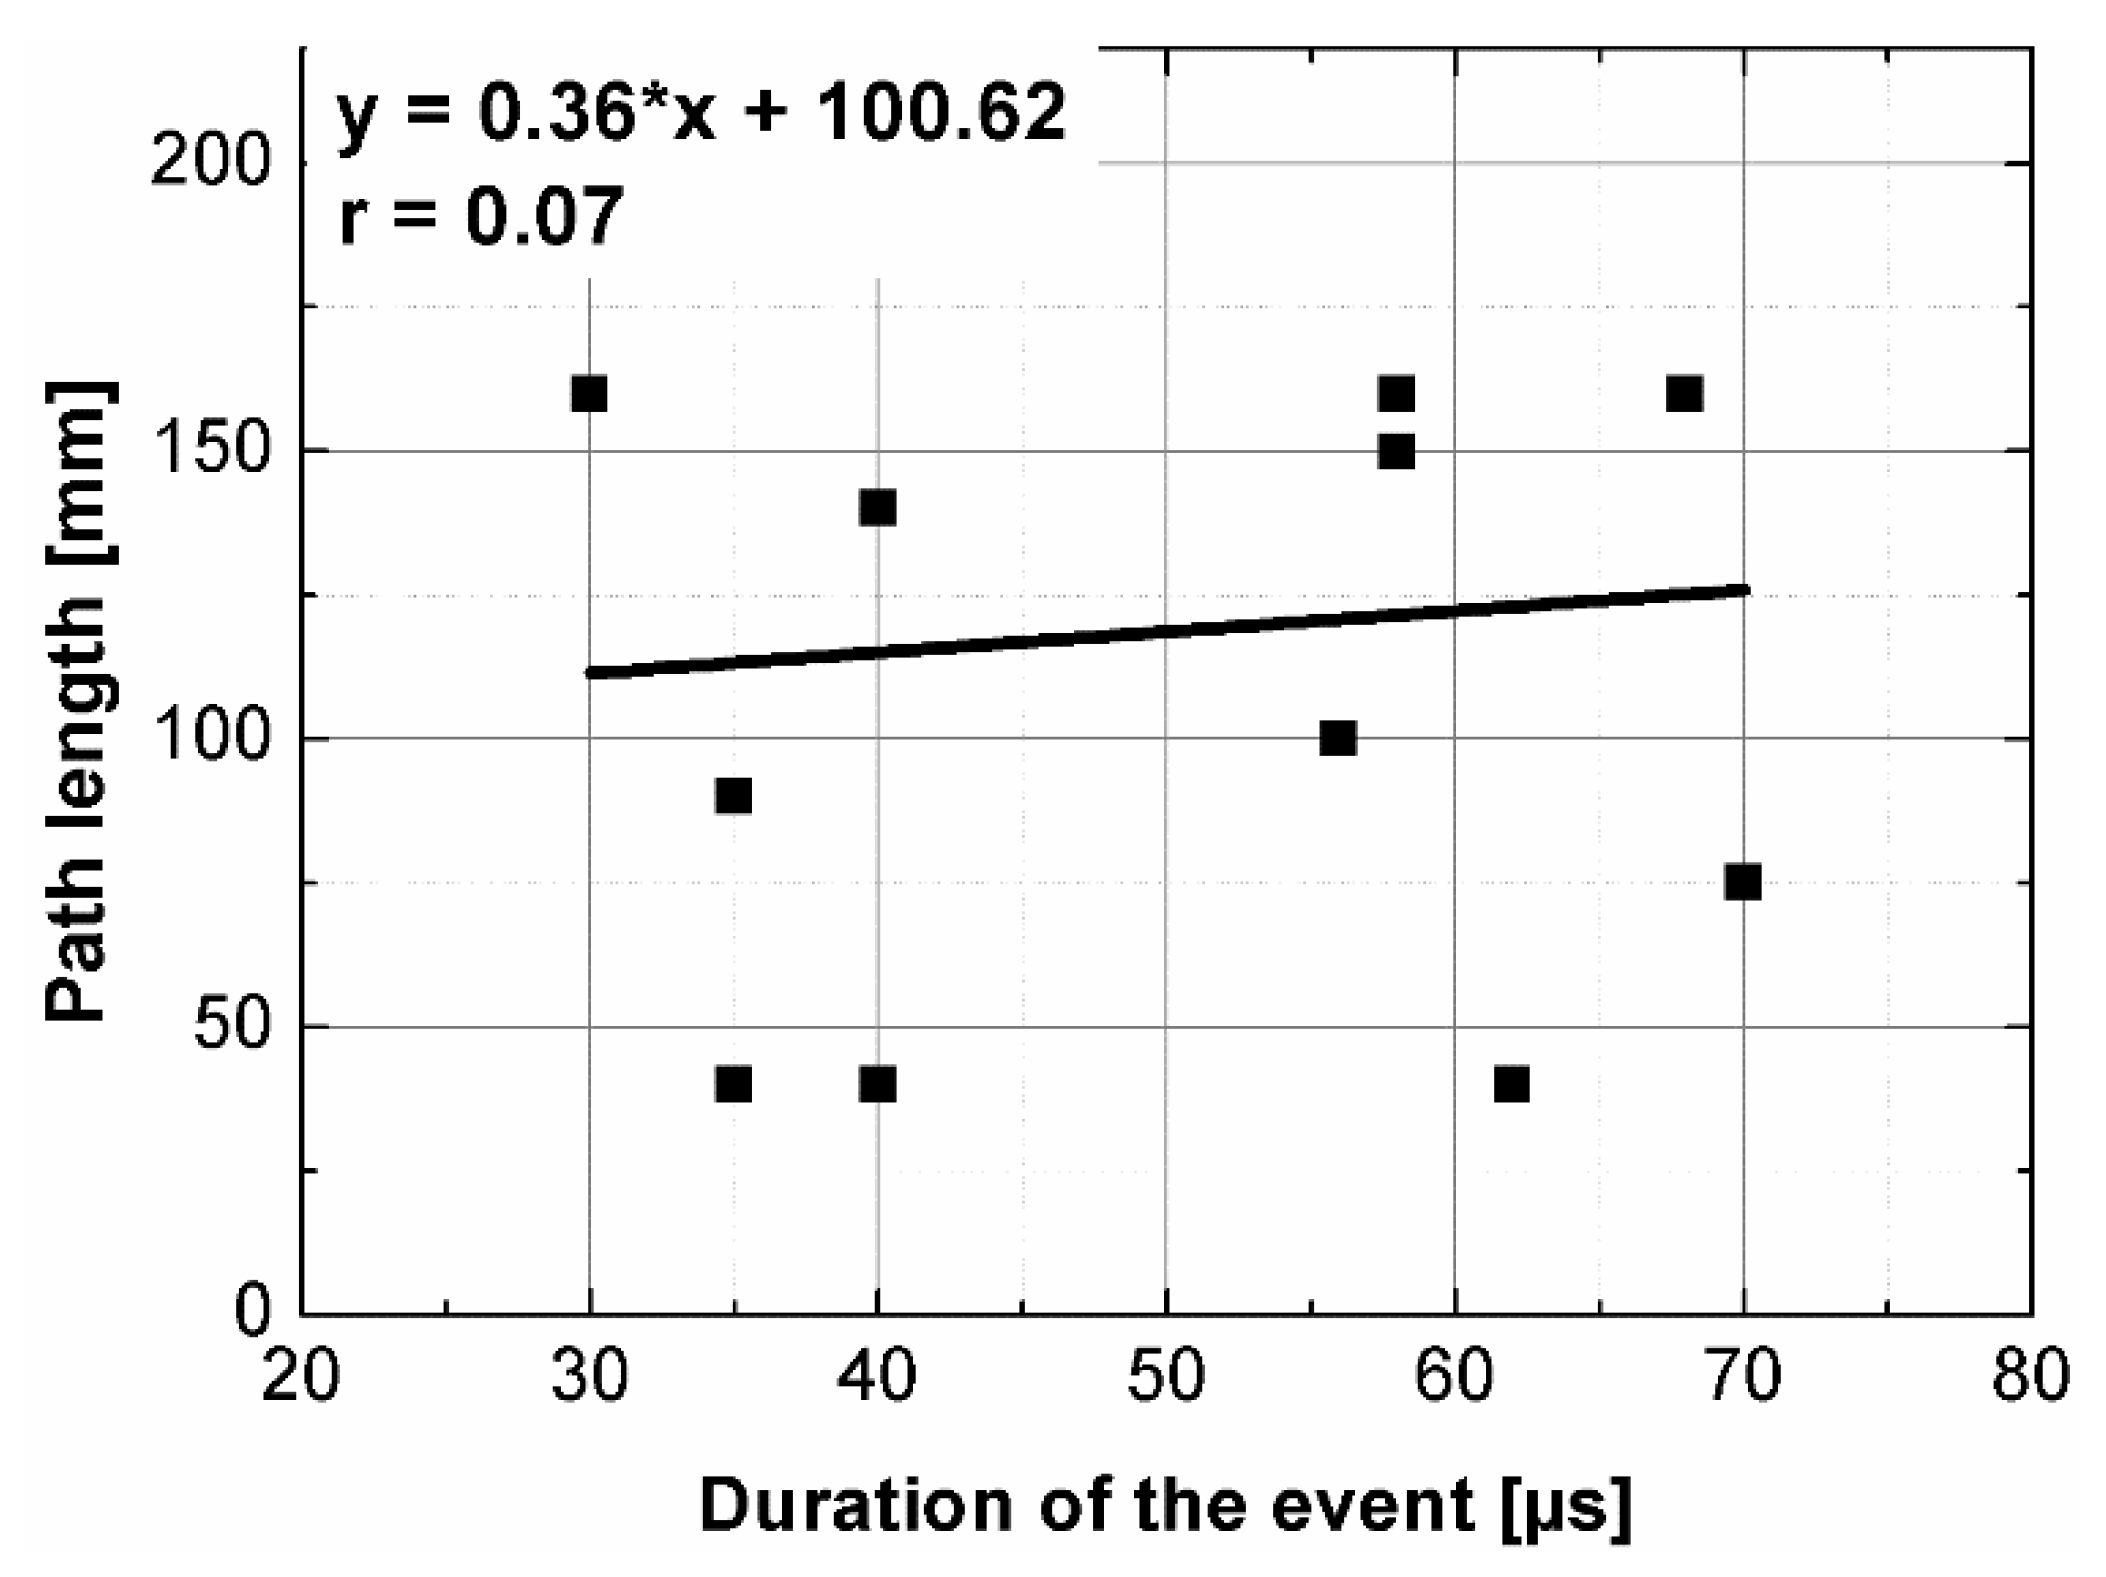
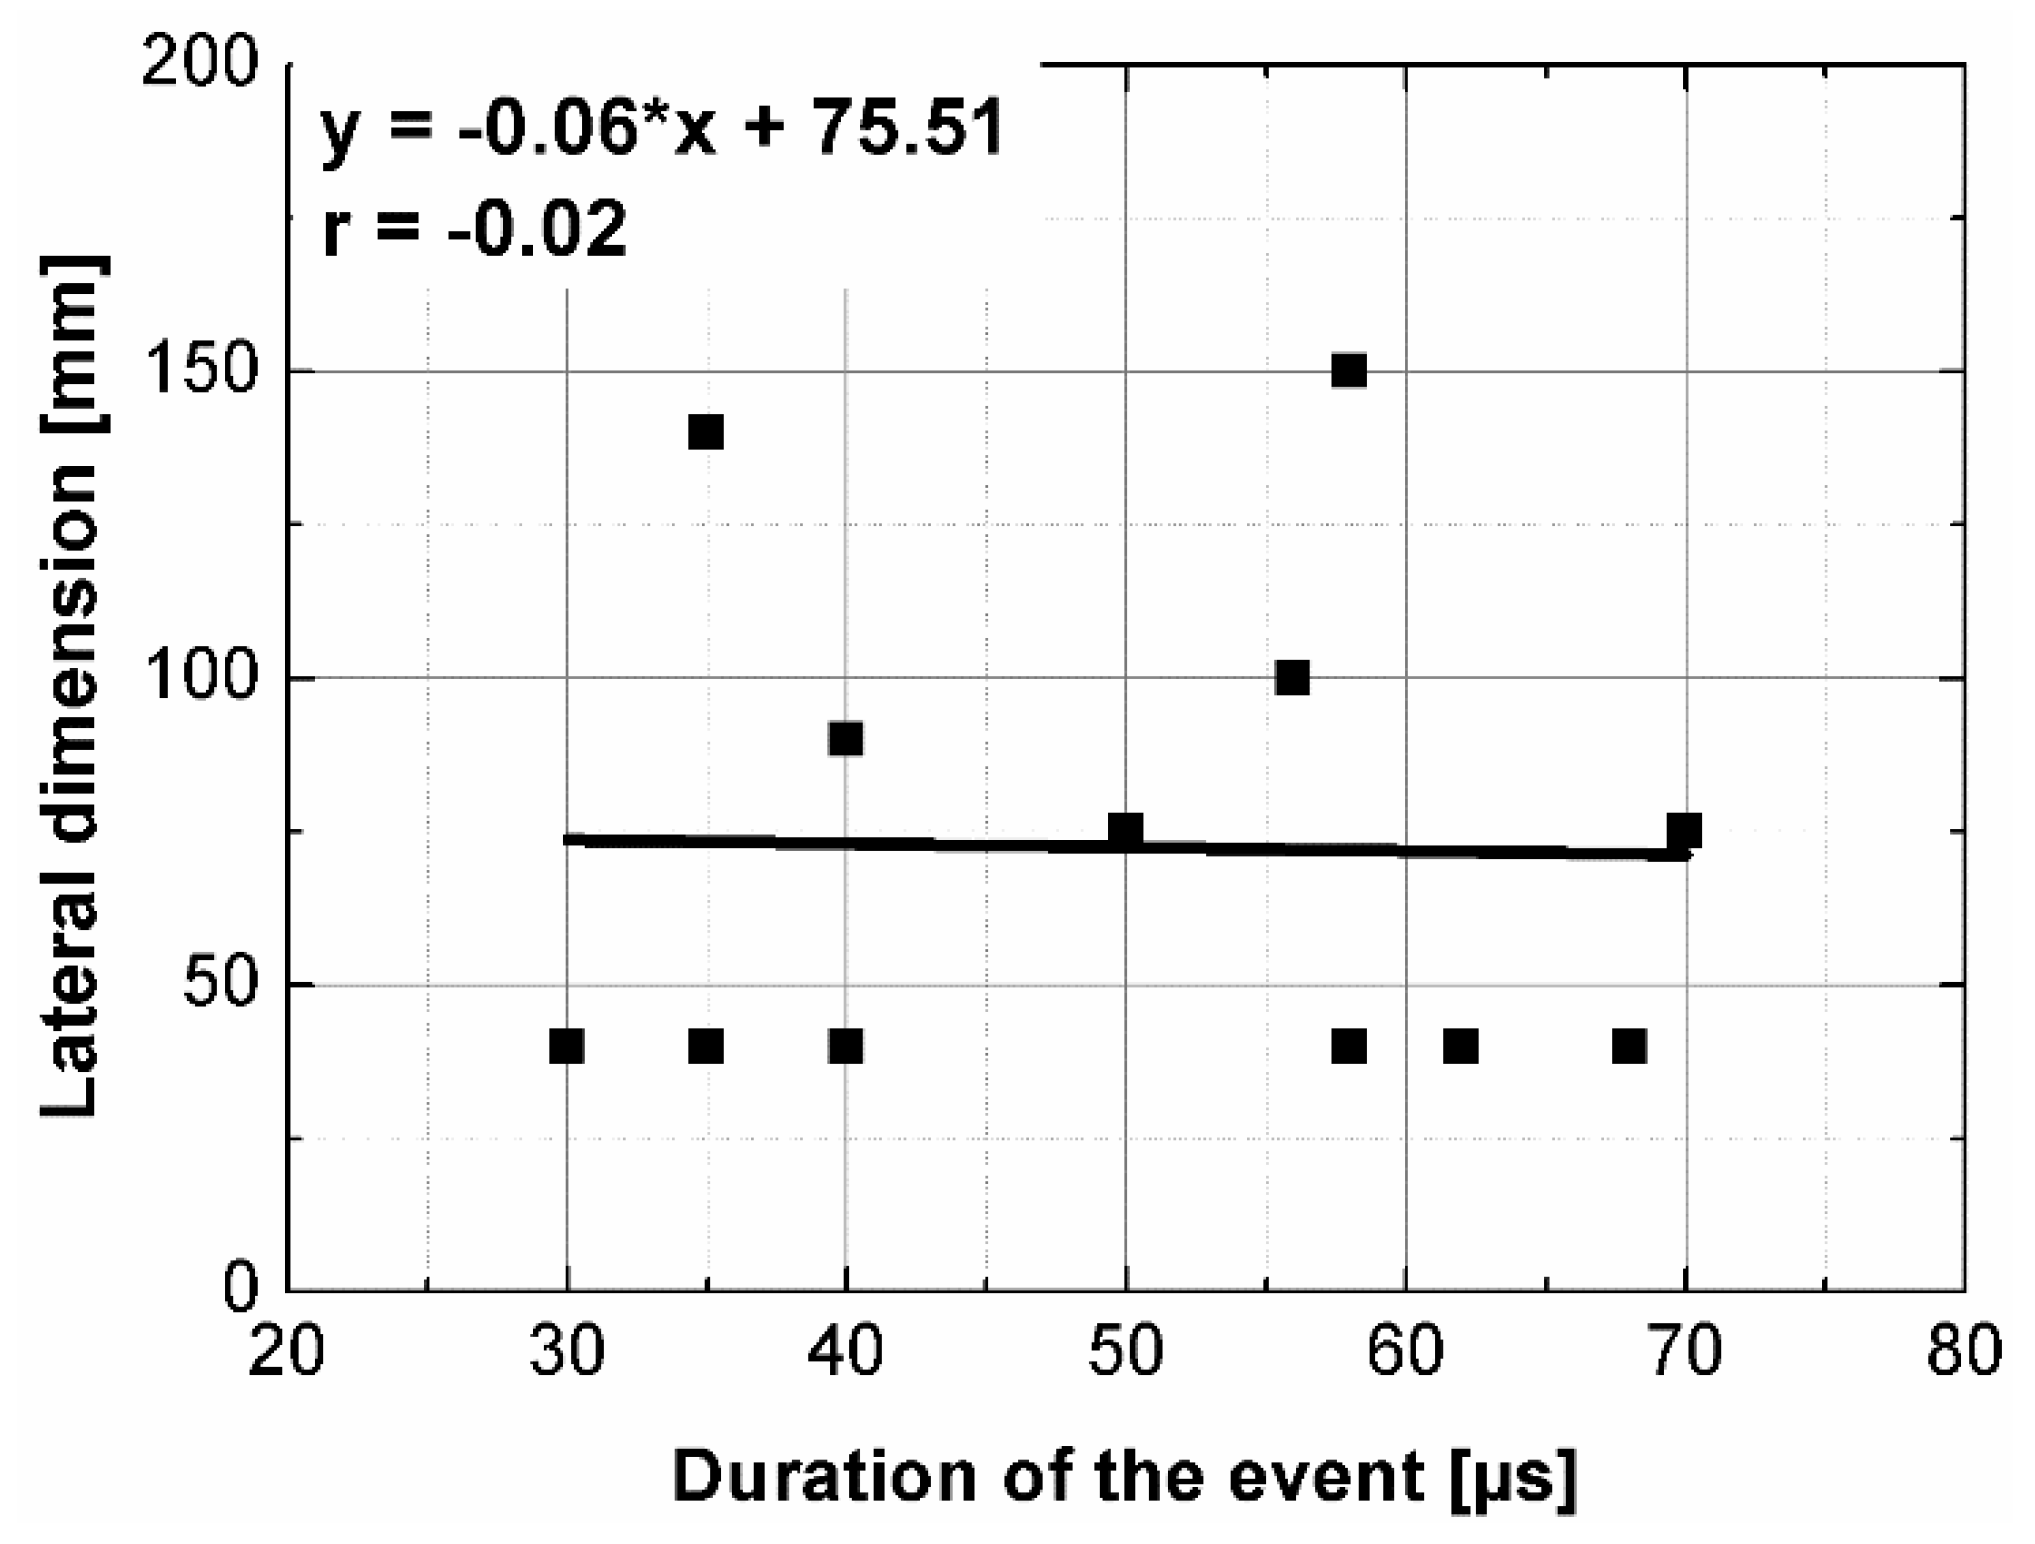
4.2. An Effect of Sample Shape and Dimensions on the Spectra Characteristics
5. Conclusions
Funding
Institutional Review Board Statement
Informed Consent Statement
Conflicts of Interest
References
- Czarnecki, L. Polymer concretes. Cem. Lime Concr. 2010, 2, 63–85. [Google Scholar]
- Garbacz, A.; Garboczi, E.J. Nist Report nr NISTIR 6975; National Institute of Standards and Technology: Gaithersburg, MD, USA, 2003; p. 76. [Google Scholar]
- Clifton, J.; Czarnecki, L.; Łukowski, P. Application of material model in optimization of polymer concretes. In Proceedings of the International Congress on Polymers in Concrete, Oostende, Belgium, 2–4 April 2006. [Google Scholar]
- Kępniak, M.; Woyciechowski, P.; Franus, W. Chemical and Physical Properties of Limestone Powder as a Potential Microfiller of Polymer Composites. Arch. Civ. Eng. 2017, 63, 67–78. [Google Scholar] [CrossRef] [Green Version]
- Schabowicz, K. Non-Destructive Testing of Materials in Civil Engineering. Materials 2019, 12, 3237. [Google Scholar] [CrossRef] [Green Version]
- NSAI Standards. Assessment of In-Situ Compressive Strength in Structures and Precast Concrete Components; NSAI: Dublin, Ireland, 2008. [Google Scholar]
- ASTM. Standard Test Method for Pulse Velocity Through Concrete; ASTM: West Conshohocken, PA, USA, 2016. [Google Scholar]
- British Standards Institute Staff. Non-Destructive Testing—Ultrasonic Testing of Steel Bars; BSI Standards: London, UK, 2004. [Google Scholar]
- ASTM. Standard Test Method for Laboratory Determination of Pulse Velocities and Ultrasonic Elastic Constants of Rock; ASTM: West Conshohocken, PA, USA, 2008. [Google Scholar]
- British Standards Institute Staff. Testing Concrete in Structures—Part 4: Determination of Ultrasonic Pulse Velocity; BSI Standards: London, UK, 2010. [Google Scholar]
- Benaicha, M.; Jalbaud, O.; Alaoui, A.H.; Burtschell, Y. Correlation between the mechanical behavior and the ultrasonic velocity of fiber-reinforced concrete. Constr. Build. Mater. 2015, 101, 702–709. [Google Scholar] [CrossRef]
- Santoso, A.; Widodo, S.; Ma’Arif, F. Prediction of Lighweight Concrete Panel Homogeneity by Ultrasonic Pulse Velocity (UPV); Atlantis Press: Dordrecht, The Netherlands, 2017. [Google Scholar]
- Rao, S.K.; Sravana, P.; Rao, T.C. Experimental studies in Ultrasonic Pulse Velocity of roller compacted concrete pavement containing fly ash and M-sand. Int. J. Pavement Res. Technol. 2016, 9, 289–301. [Google Scholar] [CrossRef] [Green Version]
- Shahidan, S.; Hannan, N.I.R.R.; Zuki, S.S.M.; Abdullah, S.R.; Mohamad, N. NDT assessment of normal concrete with ag-gregate of different sizes in damaged and undamaged states. ARPN J. Eng. Appl. Sci. 2016, 11, 9843–9847. [Google Scholar]
- Runkiewicz, L.; Zalegowski, K.; Piotrowski, T.; Garbacz, A. The application of ultrasonic method to evaluation of compressive strength of shielding concretes (Zastosowanie metody ultradźwiękowej do oceny właściwości mechanicznych betonów osłonowych). Przegląd Spaw. 2015, 87, 17–20. [Google Scholar]
- Ye, G.; van Breugel, K.; Fraaij, A.L.A. Experimental study on ultrasonic pulse velocity evaluation of the microstructure of cementitious material at early age. HERON 2001, 46, 161–167. [Google Scholar]
- Mohammed, T.U.; Rahman, M.N. Effect of types of aggregate and sand-to-aggregate volume ratio on UPV in concrete. Constr. Build. Mater. 2016, 125, 832–841. [Google Scholar] [CrossRef]
- Lorenzi, A.; Caetano, L.F.; Campagnolo, J.L.; Lorenzi, L.S.; da Silva Filho, L.C.P. Application of Ultrasonic Pulse Velocity to Detect Concrete Flaws. E-J. Nondestruct. Test. Ultrason. 2015, 11, 18430. [Google Scholar]
- Petro, J.T.; Kim, J. Detection of delamination in concrete using ultrasonic pulse velocity test. Constr. Build. Mater. 2011, 26, 574–582. [Google Scholar] [CrossRef]
- Kaszyński, J. An investigation into the depth in a cracks in a reinforced concrete structures using an ultrasonic method. In Proceedings of the 15th World Conference on Non Destructive Testing, Roma, Italy, 15–21 October 2000. [Google Scholar]
- Czarnecki, L.; Garbacz, A.; Krystosiak, M. On the ultrasonic assessment of adhesion between polymer coating and concrete substrate. Cem. Concr. Compos. 2006, 28, 360–369. [Google Scholar] [CrossRef]
- Garbacz, A.; Piotrowski, T.; Courard, L.; Kwaśniewski, L. On the evaluation of interface quality in concrete repair system by means of impact-echo signal analysis. Constr. Build. Mater. 2017, 134, 311–323. [Google Scholar] [CrossRef] [Green Version]
- Borhan, T.M.; Al Karawi, R.J. Experimental investigations on polymer modified pervious concrete. Case Stud. Constr. Mater. 2020, 12, e00335. [Google Scholar] [CrossRef]
- Garbacz, A.; Sokołowska, J.J.; Lutomirski, A.; Courard, L. Fly ash polymer concrete quality assessment using ultrasonic method. In Proceedings of the 7th Asian symposium on polymers in concrete, Istanbul, Turkey, 6–8 October 2012. [Google Scholar]
- Elmoaty, A.E.M.A. Self-healing of polymer modified concrete. Alex. Eng. J. 2011, 50, 171–178. [Google Scholar]
- Sokołowska, J.J.; Zalegowski, K. Ultrasonic Quality Assessment of Polymer-Cement Concrete with Pet Waste as the Aggregate. Arch. Civ. Eng. 2018, 64, 67–77. [Google Scholar] [CrossRef] [Green Version]
- Yaman, I.S.; Inci, G.; Yesiller, N.; Aktan, H.M. Ultrasonic Pulse Velocity in Concrete Using Direct and Indirect Transmission. ACI Mater. J. 2011, 98, 450–457. [Google Scholar]
- Karaiskos, G.; Deraemaeker, A.; Aggelis, D.G.; Van Hemelrijck, D. Monitoring of concrete structures using the ultrasonic pulse velocity method. Smart Mater. Struct. 2015, 24, 113001. [Google Scholar] [CrossRef] [Green Version]
- Al-Khafaji, S.; Purnell, P. Effect of coupling media on ultrasonic pulse velocity in concrete: A preliminary investigation. Int. J. Civ. Environ. Eng. 2016, 10, 118–122. [Google Scholar]
- Ndagi, A.; Umar, A.; Hejazi, F.; Jaafar, M.S. Non-destructive assessment of concrete deterioration by ultrasonic pulse velocity: A review. In IOP Conference Series: Earth and Environmental Science; IOP Publishing: Bristol, UK, 2019; Volume 357, p. 012015. [Google Scholar]
- Fodil, N.; Chemrouk, M.; Ammar, A. Influence of steel reinforcement on ultrasonic pulse velocity as a non-destructive evalu-ation of high-performance concrete strength. Eur. J. Environ. Civ. 2018, 25, 281–301. [Google Scholar] [CrossRef]
- Garbacz, A.; Piotrowski, T.; Zalegowski, K.; Adamczewski, G. UIR-Scanner Potential to Defect Detection in Concrete. Adv. Mater. Res. 2013, 687, 359–365. [Google Scholar] [CrossRef]
- Güneyli, H.; Karahan, S.; Güneyli, A.; Yapιcι, N. Water content and temperature effect on ultrasonic pulse velocity of concrete. Russ. J. Nondestruct. Test. 2017, 53, 159–166. [Google Scholar] [CrossRef]
- Naik, T.; Malhotra, V.M.; Popovics, J.S. The Ultrasonic Pulse Velocity Method. In Handbook on Nondestructive Testing of Concrete, 2nd ed.; CRC Press: Boca Raton, FL, USA, 2003; p. 20. [Google Scholar]
- Wiciak, P.; Cascante, G.; Polak, M.A. Sensor and Dimensions Effects in Ultrasonic Pulse Velocity Measurements in Mortar Specimens. Procedia Eng. 2017, 193, 409–416. [Google Scholar] [CrossRef]
- Stawiski, B.; Kania, T. Determination of the Influence of Cylindrical Samples Dimensions on the Evaluation of Concrete and Wall Mortar Strength Using Ultrasound Method. Procedia Eng. 2013, 57, 1078–1085. [Google Scholar] [CrossRef] [Green Version]
- Ersoy, H.; Karahan, M.; Babacan, A.E.; Sünnetci, M.O. A new approach to the effect of sample dimensions and measurement techniques on ultrasonic wave velocity. Eng. Geol. 2019, 251, 63–70. [Google Scholar] [CrossRef]
- Turgut, P. Research into the correlation between concrete strength and UPV values. NDT. Net 2004, 12, 1–9. [Google Scholar]
- Hong, S.; Yoon, S.; Kim, J.; Lee, C.; Kim, S.; Lee, Y. Evaluation of Condition of Concrete Structures Using Ultrasonic Pulse Velocity Method. Appl. Sci. 2020, 10, 706. [Google Scholar] [CrossRef] [Green Version]
- Ju, M.; Park, K.; Oh, H. Estimation of Compressive Strength of High Strength Concrete Using Non-Destructive Technique and Concrete Core Strength. Appl. Sci. 2017, 7, 1249. [Google Scholar] [CrossRef] [Green Version]
- Trtnik, G.; Kavčič, F.; Turk, G. Prediction of concrete strength using ultrasonic pulse velocity and artificial neural networks. Ultrasonics 2009, 49, 53–60. [Google Scholar] [CrossRef] [Green Version]
- Sokołowska, J.; Piotrowski, T.; Gajda, I. The Influence of Specimen Shape and Size on the PCC Compressive Strength Values. In International Congress on Polymers in Concrete (ICPIC 2018); Springer: Singapore, 2018; pp. 267–273. [Google Scholar]
- RILEM. Draft recommendations for in situ concrete strength determination by combined non-destructive methods. Mater. Struct. 1993, 26, 43–49. [Google Scholar] [CrossRef]
- Mantrala, S.K.; Vipulanandan, C. Nondestructive Evaluation of Polyester Polymer Concrete. Mater. J. 1995, 92, 660–668. [Google Scholar]
- Sasanipour, H.; Aslani, F. Effect of specimen shape, silica fume and curing age on durability properties of self-compacting concrete incorporating course recycled concrete aggregates. Constr. Build. Mater. 2019, 228, 117054. [Google Scholar] [CrossRef]
- Godinho, J.P.; Júnior, T.F.D.S.; Medeiros, M.H.F.; A Silva, M.S. Factors influencing ultrasonic pulse velocity in concrete. Rev. IBRACON Estrut. Mater. 2020, 13, 222–247. [Google Scholar] [CrossRef]
- Łukowski, P.; Sokołowska, J.; Kępniak, M. The introductory evaluation of possibility of using waste perlite powder in building polymer composites. Bud. Arch. 2014, 13, 119–126. [Google Scholar] [CrossRef]
- Ciech Resins. Available online: https://www.ciechresins.com (accessed on 4 November 2021).
- Burrus, C.S.; Firgo, M.; Johnson, S.G.; Pueschel, M.; Selesnick, I. Fast Fourier Transforms; Burrus, C.S., Ed.; Connextions: Orlando, FA, USA, 2012; p. 254. [Google Scholar]
- Stankovic, L.; Dakovic, M.; Thayaparan, T. Time-Frequency Signal Analysis with Applications; Artech House: Boston, MA, USA, 2013. [Google Scholar]
- Meignen, S.; Oberlin, T.; Depalle, P.; Flandrin, P.; McLaughlin, S. Adaptive multimode signal reconstruction from time fre-quency representations. Philos. Trans. R. Soc. A Math. Phys. Eng. Sci. 2016, 374, 20150205. [Google Scholar] [CrossRef] [Green Version]
- Meignen, S.; Oberlin, T.; Pham, D.H. Synchrosqueezing transforms: From low- to high-frequency modulations and perspectives. Comptes Rendus Phys. 2019, 20, 449–460. [Google Scholar] [CrossRef]
- Wang, S.; Chen, X.; Selesnick, I.W.; Guo, Y.; Tong, C.; Zhang, X. Matching synchrosqueezing transform: A useful tool for characterizing signals with fast varying instantaneous frequency and application to machine fault diagnosis. Mech. Syst. Signal Process. 2018, 100, 242–288. [Google Scholar] [CrossRef]
- Li, L.; Cai, H.; Han, H.; Jiang, Q.; Ji, H. Adaptive short-time Fourier transform and synchrosqueezing transform for non-stationary signal separation. Signal Process. 2020, 166, 107231. [Google Scholar] [CrossRef]


| Pulse velocity | Sample type | ||
| PC (L/D = 2) | PC (L/D = 3) | PC (L/b = 4.5) | |
| Sample dimensions | |||
| Ø38 mm, L = 76 mm | Ø60–65 mm, L = 160–190 mm | 50 × 50 × 225 mm | |
| UPV50 | 3300 | 3540 | 3485 |
| UPV150 | 3270 | 3476 | 3494 |
| Characteristics | Value |
|---|---|
| Epoxy number | 0.50–0.55 mol/100 g |
| Density in 25 °C | 1.14–1.17 g/cm3 |
| Viscosity in 25 °C | 0.7–1.1 Pa·s |
| Geltime in 20 °C | 45 min |
| Tensile strength | 50–60 MPa |
| Bending strength | 80–90 MPa |
| Barcol hardness | 28–33° B |
| Cubes | Beams | Plates |
| C1 | B1 | P1 |
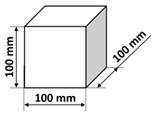 |  | 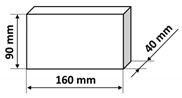 |
| C2 | B2 | P2 |
 |  |  |
| Sample Type | Path Length [mm] | Minimal Lateral Dimension [mm] | UPV [m/s] | |
|---|---|---|---|---|
| Mean for the Given Path Length | Mean for the Given Sample Type (All Test Planes) | |||
| C1 | 100 | 100 | 4155 | 4155 |
| (54) | (54) | |||
| C2 | 150 | 150 | 3938 | 3938 |
| (44) | (44) | |||
| B1 | 40 | 40 | 4197 | 4137 |
| (59) | ||||
| 160 | 40 | 4077 | (80) | |
| (42) | ||||
| B2 | 75 | 75 | 3909 | 3877 |
| (62) | ||||
| 270 | 75 | 3846 | (64) | |
| (49) | ||||
| P1 | 40 | 90 | 3996 | 4054 |
| (52) | ||||
| 90 | 40 | 4159 | ||
| (41) | (77) | |||
| 160 | 40 | 4006 | ||
| (40) | ||||
| P2 | 40 | 140 | 4229 | 4074 |
| (42) | ||||
| 140 | 40 | 4048 | ||
| (45) | (82) | |||
| 160 | 40 | 3945 | ||
| (38) | ||||
Publisher’s Note: MDPI stays neutral with regard to jurisdictional claims in published maps and institutional affiliations. |
© 2021 by the author. Licensee MDPI, Basel, Switzerland. This article is an open access article distributed under the terms and conditions of the Creative Commons Attribution (CC BY) license (https://creativecommons.org/licenses/by/4.0/).
Share and Cite
Zalegowski, K. Assessment of Polymer Concrete Sample Geometry Effect on Ultrasonic Wave Velocity and Spectral Characteristics. Materials 2021, 14, 7200. https://doi.org/10.3390/ma14237200
Zalegowski K. Assessment of Polymer Concrete Sample Geometry Effect on Ultrasonic Wave Velocity and Spectral Characteristics. Materials. 2021; 14(23):7200. https://doi.org/10.3390/ma14237200
Chicago/Turabian StyleZalegowski, Kamil. 2021. "Assessment of Polymer Concrete Sample Geometry Effect on Ultrasonic Wave Velocity and Spectral Characteristics" Materials 14, no. 23: 7200. https://doi.org/10.3390/ma14237200
APA StyleZalegowski, K. (2021). Assessment of Polymer Concrete Sample Geometry Effect on Ultrasonic Wave Velocity and Spectral Characteristics. Materials, 14(23), 7200. https://doi.org/10.3390/ma14237200