
Fretting Wear Behavior of Three Kinds of Rubbers under Sphere-On-Flat Contact


Abstract
1. Introduction
2. Materials and Experimental Procedure
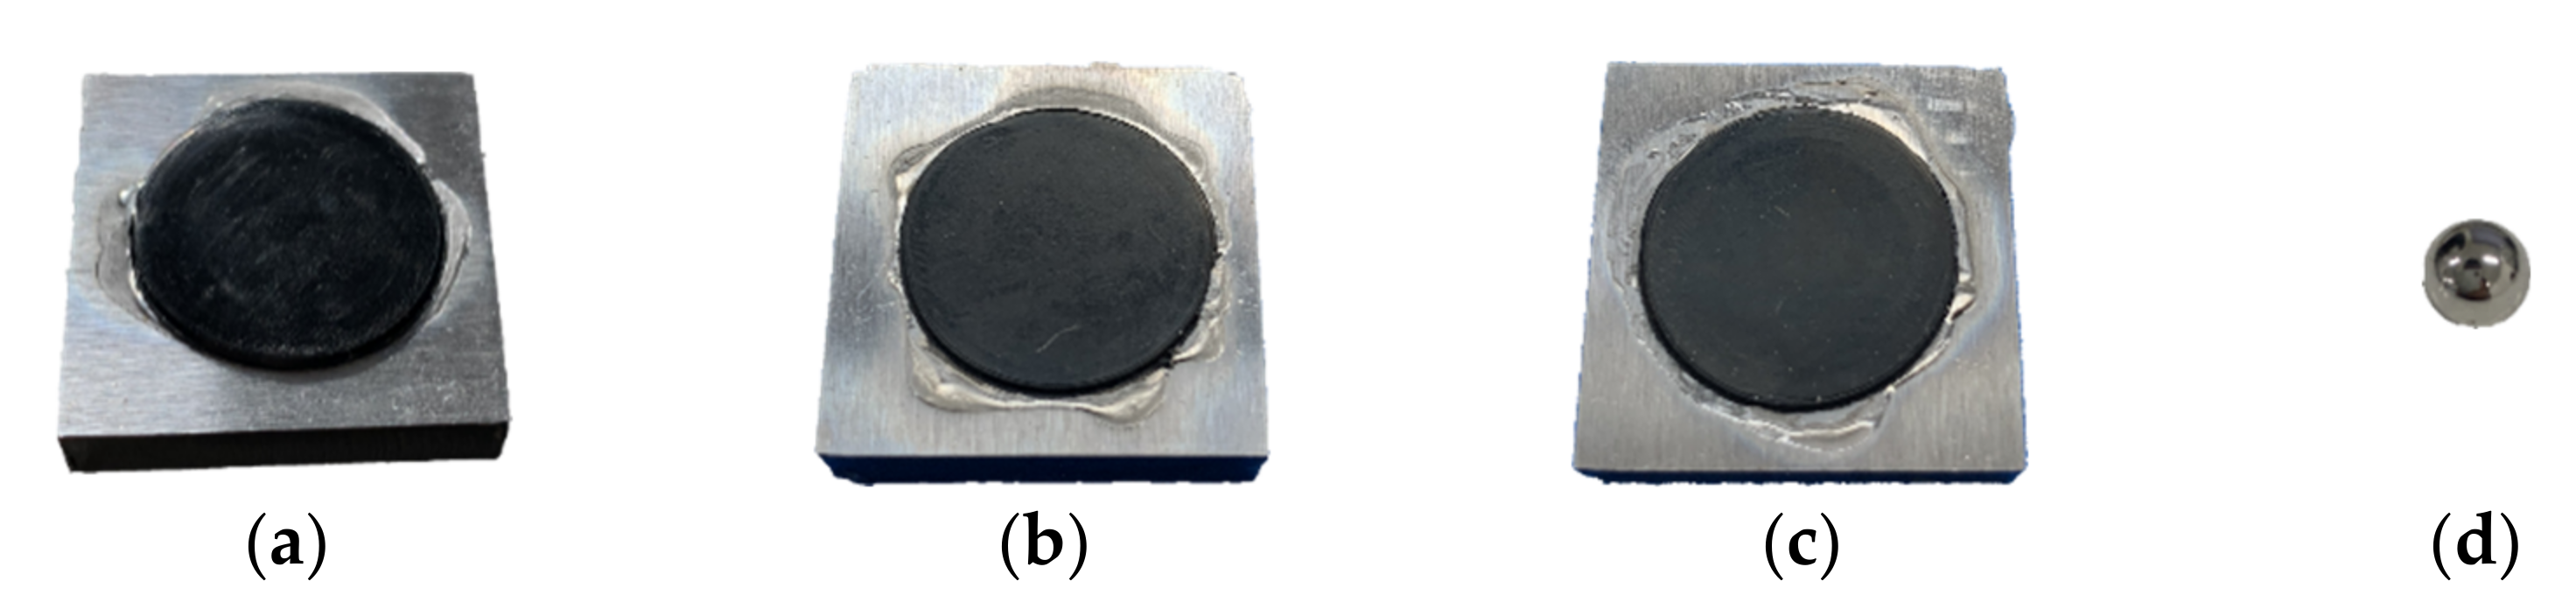
2.1. Materials
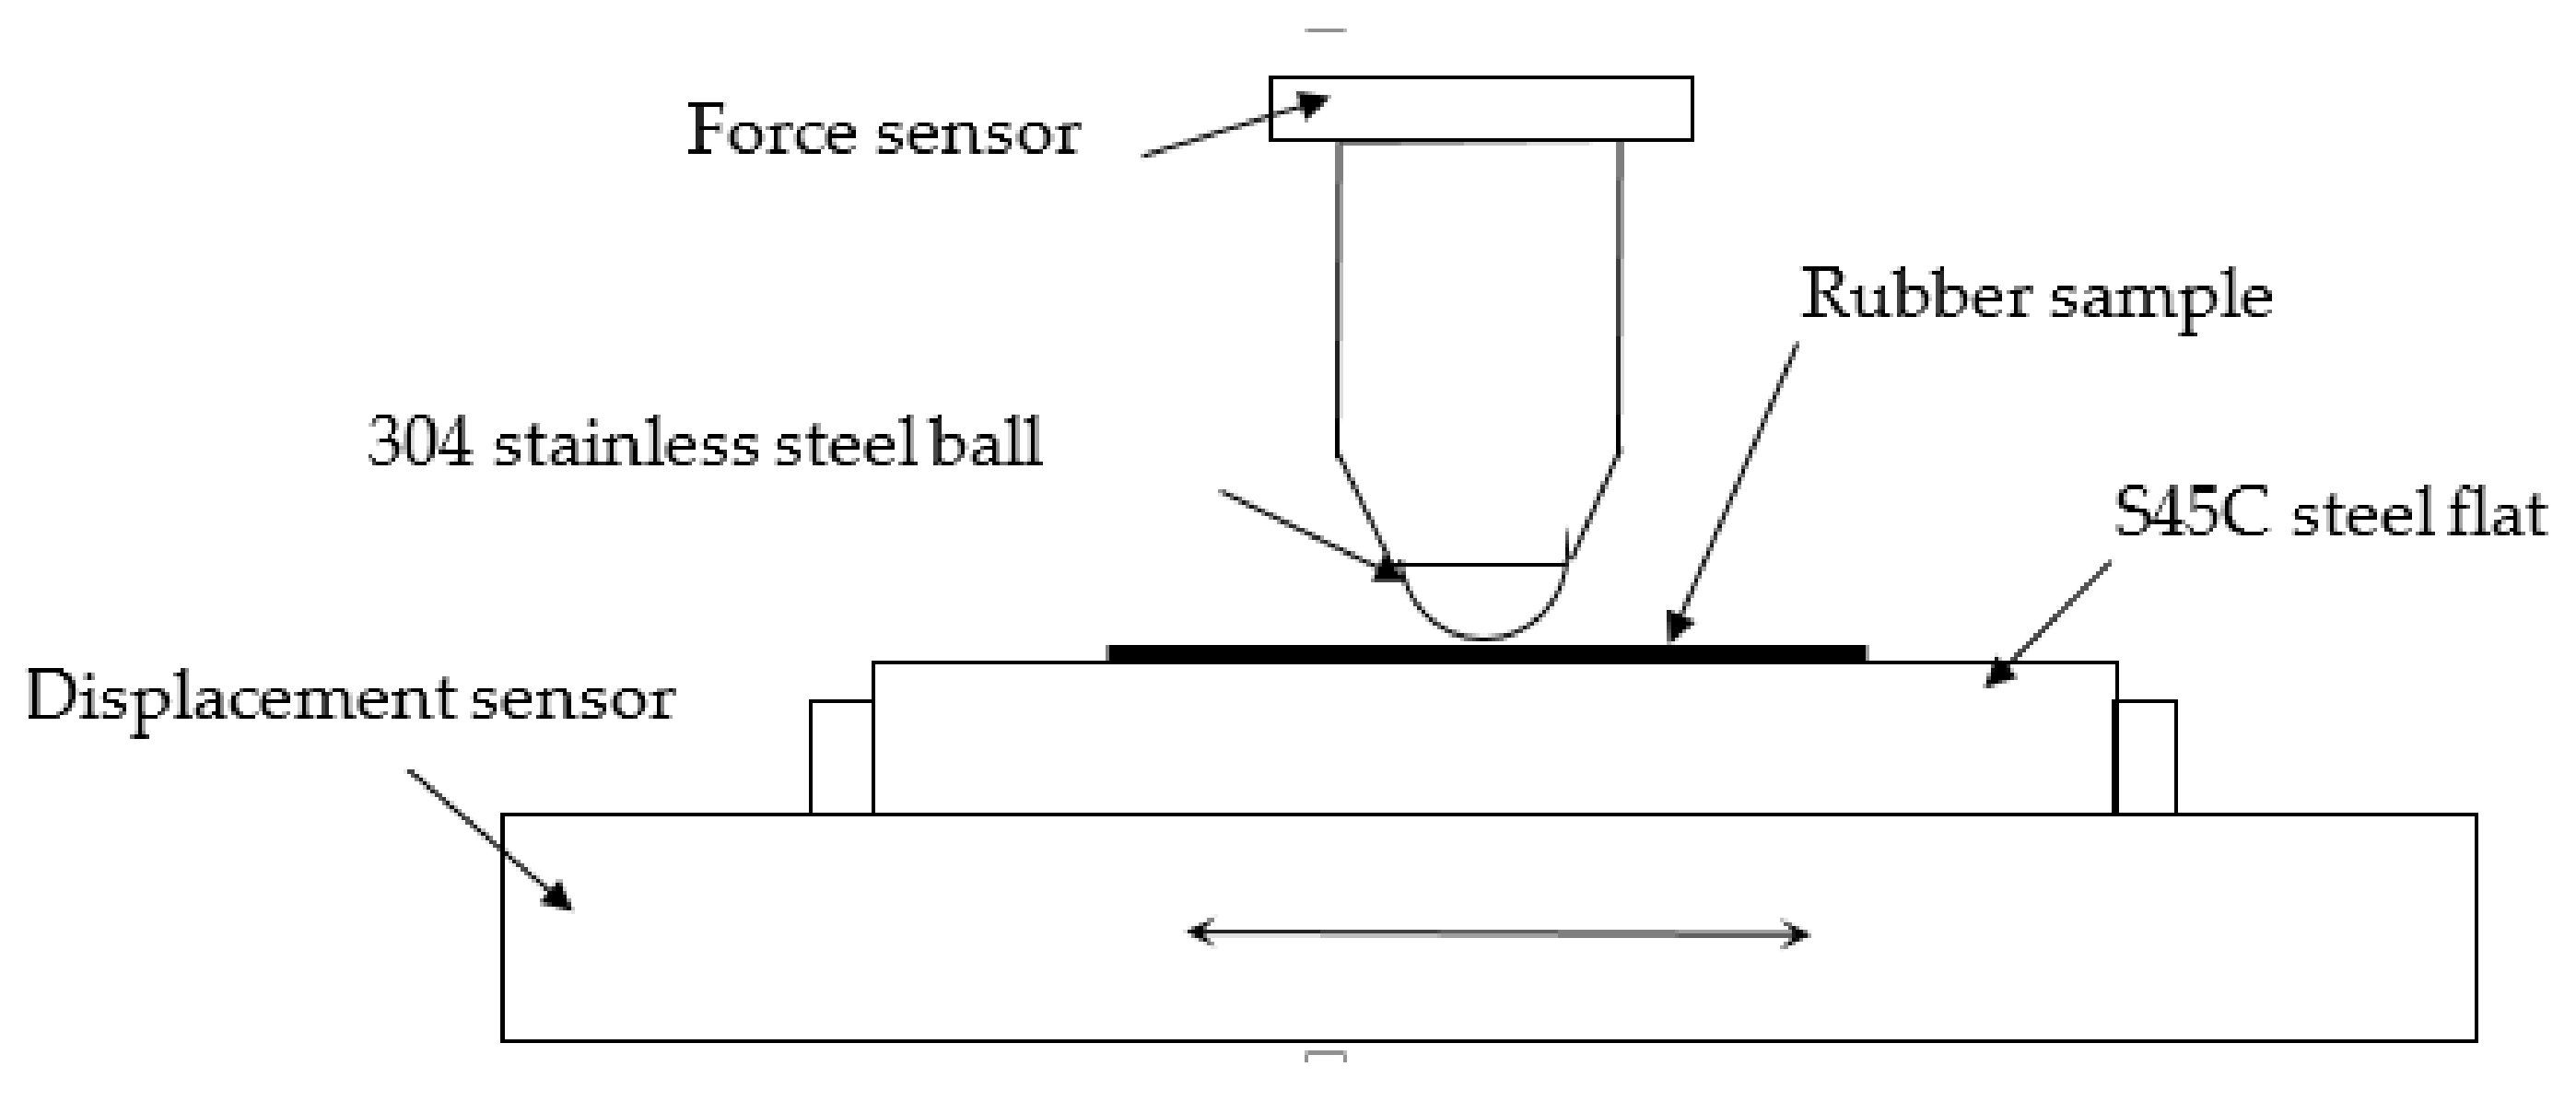
2.2. Experimental Procedure
3. Test Results
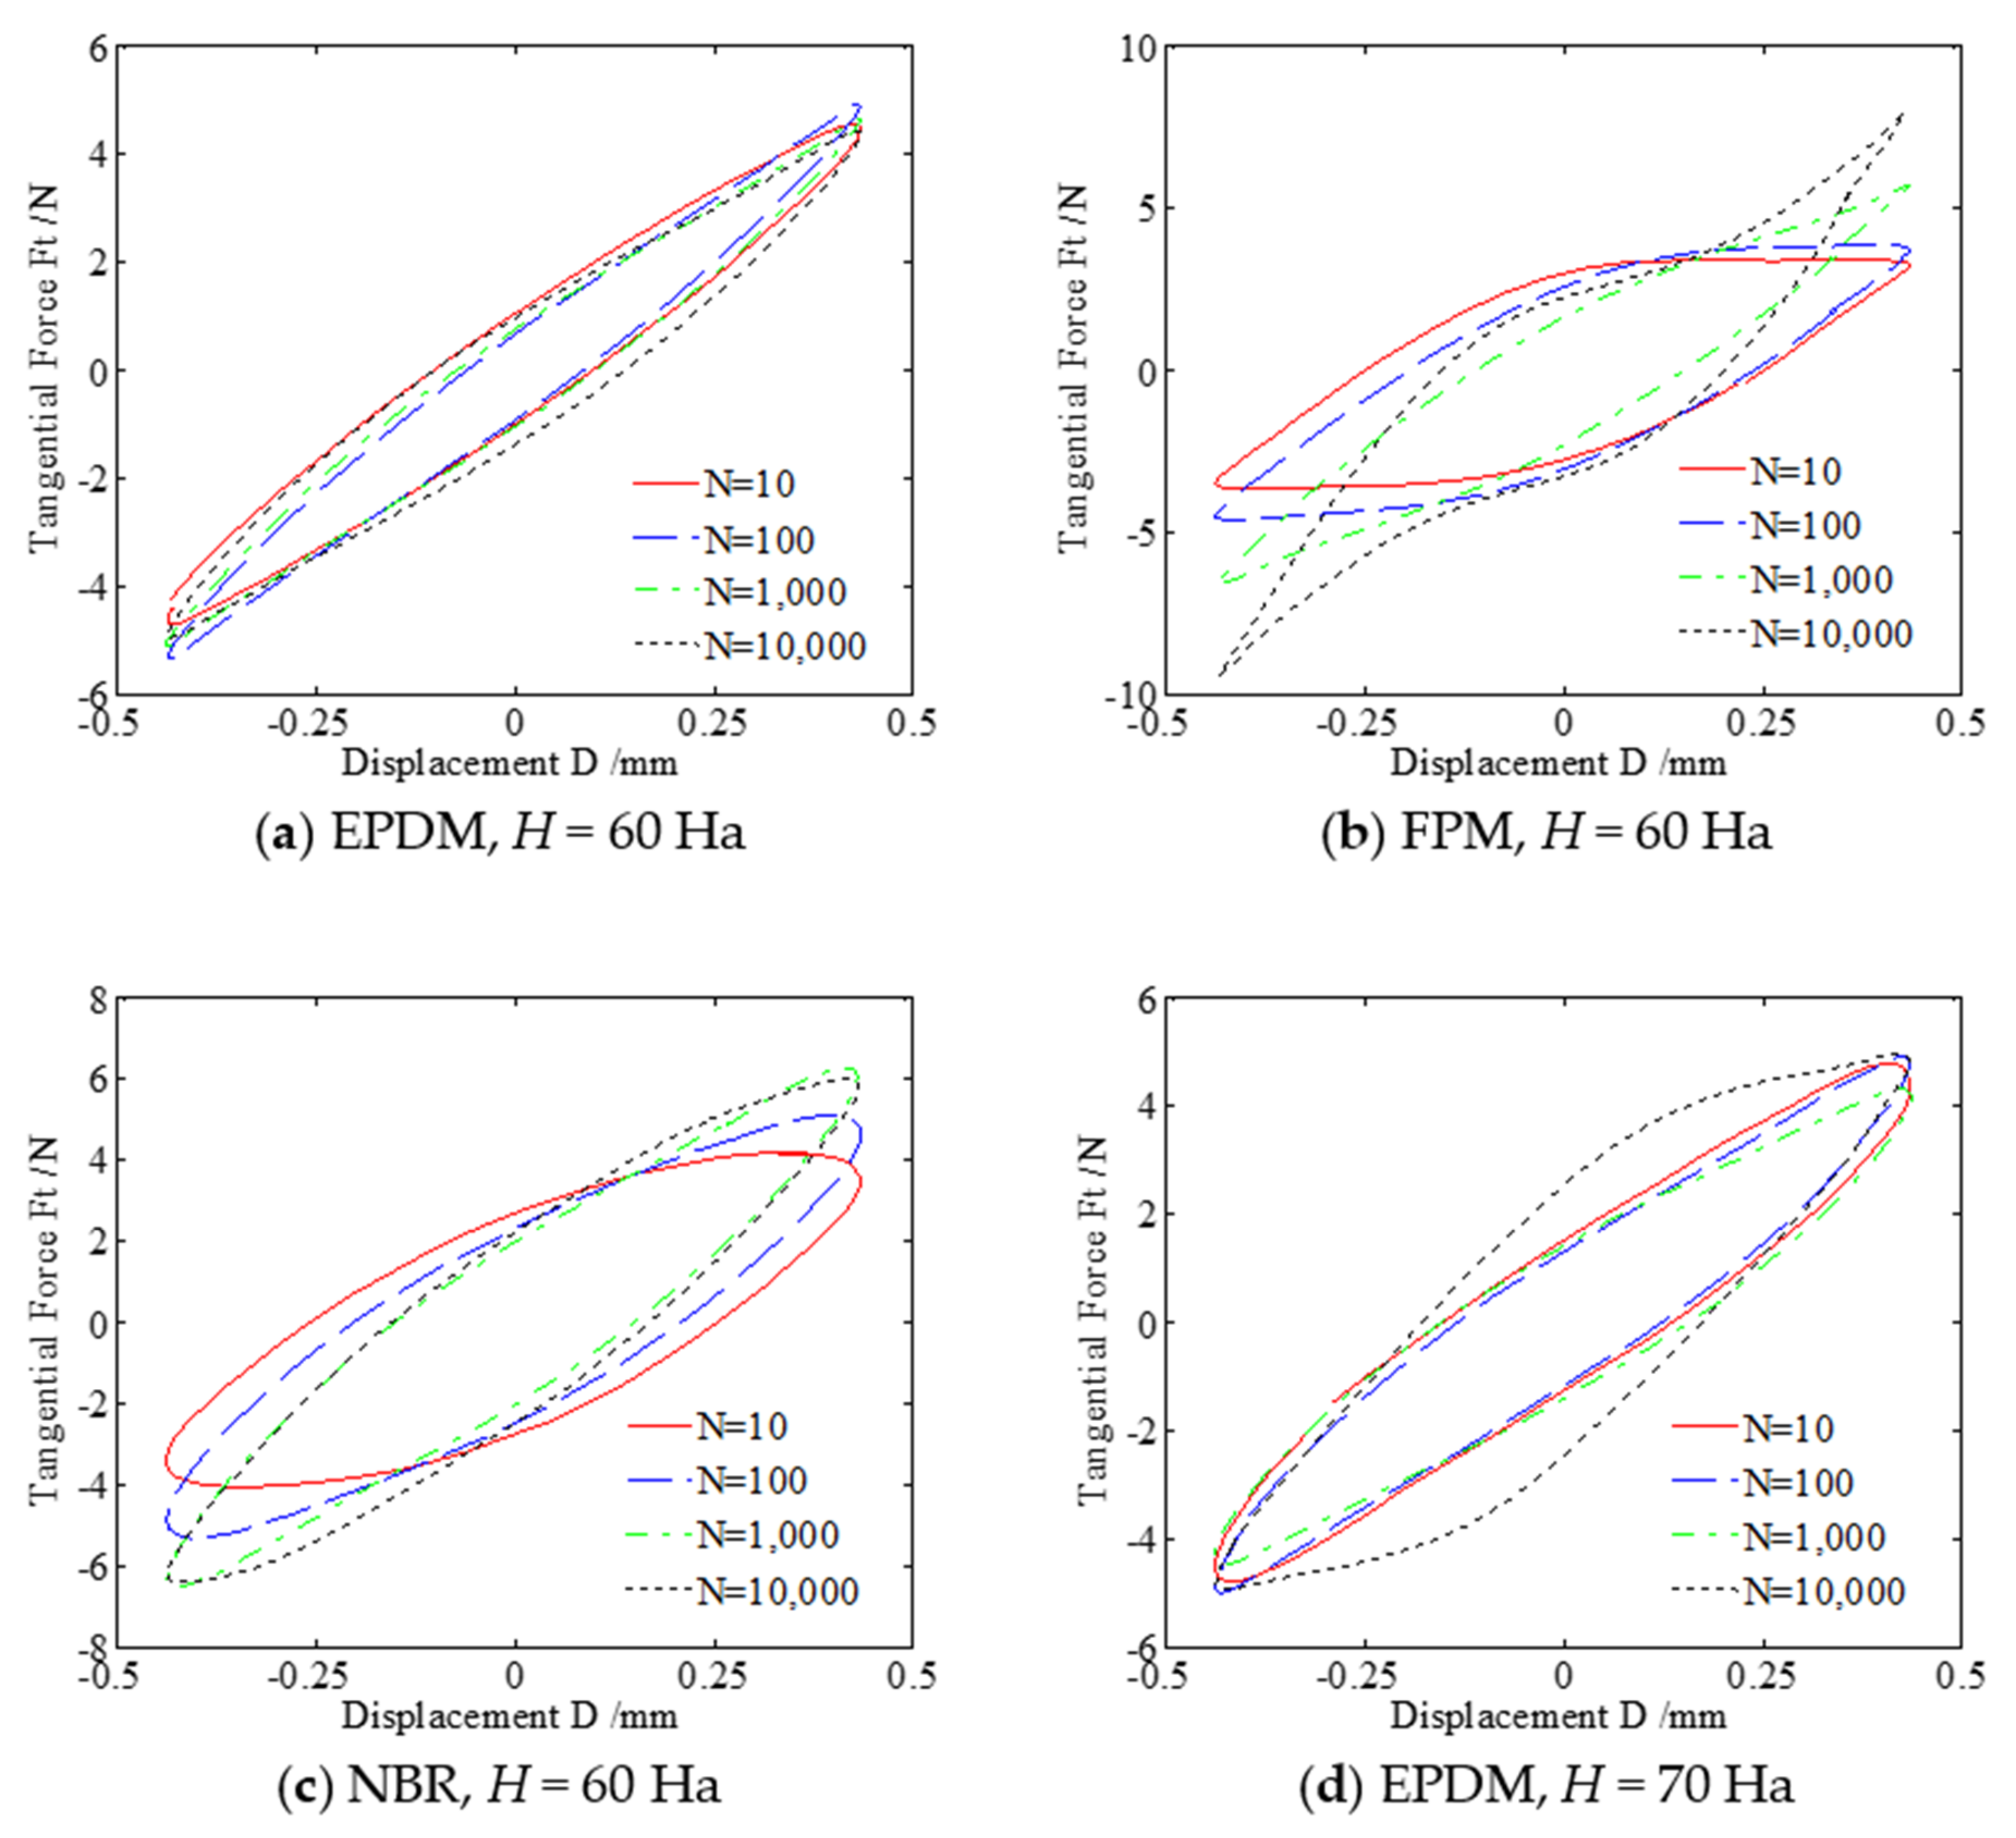
3.1. Curves
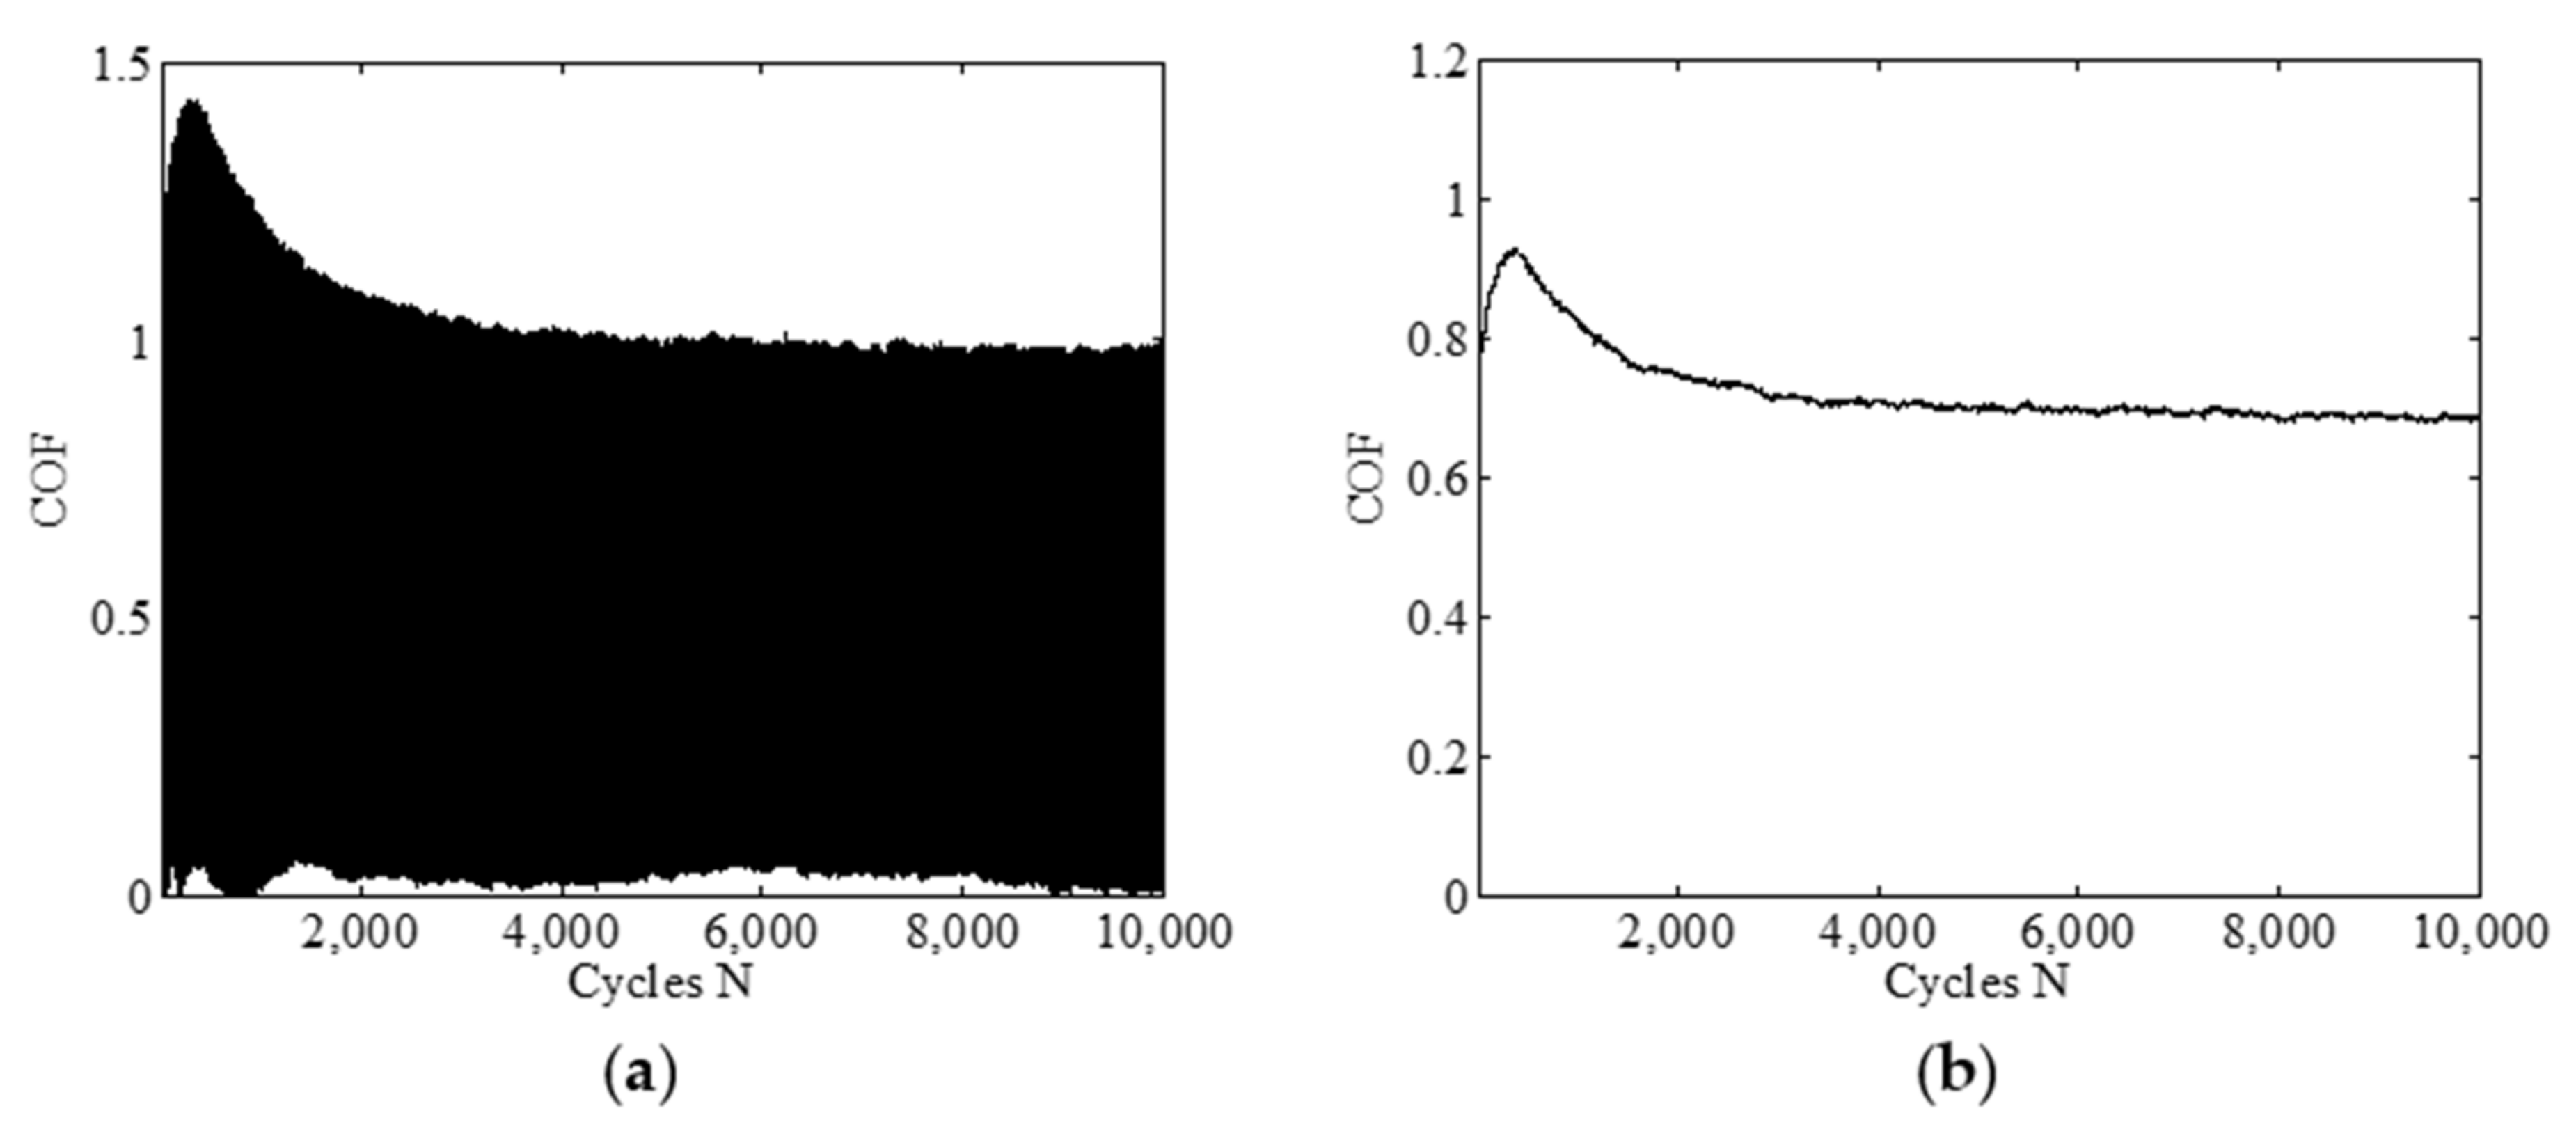
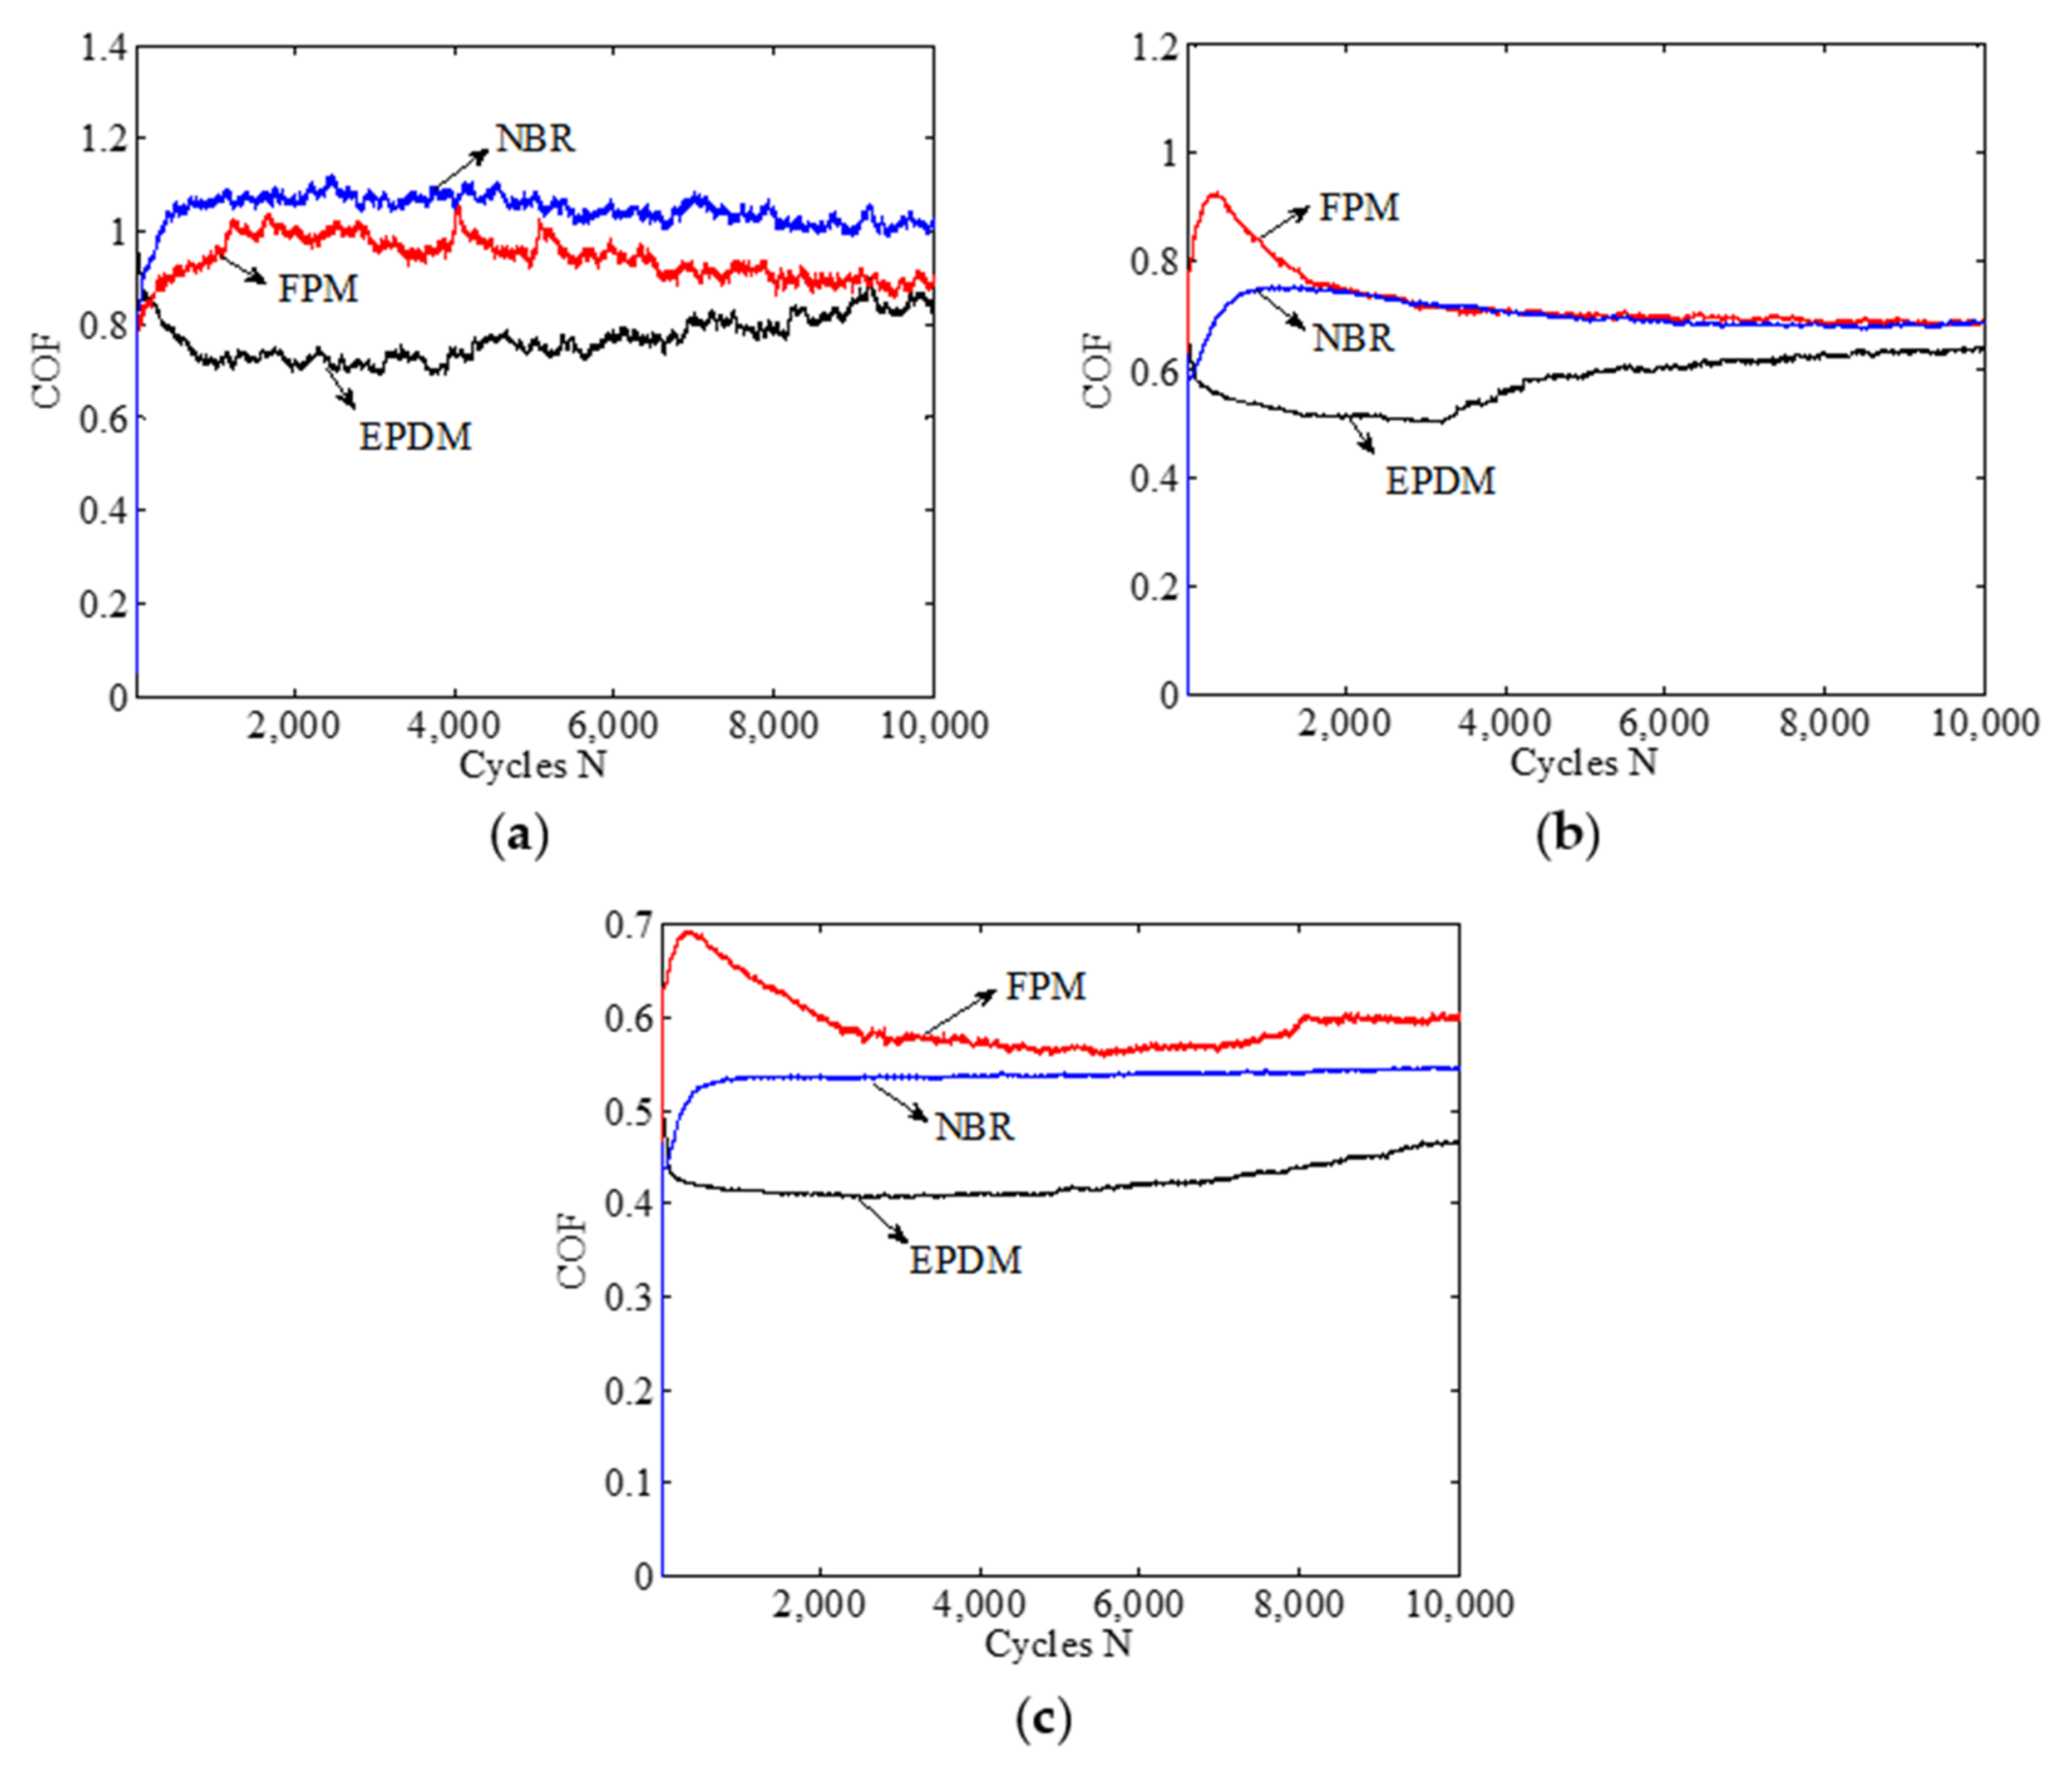
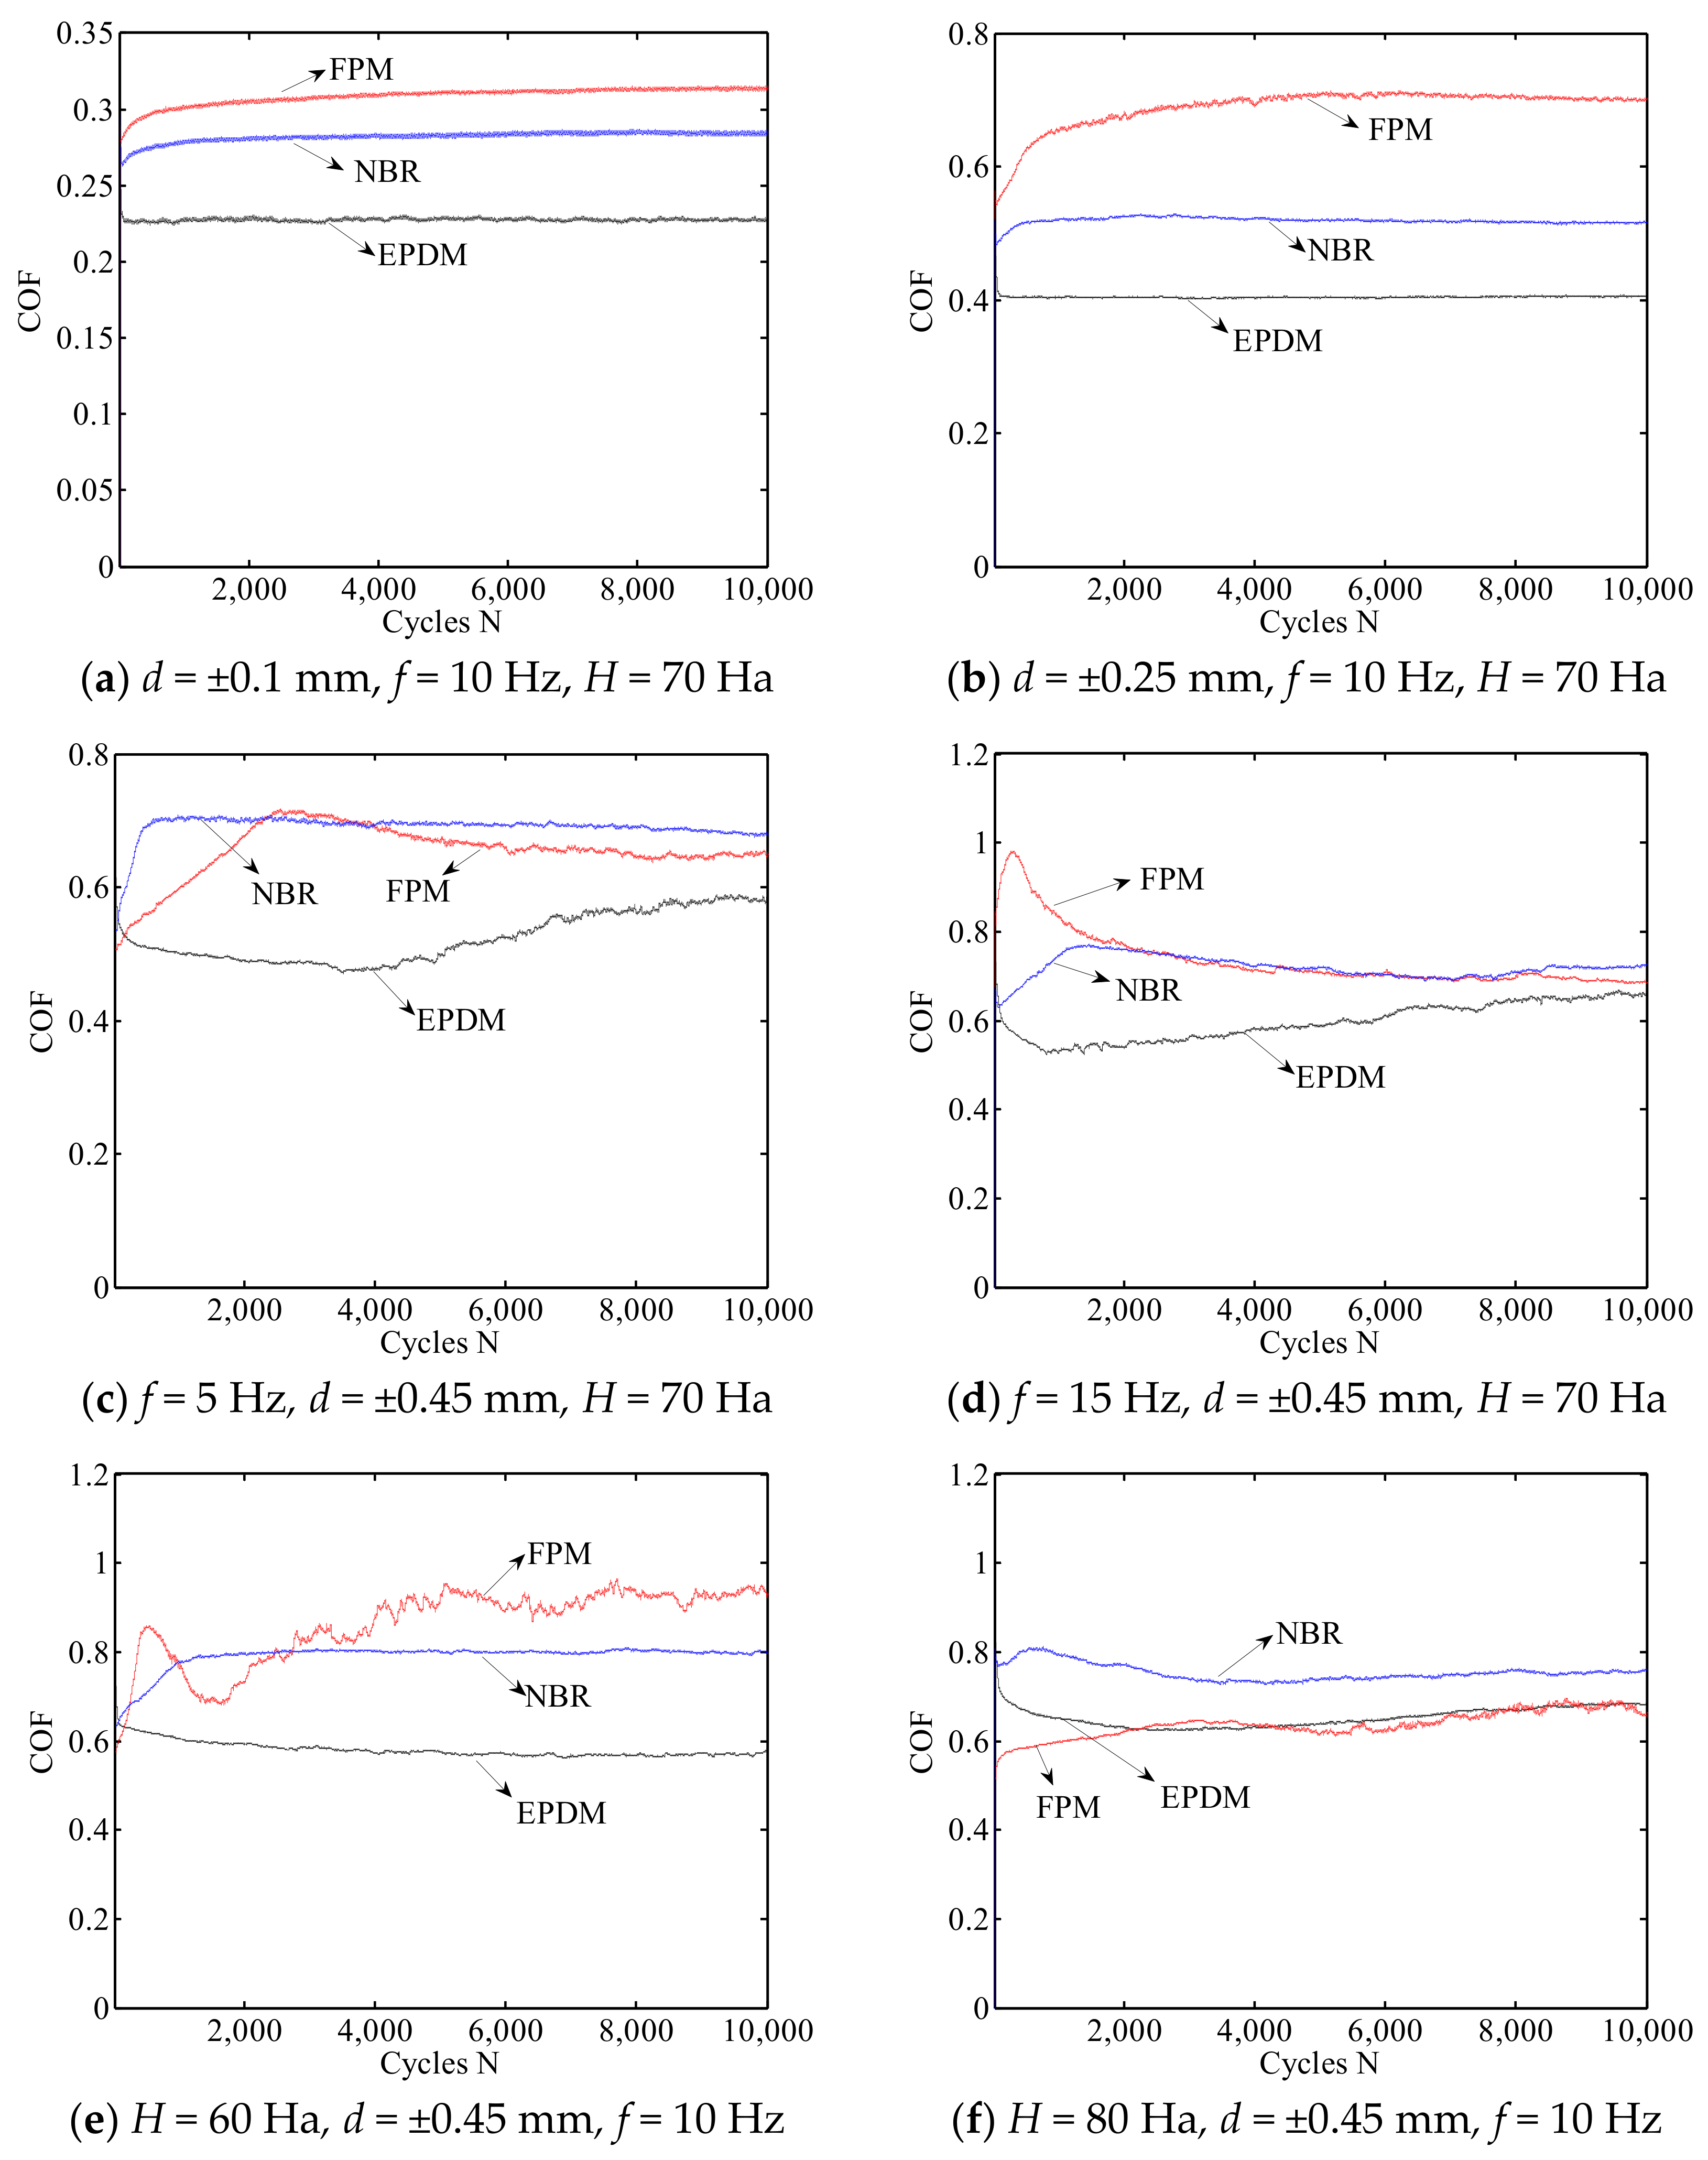
3.2. Friction Coefficient Curves
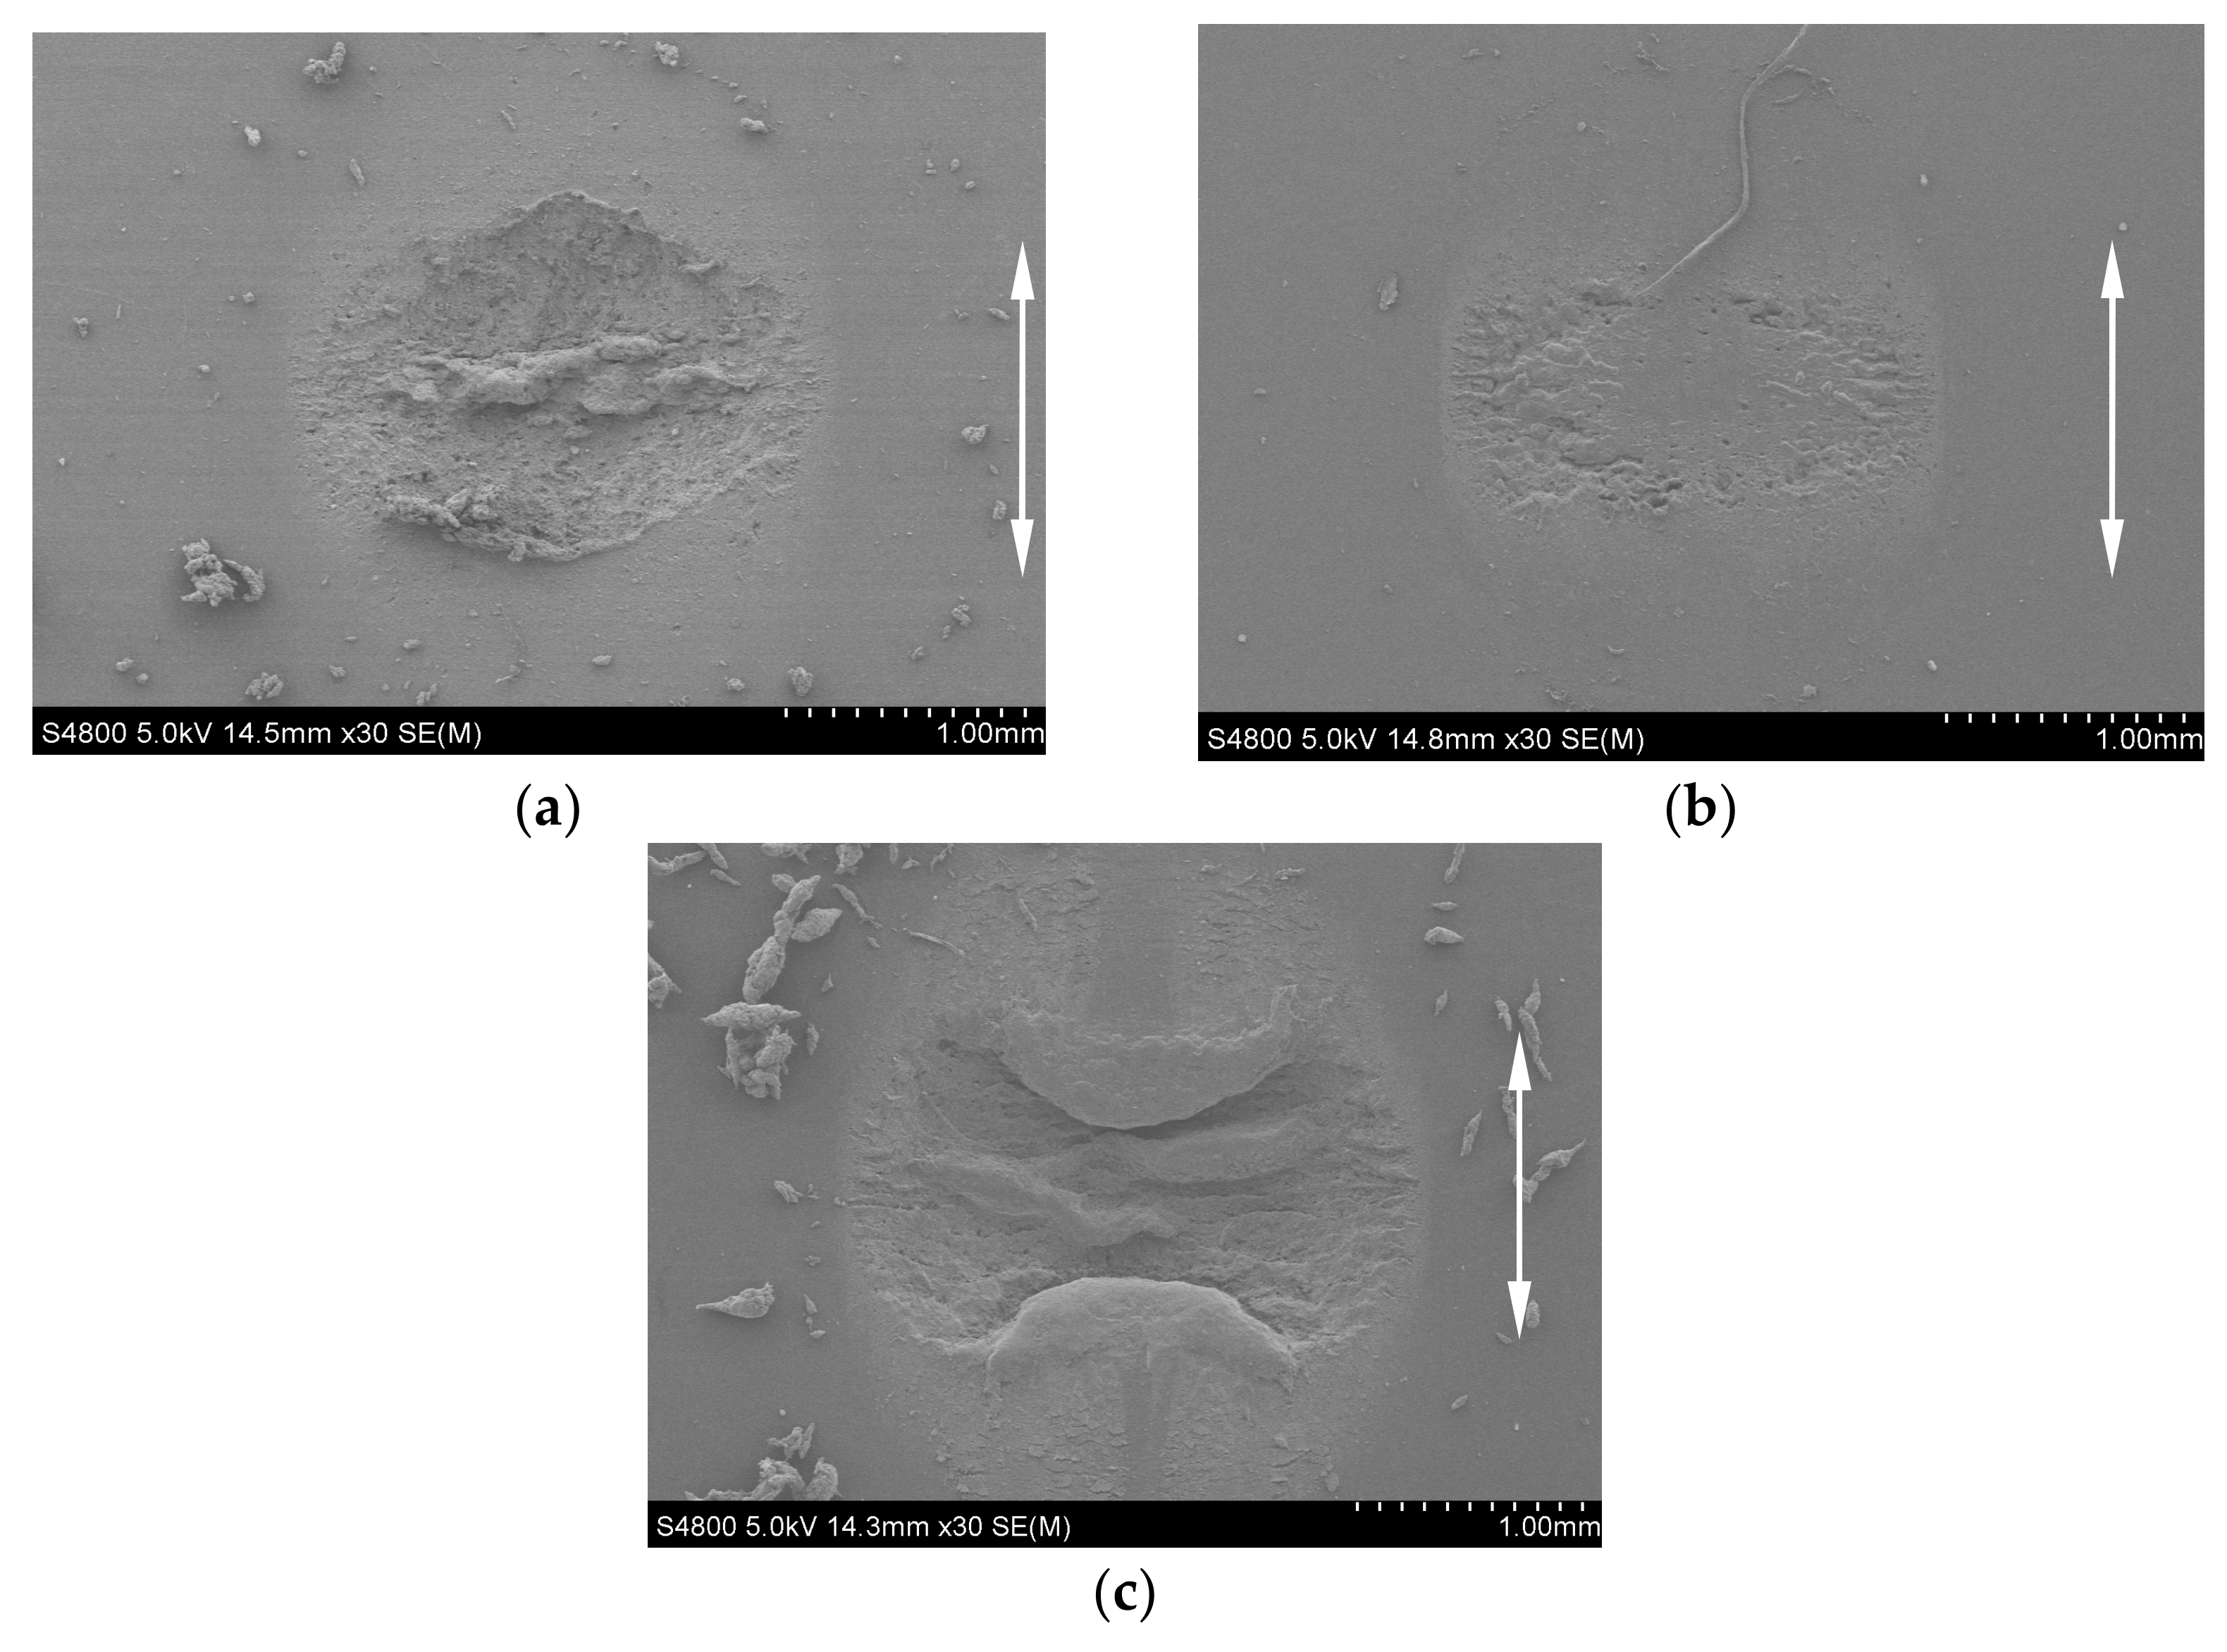
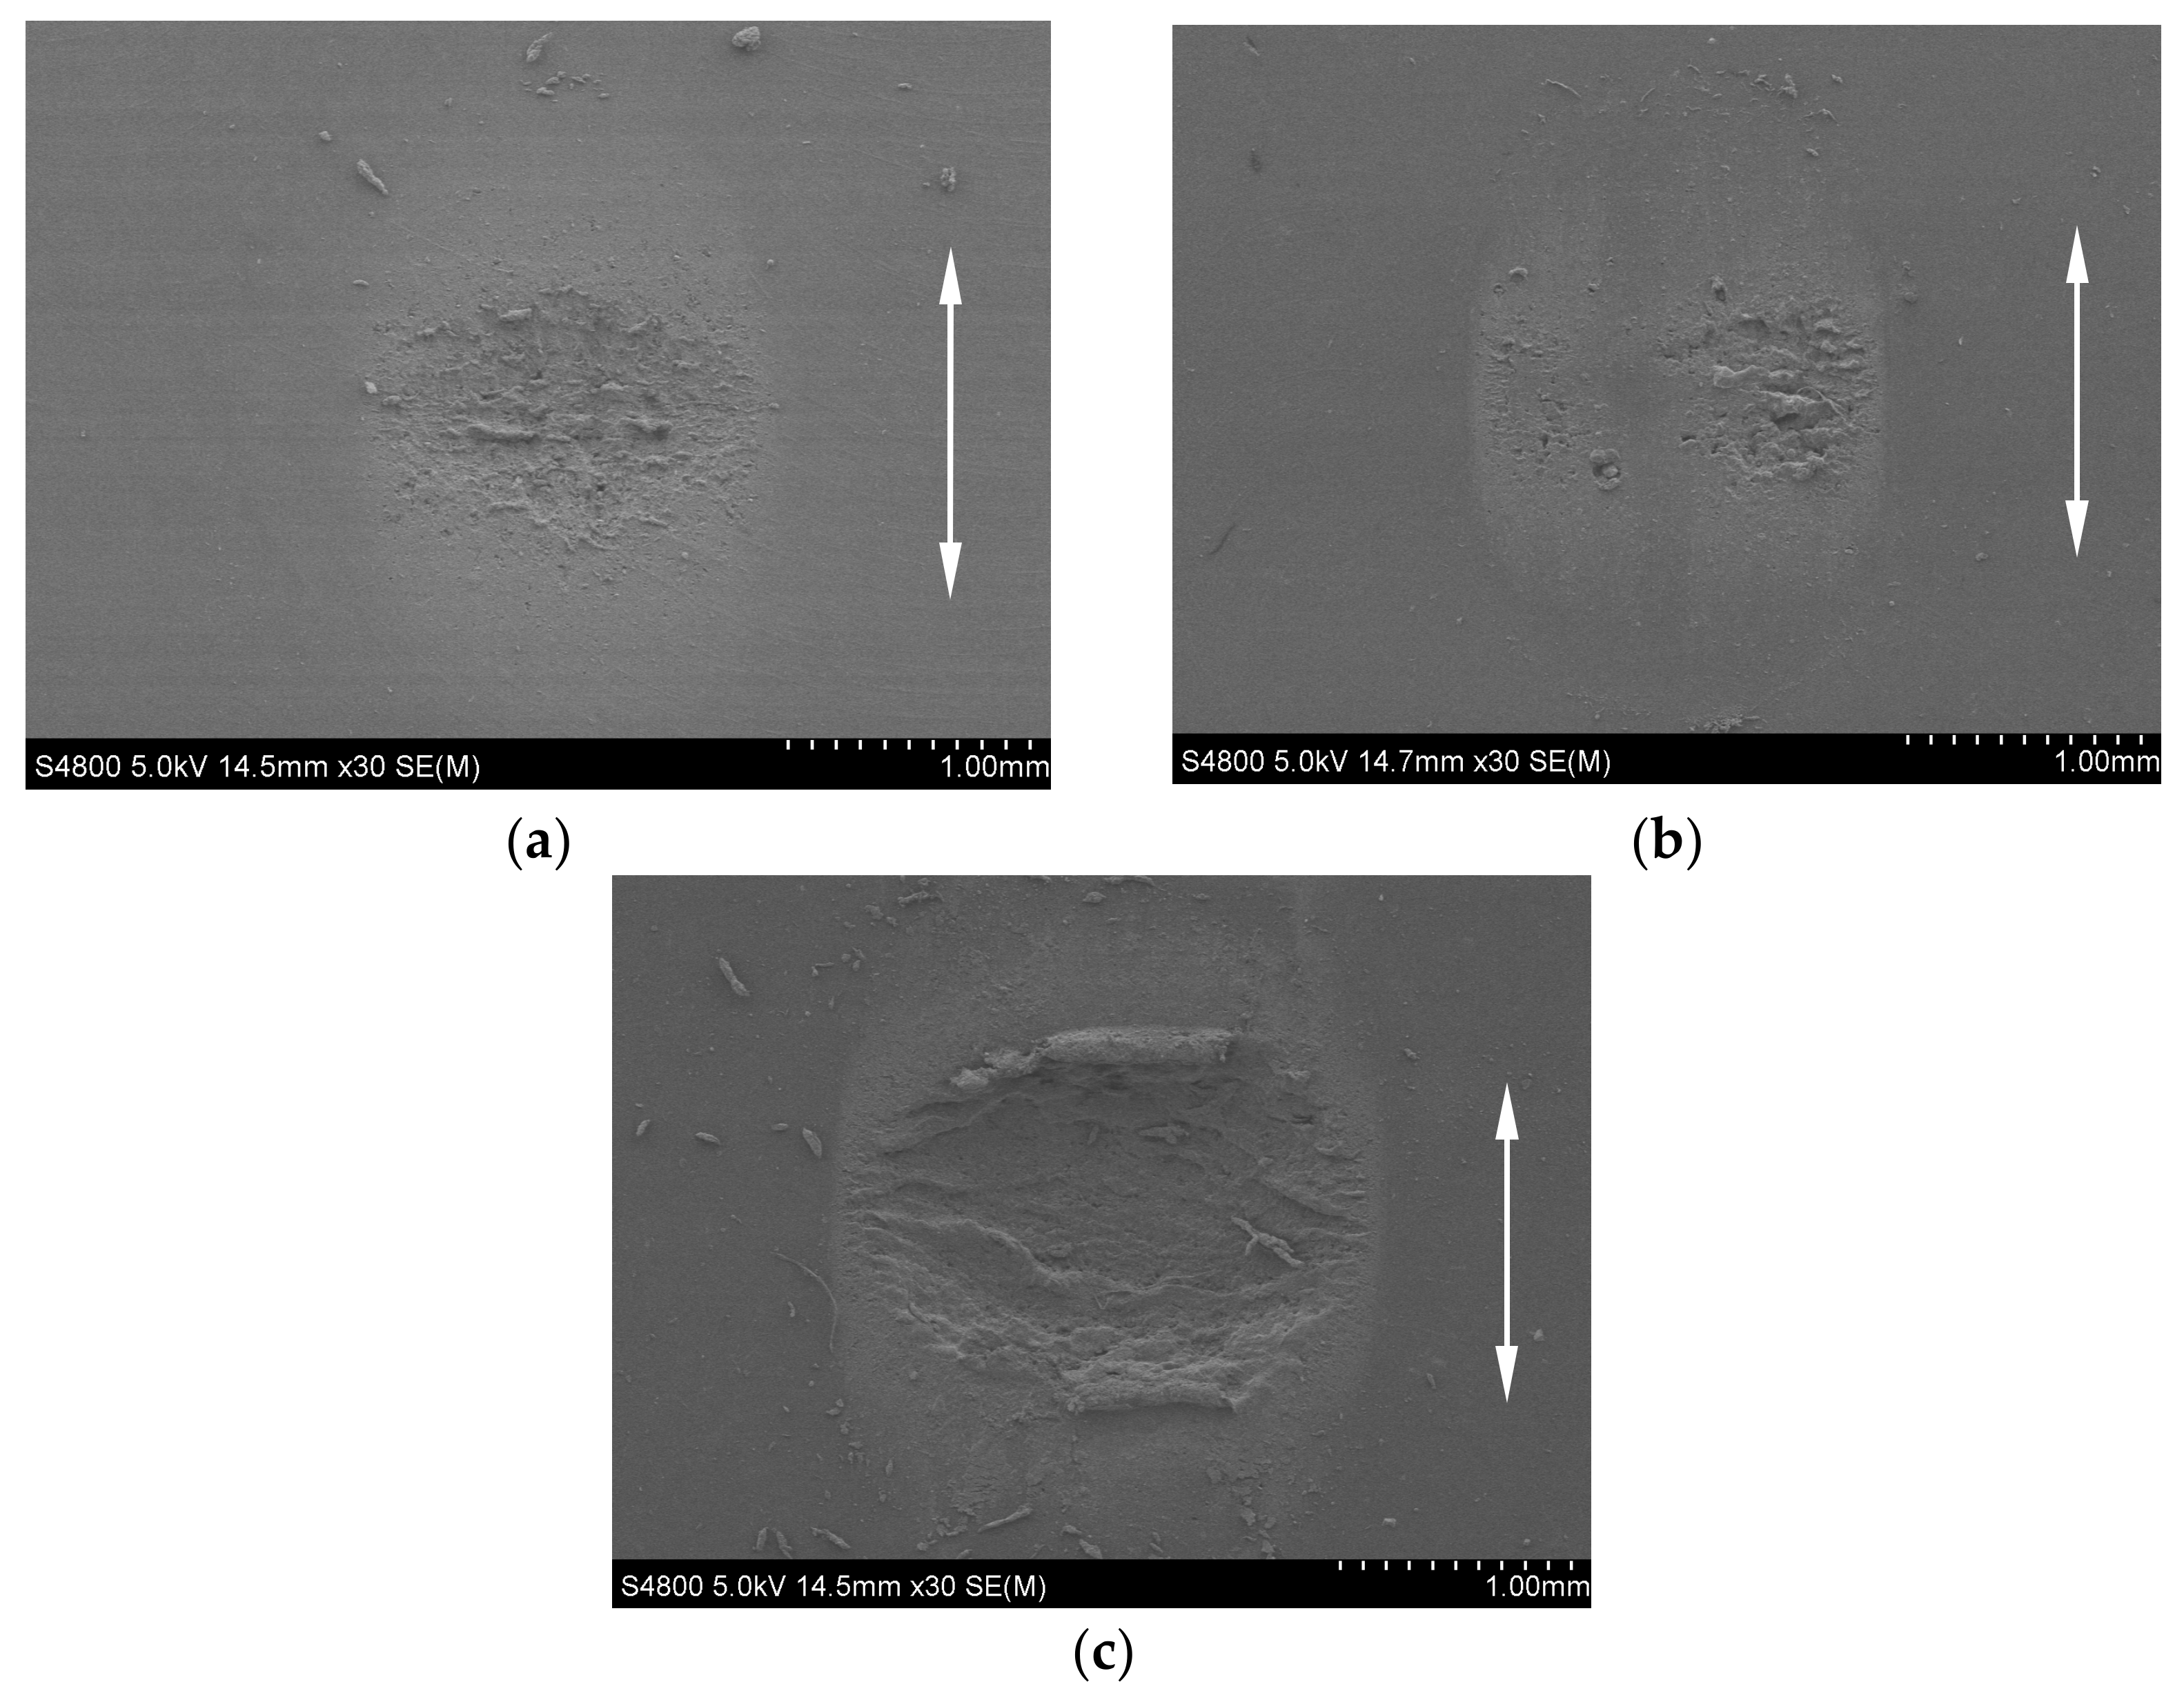
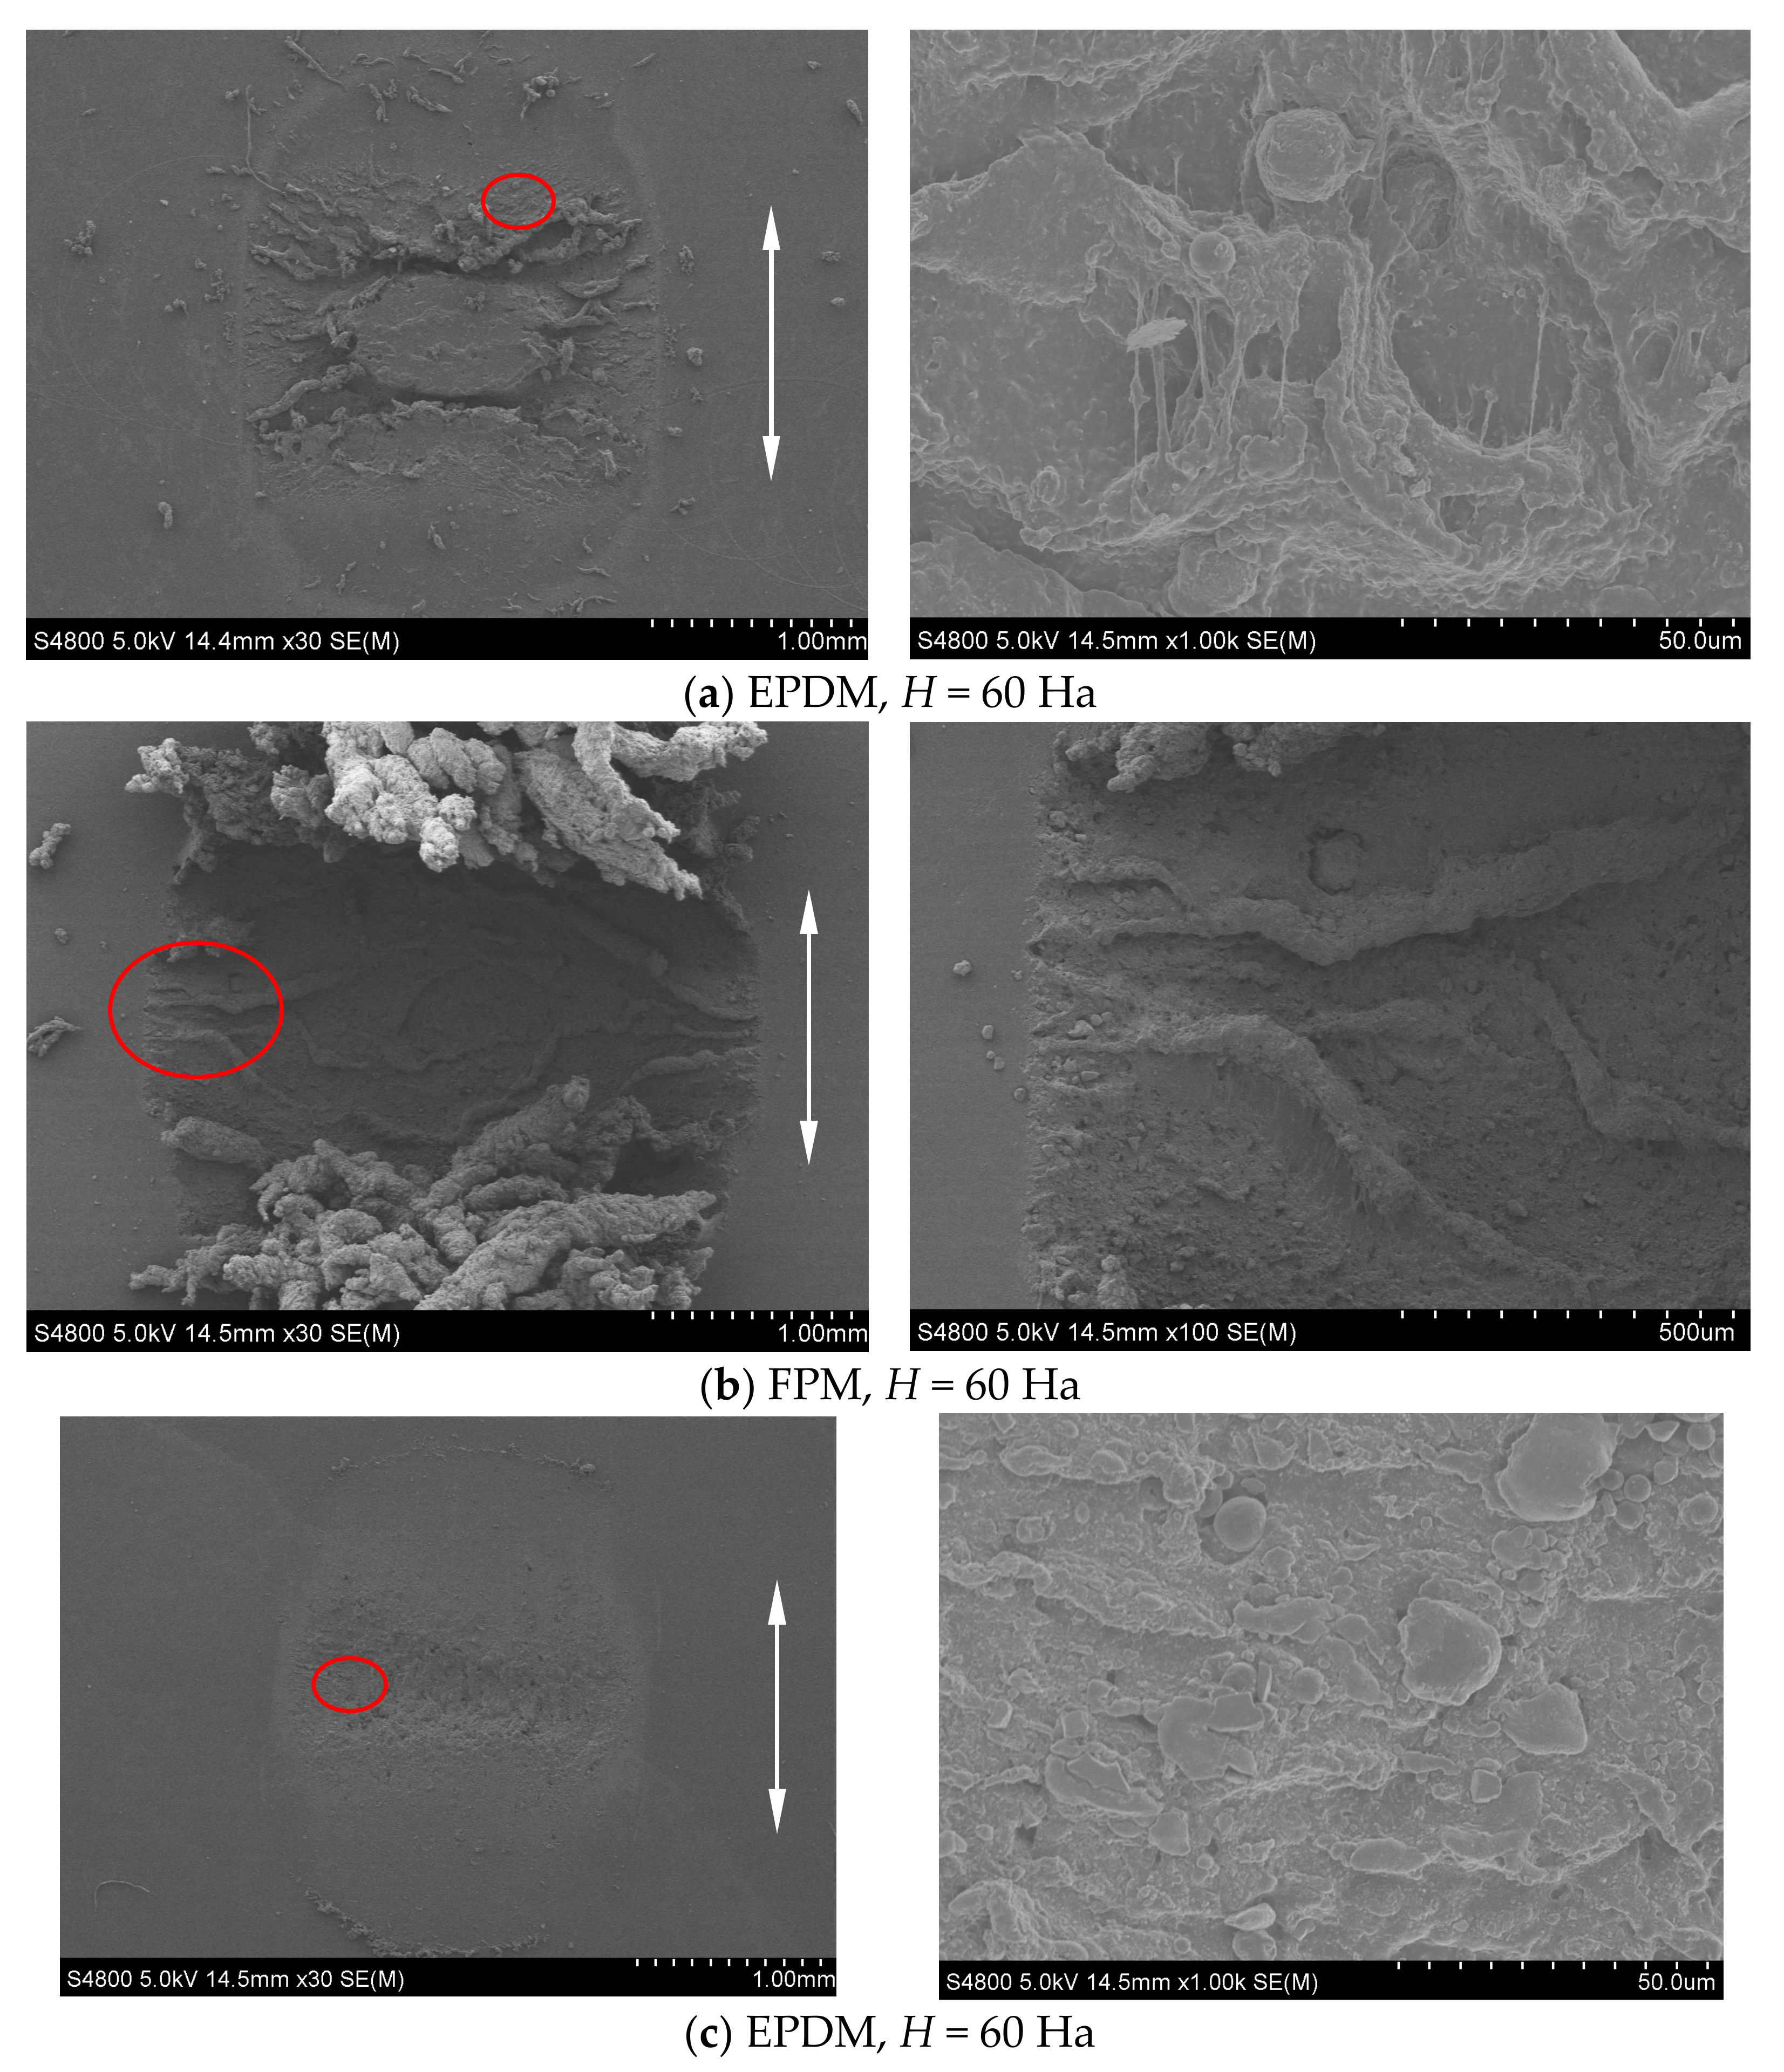
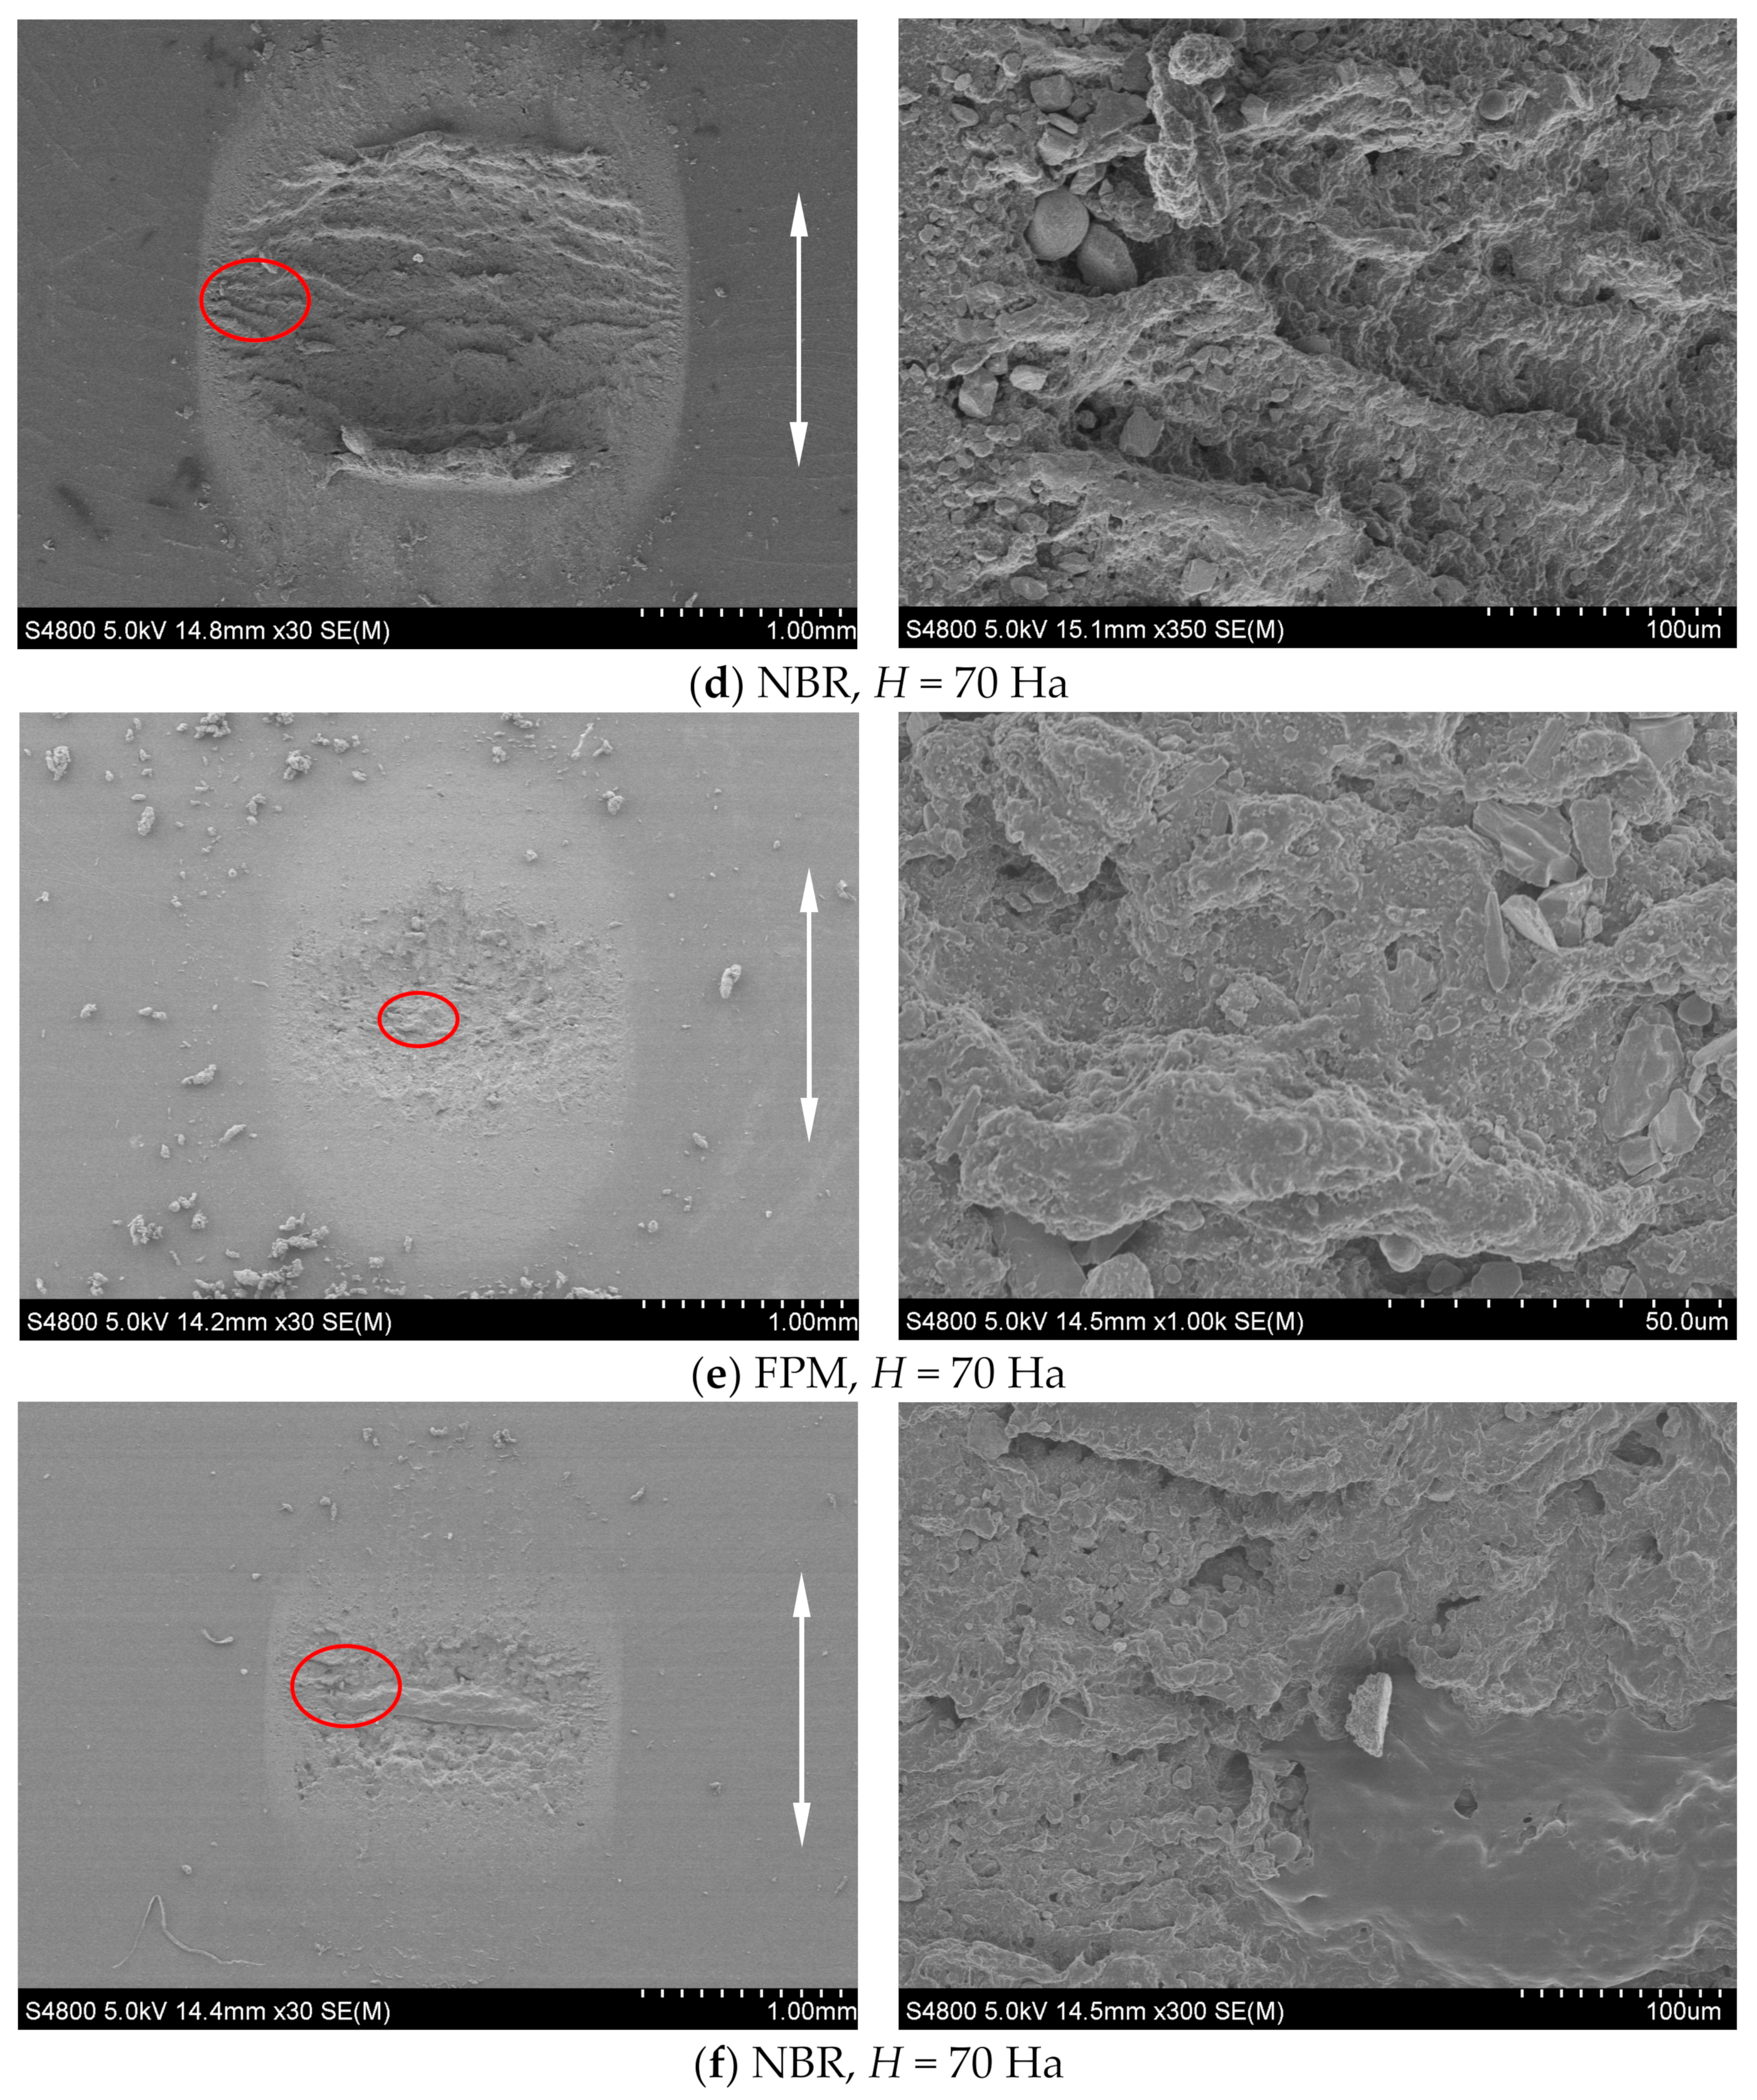
3.3. Surface Morphology and Wear Mechanism
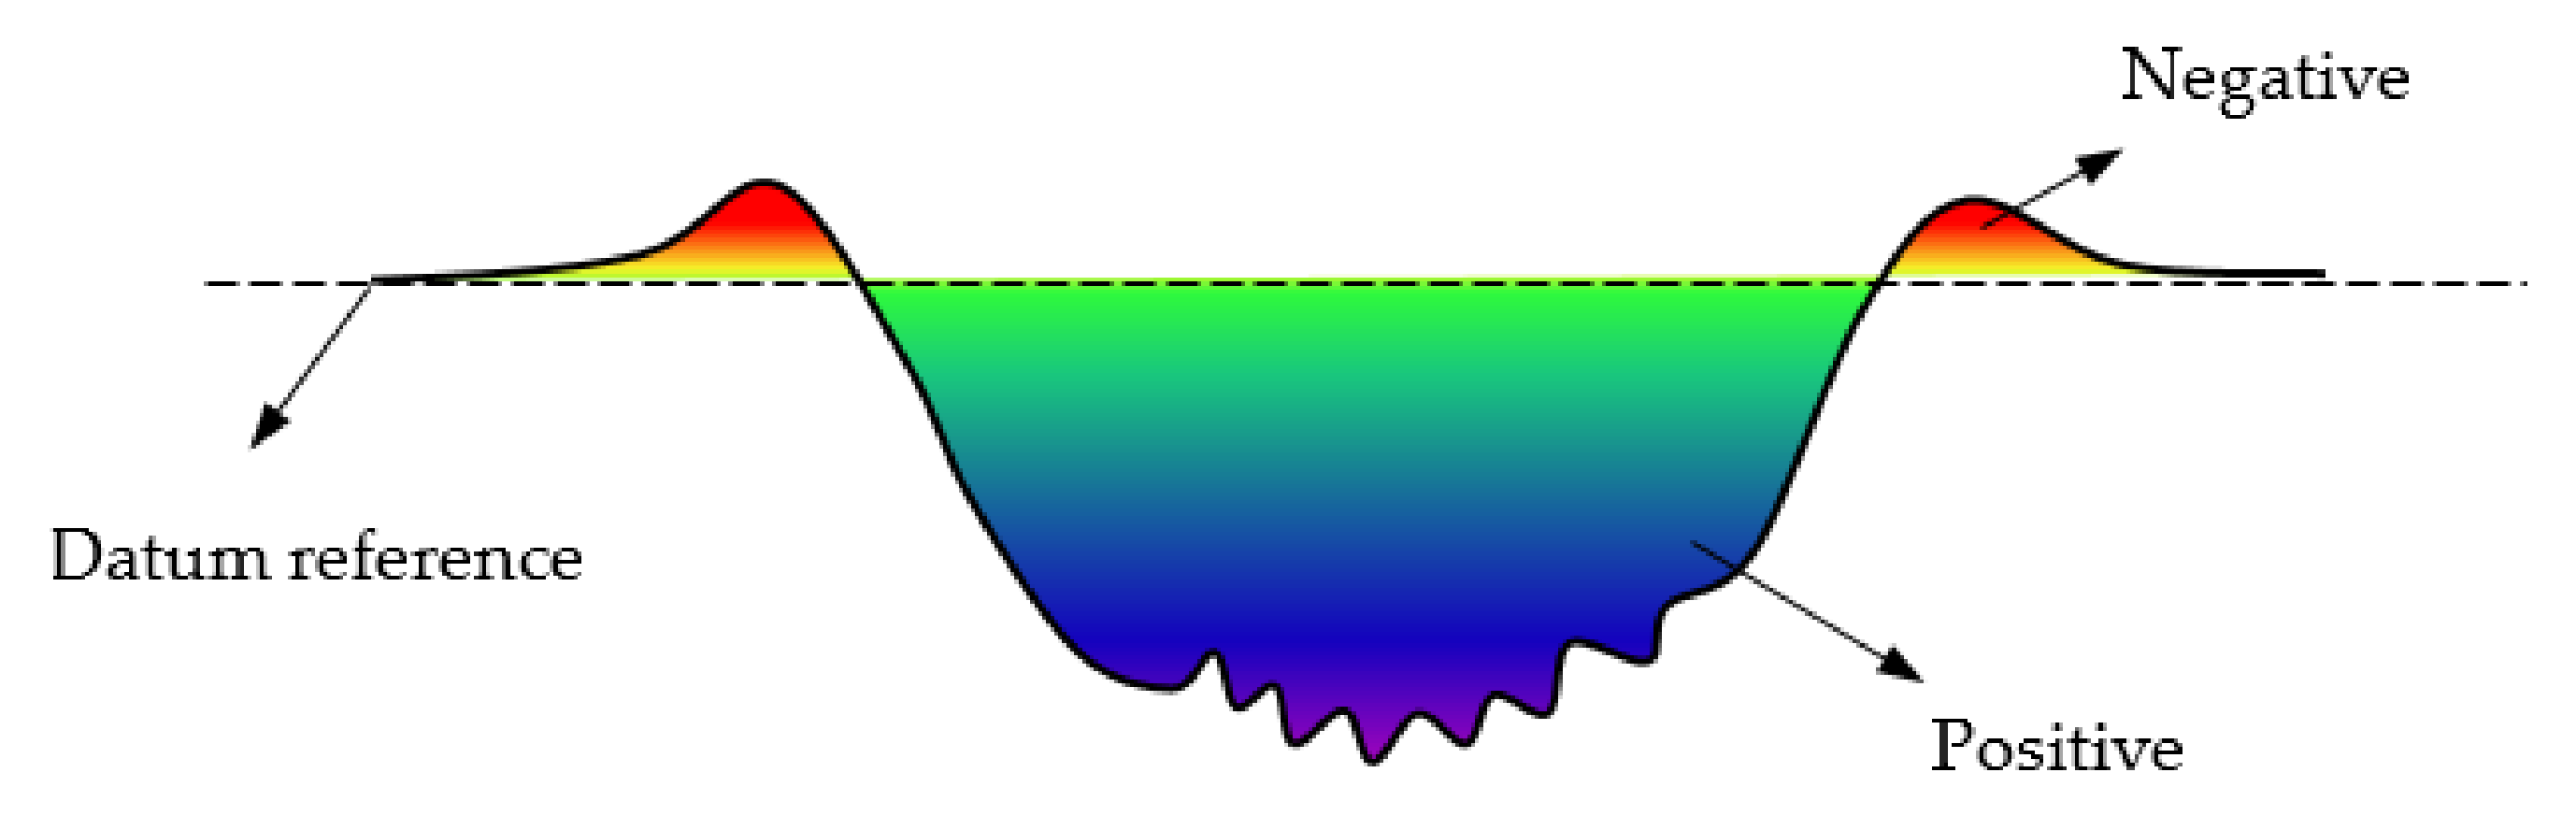
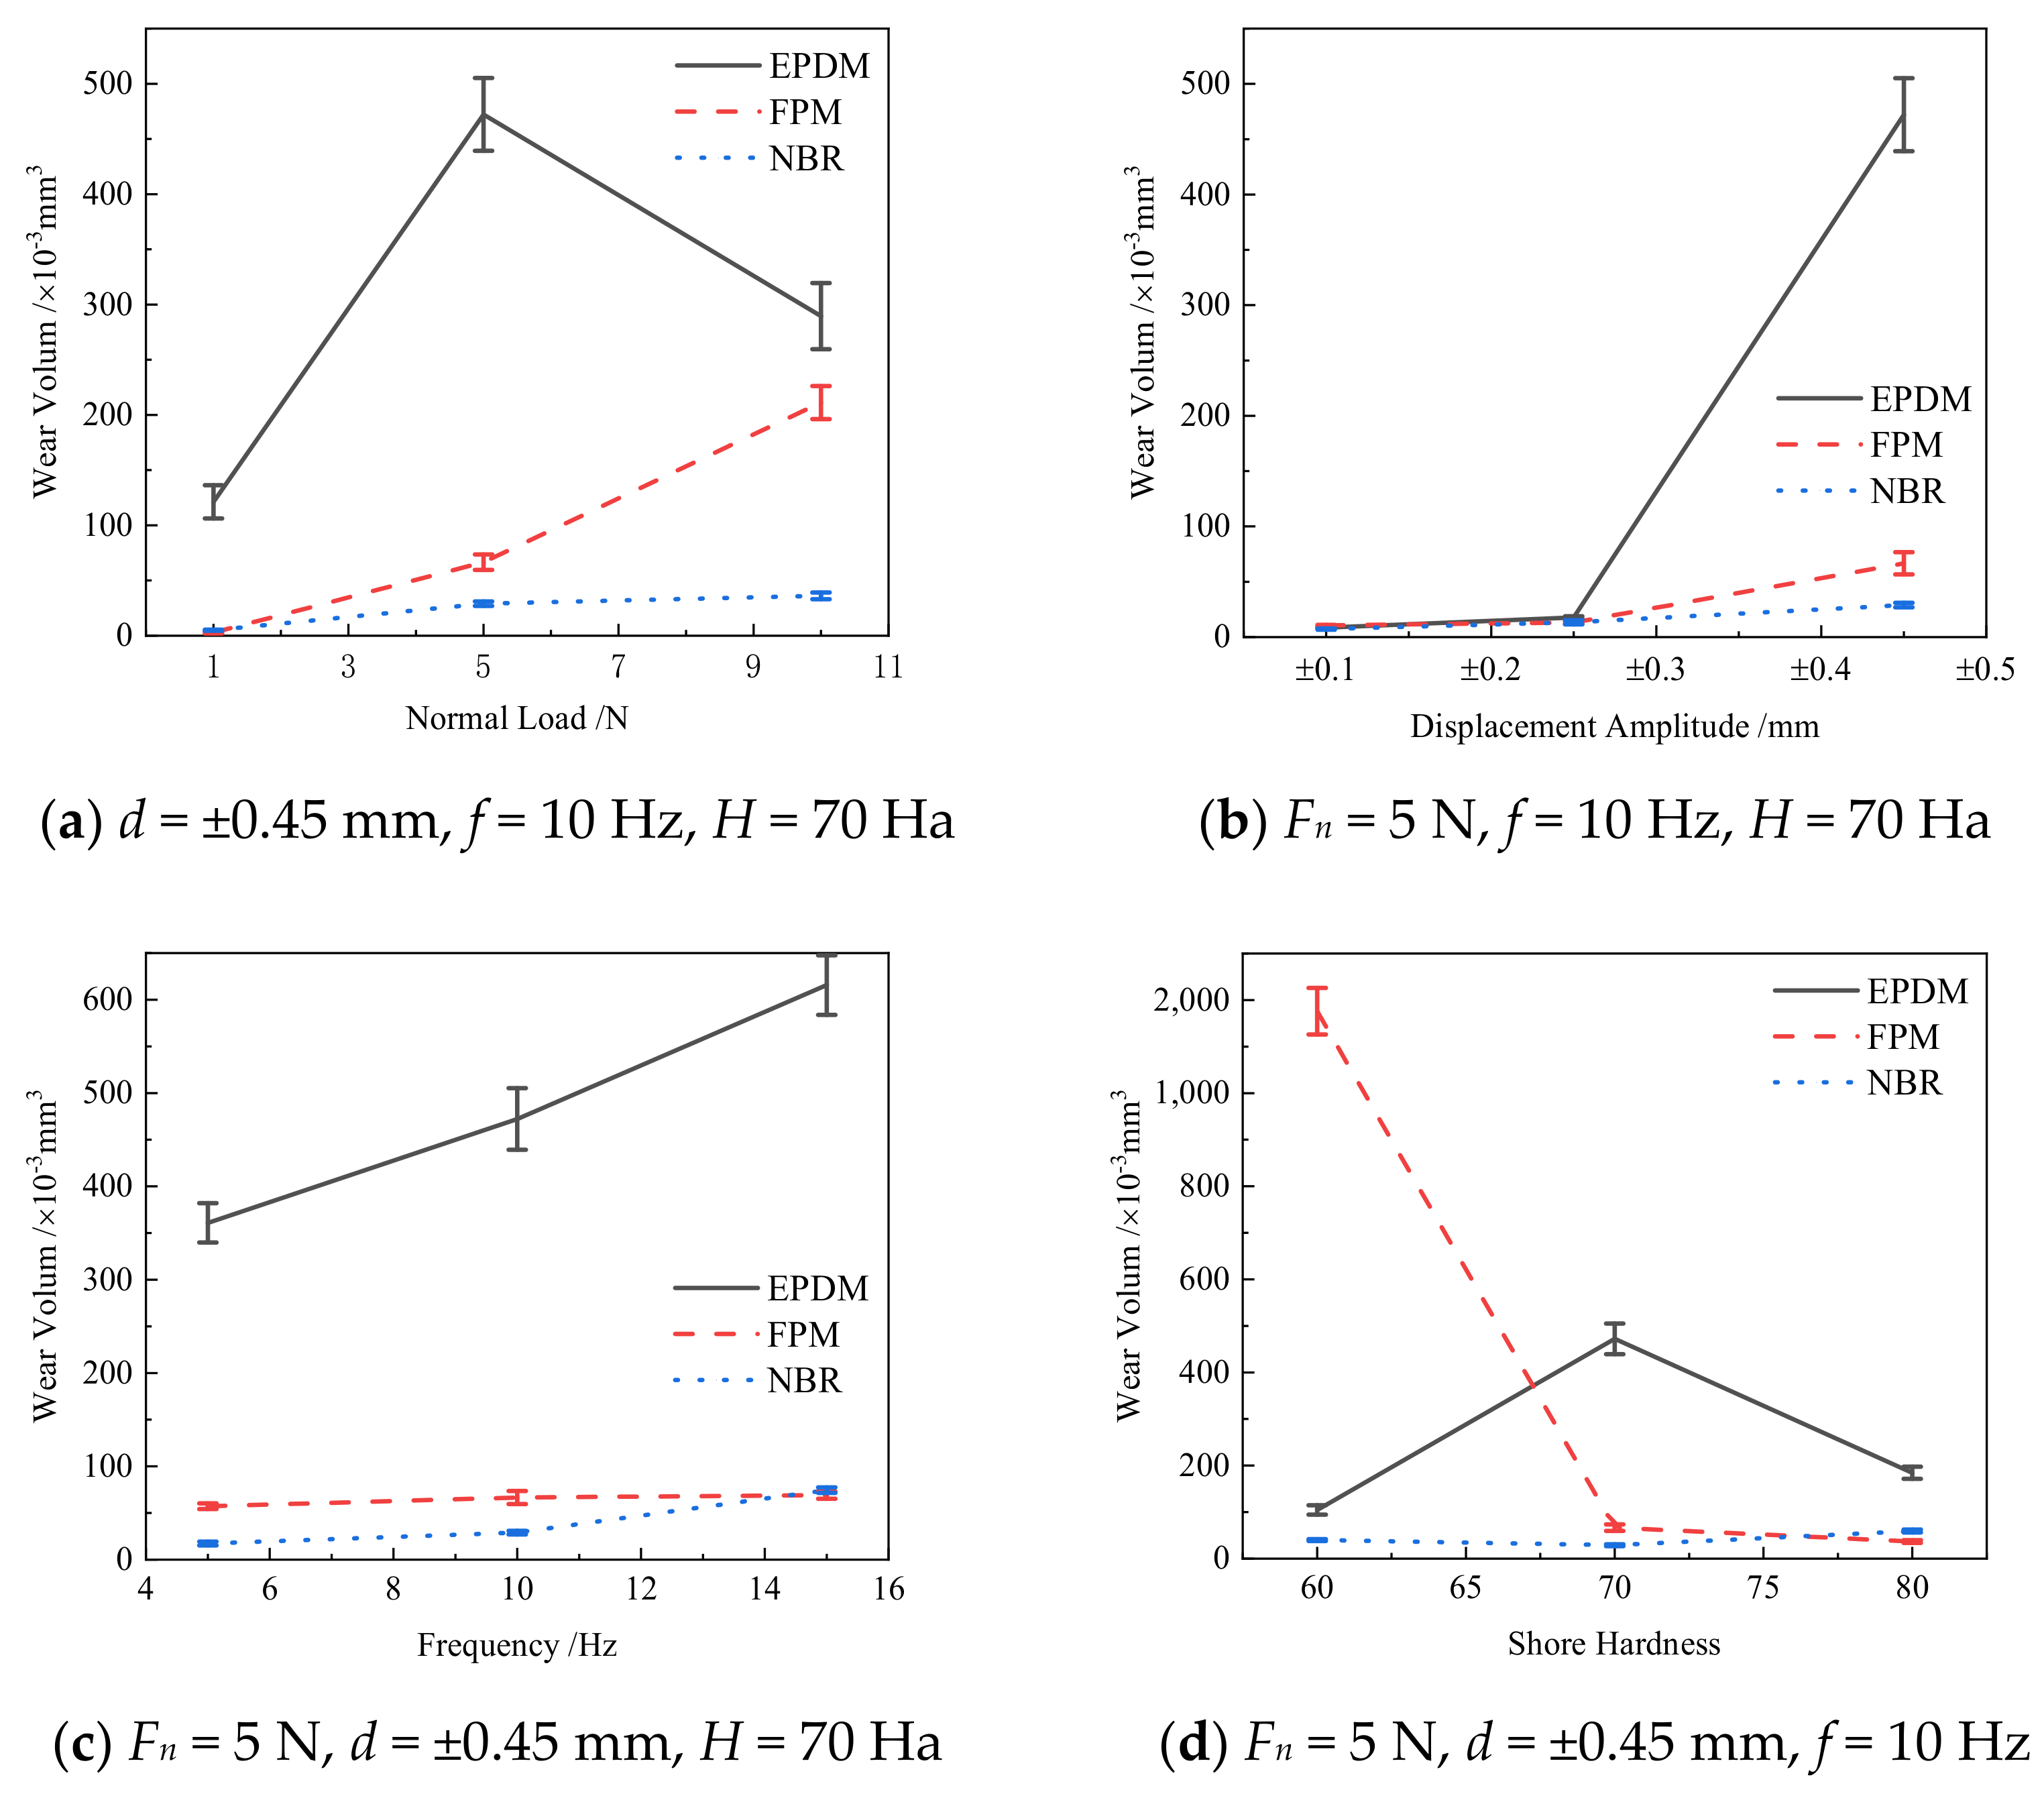
3.4. Wear Volume
4. Conclusions
Author Contributions
Funding
Institutional Review Board Statement
Informed Consent Statement
Data Availability Statement
Conflicts of Interest
References
- Brochu, P.; Pei, Q. Advances in dielectric elastomers for actuators and artificial muscles. Macromol. Rapid Comm. 2010, 31, 10–36. [Google Scholar] [CrossRef]
- Yang, C.; Shen, S.L.; Hou, D.W.; Liao, S.M.; Yuan, D.J. Material properties of the seal gasket for shield tunnels: A review. Constr. Build. Mater. 2018, 191, 877–890. [Google Scholar] [CrossRef]
- Waterhouse, R.B. Fretting fatigue. Mater. Sci. Eng. 1976, 25, 201–206. [Google Scholar] [CrossRef]
- Waterhouse, R.B. Fretting Corrosion; Pergamon Press: Oxford, UK, 1972. [Google Scholar]
- Baek, D.K.; Khonsari, M.M. Friction and wear of a rubber coating in fretting. Wear 2005, 258, 898–905. [Google Scholar] [CrossRef]
- Baek, D.K.; Khonsari, M.M. Fretting behavior of a rubber coating: Friction characteristics of rubber debris. Wear 2006, 261, 1114–1120. [Google Scholar] [CrossRef]
- Baek, D.K.; Khonsari, M.M. Fretting behavior of a rubber coating: Effect of temperature and surface roughness variations. Wear 2008, 265, 620–625. [Google Scholar] [CrossRef]
- Felhos, D.; Karger-Kocsis, J. Tribological testing of peroxide-cured EPDM rubbers with different carbon black contents under dry sliding conditions against steel. Tribol. Int. 2008, 41, 404–415. [Google Scholar] [CrossRef]
- Karger-Kocsis, J.; Felhos, D.; Xu, D.; Schlarb, A.K. Unlubricated sliding and rolling wear of thermoplastic dynamic vulcanizates (Santoprene (R)) against steel. Wear 2008, 265, 292–300. [Google Scholar] [CrossRef]
- Shen, M.X.; Peng, X.D.; Meng, X.K.; Zheng, J.P.; Zhu, M.H. Fretting wear behavior of acrylonitrile–butadiene rubber (NBR) for mechanical seal applications. Tribol. Int. 2016, 93, 419–428. [Google Scholar] [CrossRef]
- Shen, M.X.; Dong, F.; Ma, Y.; Peng, J.F.; Zhu, M.H. Fretting wear behaviors of acrylonitrile-butadiene rubber (NBR) against diamond-like carbon and graphene coatings. Int. J. Adv. Manuf. Tech. 2018, 96, 1749–1759. [Google Scholar] [CrossRef]
- Guo, Y.B.; Zhang, Z.; Wang, D.G.; Zhang, S.W. Fretting wear behavior of rubber against concrete for submarine pipeline laying clamping. Wear 2019, 423, 102925. [Google Scholar] [CrossRef]
- Zhou, C.L.; Chen, G.H.; Xiao, S.; Hua, Z.L.; Gu, C.H. Study on fretting behavior of rubber O-ring seal in high-pressure gaseous hydrogen. Int. J. Hydrogen Energ. 2019, 44, 22569–22575. [Google Scholar] [CrossRef]
- Wu, Y.P.; Li, Z.Y.; Zhu, S.F.; Lu, L.; Cai, Z.B. Effect of frequency on fretting wear behavior of Ti/TiN multilayer film on depleted uranium. PLoS ONE 2017, 12, e0175084. [Google Scholar] [CrossRef]
- Mindlin, R.D. Compliance of elastic bodies in contact. J. Appl. Mech. Trans. ASME 1949, 16, 259–268. [Google Scholar] [CrossRef]
- Waterhouse, R.B. Fretting wear. Wear 1984, 100, 107–118. [Google Scholar] [CrossRef]
- Li, J.; Yang, B.B.; Lu, Y.H.; Xin, L.; Wang, Z.H.; Shoji, T. The effect of normal force on fretting corrosion behavior of Inconel 690 in 3.5% sodium chloride. Mater. Charact. 2017, 131, 224–233. [Google Scholar] [CrossRef]
- Nakazawa, K.; Maruyama, N.; Hanawa, T. Effect of contact pressure on fretting fatigue of austenitic stainless steel. Tribol. Int. 2003, 36, 79–85. [Google Scholar] [CrossRef]
- Endo, H.; Marui, E. Studies on fretting wear (combinations of various ceramics spheres and carbon steel plates). Wear 2004, 257, 80–88. [Google Scholar] [CrossRef]
- Jin, O.; Mall, S. Effects of independent pad displacement on fretting fatigue behavior of Ti–6Al–4V. Wear 2002, 253, 585–596. [Google Scholar] [CrossRef]
- Campbell, P.Q.; Celis, J.P.; Roos, J.R.; Vanderbiest, O. Fretting wear of selected ceramics and cermets. Wear 1994, 174, 47–56. [Google Scholar] [CrossRef]
- Shu, Y.J.; Ke, L.L.; Su, J.; Wang, Y.S. Experimental investigation on fretting wear behavior of piezoceramics under sphere-on-flat contact. Tribol. Trans. 2020, 63, 971–985. [Google Scholar] [CrossRef]
- Shu, Y.J.; Ke, L.L.; Su, J.; Shen, F. Experimental studies on fretting wear behavior of PVDF piezoelectric thin films. Materials 2021, 14, 734. [Google Scholar] [CrossRef] [PubMed]
- Yuan, X.L.; Li, G.; Zhang, X.Y.; Pu, J.; Ren, P. An experimental investigation on fretting wear behavior of copper–magnesium alloy. Wear 2020, 462–463, 203497. [Google Scholar] [CrossRef]
- Xin, L.; Han, Y.M.; Ling, L.G.; Zhang, W.D.; Lu, T.H.; Shoji, T. The evolution of fretting wear behavior and damage mechanism in Alloy 690TT with cycle number. Materials 2020, 13, 2417. [Google Scholar] [CrossRef]
- Duan, Y.; Qu, S.G.; Jia, S.Y.; Li, X.Q. Evolution of wear damage in gross sliding fretting of a nitrided high-carbon high-chromium steel. Wear 2021, 464, 203548. [Google Scholar] [CrossRef]
- Zhang, Y.L.; Huang, L.M.; Lu, F.; Qu, S.G.; Ji, V.; Hu, X.F.; Liu, H.P. Effects of ultrasonic surface rolling on fretting wear behaviors of a novel 25CrNi2MoV steel. Mater. Lett. 2021, 284, 128955. [Google Scholar] [CrossRef]
- Wang, G.H.; He, G.W.; Qu, S.G.; Li, H.; Zhou, M.S.; Zhang, H.S. Fretting wear of the nitrided medium carbon steel under line contact condition at an elevated temperature. Ind. Lubr. Tribol. 2021, 73, 15–22. [Google Scholar] [CrossRef]
- Xu, J.; Zhou, Z.R.; Zhang, C.H.; Zhu, M.H.; Luo, J.B. An investigation of fretting wear behaviors of bonded solid lubricant coatings. J. Mater. Process. Technol. 2007, 182, 146–151. [Google Scholar] [CrossRef]
- Lee, L.; Regis, E.; Descartes, S.; Chromik, R.R. Fretting wear behavior of Zn–Ni alloy coatings. Wear 2015, 330, 112–121. [Google Scholar] [CrossRef]
- Wu, S.; Wu, X.Q.; Wang, S.Q.; Xie, F.Q. Fretting wear behaviors of APS AT40 coating and Al2O3/AT40 composite coating on TC6 alloy. J. Mater. Process. Technol. 2021, 290, 116983. [Google Scholar] [CrossRef]
- Sharma, A.; Vijay, A.; Sadeghi, F. Finite element modeling of fretting wear in anisotropic composite coatings: Application to HVOF Cr3C2–NiCr coating. Tribol. Int. 2021, 155, 106765. [Google Scholar] [CrossRef]
- Niu, Z.Q.; Zhou, W.L.; Wang, C.L.; Cao, Z.W.; Yang, Q.; Fu, X.S. Fretting wear mechanism of plasma-sprayed CuNiIn coating on Ti-6Al-4V substrate under plane/plane contact. Surf. Coat. Tech. 2021, 408, 126794. [Google Scholar] [CrossRef]
- Lin, M.Y.; Nemcova, A.; Voevodin, A.A.; Korenyi-Both, A.; Liskiewicz, T.W.; Laugel, N.; Matthews, A.; Yerokhin, A. Surface characteristics underpinning fretting wear performance of heavily loaded duplex chameleon/PEO coatings on Al. Tribol. Int. 2021, 154, 106723. [Google Scholar] [CrossRef]
- Bayrak, S.; Paulkowski, D.; Stockelhuber, K.W.; Staar, B.; Mayer, B. A comprehensive study about the role of crosslink density on the tribological behavior of DLC coated rubber. Materials 2020, 13, 5460. [Google Scholar] [CrossRef] [PubMed]
- Szczypinski-Sala, W.; Lubas, J. Tribological characteristic of a ring seal with graphite filler. Materials 2020, 13, 311. [Google Scholar] [CrossRef] [PubMed]
- Pan, Y.R.; Han, D.S.; Zhu, L.; Zhang, M.; Bian, H.G.; Wang, C.S.; Han, W.W. Effect of adding MoDTC on the properties of carbon black rubber and the friction and wear of metal during mixing process. Materials 2020, 13, 1071. [Google Scholar] [CrossRef]
- Vaikuntam, S.R.; Bhagavatheswaran, E.S.; Xiang, F.; Wiessner, S.; Heinrich, G.; Das, A.; Stockelhuber, K.W. Friction, abrasion and crack growth behavior of in-situ and ex-situ silica filled rubber composites. Materials 2020, 13, 270. [Google Scholar] [CrossRef] [PubMed]
- Steinier, J.; Termonia, Y.; Deltour, J. Smoothing and differentiation of data by simplified least square procedure. Anal. Chem. 1972, 44, 1906–1909. [Google Scholar] [CrossRef]
- Harea, E.; Stocek, R.; Machovsky, M. Study of friction and wear of thermoplastic vulcanizates: The correlation with abraded surfaces topology. J. Phys. Conf. Ser. 2017, 843, 012070. [Google Scholar] [CrossRef]
- Kim, K.; Korsunsky, A.M. Dissipated energy and fretting damage in CoCrAlY-MoS2 coatings. Tribol. Int. 2010, 43, 676–684. [Google Scholar] [CrossRef]
- Zhou, Z.R.; Fayeulle, S.; Vincent, L. Cracking behaviour of various aluminium alloys during fretting wear. Wear 1992, 155, 317–330. [Google Scholar] [CrossRef]
- Schallamach, A. Friction and abrasion of rubber. Wear 1958, 1, 384–417. [Google Scholar] [CrossRef]


| Properties | EPDM | FPM | NBR |
|---|---|---|---|
| Hardness, H (Ha) | 60–80 | 60–80 | 60–80 |
| Young’s modulus, E (MPa) | 6.65–16.53 | 3.44–16.06 | 3.41–16.75 |
| Surface roughness, Ra (μm) | 0.23–0.27 | 0.21–0.25 | 0.17–0.30 |
| Rubber. | ZnO (phr) | SA (phr) | TTD (phr) | S (phr) | VA (phr) | CB (phr) |
|---|---|---|---|---|---|---|
| EPDM (H = 60 Ha) | 5 | 1 | 1.5 | 1.5 | - | 24 |
| FPM (H = 60 Ha) | 5 | 1 | - | - | 3.0 | 26 |
| NBR (H = 60 Ha) | 5 | 1 | 1.5 | 1.5 | - | 24 |
| EPDM (H = 70 Ha) | 5 | 1 | 1.5 | 1.5 | - | 44 |
| FPM (H = 70 Ha) | 5 | 1 | - | - | 3.0 | 46 |
| NBR (H = 70 Ha) | 5 | 1 | 1.5 | 1.5 | - | 44 |
| EPDM (H = 80 Ha) | 5 | 1 | 1.5 | 1.5 | - | 64 |
| FPM (H = 80 Ha) | 5 | 1 | - | - | 3.0 | 66 |
| NBR (H = 80 Ha) | 5 | 1 | 1.5 | 1.5 | - | 64 |
Publisher’s Note: MDPI stays neutral with regard to jurisdictional claims in published maps and institutional affiliations. |
© 2021 by the authors. Licensee MDPI, Basel, Switzerland. This article is an open access article distributed under the terms and conditions of the Creative Commons Attribution (CC BY) license (https://creativecommons.org/licenses/by/4.0/).
Share and Cite
Zhang, T.; Su, J.; Shu, Y.; Shen, F.; Ke, L. Fretting Wear Behavior of Three Kinds of Rubbers under Sphere-On-Flat Contact. Materials 2021, 14, 2153. https://doi.org/10.3390/ma14092153
Zhang T, Su J, Shu Y, Shen F, Ke L. Fretting Wear Behavior of Three Kinds of Rubbers under Sphere-On-Flat Contact. Materials. 2021; 14(9):2153. https://doi.org/10.3390/ma14092153
Chicago/Turabian StyleZhang, Tengfei, Jie Su, Yuanjie Shu, Fei Shen, and Liaoliang Ke. 2021. "Fretting Wear Behavior of Three Kinds of Rubbers under Sphere-On-Flat Contact" Materials 14, no. 9: 2153. https://doi.org/10.3390/ma14092153
APA StyleZhang, T., Su, J., Shu, Y., Shen, F., & Ke, L. (2021). Fretting Wear Behavior of Three Kinds of Rubbers under Sphere-On-Flat Contact. Materials, 14(9), 2153. https://doi.org/10.3390/ma14092153