Article

High-Performance Complementary Electrochromic Device Based on Iridium Oxide as a Counter Electrode

1
Department of Mechanical Engineering, National Taiwan University, Taipei City 10617, Taiwan
2
Division of Physics, Institute of Nuclear Energy Research, Taoyuan City 32546, Taiwan
*
Authors to whom correspondence should be addressed.
Materials 2021, 14(7), 1591; https://doi.org/10.3390/ma14071591
Submission received: 14 February 2021 / Revised: 12 March 2021 / Accepted: 18 March 2021 / Published: 24 March 2021
(This article belongs to the Section Thin Films and Interfaces)

Abstract

:
In complementary electrochromic devices (ECDs), nickel oxide (NiO) is generally used as a counter electrode material for enhancing the coloration efficiency. However, an NiO film as a counter electrode in ECDs is susceptible to degradation upon prolonged electrochemical cycling, which leads to an insufficient device lifetime. In this study, a type of counter electrode iridium oxide (IrO2) layer was fabricated using vacuum cathodic arc plasma (CAP). We focused on the comparison of IrO2 and NiO deposited on a 5 × 5 cm2 indium tin oxide (ITO) glass substrate with various Ar/O2 gas-flow ratios (1/2, 1/2.5, and 1/3) in series. The optical performance of IrO2-ECD (glass/ITO/WO3/liquid electrolyte/IrO2/ITO/glass) was determined by optical transmittance modulation; ∆T = 50% (from Tbleaching (75%) to Tcoloring (25%)) at 633 nm was higher than that of NiO-ECD (ITO/NiO/liquid electrolyte/WO3/ITO) (∆T = 32%). Apart from this, the ECD device demonstrated a fast coloring time of 4.8 s, a bleaching time of 1.5 s, and good cycling durability, which remained at 50% transmittance modulation even after 1000 cycles. The fast time was associated with the IrO2 electrode and provided higher diffusion coefficients and a filamentary shape as an interface that facilitated the transfer of the Li ions into/out of the interface electrodes and the electrolyte. In our result of IrO2-ECD analyses, the higher optical transmittance modulation was useful for promoting electrochromic application to a cycle durability test as an alternative to NiO-ECD.

1. Introduction

Electrochromic devices (ECDs) have attracted considerable attention because they have tremendously promising applications in energy-saving smart windows that can enhance the optical properties and durability reversibly upon the application of a Direct Current (DC) voltage [1,2]. Electrochromic (EC) materials applied on smart windows can easily dominate the indoor illumination and effectively decrease the air-condition loading of buildings [3,4]. Furthermore, ECDs can save renewable energy and cause a persistent reversible color change upon the application of a small voltage [3,4] to reduce the energy consumption significantly; therefore, they are an extraordinary material providing some unique advantages such as larger optical modulation and better cyclic stability against sunlight exposure, for smart windows in a green building environment [5,6]. In general, ECD consists of a five-layer structure such as TCO/EC/IC/CE/TCO layers, where TCO, IC, and CE are transparent conducting oxide, ion conducting layer, and counter electrode, respectively [7,8,9]. In recent years, electrochromic materials have attracted considerable research interest in numerous metal-oxides, including molybdenum trioxide (MoO3), vanadium oxide (V2O5), niobium oxide (Nb2O5), and titanium dioxide (TiO2) [9,10]. In addition to the oxides, conducting polymers are also widely studied in electrochromic devices [11,12]. However, typically, complementary electrochromic devices include anodic and cathodic electrodes in a multi-layer. Tungsten oxide (WO3) film is the most commonly used electrode material and is complementary to an anodic layer of NiO or another extraordinary material such as IrO2 [13,14,15]. Electrochromic IrO2 and NiO films have been manufactured by diverse procedures such as sputtering [16,17], pulsed laser system [18], cathodic electrodeposition [19], chemical vapor deposition [20,21], thermal evaporation [22,23,24], and sol-gel [25,26,27].
Here, a type of counter electrode iridium oxide (IrO2) layer was fabricated using vacuum cathodic arc plasma (CAP). We compared two anodic coloration material of IrO2 and NiO films [13,14] which showed IrO2 films were better to enhance electrochromic properties than NiO. Cathodic arc plasm (CAP) fabricated procedure has been widely used in several types of films owing to the outstanding features of the arc plasma fabricated from cathode spots. In this method, the macro-particles (MPs) are released on account of the severe plasma-liquid pool influence on the cathode spots, and MPs sticking to the films make worse the properties of thin films. The infamous macro particle situation is the key reason why CAP system is not commonly applied in high-tech field. We implemented two ways to improve the quality of materials. One is to reduce macro-particles when arc discharge from a random (insufficient and outer magnetic field) to an arc (at axial magnetic field) showed that immediately improve the quality of nitride coating [28]. The result showed that less macro particles are thrown out using high horizontal magnetic field and increasing clear spot velocity [29]; another is by means of Theorton deposition [30], the composition of loose-packing structure at high working pressure condition. Arc plasms can be controlled in high pressure, and the structure may appear self-organized and lessen macro particle size [31]. Recently, researchers have investigated more study in monolithic coatings than higher-performing multilayers. The formation of electrode structure is controlled by the flow of argon (for insertion) and oxygen (reaction) [8]. In the recent years, P. W. Chen et al. [32] investigated in vacuum cathodic arc plasma (CAP) to fabricate all solid-state electrochromic devices (ECDs) with tantalum oxide (Ta2O5) as ion conductor layer. It emphasized on manufacturing Ta2O5 film by CAP with various gas ratios of oxygen and argon. K. Li et al. [33] suggested that indium–zinc–tin oxide (IZTO) films make use of the controlling powers of DC magnetron sputtering to improve the surface properties of ITO as a transparent electrode. We have manufactured ECD composing of a WO3 electrode film on IZTO/ITO/glass and a counter-electrode (Pt mesh) using 0.2 M LiClO4/PC solution. P. W. Chen et al. [8] used CAP deposition to make the porous surface structure of WO3/NiO films to upgrade the electrochromic performance. They found that the thickness of WO3 layers is an essential factor of ECDs for optical and electrochemical properties. However, the NiO film used as a counter electrode in ECDs is more susceptible to degrade upon prolonged electrochemical cycling which leads to insufficient device lifetime than IrO2 film.
In this study, we used a CAP technology to deposit IrO2 films provided porous surface structure to elevate electrochromic properties and promote switching speeds. The aim of this work was to compare between IrO2 and NiO films; however, a systematic study of the effect of the Ar/O2 mixing ratio by means of CAP is lacking. This fabricated technology is exclusive for high deposition rates with a low-cost method and can be used to fabricate diverse transition metal-oxides having nanostructures with a morphological phenomenon. We focused on the influence of various Ar/O2 gas-flow ratios with an IrO2 electrode as compared to NiO on the diffusion behavior of ion insertion/extraction, material structure, surface morphology, transmittance optical modulation, and durability test.

2. Materials and Methods

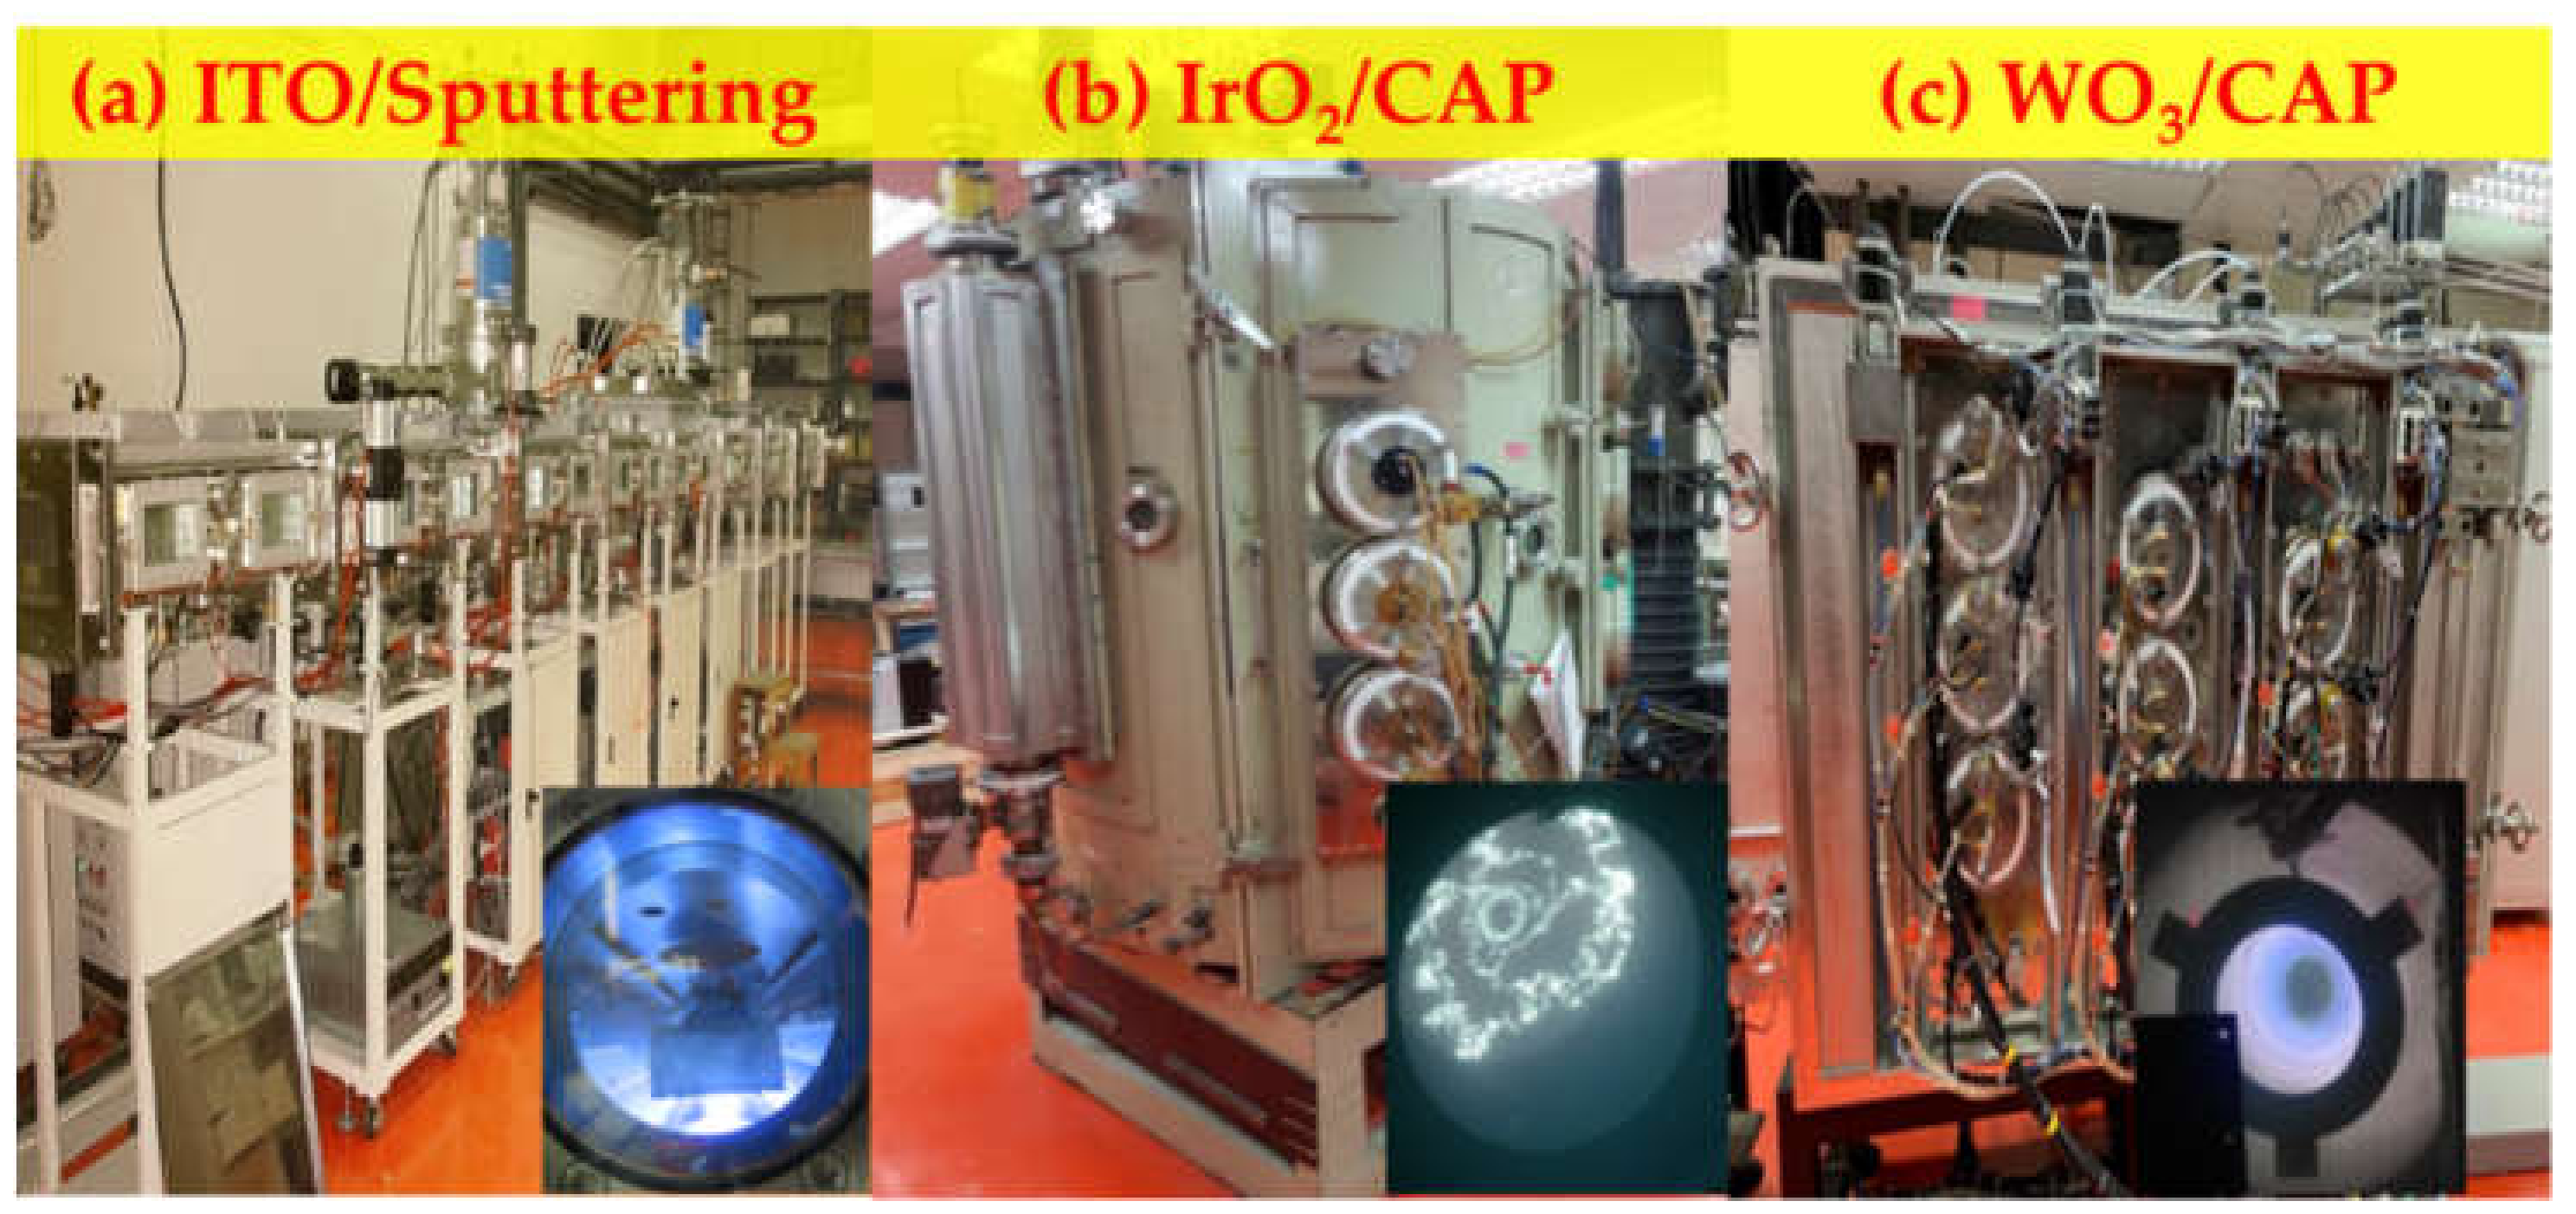
2.1. Preparation of Transparent and Electrochromic Electrodes and Electrolyte Materials

In this study, we used of method of CAP deposition technology as an alternative to sputtering in order to achieve high deposition rates at a low cost of producing EC films based on NiO and IrO2 electrodes for ECD applications. We prepared a series of IrO2 (Sample 1–3) and NiO films (Sample 4–6) under increasing Ar/O2 gas-flow ratios (1/2, 1/2.5, and 1/3) as anodic layers, which were deposited on a 5 × 5 cm2 indium tin oxide (ITO) glass substrate with a resistance of 6 Ω/cm2. The deposition process is presented in Table 1. Prior to the deposition of each electrochromic layer, the ITO-coated glasses were cleaned ultrasonically with ethyl alcohol and deionized water for 15 min to remove contaminants. Both the IrO2 and NiO electrodes were implemented via cathodic arc plasma (CAP) by using a pure metallic iridium (Ir) target (99.95%) and nickel (Ni) target (99.95%) with a diameter of 76 mm, respectively, in the vacuum chamber. Moreover, WO3 as the cathodic layer using a tungsten (W) target (99.95%) was fabricated, as listed in Table 2 by using the CAP technology. For the electrodes to ensure the lithium (Li+) ion transport, we were carried out a liquid electrolyte system containing lithium perchlorate (LiClO4) and propylene carbonate (PC, C4H6O3) at a weight ratio of 0.1325 [4]. The complementary electrochromic devices (ECDs) consisted of five superimposed layers with an ITO (300 nm)/IrO2 (100 nm) /LiClO4-PC (100 um)/WO3 (100 nm)/ITO (300 nm) structure and fabricated by deposited system respectively in Figure 1.

2.2. Measurements and Characterizations

The electrochemical properties of the electrochromic electrodes were measured using cycle voltammetry (CV) (model PGSTAT30, Autolab, Utrecht, The Netherlands) in a three-compartment system containing the abovementioned electrodes as the working electrodes (IrO2/ITO/glass and NiO/ITO/glass) and Ag/AgCl as the reference electrodes, and Pt foil as the counter electrodes. Sample 1–6 carried out electrochemical cycles in the 0.5-M LiClO4-PC solution at −0.5 V to 2.0 V and a potential sweep rate of 100 mV/s. The optical transmittance spectra of the colored and the bleached states were obtained using an ultraviolet-visible (UV-Vis) spectrophotometer (model DH-2000-BAL, Ocean Optics, Dunedin, FL, USA) in a wavelength range from 300 nm to 1000 nm. The crystalline structure was characterized by a high-resolution X-ray diffractometer (HRXRD, Model D8, Bruker AXS, Billerica, MA, USA) equipped with a CuKα (λ = 0.154 nm) radiation source over a 2θ scan region of 20° to 70°. It is provided with the essential accuracy and precision to measure the broadening and the relative peak. The surface morphological properties were examined with a field emission scanning electron microscope (FE-SEM) (Model S4800, Hitachi, Tokyo, Japan) operated at 15 kV.

3. Results and Discussion

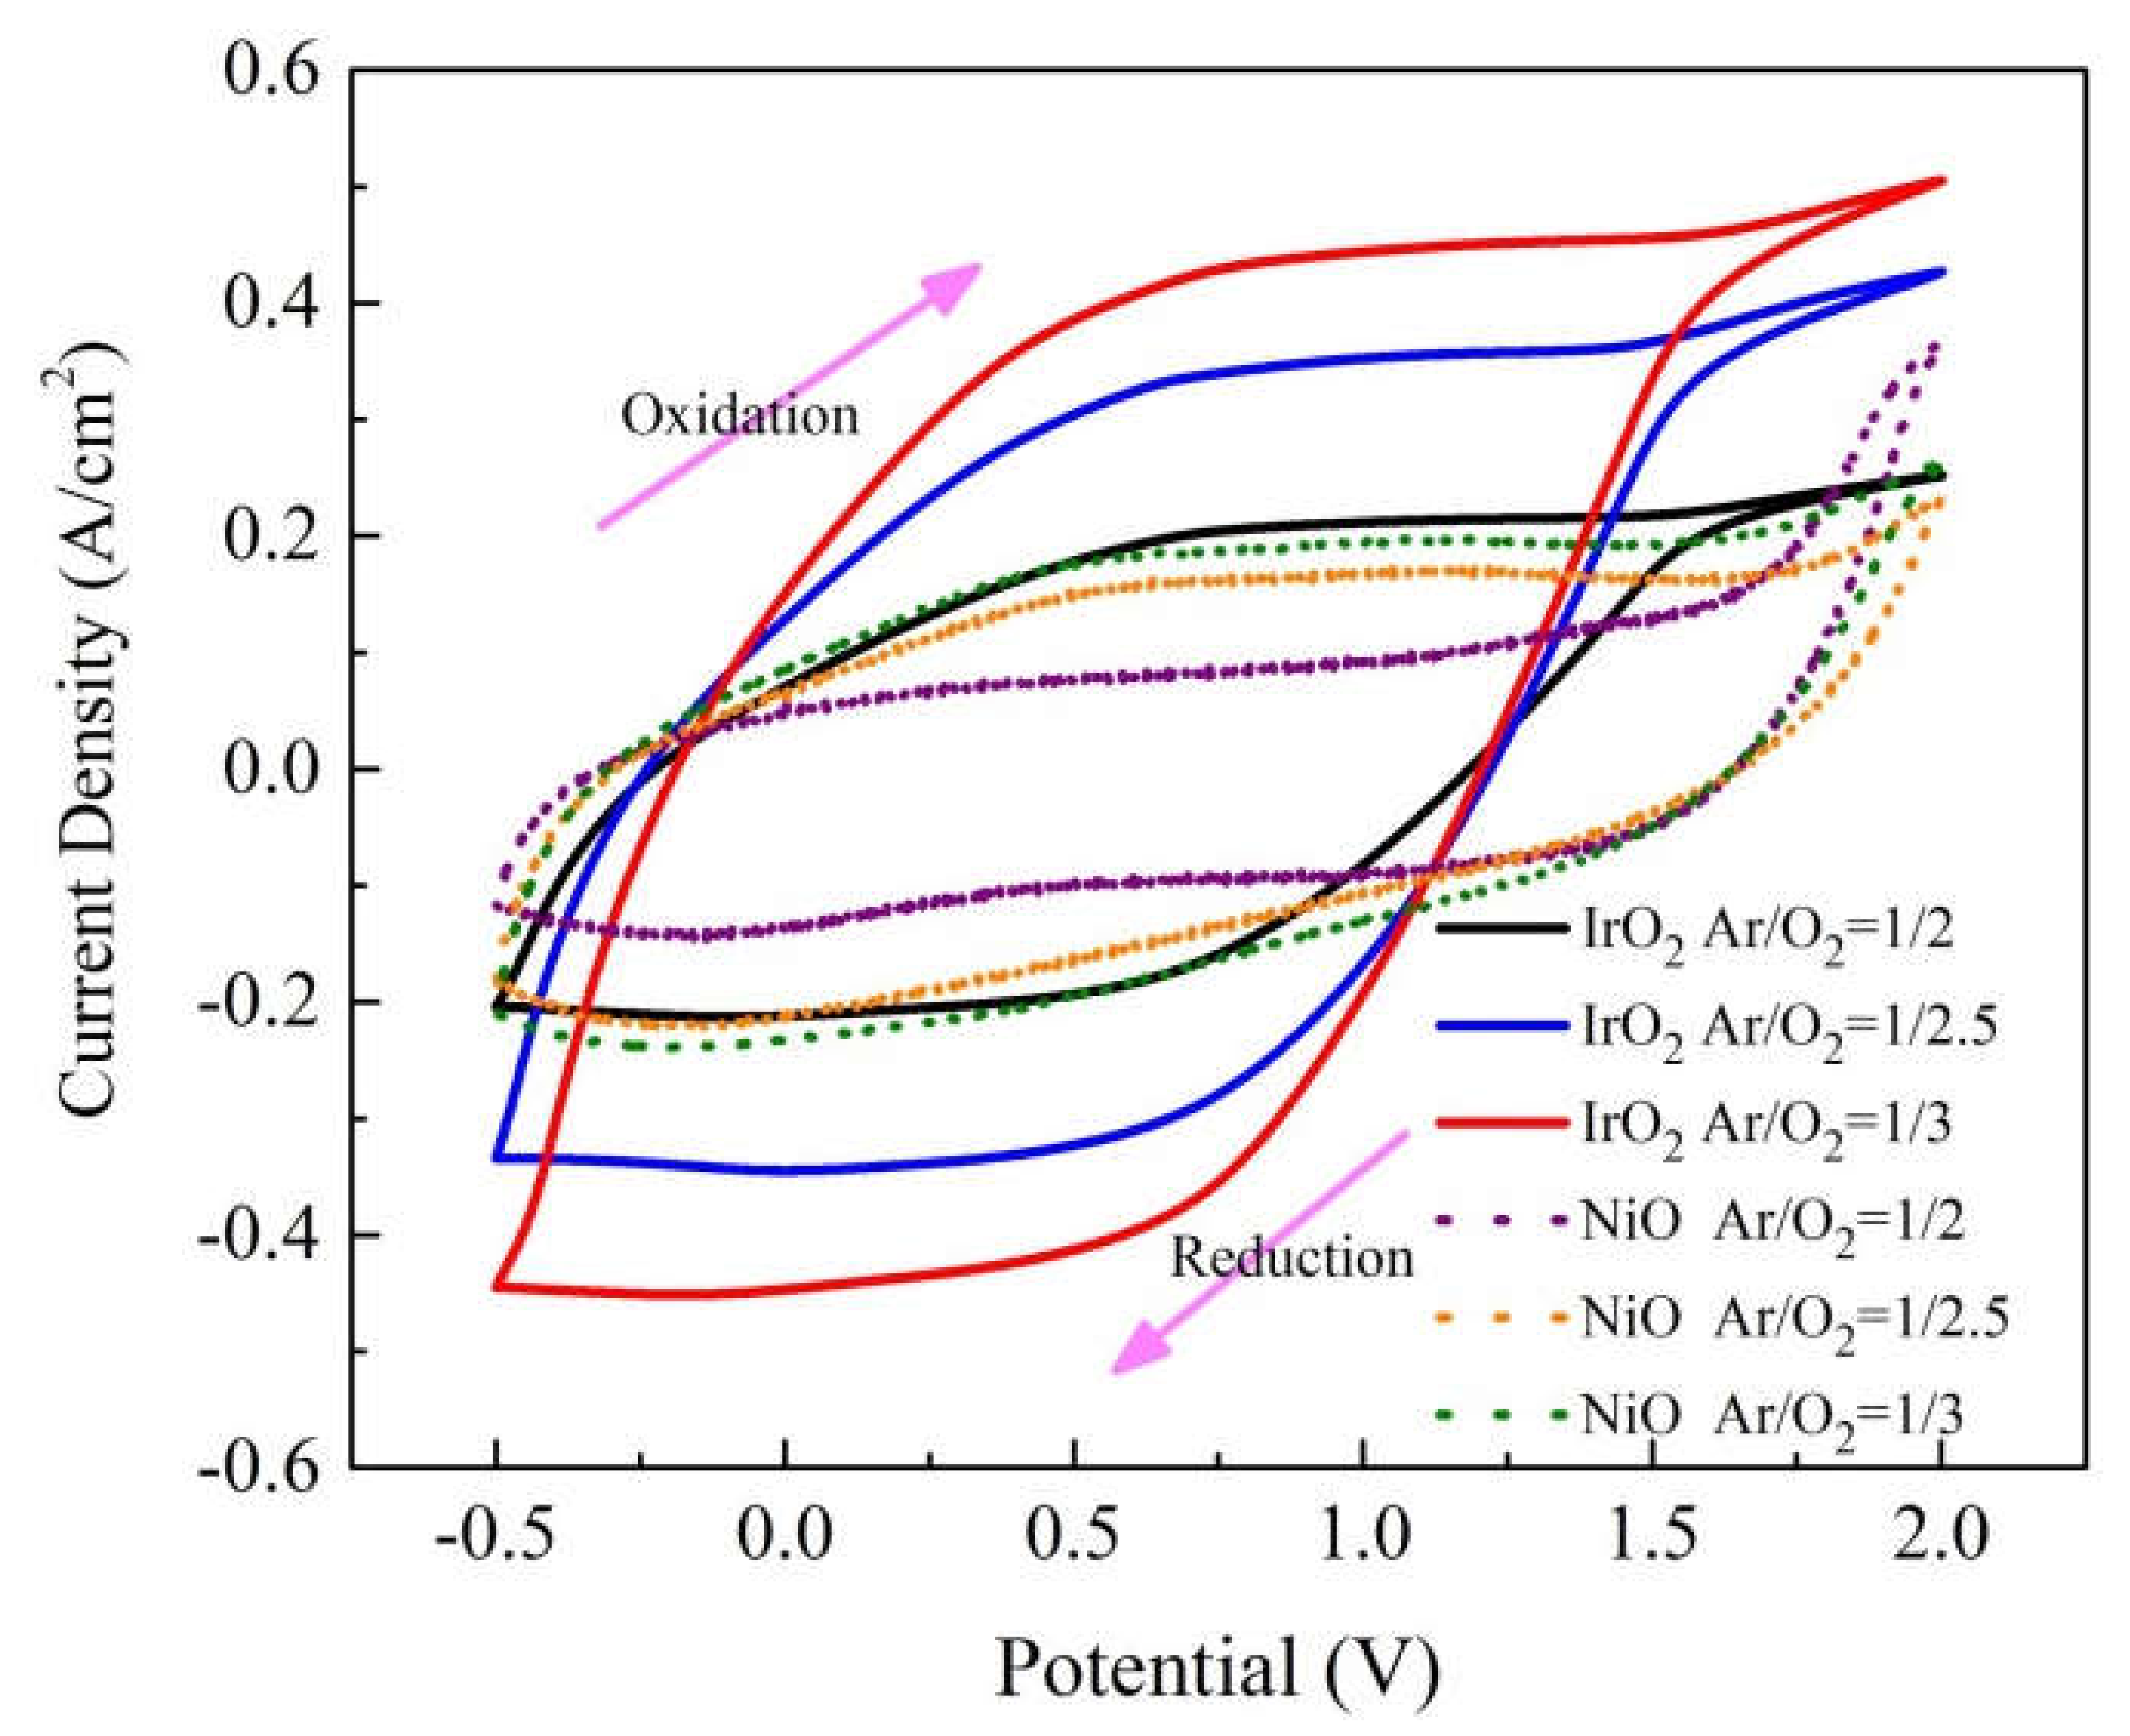
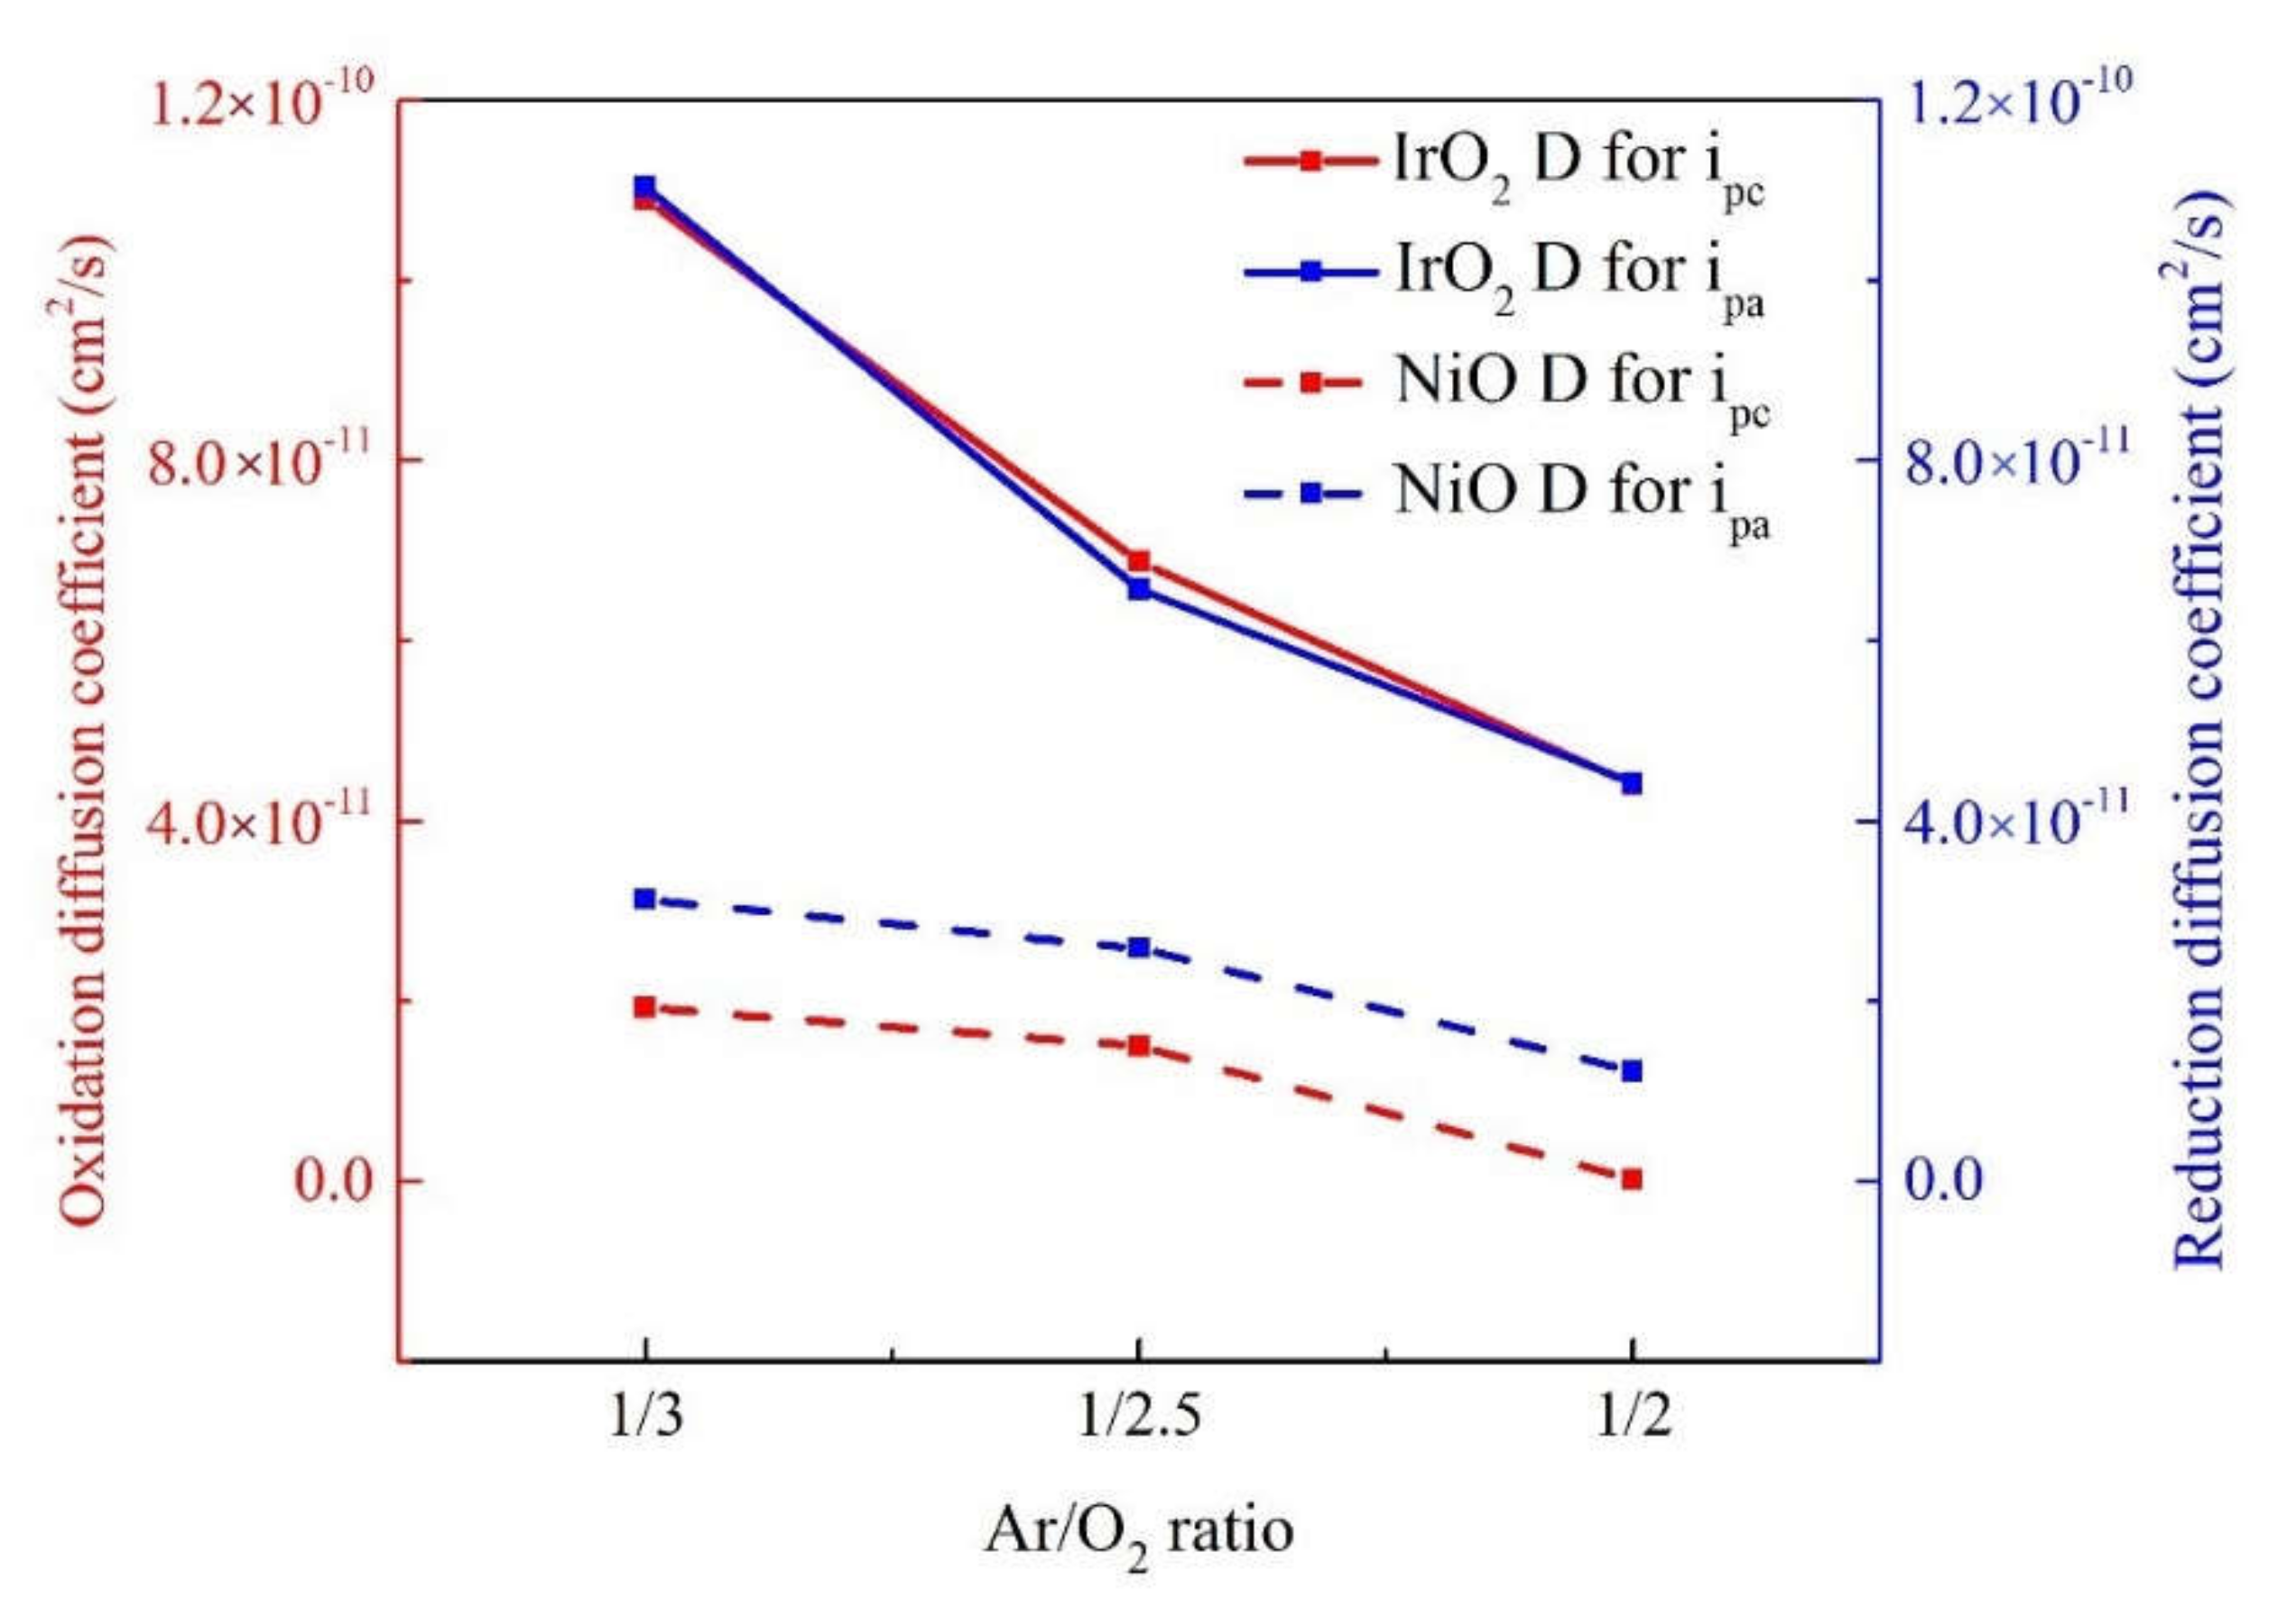
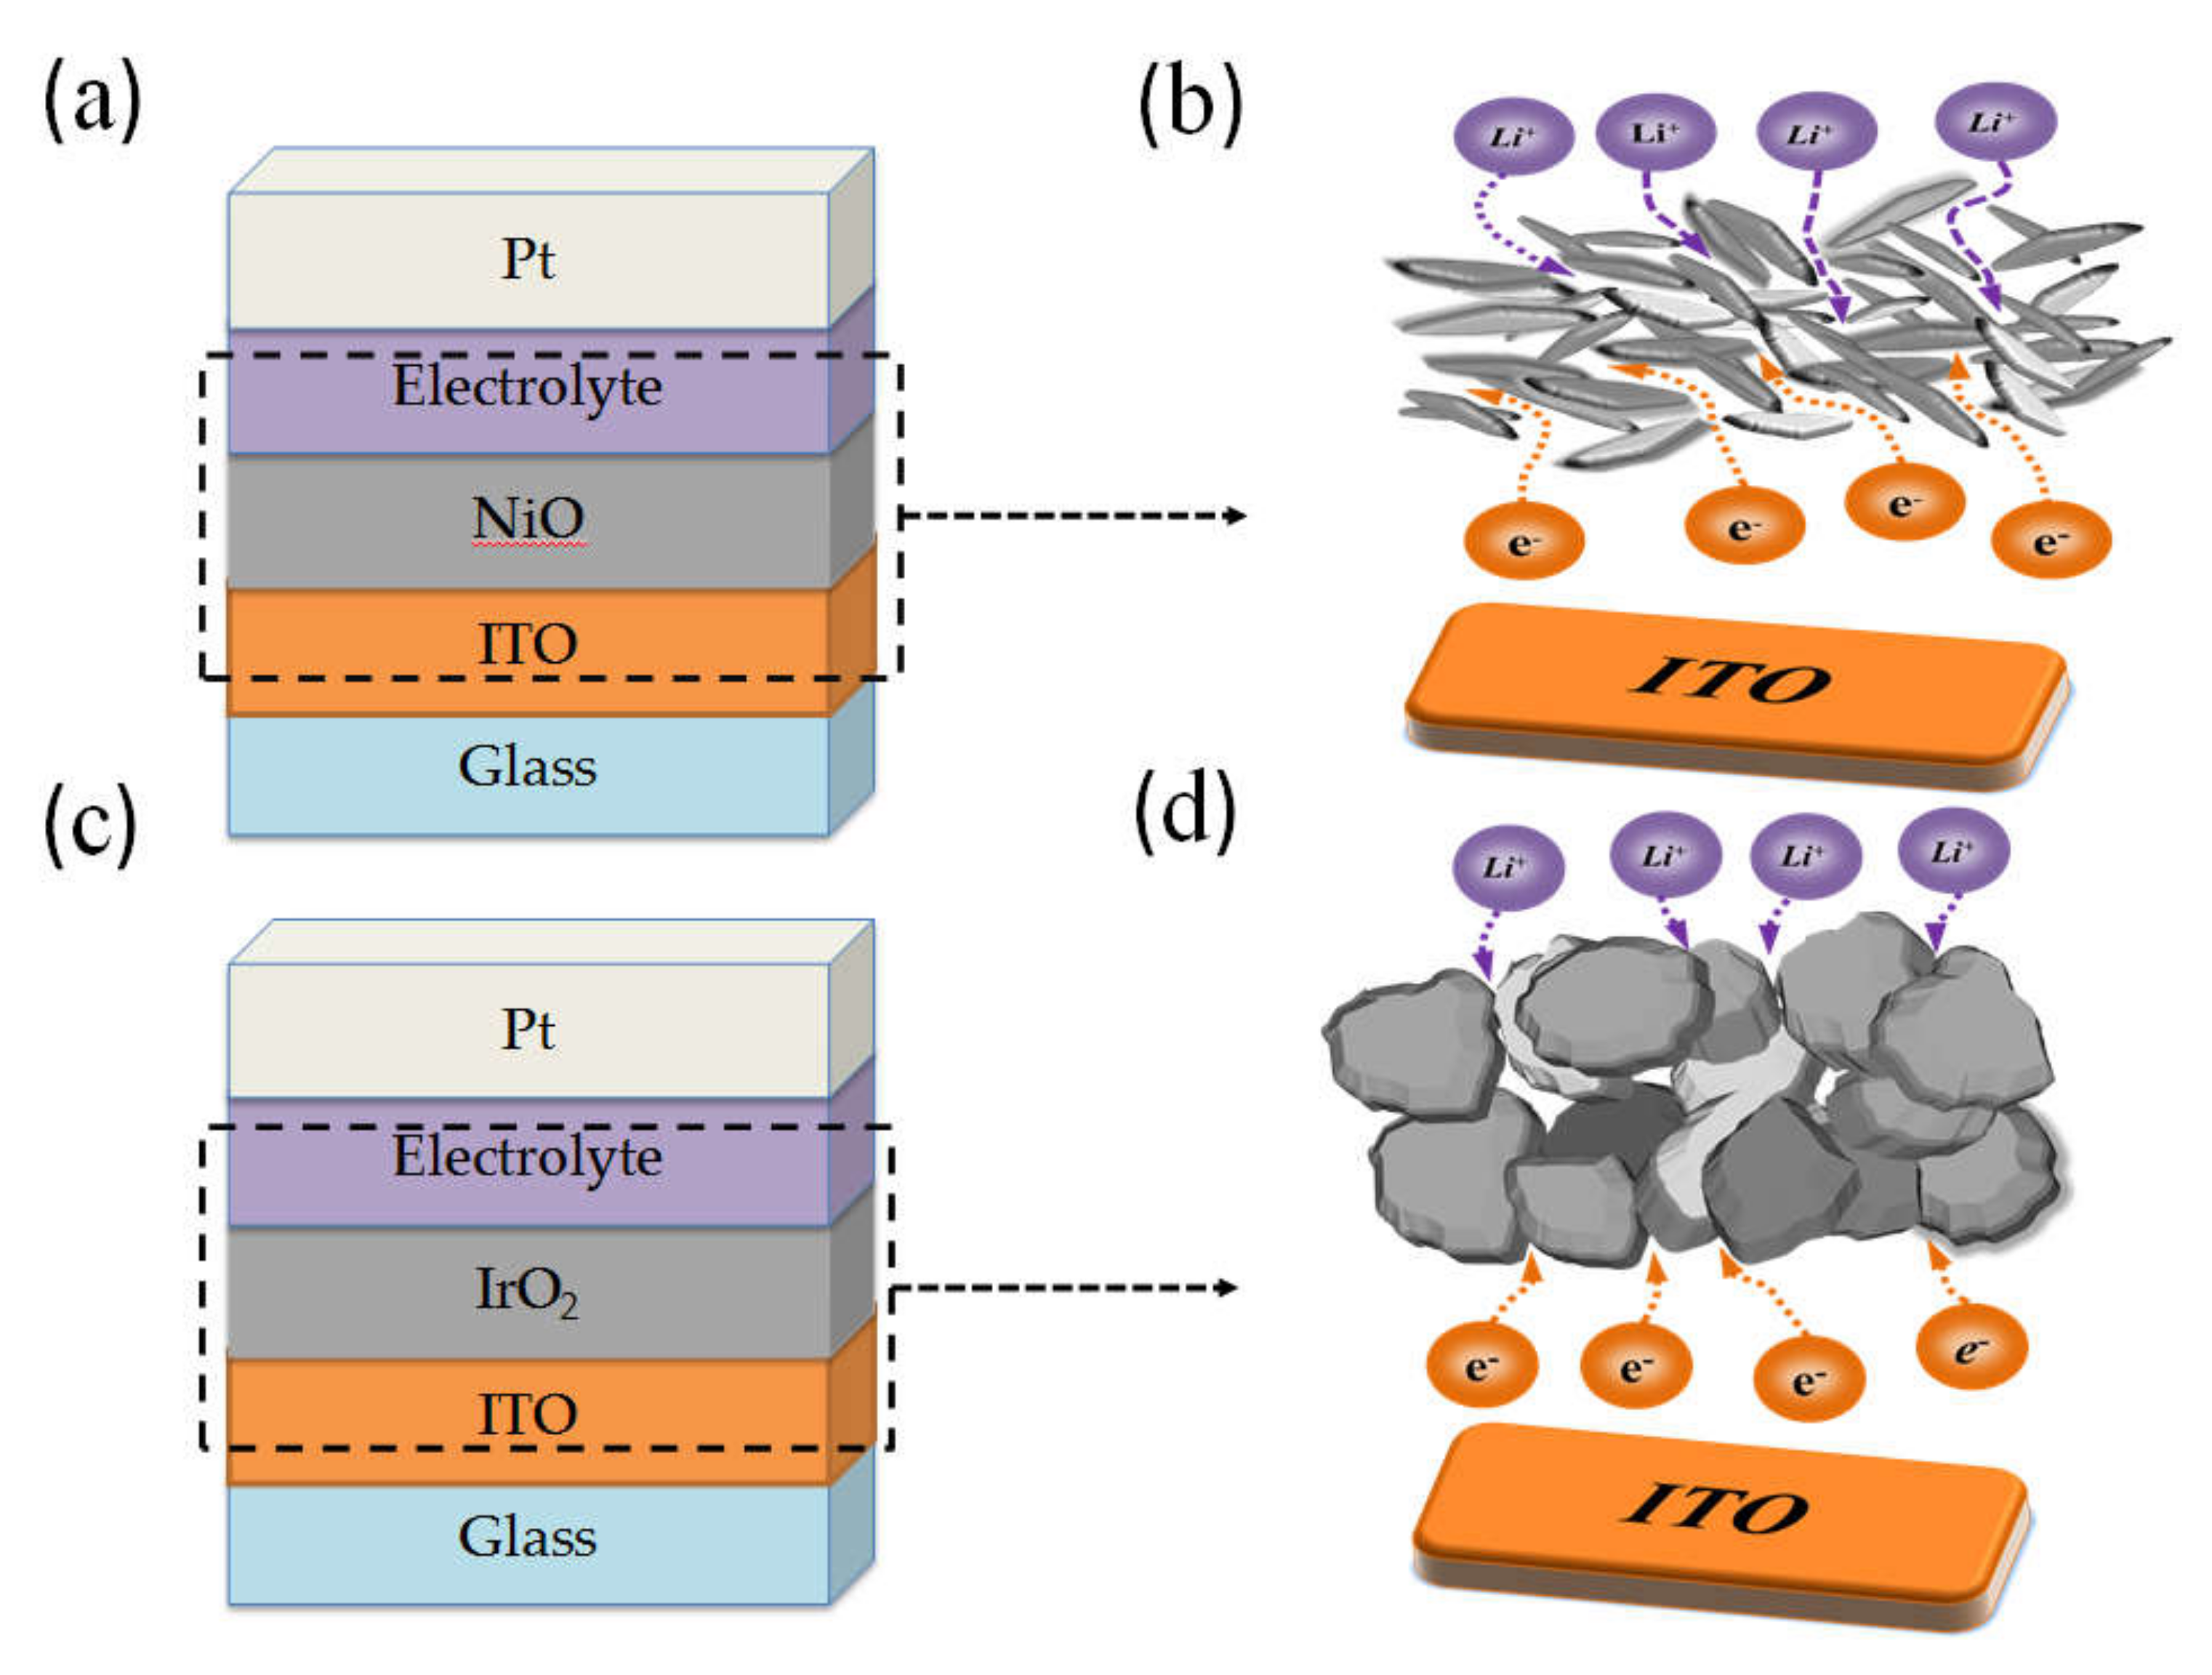
3.1. IrO2/ITO and NiO/ITO Films: Ionic Diffusion

In this work, we utilized the cyclic voltammetry (CV) method and the Randles–Servick equation to calculate the ionic diffusion coefficients [34,35]:
Jp = 2.69 × 10⁵ n3/2 C0D1/2 ν1/2,
where Jp is the peak current density in unit area (working area equals to 3.5 × 4 cm2), including the Jpa peak current density at oxidation and Jpc peak current density at reduction, n is the number of electrons (assumed to be 1), C0 (0.5 mol/L) is the concentration of the active ions in the electrolyte solution (in mol·cm−3), D is the diffusion coefficient of Li ions, and v is the potential scan rate (mV/s). We elucidated the electrochemical and energy storage properties of the IrO2/ITO/glass or NiO/ITO/glass by constructing threeelectrode cells, which contained a working electrode (IrO2 film on ITO/glass or NiO film on ITO/glass), a counter-electrode (Pt mesh), and a reference electrode (Ag/AgCl) in a 0.5 M LiClO4/perchlorate (LiClO4/PC) solution. The electrode comparison of CV curves on IrO2/ITO and NiO/ITO films with various Ar/O2 gas-flow ratios (1/2, 1/2.5, and 1/3) was proceeded at the 25th cycle based on a linear potential sweep ranging between −0.5 V and 2.0 V. The CV curves at the 25th cycle are shown in Figure 2 [33,34]. Furthermore, the diffusion of Li+ ions in the electrodes was determined by calculating the diffusion coefficients (D). The Jpa, Jpc, and the diffusion coefficient (D) values are summarized in Table 3. In Figure 2, CV curves demonstrated the enclosed area of IrO2 films were bigger than the NiO at all Ar/O2 gas ratios; moreover, the higher Ar/O2 gas ratios led to the larger enclosed area of the two material electrode films. Note that the device showed a significant capacitive behavior and indicated the participation of more ions in the electrochemical redox process. According to Table 3 and Figure 3, sample 3 (IrO2 with an Ar/O2 ratio of 1/3) presented the highest ion diffusion coefficients (D) of 1.09 × 10⁻¹⁰ cm2/s (oxidation)/1.10 × 10−10 cm2/s (reduction) in the IrO2 film, and sample 6 (NiO with Ar/O2 ratio is 1/3) presented the highest ion diffusion coefficients (D) of 1.93 × 10⁻¹¹ cm2/s (oxidation)/3.12 × 10−11 cm2/s (reduction) in the NiO film. The higher diffusion coefficients represented a larger contact area and greater porosity, resulting in faster ion insertion/extraction, which was good for the transportation of Li ions.

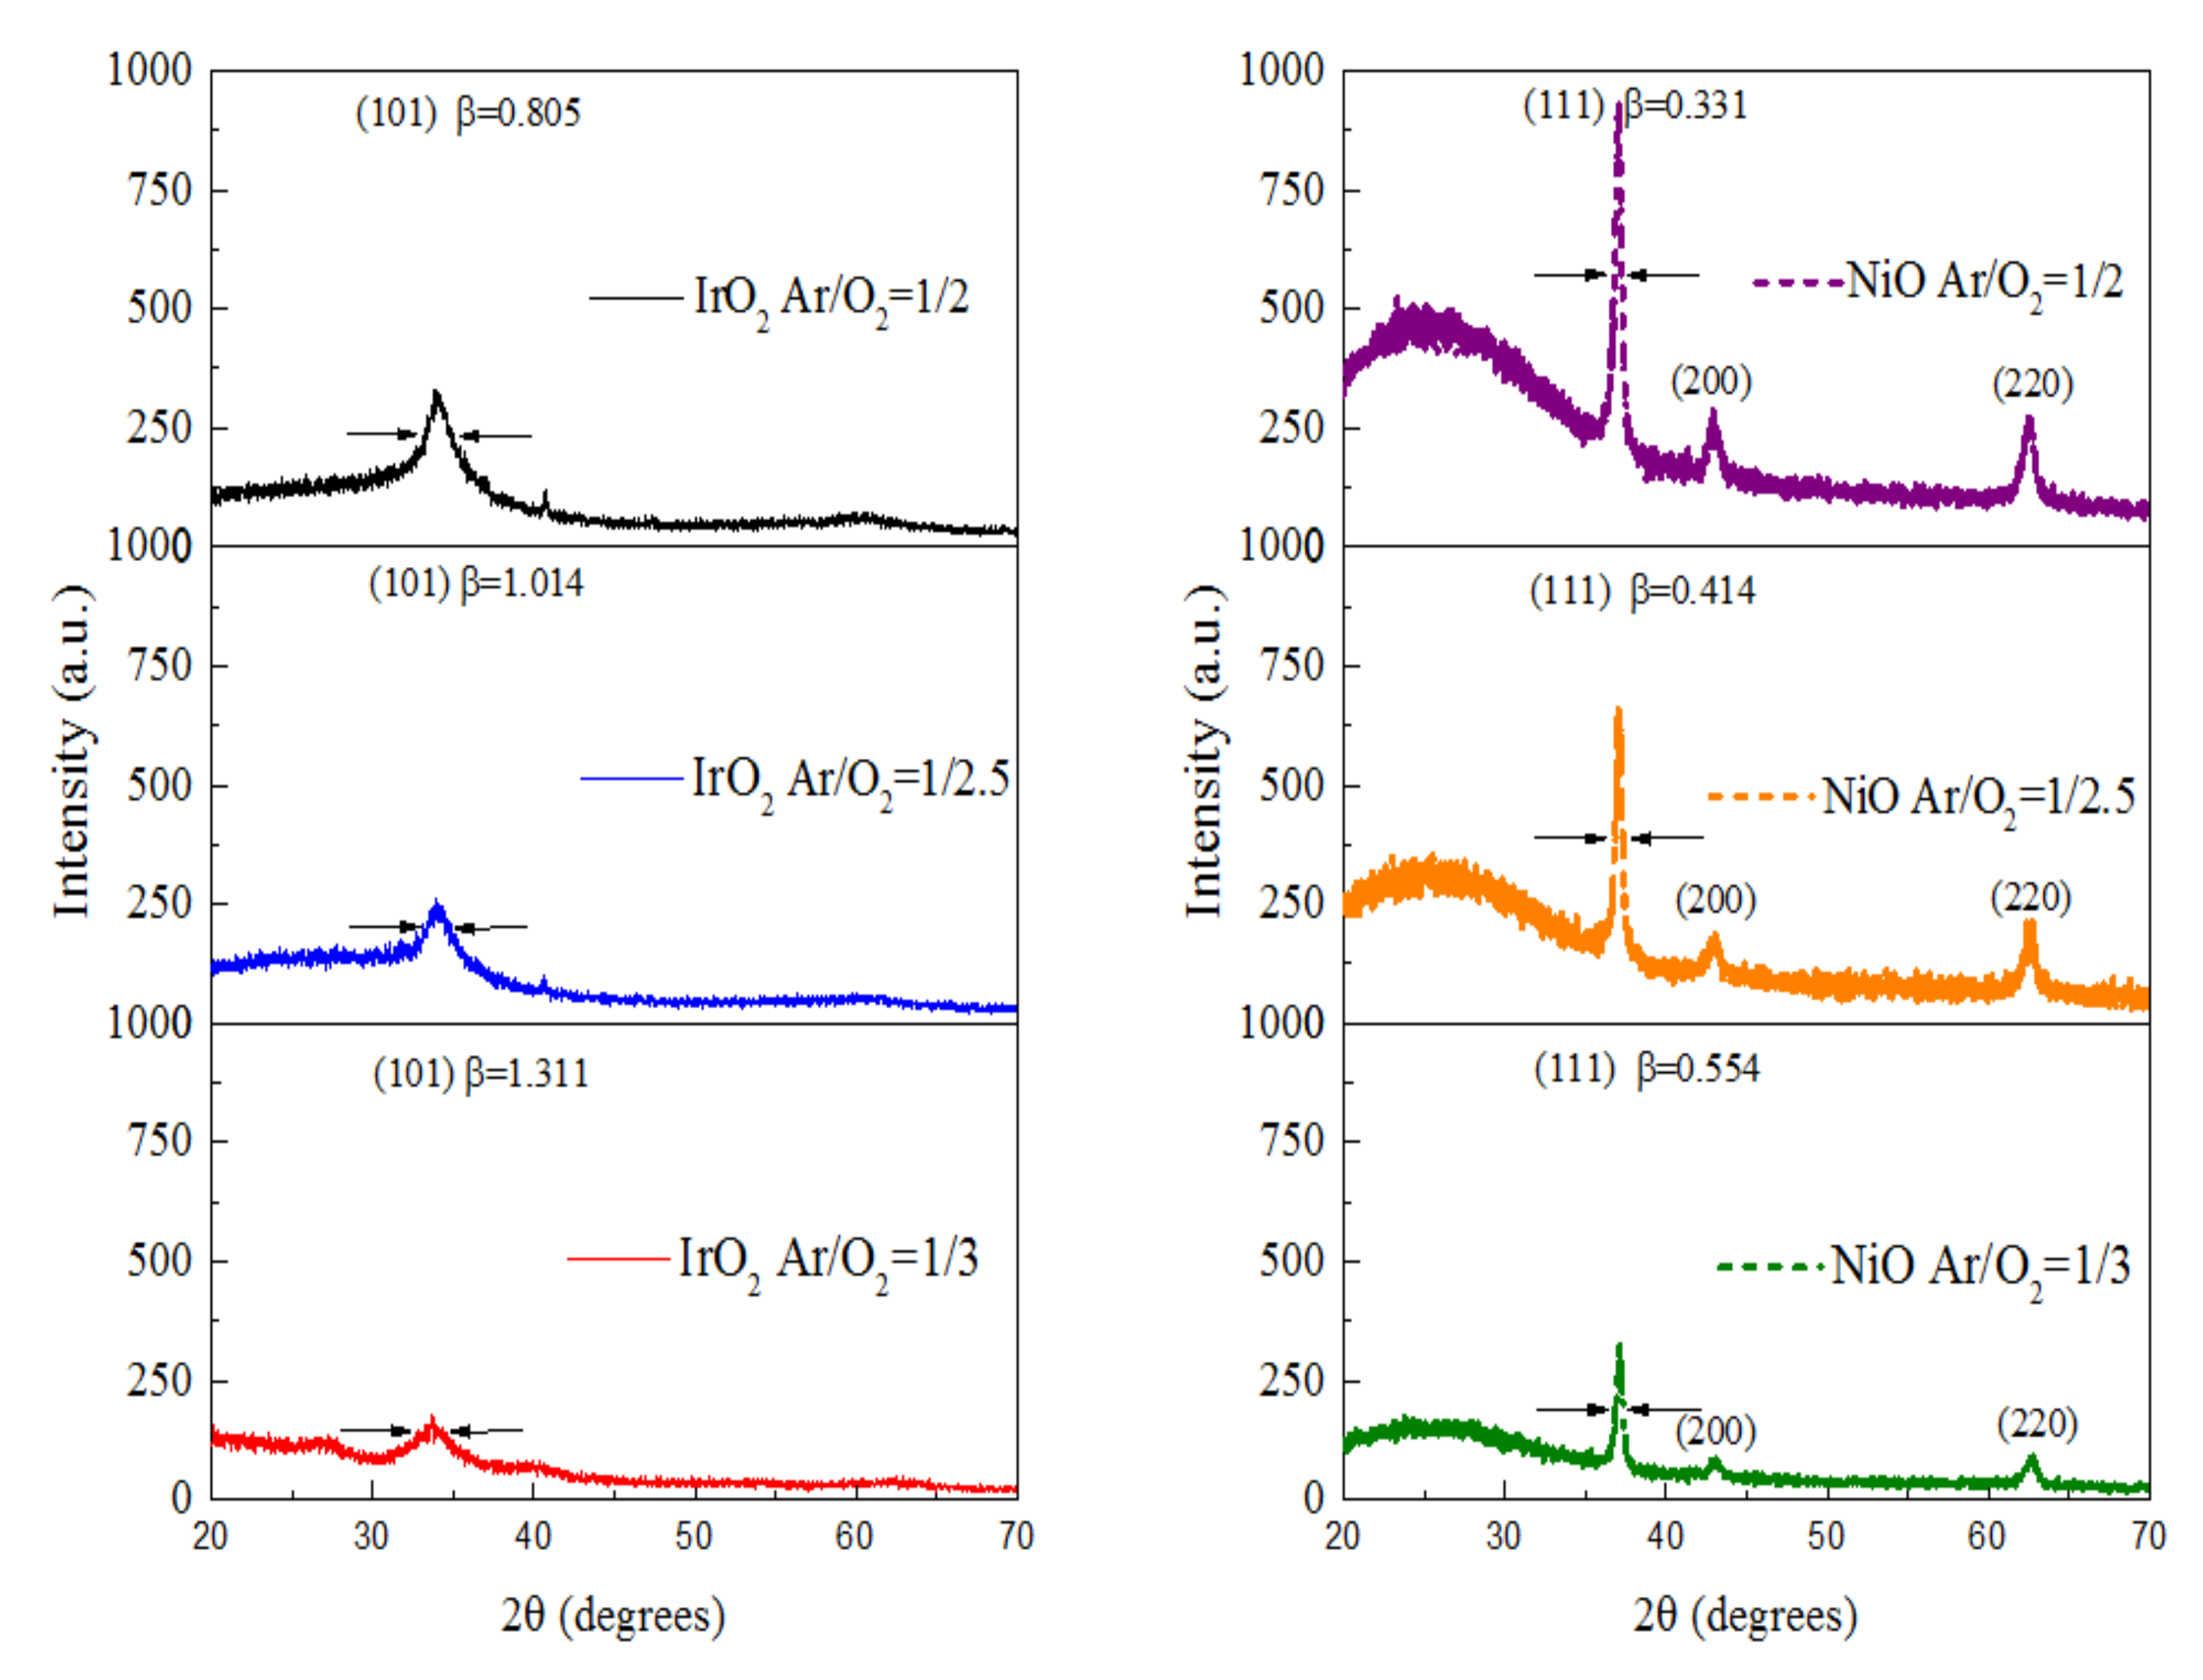
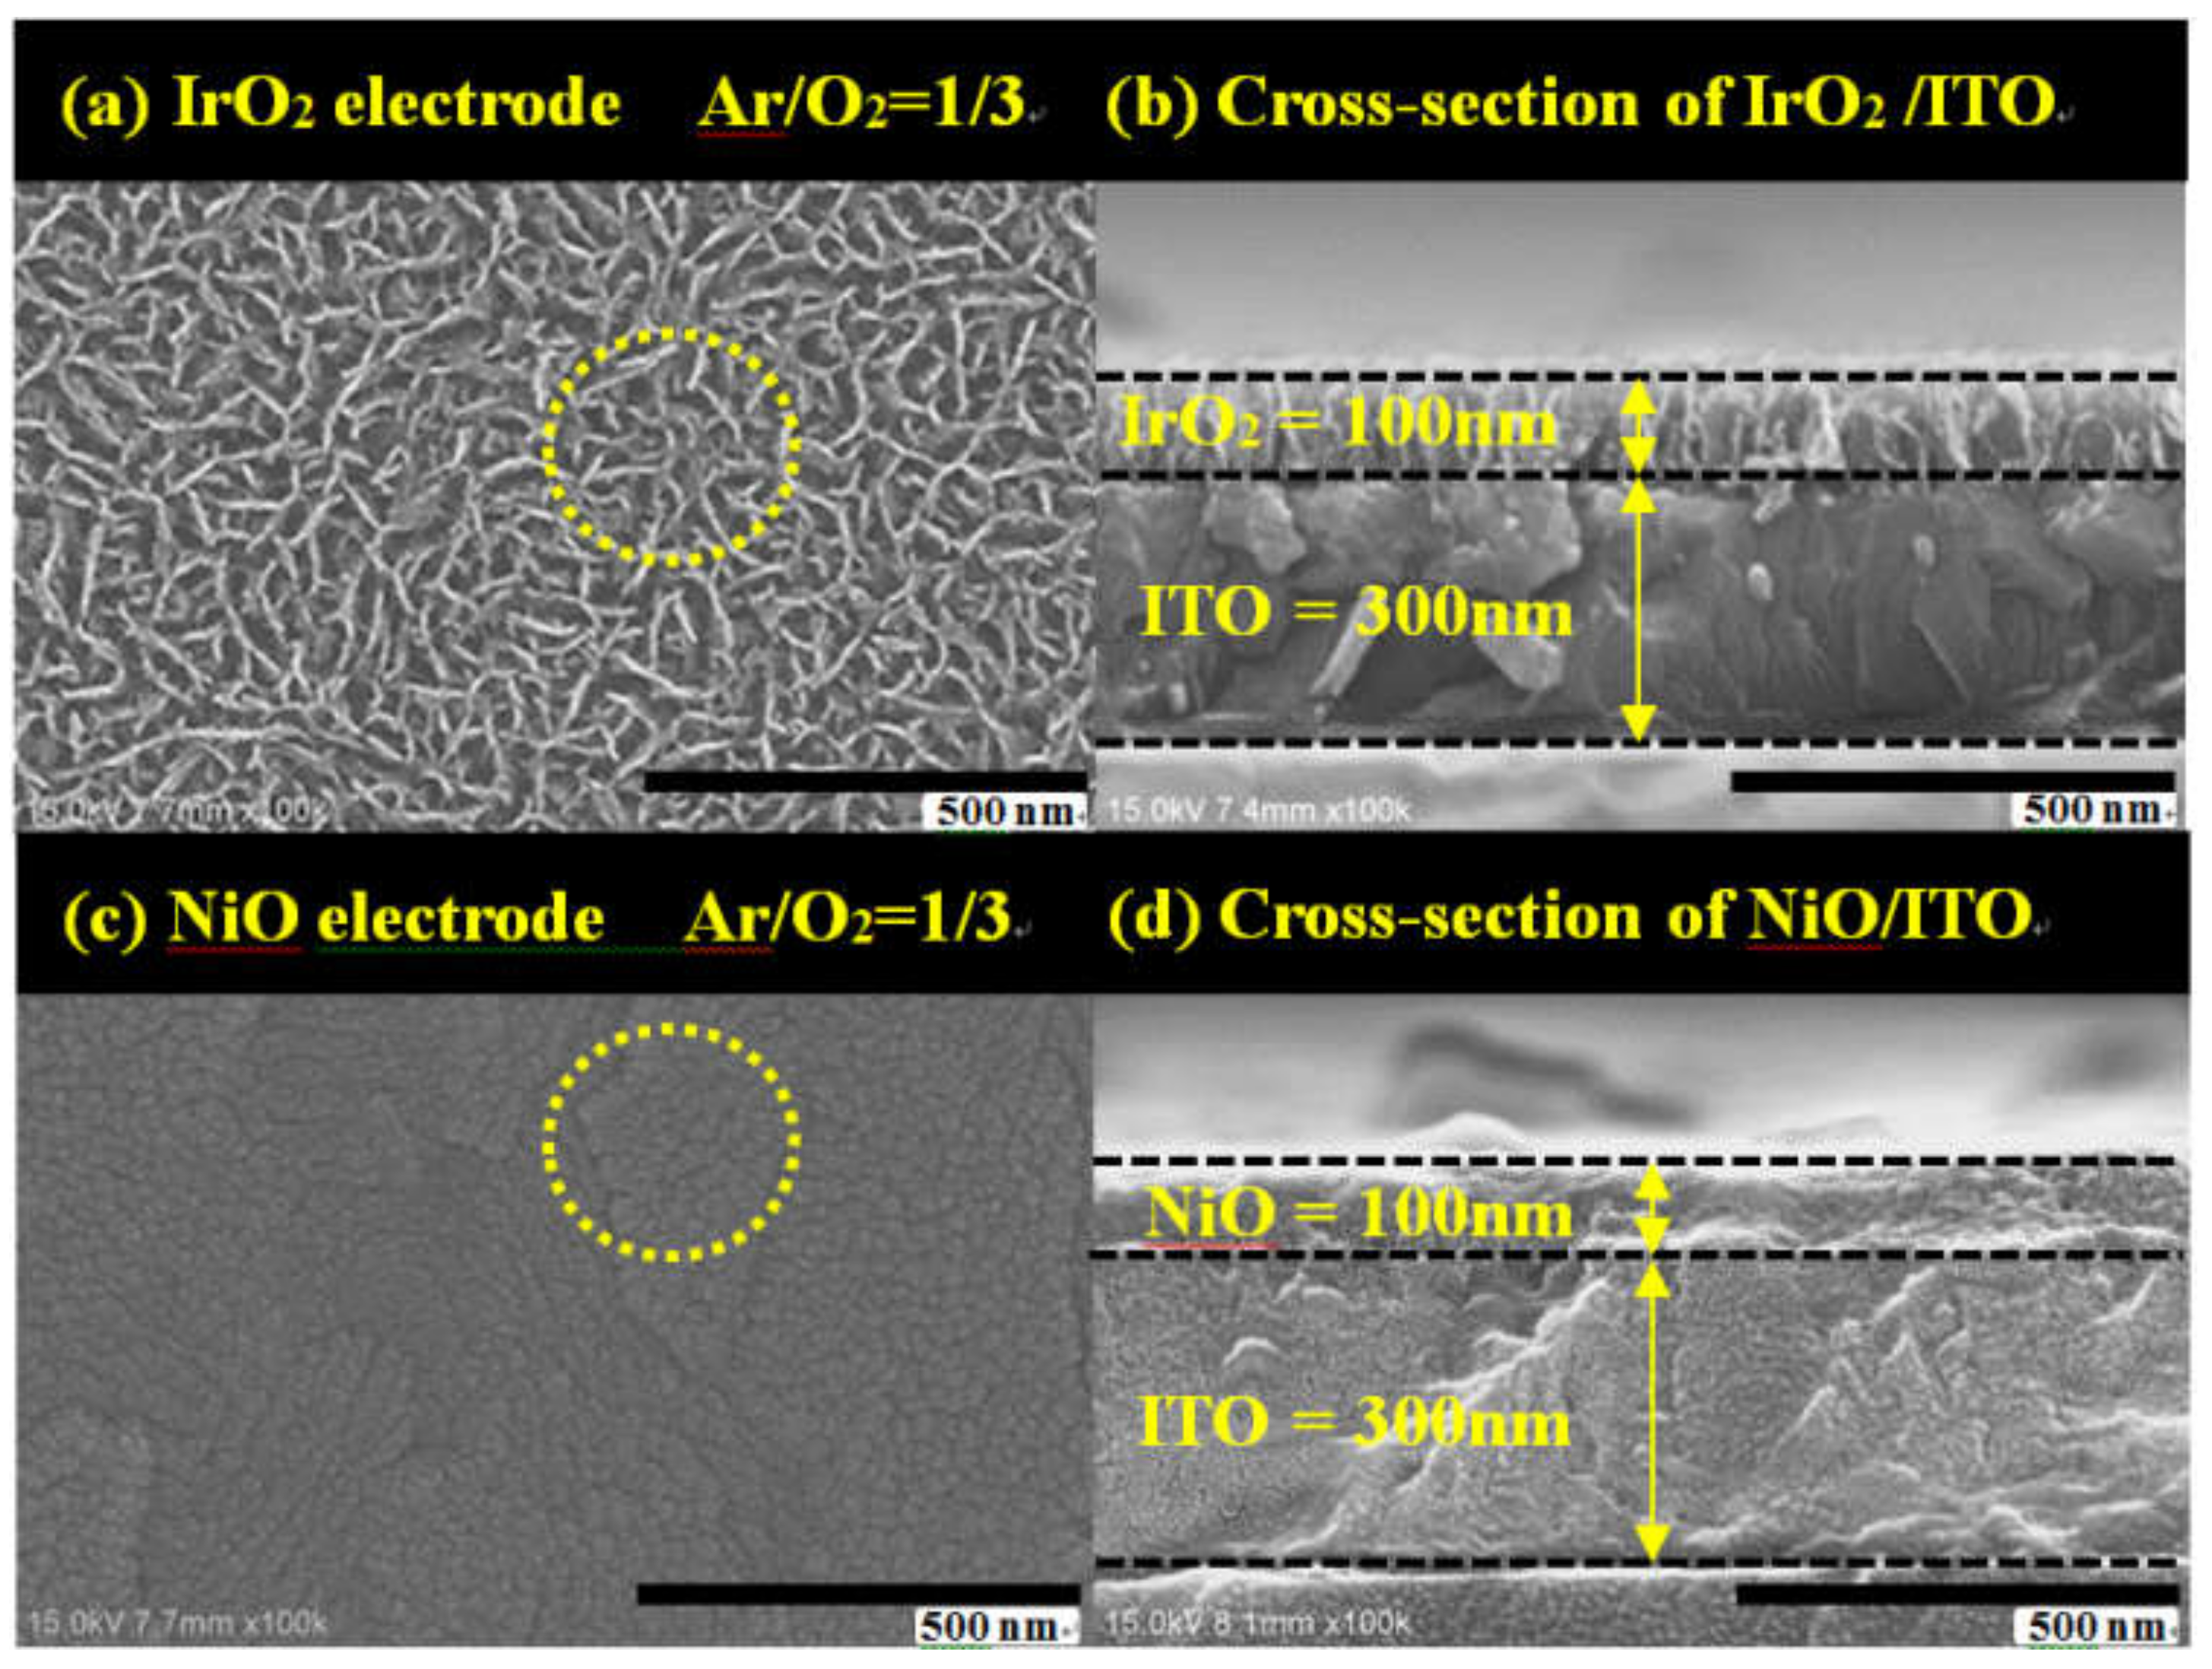
3.2. Material Structure and Surface Morphology Analysis

To evaluate the crystal material structure and the possible phase change during the deposition process of both the IrO2 and the NiO electrode films with various Ar/O2 mixing ratios, the XRD diffraction patterns are shown in Figure 4; they were used to distinguish the crystalline nature and calculate the particle grain size. We acquired these structures and phase compositions by means of a comparison of the Joint Committee on Powder Diffraction Standard (JCDPS). After the subtraction of the diffraction peaks, the IrO2 electrode (JCPDS card no. 15-0870) main peak was located at a 2θ angle of 34° which could be indexed as the preferential plane of (101); the NiO electrode (JCPDS card no. 47-1049) peaks located at 2θ~37°, 43° and 63° were indexed as the preferential planes of (111), (200), and (220), respectively. The (111) preferential planes were different from the preferred (200) and (220) growth [36,37]. In Figure 4, at various angles for the two types of electrodes, we observed that the NiO electrode samples were more crystalline than the IrO2 electrode ones and that the intensity of diffraction decreased with an increase in the Ar/O2 mixing ratio.
However, the highly crystalline structure of the material is less favorable for the insertion/extraction of Li ions because to the compact atom structure. Moreover, the facets (101) and (111) had more noticeable crystallinity of the IrO2 and NiO electrodes. The average grain size (d) for (101) of the IrO2 electrode and (111) of the NiO samples was calculated using Scherrer’s equation [36]:
D = K λ/β cosθ
where d is the average grain size, is the dimensionless shape factor, λ is the X-ray wavelength, β is the full width at half maximum (FWHM) of the X-ray diffraction peak in line broadening in radians, θ is the diffraction angle. The measured average grain sizes are presented in Table 4.
The average grain size decreased with an increase in the Ar/O2 mixing ratio of the two electrode samples. In contrast to the grain size, IrO2 electrode got the smaller size than NiO as the larger FWHM in Table 4. This study is to analyze surface morphology and optical and electrochromic properties f metal-oxide films based on various Ar/O2 gas-flow ratios [13,14,32]. In Figure 2, we found that with increase in oxygen flow rate the current density starts decreasing during CV analysis under same voltage applied condition. The reason for this may be attributed to decrease in the number of incident CAP gas ions on the NiO or IrO2 with increase in oxygen flow rate. Herein, we observed that IrO2 (sample #3) had smaller grain size of 6.35 nm at the Ar/O2 mixing ratio of 1/3 than NiO (sample #6) did (15.15 nm). The IrO2 electrode with the smallest grain size of 6.35 nm demonstrated the highest diffusion coefficient, as the Li ions transferred in a less hindered film than the NiO electrode. The smaller grain size was desirable in Table 4 as it offered more grain boundaries, which increased the diffusion coefficient. The CV diagram and the diffusion coefficient (D) were related to the grain size, and the behavior of the electrodes was in good agreement with that in the case of a relatively small grain size [36]. The decreasing grain size was associated with the increasing enclosed area of the corresponding CV. The enclosed area was as follows: Ar/O2 gas-flow ratios (1/2, 1/2.5, and 1/3): (1) IrO2 at 1/2 (7.14 mC/cm2), IrO2 at 1/2.5 (9.03 mC/cm2), IrO2 at 1/3 (11.05 mC/cm2), and (2) NiO at 1/2 (3.24 mC/cm2), NiO at 1/2.5 (5.13 mC/cm2), NiO at 1/3 (6.09 mC/cm2).
Furthermore, Figure 5a,c show that correlate SEM surface morphology images IrO2 and NiO electrodes with 1/3 ratio of Ar/O2 at thickness 100 nm; Figure 5b,d show the cross-sectional SEM; the electrodes specimen was prepared on coated ITO 300 nm/glass. Therefore, the grain size and surface morphology should be regarded as essential factors in a study on the fabrication of ECDs. Our results of IrO2 films leaded to greatly diffusion coefficient could be attributed a porous structure that it revels surface morphology of grains which is like filamentary and interconnect. In Figure 6a,c show electrode device, Figure 6b,d are the grains skeleton indicated areas where adopted in Figure 6a,c dotted line. Tthe schematics explain the Li ion path through different grain types in the IrO2 and NiO surface morphology of an electrochromic film. This could be attributed to the grain types of filamentary and interconnected shape with a larger inner-pore structure on the IrO2 electrode, which rendered a larger contact area and greater porosity, resulting in the Li ions having sufficient time and space to insert into/extract from the interface. In addition, the grain types provided higher diffusion coefficients.

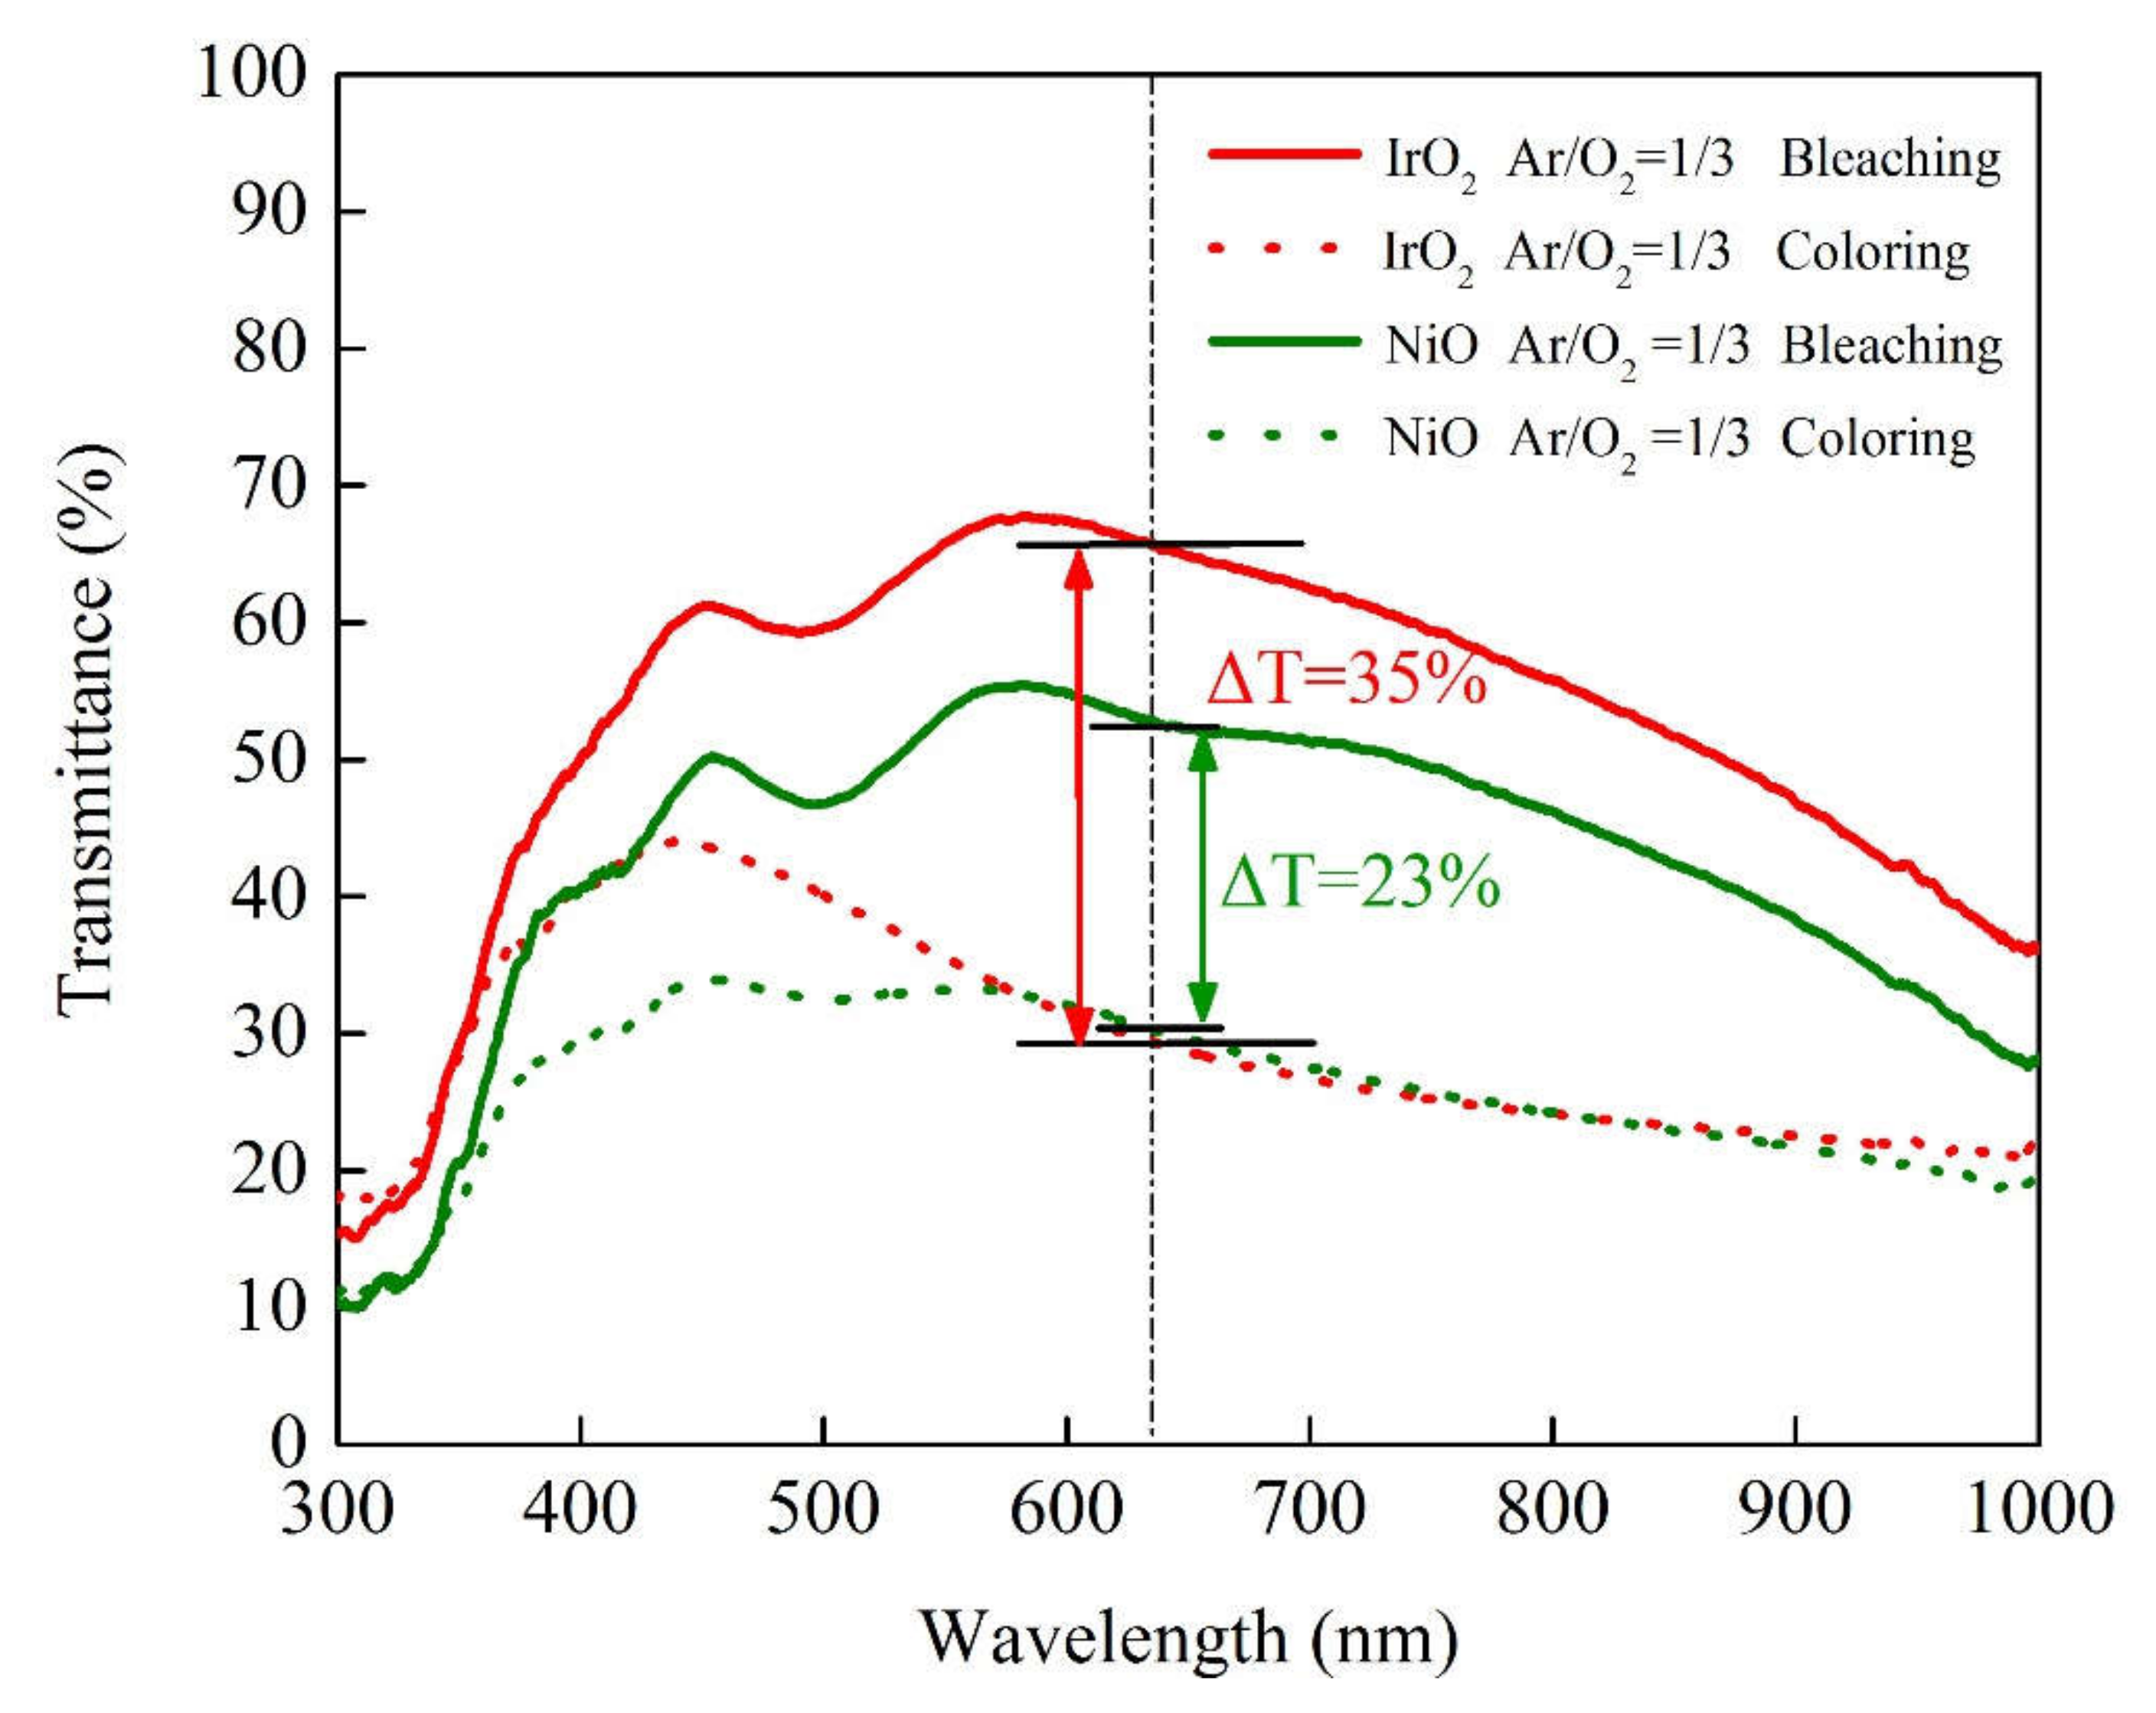
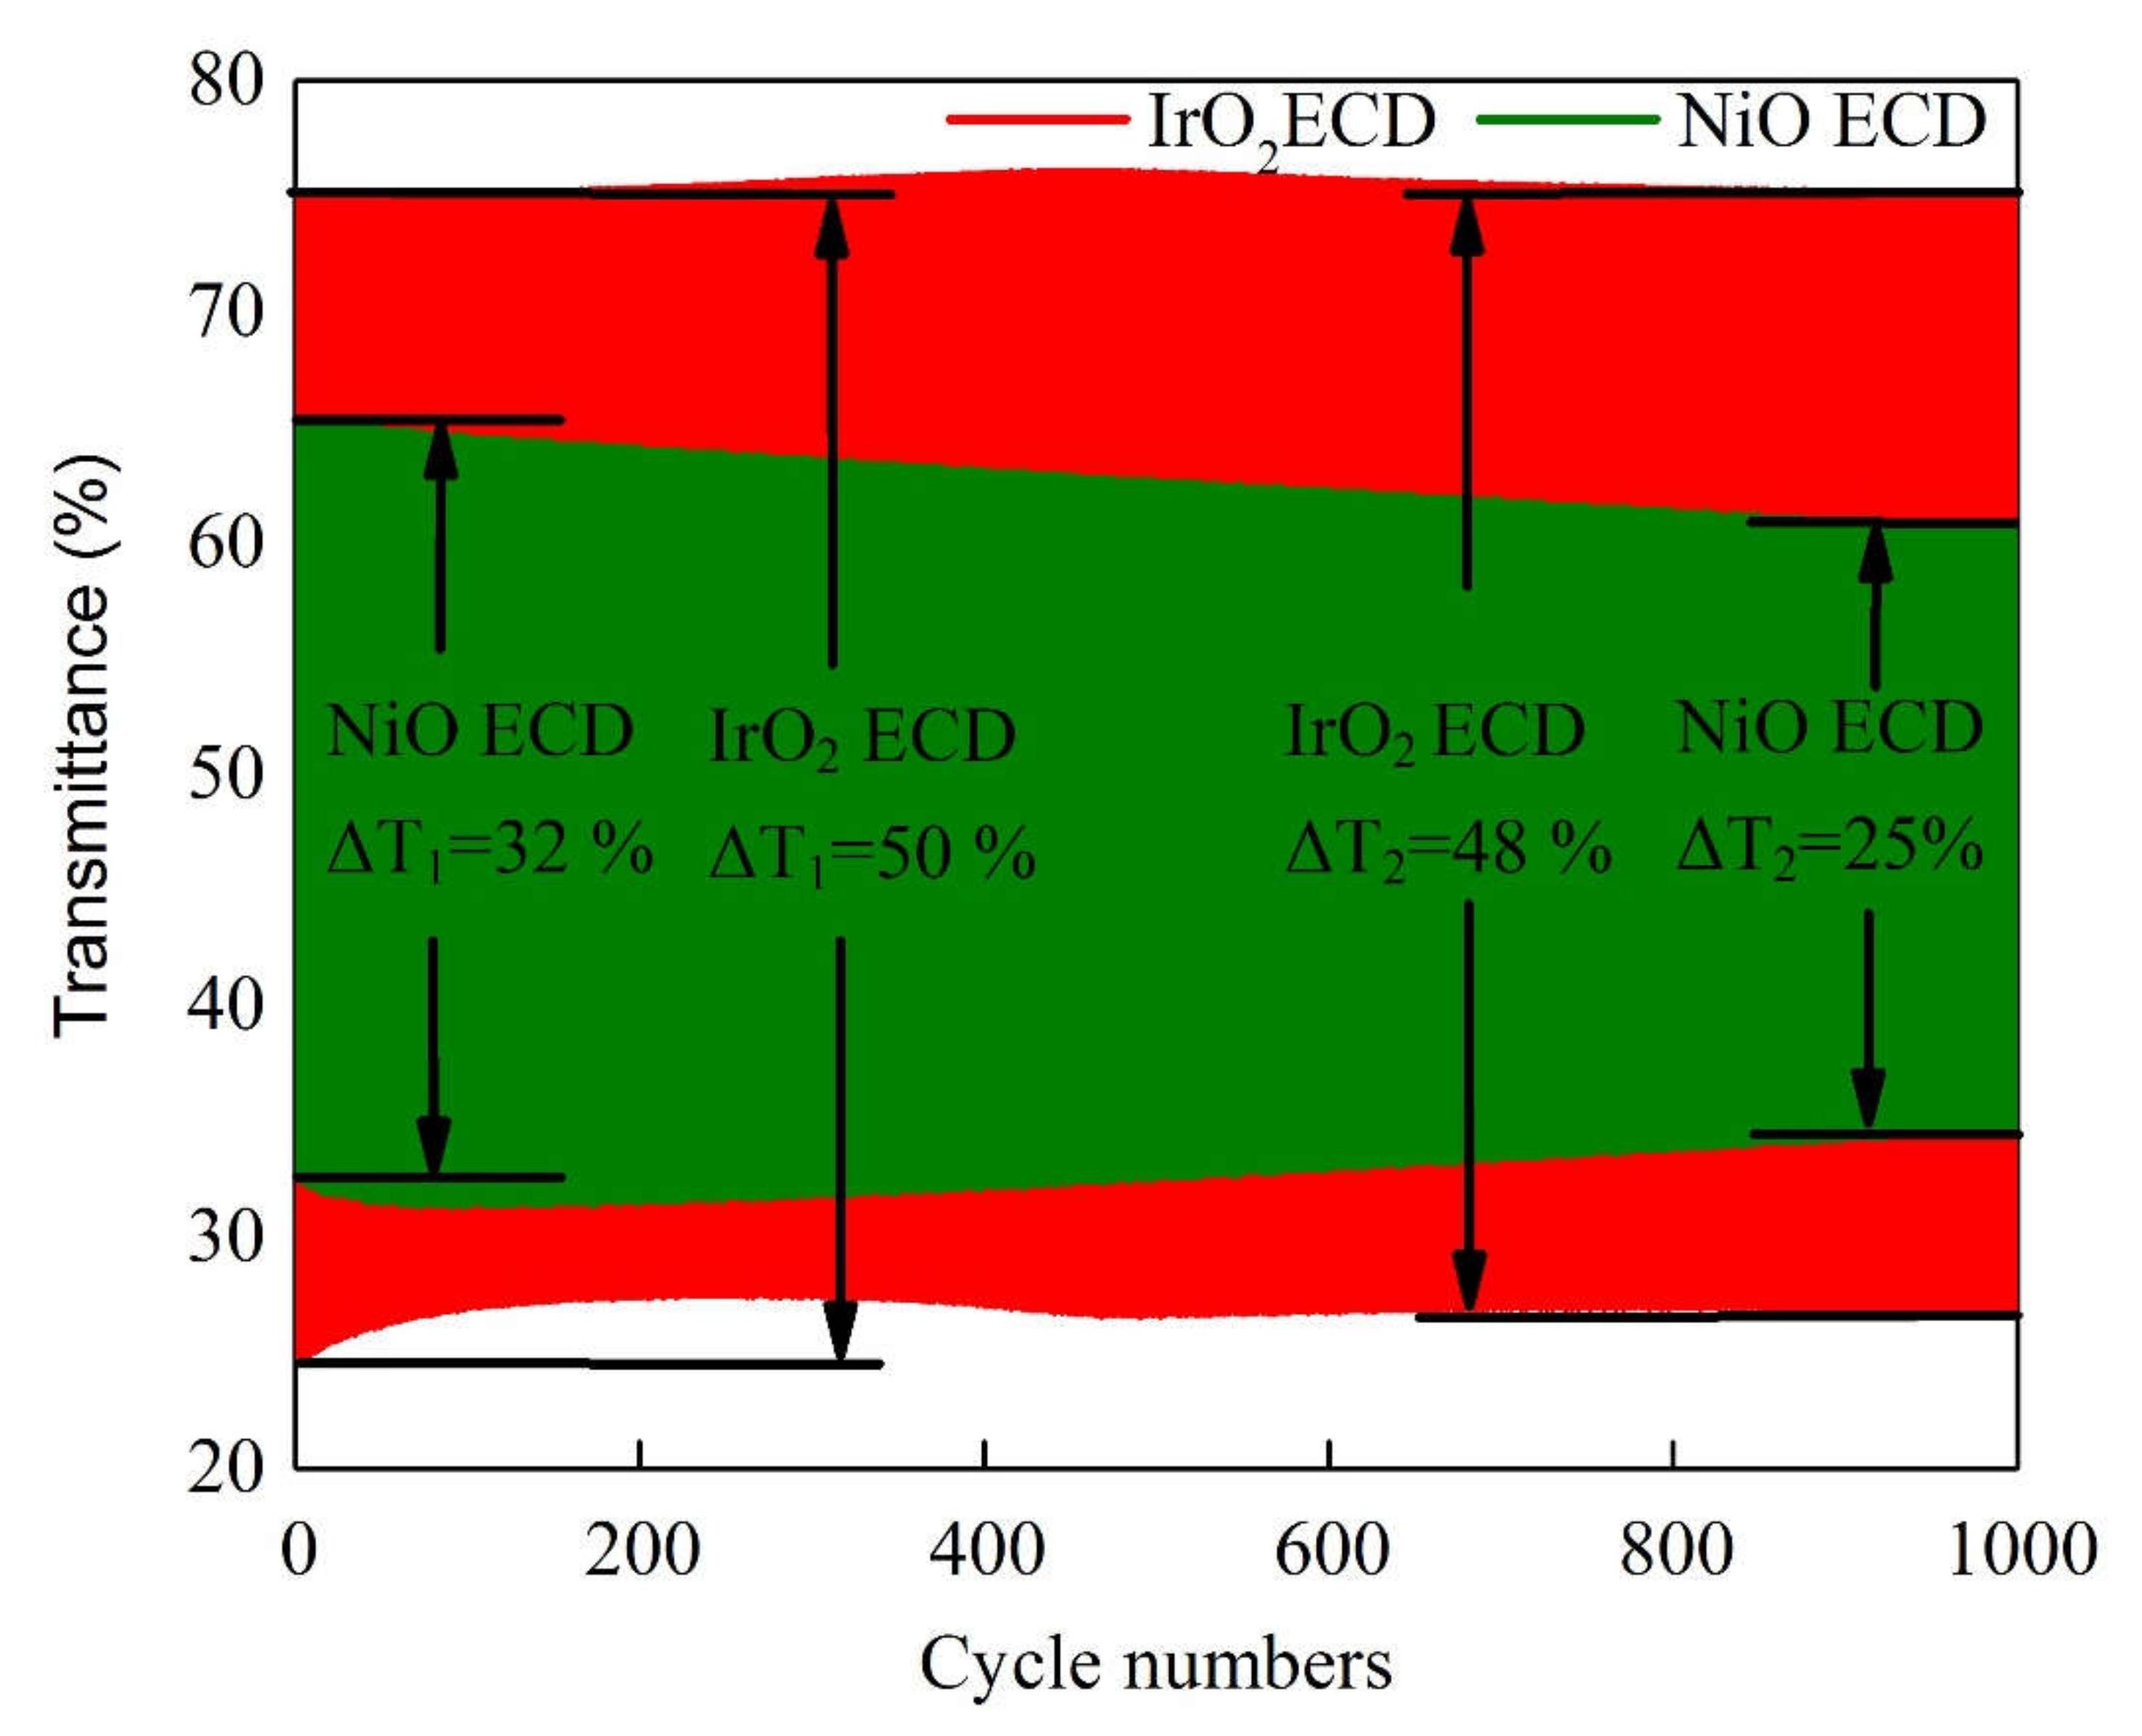
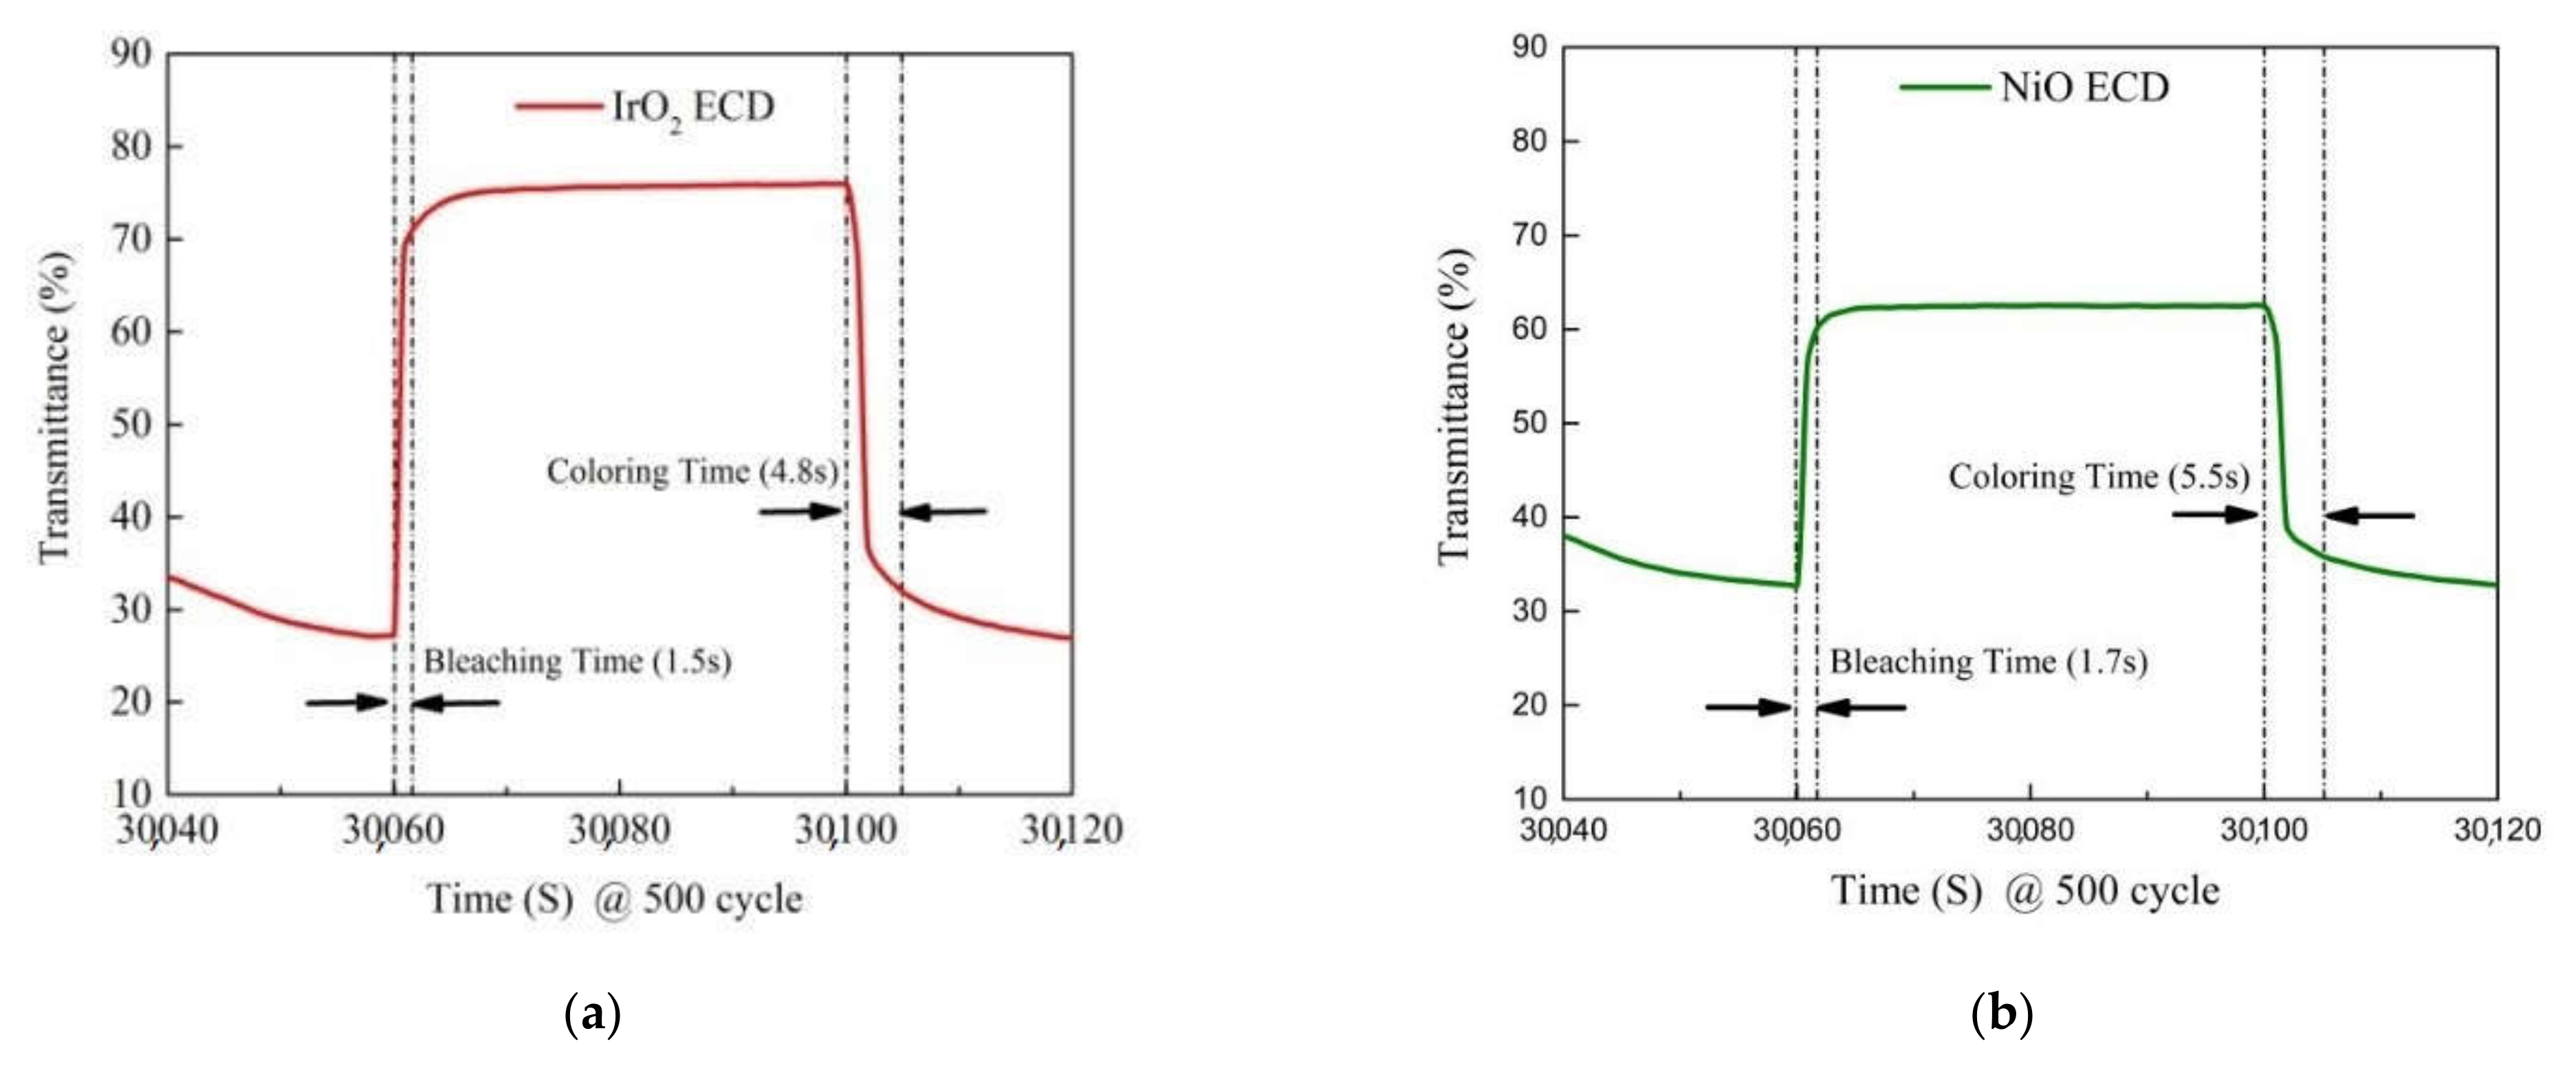
3.3. Optical Transmittance and Cycle Durability Analysis

The optical transmittance measurement of IrO2/ITO/glass and NiO/ITO/glass is helpful to understand the transmittance optical modulation (∆T = Tbleached − Tcolored) at a fixed wavelength of 633 nm, along with the switching response time and durability of the electrochromic devices (ECD). In Figure 7, we first elucidate the electrochemical properties of the IrO2/ITO/glass and NiO/ITO/glass by constructing three-electrode cells, which consisted of a working electrode (IrO2 film on ITO/glass and NiO film on ITO/glass), a counter-electrode (Pt mesh) and a reference electrode (Ag/AgCl) in a 0.5-M LiClO4/perchlorate (LiClO4/PC) solution. In Figure 7, the optical transmittance spectra of IrO2/ITO/glass and NiO/ITO/glass were carried with from 1.5 to −0.3 V versus AgCl/Ag with an Ar/O2 ratio of 1/3 at 633 nm. In our results, IrO2/ITO/glass had a higher optical transmittance modulation, ∆T = 35% (from Tbleaching (65%) to Tcoloring (30%)), than the NiO electrode, ∆T = 23% (from Tbleaching (53%) to Tcoloring (30%)). Note that the modulation of the optical transmittance of the 100-nm-thick IrO2 film with an Ar/O2 ratio of 1/3 was higher than that of the other samples, as indicated by the larger enveloped area in the CV curve in Figure 2 and Figure 7 show that the coloration and bleaching state of ECDs, as analyzed during a continuous potential from −2 V (coloration potential, Vc) to 2 V (bleaching potential, Vb), were measured by the CA curves and the in-situ optical response of transmittance at 633 nm. The coloration and bleaching of the switching times and speed were very important factors for the ECD system; it is defined as the time required for a 90% change in the full transmittance modulation [8]. Figure 8 presents the electrochromic performance of optical transmittance modulation at 633 nm after 1000 cycles. It demonstrated that IrO2-ECD (glass/ITO/WO3/liquid electrolyte/IrO2/ITO/glass) ∆T1 = 50% (from Tbleaching (75%) to Tcoloring (25%)) was higher than that of NiO-ECD (ITO/NiO/liquid electrolyte/WO3/ITO) ∆T2 = 32%. In the 1000-cycle durability analysis, the optical transmittance indicated that IrO2-ECD demonstrated excellent durability, which remained as 96% of the original state value, as the IrO2 electrode had more transferred Li ions and outperformed NiO-ECD (78% of the original value). Figure 9a,b show the switching response time, including the bleaching and the coloration time in the middle of a long durability cycle test (@500 cycles). Figure 9a shows that in the case of IrO2-ECD, the switching response time was 1.5 s from the colored state to the bleached state and 4.8 s from the bleached state to the colored one. The IrO2-ECD in Figure 9a was faster than the NiO-ECD in Figure 9b, which took 1.7 s to switch from the coloration state to the bleaching state and 5.5 s to switch from the bleaching state to the coloration one. The faster switching speed was associated with the higher diffusion coefficients and the filamentary shape of the interface in the case of the IrO2 electrode, which facilitated the transfer of the Li ions into/out of interface electrodes and the electrolyte. The IrO2-ECD showed higher optical transmittance modulation than NiO-ECD which was useful for promoting electrochromic application for cycle durability test. A comparison of the electrochromic and optical properties obtained in this study which was reported in previous research and presented in Table 5.

4. Conclusions

In conclusion, we presented a comparison of electrodes on IrO2/ITO and NiO/ITO films with various Ar/O2 gas-flow ratios in ECDs and investigated the electrochemical, structural, and optical properties. We developed electrochromic electrodes by using the CAP technique as an alternative method to fabricate ECDs with a high deposition rate and at a low cost. We observed that the IrO2 electrode films with a filamentary surface morphology and an Ar/O2 ratio of 1/3 (sample 3) demonstrated the highest ion diffusion coefficients (D) of 1.09 × 10⁻¹⁰ cm2/s (oxidation)/1.10 × 10−10 cm2/s (reduction) and the smallest grain size of 6.35 nm. The electrochromic performance of IrO2-ECD (glass/ITO/WO3/liquid electrolyte/IrO2/ITO/glass) for the optical transmittance modulation, ∆T = 50% (from Tbleaching (75%) to Tcoloring (25%)) at 633 nm, was higher than that of NiO-ECD, ∆T = 32%, after 1000 cycles. The IrO2-ECD demonstrated excellent durability after 1000 cycles, which remained at 96% of the original value, and outperformed NiO-ECD (78% of the original value). We found that IrO2-ECD had a switching response time of 1.5 s from the coloration state to the bleaching state and 4.8 s from the bleaching state to the coloration one. The fast response time of the IrO2 electrode facilitated the transfer of Li ions into/out of the interface electrodes and the electrolyte, owing to the higher diffusion coefficients and the filamentary shape of the interface. Therefore, we concluded that IrO2 -ECD is promising for electrochromic applications to a cycle durability test, as an alternative to NiO-ECD.

Author Contributions

The study was written by T.-F.K. and reviewed by P.-W.C.; the data collection and analysis for WO3 film/NiO film were conducted by T.-F.K.; C.-T.C. and S.-C.H. The manuscripts were prepared by K.-M.L. and H.-T.Y. All authors have read and agreed to the published version of the manuscript.

Funding

This research was funded by Division of Physics, Institute of Nuclear Energy Research (INER), Taiwan and National Taiwan University under the Excellence Improvement Program for Doctoral Students (grant number 108-2926-I-002-002-MY4), sponsored by Ministry of Science and Technology, Taiwan.

Institutional Review Board Statement

Not applicable.

Informed Consent Statement

Not applicable.

Data Availability Statement

The data presented in this study are available on request from the corresponding author. The data are not publicly available due to privacy.

Acknowledgments

This article was subsidized for English editing by National Taiwan University under the Excellence Improvement Program for Doctoral Students (grant number 108-2926-I-002-002-MY4), sponsored by Ministry of Science and Technology, Taiwan. PWC would also like to acknowledge support from Division of Physics, Institute of Nuclear Energy Research, Taiwan.

Conflicts of Interest

The authors declare no conflict of interest.

References

  1. Granqvist, C.G.; Arvizu, M.A.; Bayrak Pehlivan, I.; Qu, H.Y.; Wen, R.T.; Niklasson, G.A. Electrochromic materials and devices for energy efficiency and human comfort in buildings:A critical review. Electrochim. Acta 2018, 259, 1170–1182. [Google Scholar] [CrossRef] [Green Version]
  2. Tie, S.F.; Tan, C.W. A review of energy sources and energy management system in electric vehicles. Renew. Sustain. Energy Rev. 2013, 20, 82–102. [Google Scholar] [CrossRef]
  3. Sami, O.; Cedric, G.G.; Christophe, D.; Cedric, D.; Raphael, S. All inorganic thin film electrochromic device using LiPON as the ion conductor. Sol. Energy Mater. Sol. Cells 2016, 145, 2–7. [Google Scholar]
  4. Cai, G.; Peter, D.; Cui, M.; Chen, J.; Wang, X.; Eh, A.L.S.; Magdassi, S.; Lee, P.S. Inkjetprinted all solid-state electrochromic devices based on NiO/WO3 nanoparticle complementary electrodes. Nanoscale 2016, 8, 348–357. [Google Scholar] [CrossRef]
  5. Qu, H.; Zhang, H.; Li, N.; Tong, Z.; Wang, J.; Zhao, J.; Li, Y. A rapid-response electrochromic device with significantly enhanced electrochromic performance. RSC Adv. 2015, 5, 803–806. [Google Scholar] [CrossRef]
  6. Cai, G.F.; Tu, J.P.; Zhou, D.; Wang, X.L.; Gu, C.D. Growth of vertically aligned hierarchical WO3 nano-architecture arrays on transparent conducting substrates with outstandingelectrochromic performance. Sol. Energy Mater. Sol. Cells 2014, 124, 103–110. [Google Scholar] [CrossRef]
  7. Li, H.; McRae, L.; Elezzabi, A.Y. Solution-processed interfacial PEDOT: PSS assemblyinto porous tungsten molybdenum oxide nanocomposite films for electrochromic applications. ACS Appl. Mater. Interfaces 2018, 10, 10520–10527. [Google Scholar] [CrossRef]
  8. Chen, P.W.; Chang, C.T.; Ko, T.F.; Hsu, S.C.; Li, K.D.; Wu, J.Y. Fast response ofcomplementary electrochromic device based on WO3/NiO electrodes. Sci. Rep. 2020, 10, 8430–8442. [Google Scholar] [CrossRef] [PubMed]
  9. Chang, C.C.; Chi, P.W.; Chandan, P.; Lin, C.K. Electrochemistry and Rapid ElectrochromismControl of MoO3/V2O5 Hybrid Nano bilayers. Nat. Mater. 2019, 12, 2475. [Google Scholar] [CrossRef] [Green Version]
  10. Wang, W.Q.; Wang, X.L.; Xia, X.H.; Yao, Z.J.; Zhong, Y.; Tu, J.P. Enhanced electrochromic and energy storage performance in mesoporous WO3 film and its application in abifunctional smart window. Nanoscale 2018, 10, 8162–8169. [Google Scholar] [CrossRef] [PubMed]
  11. Zhan, C.; Yu, G.; Lu, Y.; Wang, L.; Wujcik, E.; Wei, S. Conductive polymer nanocomposites: A critical review of modern advanced devices. J. Mater. Chem. C 2017, 5, 1569. [Google Scholar] [CrossRef]
  12. Heydari Gharahcheshmeh, M.; Gleason, K. Device Fabrication Based on oxidative Chemical Vapor Deposition (OCVD) Synthesis of Conducting Polymers and Related Conjugated Organic Materials. Adv. Mater. Interfaces 2019, 6, 1801564. [Google Scholar] [CrossRef] [Green Version]
  13. Kim, H.; Choi, D.; Kim, K.; Chu, W.; Chun, D.M.; Lee, C.S. Effect of particle size andamorphous phase on the electrochromic properties of kinetically deposited WO3 films. Sol. Energy Mater. Sol. Cells 2018, 177, 44–50. [Google Scholar] [CrossRef]
  14. Shien, L.; Zheng, J.; Xu, C. Enhanced electrochromic switches and tunable green fluorescencebased on terbium ion doped WO3 films. Nanoscale 2019, 11, 23049–23057. [Google Scholar] [CrossRef]
  15. Yue, Y.; Li, H.; Li, K.; Wang, J.; Wang, H.; Zhang, Q.; Li, Y.; Chen, P. High-performancecomplementary electrochromic device based on WO3·0.33H2O/PEDOT and prussian blueelectrodes. J. Phys. Chem. Solids 2017, 110, 284–289. [Google Scholar] [CrossRef]
  16. Deniz, D.; Frankel, D.J.; Lab, R.J. Nanostructured tungsten and tungsten trioxide filmsprepared by glancing angle deposition. Thin Solid Films 2010, 518, 4095–4099. [Google Scholar] [CrossRef]
  17. Usha, K.S.; Sivakumar, R.; Sanjeeviraja, C.; Sathe, V.; Ganesan, V.; Wang, T.Y. Improvedelectrochromic performance of a radio frequency magnetron sputtered NiO thin film with high optical switching speed. Thin Solid Films 2016, 6, 79668–79680. [Google Scholar]
  18. Wnag, L.; Yuan, L.; Wu, X.; Hou, C.; Feng, S. Electrochromic response of pulsed laser deposition prepared WO3–TiO2 composite film. RSC Adv. 2014, 4, 47670–47676. [Google Scholar] [CrossRef]
  19. Liao, C.C. Lithium-driven electrochromic properties of electrodeposited nickel hydroxide electrodes. Sol. Energy Mater. Sol. Cells 2012, 99, 26–30. [Google Scholar] [CrossRef]
  20. Lin, Y.S.; Wu, S.S.; Tsai, T.H. Electrochromic properties of novel atmospheric pressureplasma jet-synthesized-organotungsten oxide films for flexible electrochromic devices. Sol. Energy Mater. Sol. Cells 2010, 94, 2283–2291. [Google Scholar] [CrossRef]
  21. White, C.M.; Gillaspie, D.T.; Whitney, E.; Lee, S.H.; Dillon, A.C. Flexible electrochromicdevices based on crystalline WO3 nanostructures produced with hot-wire chemical vapor deposition. Thin Solid Films 2009, 517, 3596–3599. [Google Scholar] [CrossRef]
  22. Li, W.; Zhang, X.; Chen, X.; Zhao, Y.; Wang, L.; Liu, D.; Li, X.; Chen, M.; Zhao, J.; Li, Y. Preparation and performance of fast-response ITO/Li-NiO/Li-WO3/ITO all-solid-stateelectrochromic devices by evaporation method. Mater. Mater. Lett. 2020, 265, 127464–127466. [Google Scholar] [CrossRef]
  23. Li, S.; Yao, Z.; Zhou, J.; Zhang, R.; Shen, H. Fabrication and characterization of WO3 thinfilms on silicon surface by thermal evaporation. Mater. Mater. 2017, 195, 213–216. [Google Scholar]
  24. Kim, S.K.; Seok, H.J.; Kim, D.H.; Choi, D.H.; Nam, S.J.; Kim, S.C.; Kim, H.K. Comparisonof NiOx thin film deposited by spin-coating or thermal evaporation for application as a holetransport layer of perovskite solar cells. RSC Adv. 2014, 4, 47670–47676. [Google Scholar]
  25. Zhi, M.; Huang, W.; Shi, Q.; Wang, M.; Wnag, Q. Sol–gel fabrication of WO3/RGO nanocomposite film with enhanced electrochromic performance. RSC Adv. 2016, 6, 67488–67495. [Google Scholar] [CrossRef]
  26. Liu, J.; Zhang, G.; Guo, K.; Guo, D.; Shi, M. Effect of the Ammonium Tungsten Precursor Solutionwith the Modification of Glycerol on Wide Band Gap WO3 Thin Film and Its Electrochromic Properties. Adv. Micromach. 2020, 11, 311. [Google Scholar] [CrossRef] [Green Version]
  27. Xie, Z.; Zhu, Y.G.; Xu, J.; Huang, H.; Chen, D.; Shen, G. Porous WO3 with enhancedphotocatalytic and selective gas sensing properties. Cryst. Eng. Commun. 2011, 13, 6393–6398. [Google Scholar] [CrossRef]
  28. Boelens, S.; Veltrop, H. Hard coatings of TiN, (TiHf) N and (TiNb) N deposited by randomand steered arc evaporation. Surf. Coat. Technol. 1987, 33, 63–71. [Google Scholar] [CrossRef]
  29. Wang, C.; Shi, Z.; Li, W.; Song, X.; Jia, S.; Wang, L. IEEE Transactions on Plasma Science. IEEE 2015, 43, 2267–2274. [Google Scholar]
  30. Thornton, J.A. Influence of apparatus geometry and deposition conditions on the structure and topography of thick sputtered coatings. J. Vac. Sci. Technol. 1974, 11, 666. [Google Scholar] [CrossRef]
  31. Anders, A.; Jüttner, B. Cathode mode transition in high-pressure discharge lamps at start-up Light. Res. Technol. 1990, 22, 111–115. [Google Scholar]
  32. Chen, P.W.; Chang, C.T.; Ali, M.M.; Wu, J.Y.; Li, Y.C.; Chen, M.H.; Jan, D.-J.; Yuan, C.T. Tantalum oxide flm deposited by vacuum cathodic arc plasma with improved electrochromic performance. Sol. Energy Mater. Sol. Cells 2018, 182, 188–195. [Google Scholar] [CrossRef]
  33. Lee, K.D. Indium-Zinc-Tin-Oxide flm prepared by DC reactive magnetron sputtering for electrochromic application. Materials 2018, 11, 2221. [Google Scholar]
  34. Liu, Q.; Chen, Q.; Zhang, Q.; Xiao, Y.; Zhong, X.; Dong, G.; Terryn, H.; Baert, K.; Reiners, F.; Diao, X. In situ electrochromic efficiency of a nickel oxide thin film: Origin of electrochemical process and electrochromic degradation. J. Mater. Chem. C 2018, 6, 646. [Google Scholar] [CrossRef]
  35. Pereira, S.; Goncalves, A.; Correia, N.; Pinto, J.; Pereira, L.; Martins, R.; Fortunato, E. Electrochromic behavior of NiO thin films deposited by e-beam evaporation at room temperature. Sol. Energy Mater. Sol. Cells 2014, 120, 109–115. [Google Scholar] [CrossRef]
  36. Cullity, B.D.; Stock, S.R. Elements of X-ray Diffraction, 3rd ed.; Prentice Hall: Upper Saddle River, NJ, USA, 2001. [Google Scholar]
  37. Zhang, J.; Tu, J.; Xia, X.; Qiao, Y.; Lu, Y. An all-solid-state electrochromic device based on NiO/WO3 complementary structure and solid hybrid polyelectrolyte. Sol. Energy Mater. Sol. Cells 2009, 93, 1840–1845. [Google Scholar] [CrossRef]
  38. Yang, L.; Ge, D.; Zhao, J.; Ding, Y.; Kong, X.; Li, Y. Improved electrochromic performance of ordered macroporous tungstenoxide films for IR electrochromic device. Sol. Energy Mater. Sol. Cells 2012, 100, 251–257. [Google Scholar] [CrossRef]
  39. Ma, D.; Li, T.; Xu, Z.; Wang, L.; Wang, J. Electrochromic devices based on tungsten oxide films with honeycomblike nanostructures and nanoribbons array. Sol. Energy Mater. Sol. Cells 2018, 177, 51–56. [Google Scholar] [CrossRef]
Figure 1. Complementary electrochromic device deposited system (a) indium tin oxide (ITO), (b) IrO2 electrode, and (c) WO3 electrode.
Materials 14 01591 g001
Figure 2. Comparison of 25th cycle CV curve of IrO2 (solid line) and NiO (dotted line) electrode films at a potential sweep rate of 100 mV/s.
Materials 14 01591 g002
Figure 3. The comparison of diffusion coefficients of IrO2 and NiO electrodes with various Ar/O2 mixing ratio.
Materials 14 01591 g003
Figure 4. X-ray diffraction of IrO2 and NiO electrodes at various Ar/O2 mixing ratio.
Materials 14 01591 g004
Figure 5. SEM images of surface morphology (a) IrO2 electrode with Ar/O2 = 1/3 (c) NiO electrode with Ar/O2 = 1/3; Cross-section morphology of (b) IrO2 electrode with thickness 100 nm (d) NiO electrode with a thickness of 100 nm.
Materials 14 01591 g005
Figure 6. The schematics of Li ions path through surface morphology with different grain type (a) IrO2 electrode device (b) IrO2 electrode (c) NiO electrode device (d) NiO electrode.
Materials 14 01591 g006
Figure 7. The optical transmittance spectra showing coloring and bleaching comparison states of the IrO2 and NiO electrodes with Ar/O2 = 1/3 in the range from 300 nm to 1000 nm.
Materials 14 01591 g007
Figure 8. The comparison durability of the electrochromic device (ECD) is evaluated by optical transmittance modulation at 633 nm during 1000 cycles.
Materials 14 01591 g008
Figure 9. (a) IrO2 ECD and (b) NiO ECD: Switch response time for one single bleaching and coloring states @ 500 cycle (30040→30120 s).
Materials 14 01591 g009
Table 1. Deposition parameters of IrO2 and NiO electrode films.
No.ElectrodeAr/O2
(Ar = 20 sccm)
W.P.
(Torr)
DC Power
(W)
Deposition
Temp
(°C)
Deposition
Time
(s)
Thickness
(nm)
Sample 1IrO21/21.2 × 10−3125010040100
Sample 2IrO21/2.51.7 × 10−3125010040100
Sample 3IrO21/31.9 × 10−3125010040100
Sample 4NiO1/21.2 × 10−31250100100100
Sample 5NiO1/2.51.7 × 10−31250100100100
Sample 6NiO1/31.9 × 10−31250100100100
Table 2. Deposition parameters of transparent ITO glass and WO3 electrode film.
TargetW.P.
(Torr)
Ar/O2 (sccm)DC
power
(W)
Deposition
Time
(min)
Deposition Rate
(nm/min)
Deposition
Temp
°C
Thickness
(nm)
ITO3 × 10−31/3
(Ar = 100)
500605200300
W Metal8 × 10−31/3
(Ar = 100)
15001513.350200
Table 3. Diffusion coefficients of IrO2 and NiO electrodes with various Ar/O2 mixing ratios.
No.ElectrodeAr/O2
(Ar = 20 sccm)
Anodic
Current
(jpa)
Cathodic Current (jpc)D for jpa
Oxidation
D for jpc
Reduction
Sample 1IrO21/22.82 × 10−42.83 × 10−44.40 × 10−114.42 × 10⁻¹¹
Sample 2IrO21/2.53.53 × 10−43.45 × 10−46.88 × 10−116.57 × 10⁻¹¹
Sample 3IrO21/34.44 × 10−44.47 × 10−41.09 × 10−101.10 × 10⁻¹⁰
Sample 4NiO1/28.70 × 10−51.49 × 10−44.18 × 10−121.22 × 10⁻¹¹
Sample 5NiO1/2.51.65 × 10−42.16 × 10−41.50 × 10−112.59 × 10⁻¹¹
Sample 6NiO1/31.87 × 10−42.38 × 10−41.93 × 10−113.12 × 10⁻¹¹
Table 4. Average grain size of IrO2 and NiO electrode.
No.ElectrodeAr/O2
(sccm)

(deg)
FWHM
(β)
Ave Grain Size (nm)
Sample 1IrO21/234.832°0.805°10.03
Sample 2IrO21/2.534.644°1.014°8.20
Sample 3IrO21/334.312°1.311°6.35
Sample 4NiO1/237.815°0.331°25.30
Sample 5NiO1/2.537.613°0.414°20.27
Sample 6NiO1/337.282°0.554°15.15
Table 5. Comparison of our results with the literature on various materials and methods [8,10,13,37,38,39].
Materials/DeviceMethod∆T
(%)
CE
(cm2/C)
Switching Time
(tc/tb)
Ref.
WO3/IrO2CAP50-4.8/1.5 sThis work
WO3/NiOCAP46903.1/4.6 s[8]
WO3/NiODC
Sputtering
558710/20 s[37]
WO3/PANIElectro polymerization37.498.49.9/13.6 s[38]
WO3/PANIDip-coating54.379.71.4/1.1 s[10]
WO3Spray---[13]
(NH4)0.33 WO3Hydrothermal60.960.95.7/4.2 s[39]
Publisher’s Note: MDPI stays neutral with regard to jurisdictional claims in published maps and institutional affiliations.

