
Elaboration and Characterization of Vitreous Fertilizers and Study of Their Impact on the Growth, Photosynthesis, and Yield of Wheat (Triticum durum L.)

 ,
,  , and
, and
Abstract
1. Introduction
2. Materials and Methods
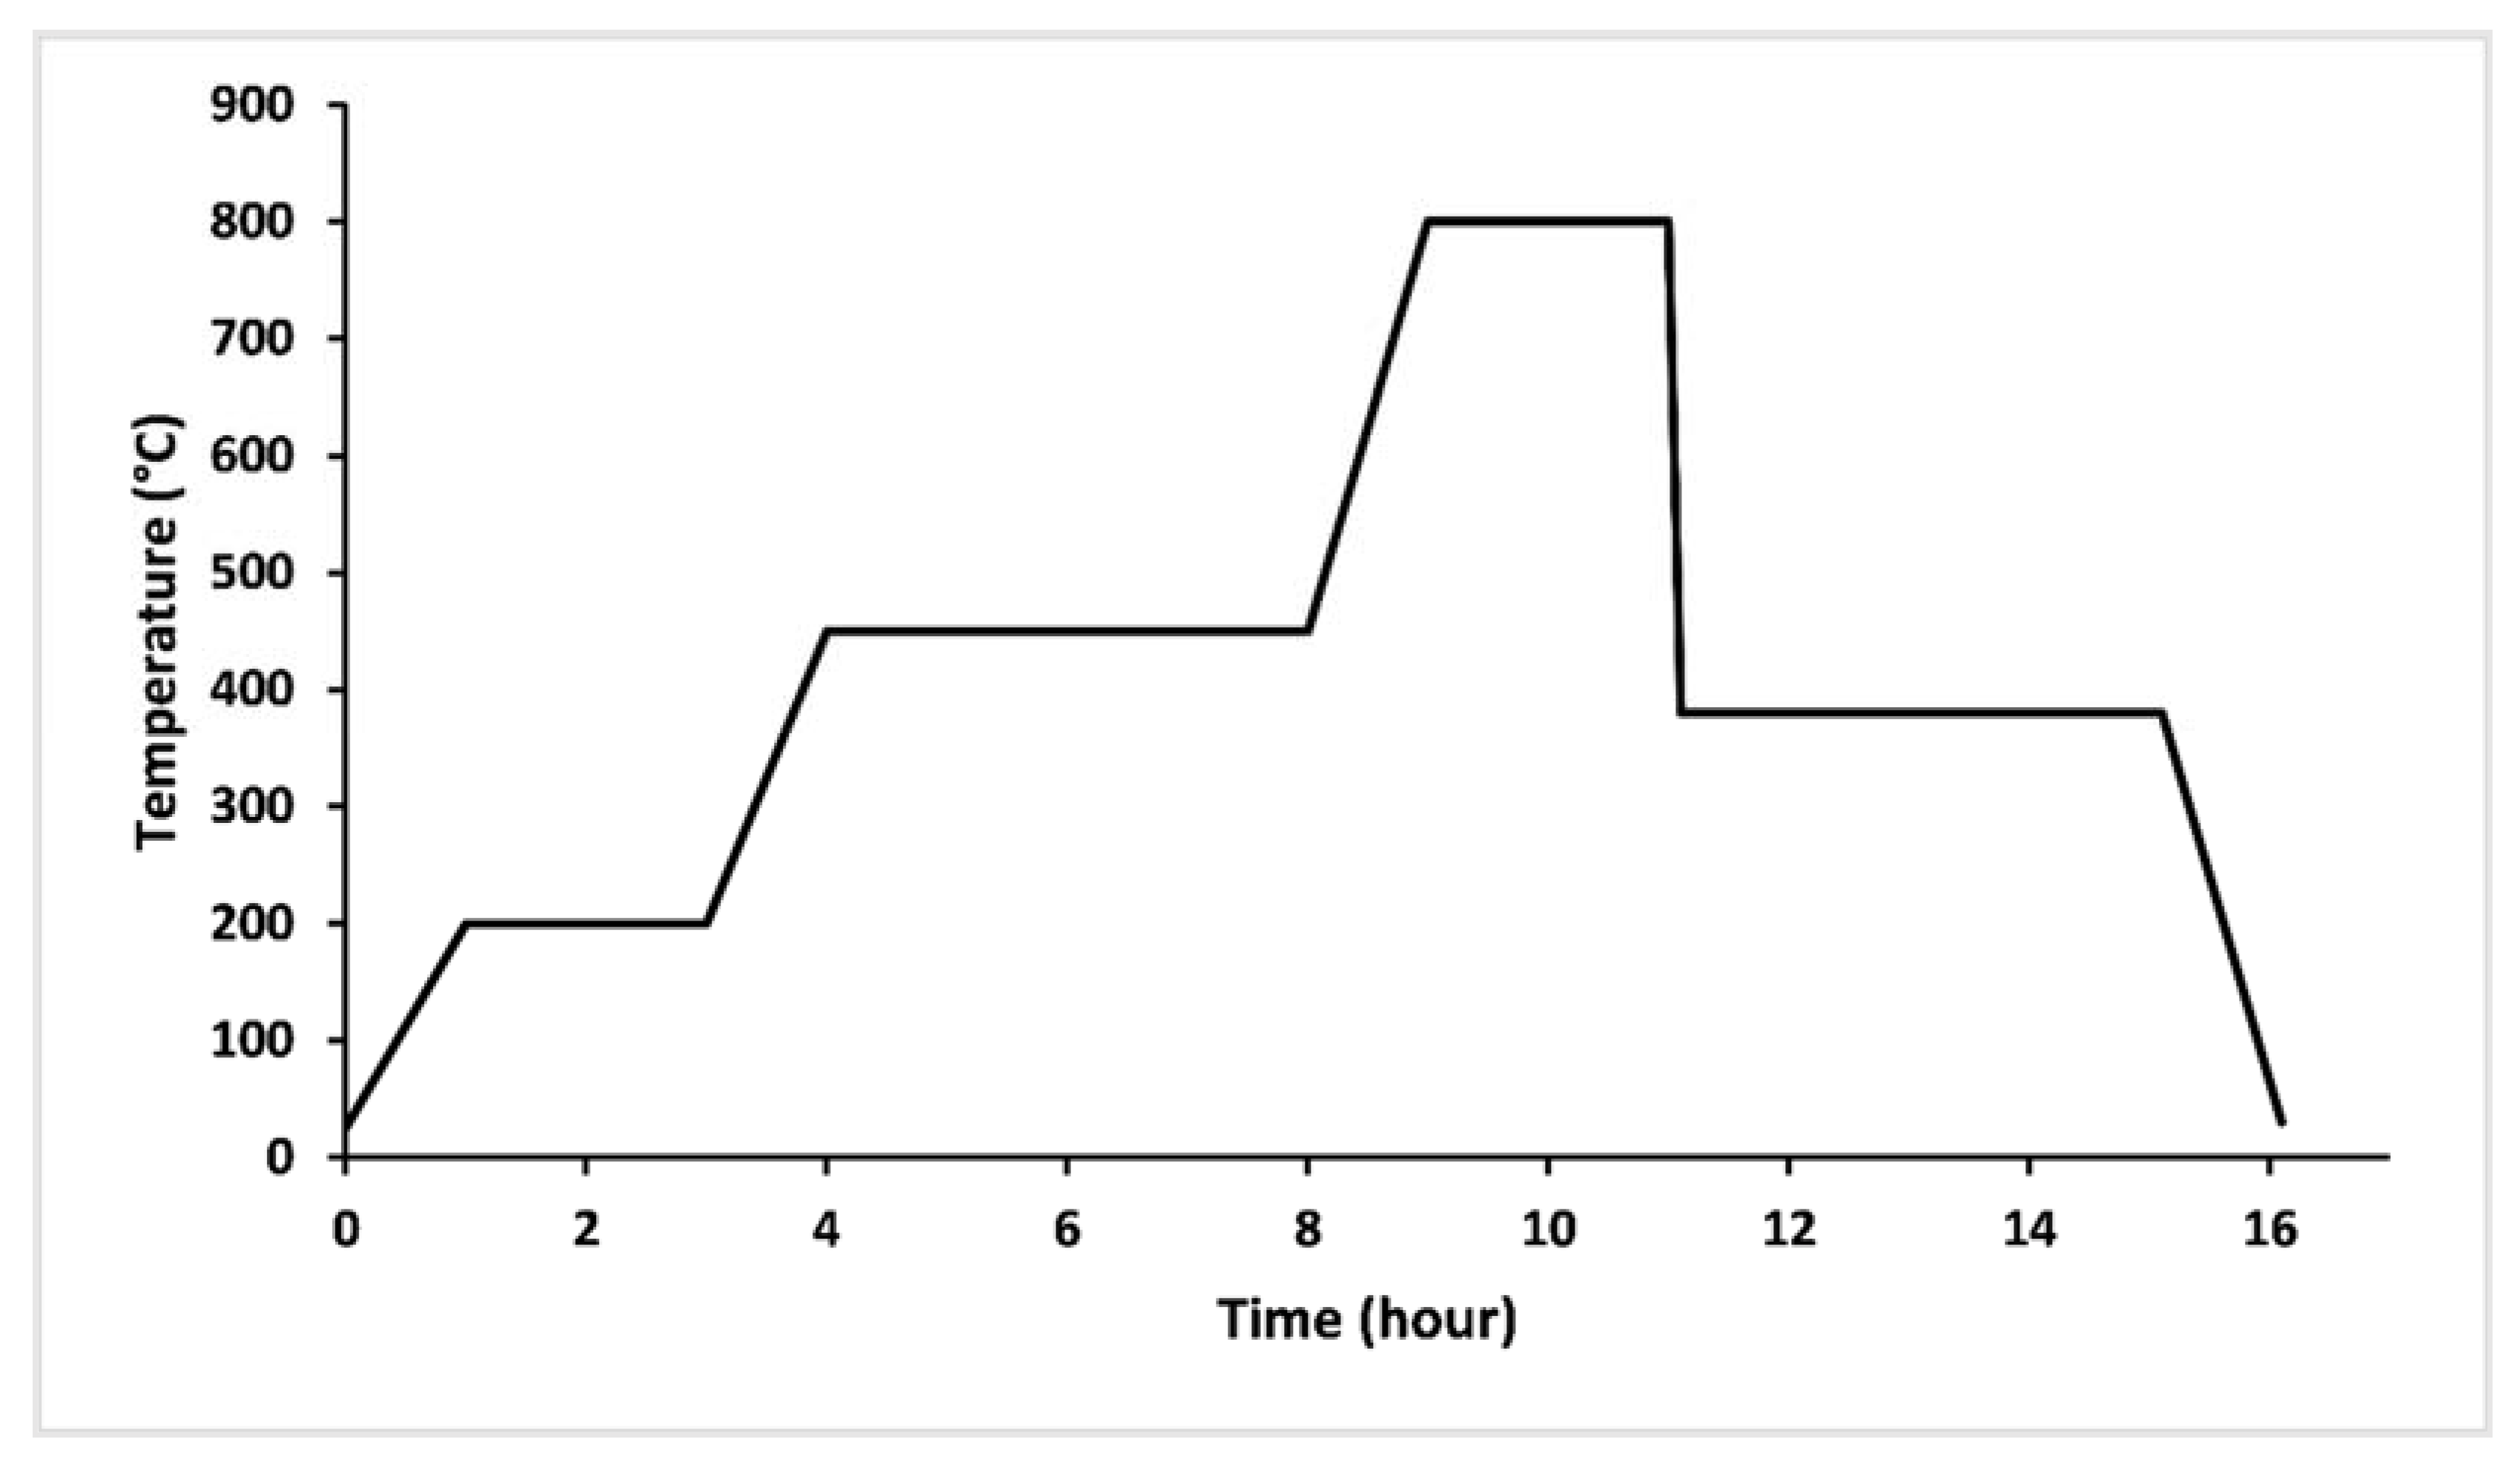
2.1. Glass Synthesis
2.2. Thermal Analysis
2.3. Density Measurements
- ρ = Density
- mglass = mass of glass measured in air
- mortho = mass of diethyl-ortho-phthalate only
- m(ortho + glass) = mass of glass immersed in diethyl-ortho-phthalate
- ρortho = 1.11422 g/cm3
2.4. Characterization of Glass Structure
2.5. Glass Dissolution
2.6. Agronomic Valorization of Vitreous Fertilizers
2.6.1. Plant Material and Experimental Design
2.6.2. Growth Parameters
2.6.3. Photosynthetic Efficiency and Stomatal Conductance
2.7. Statistical Analysis
3. Results and Discussion
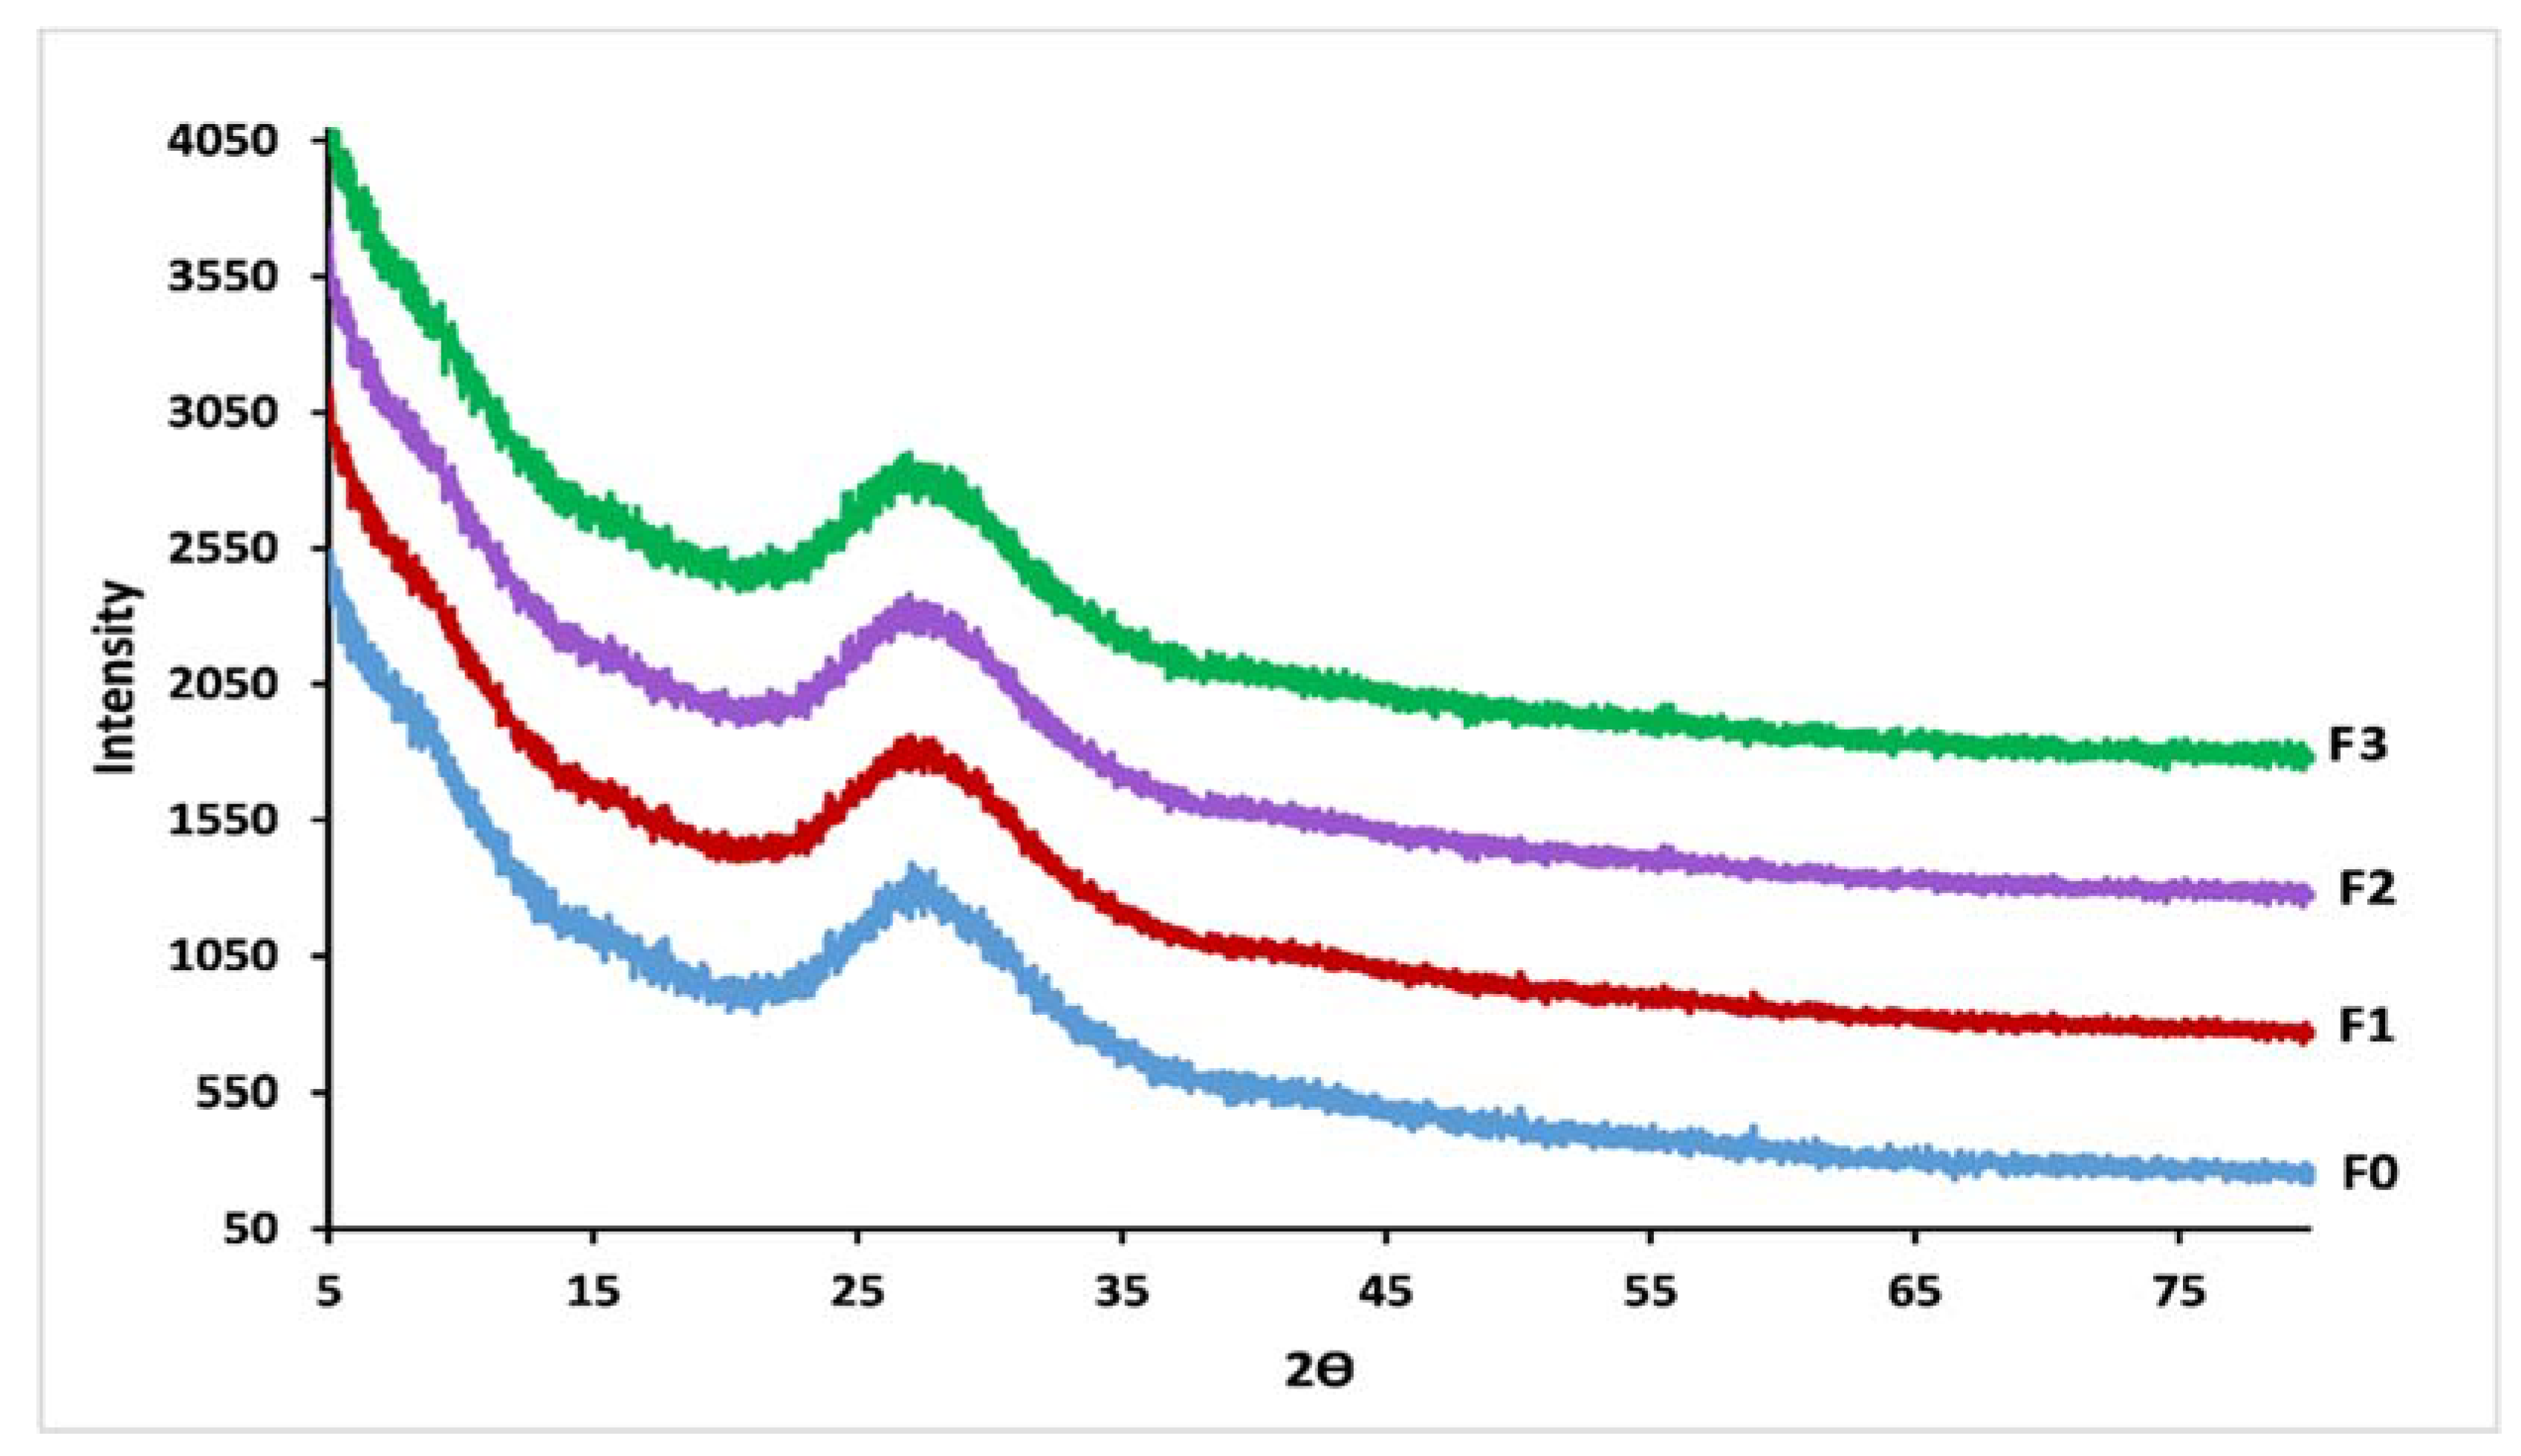
3.1. Glass Formation
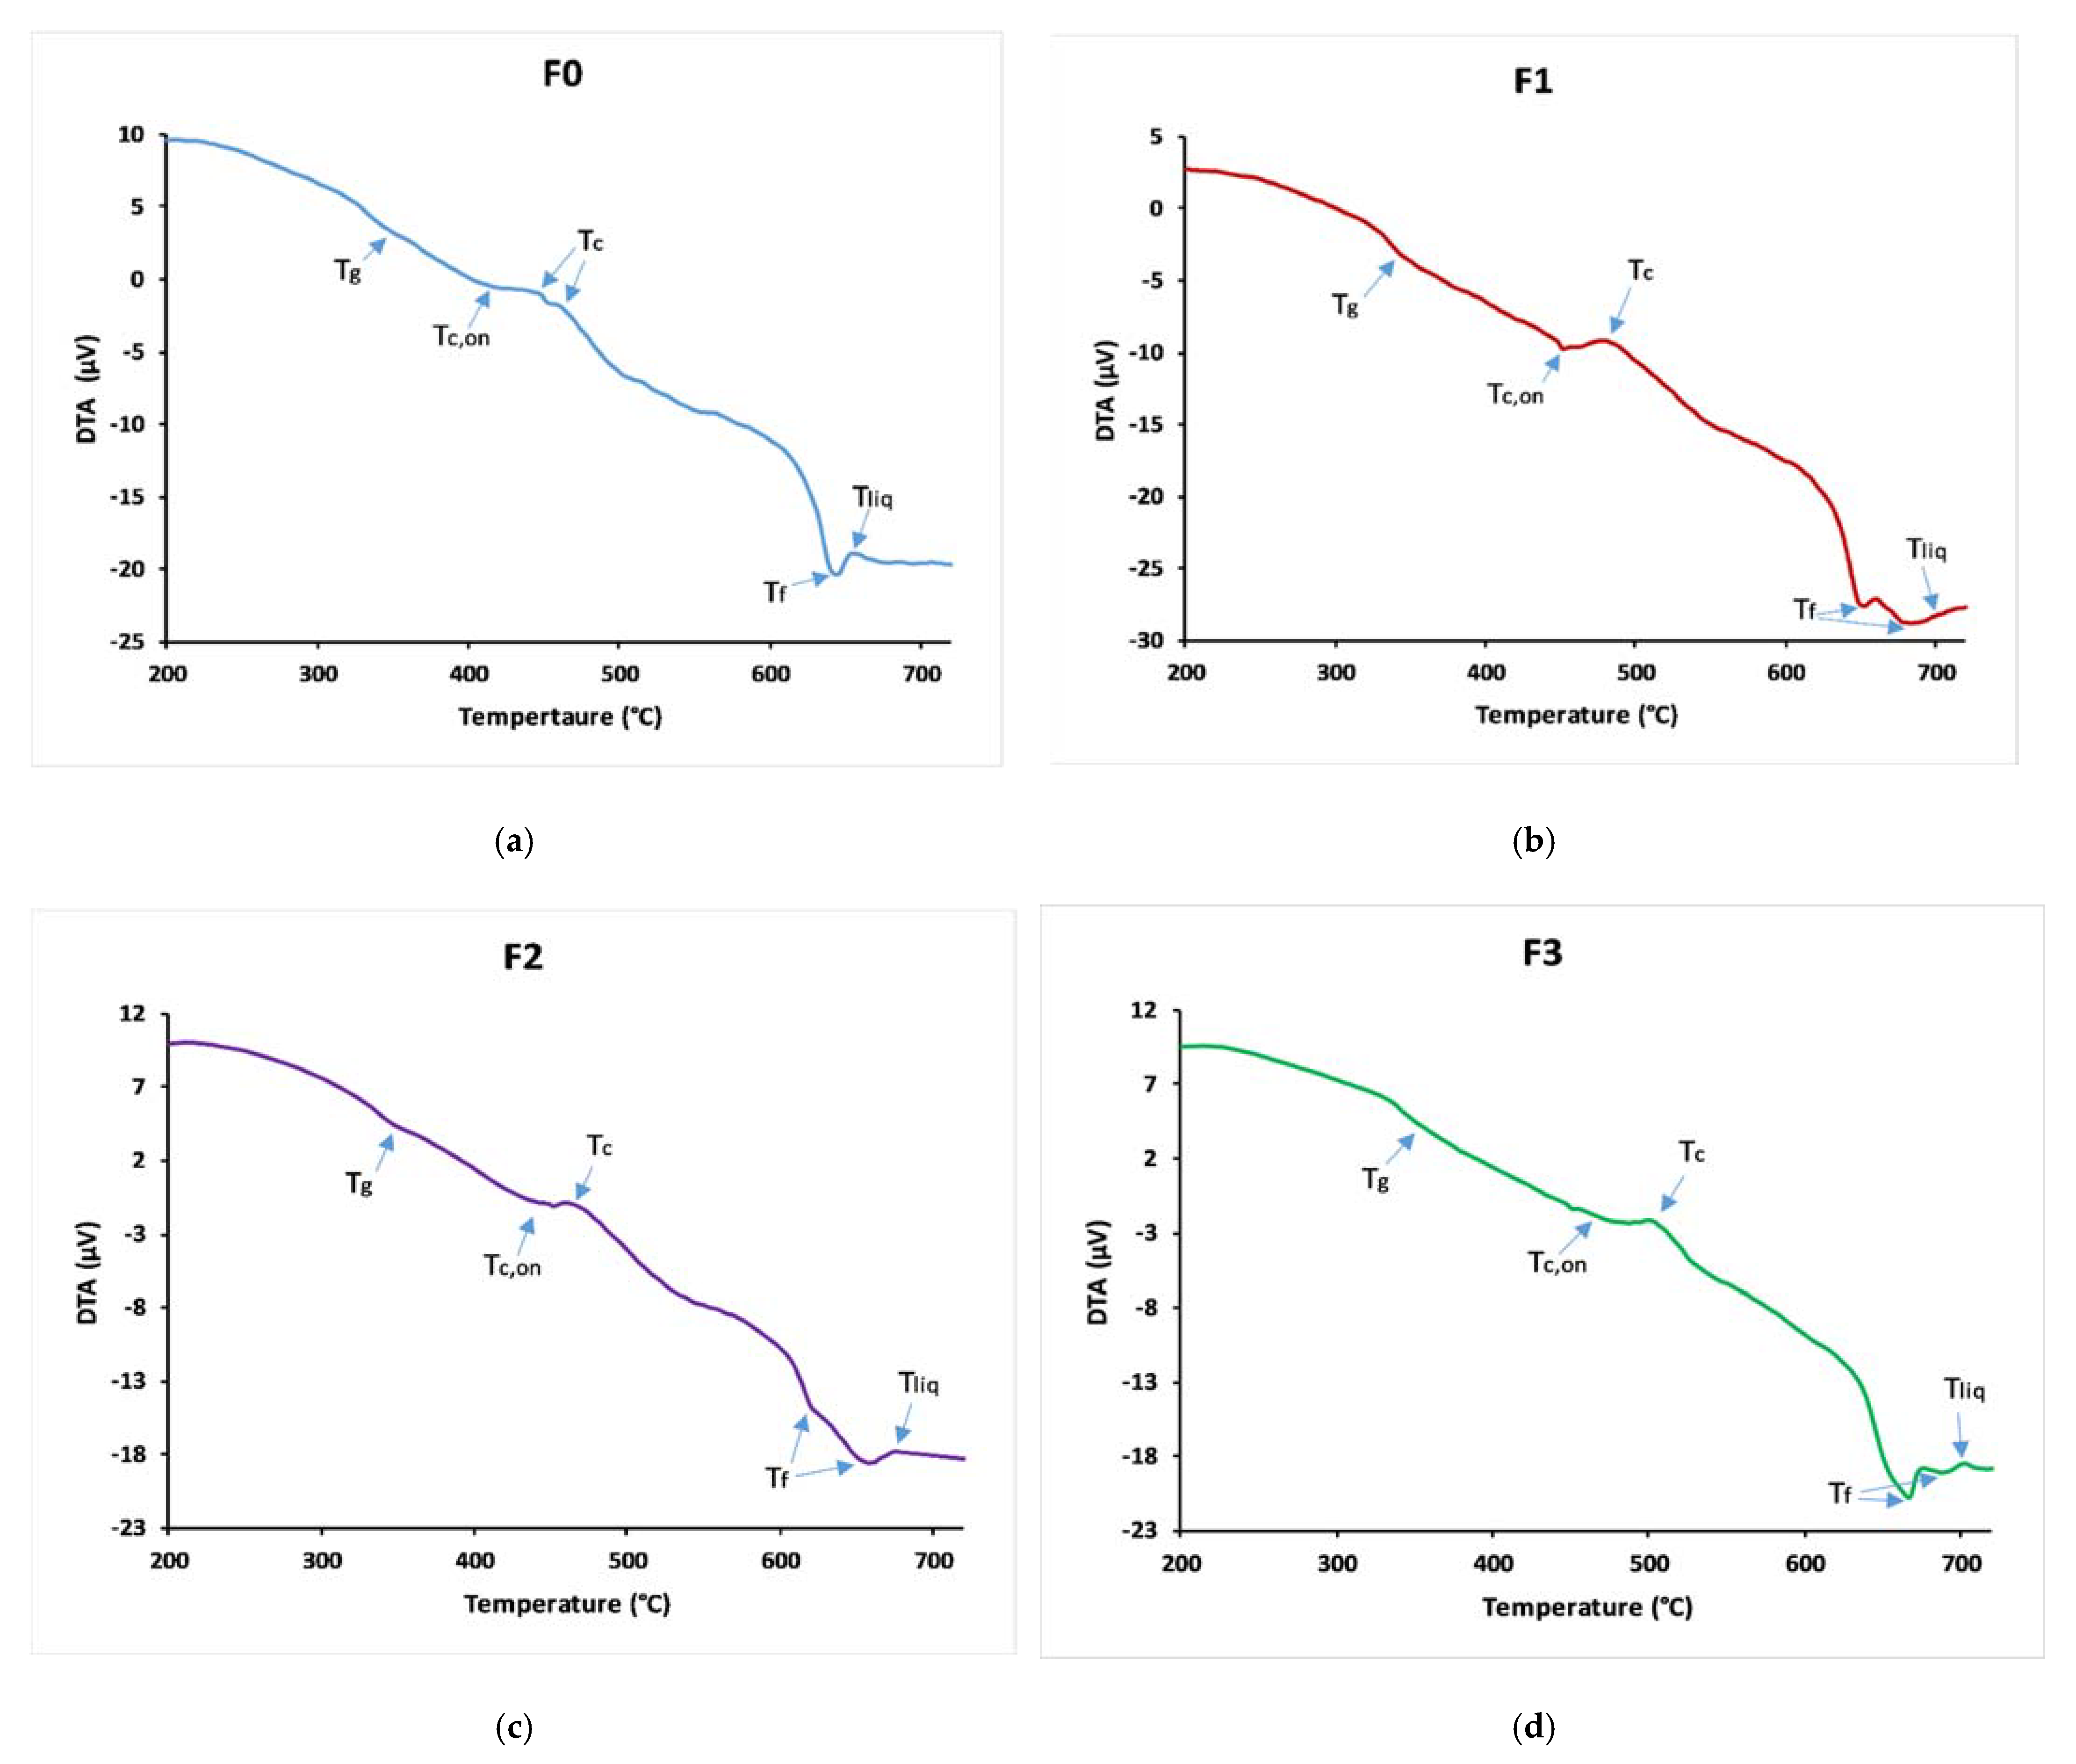
3.2. Thermal Behaviour
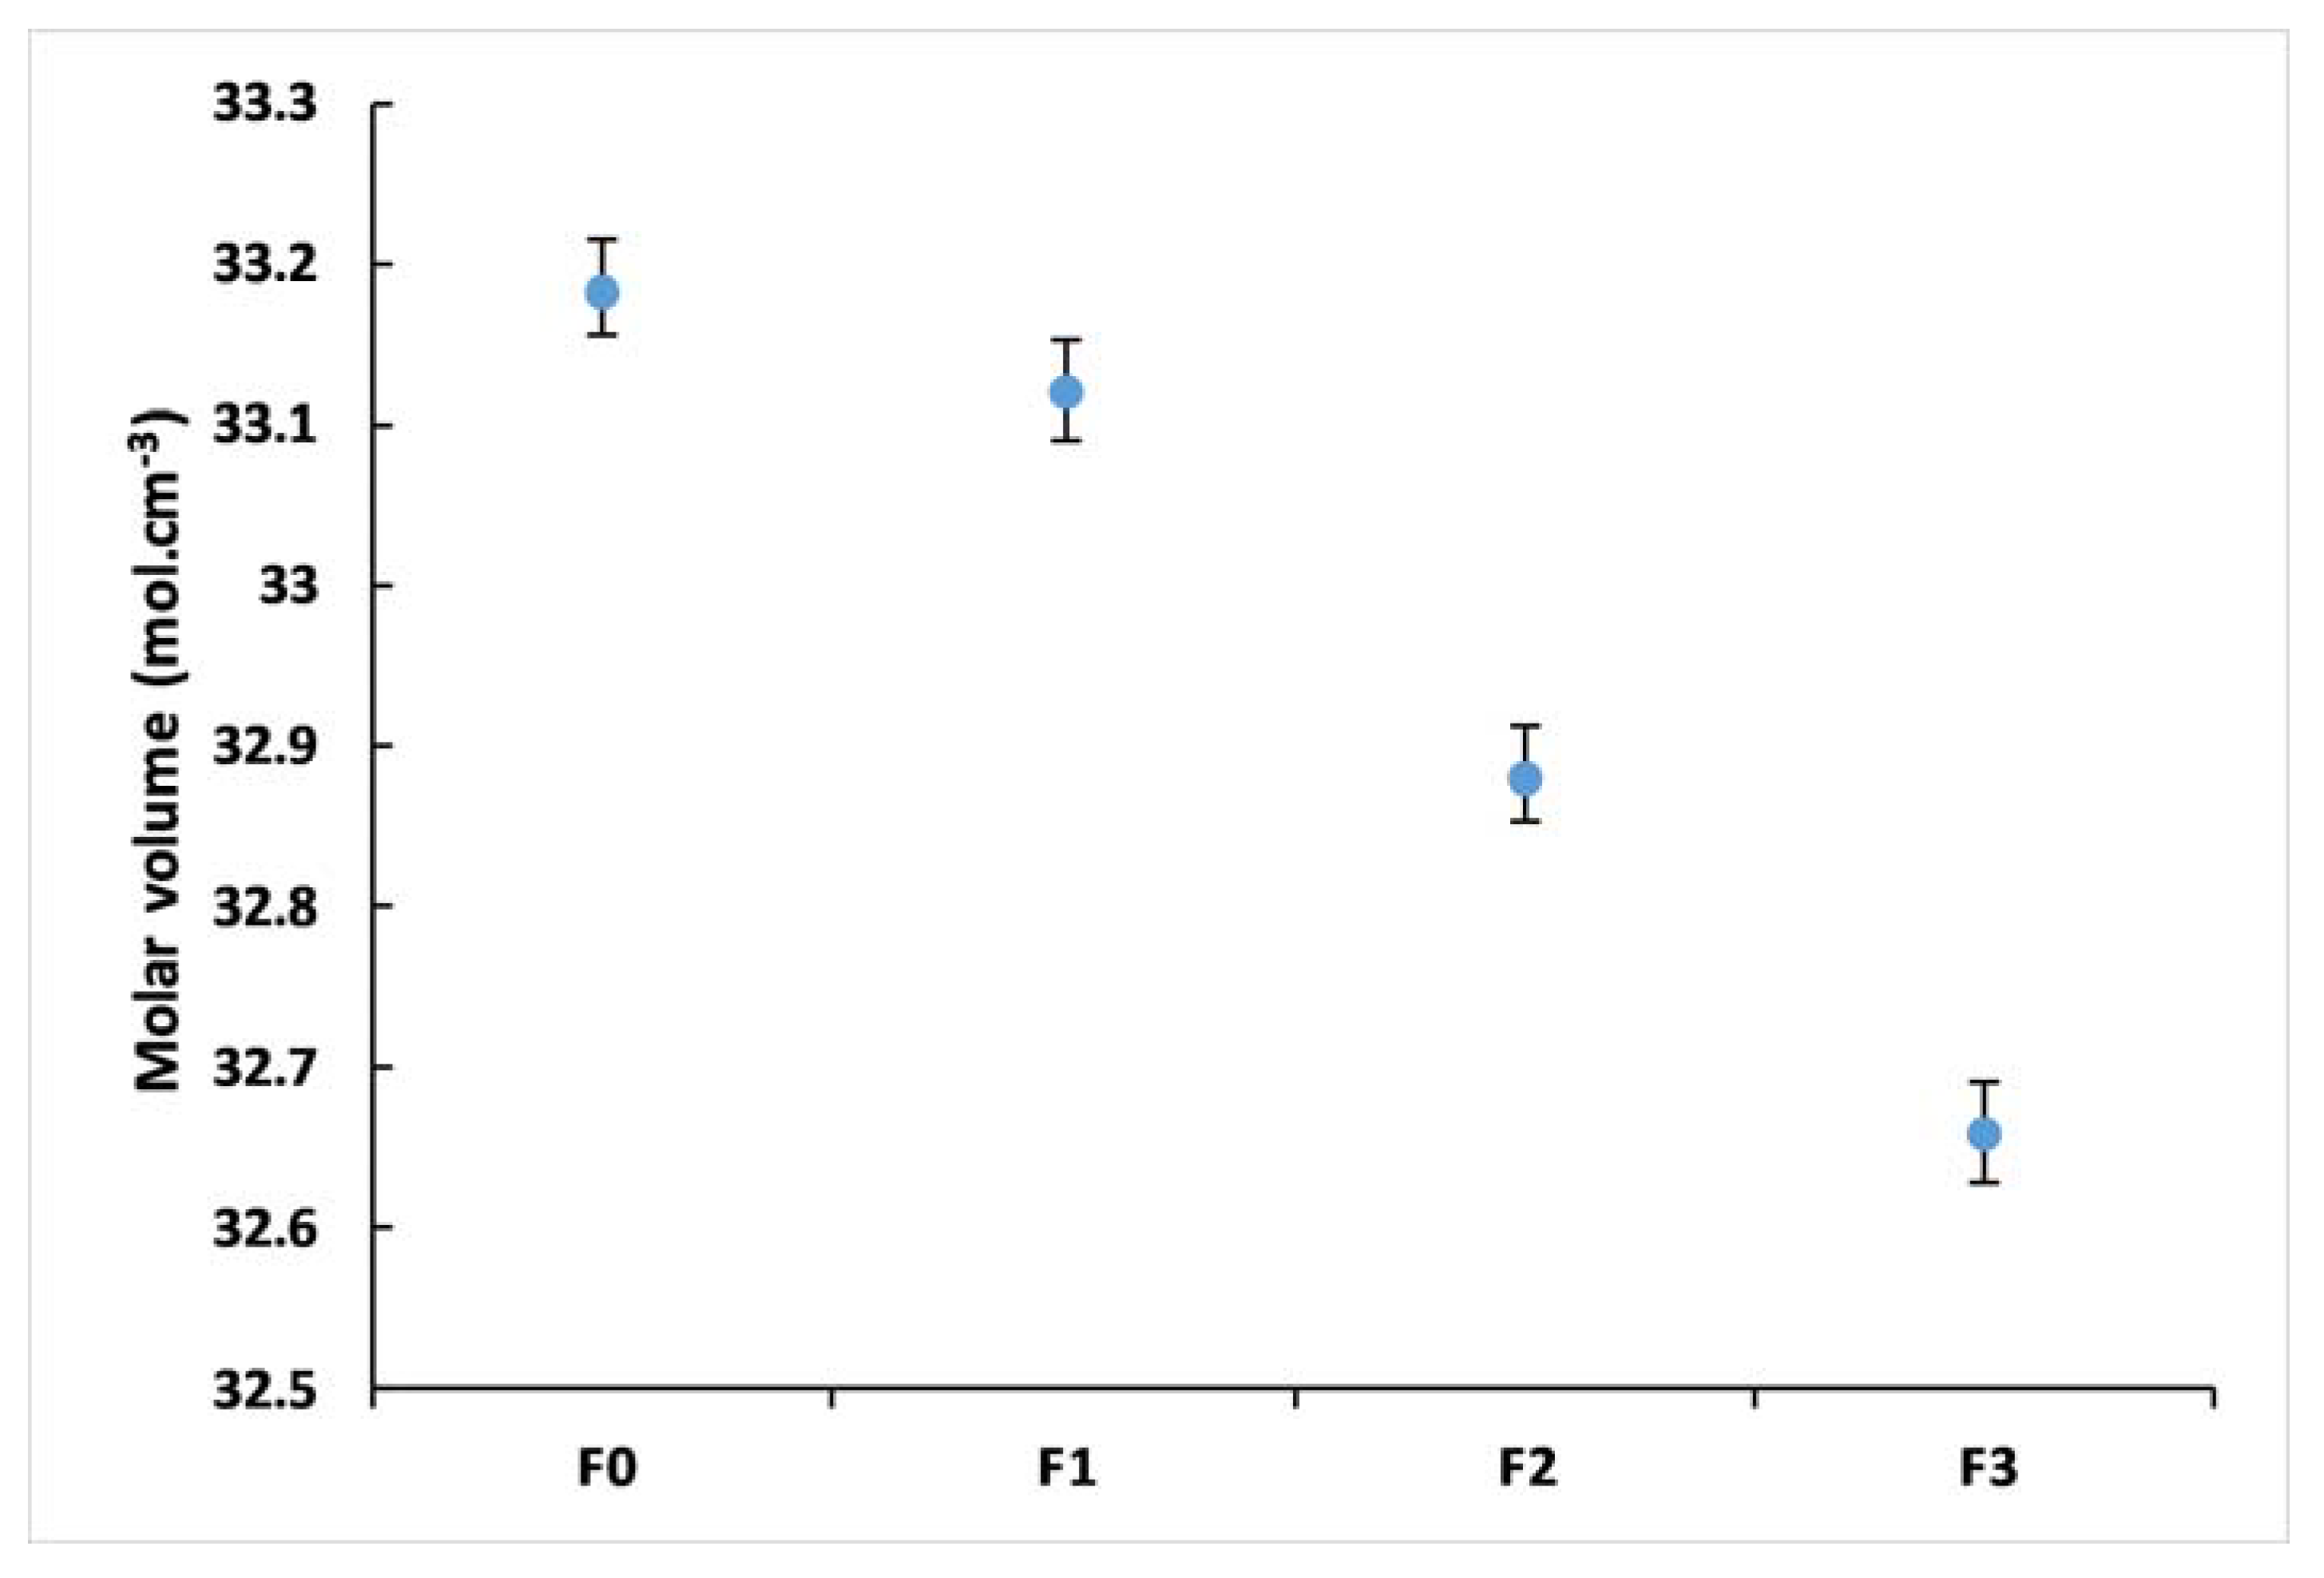
3.3. Glass Density
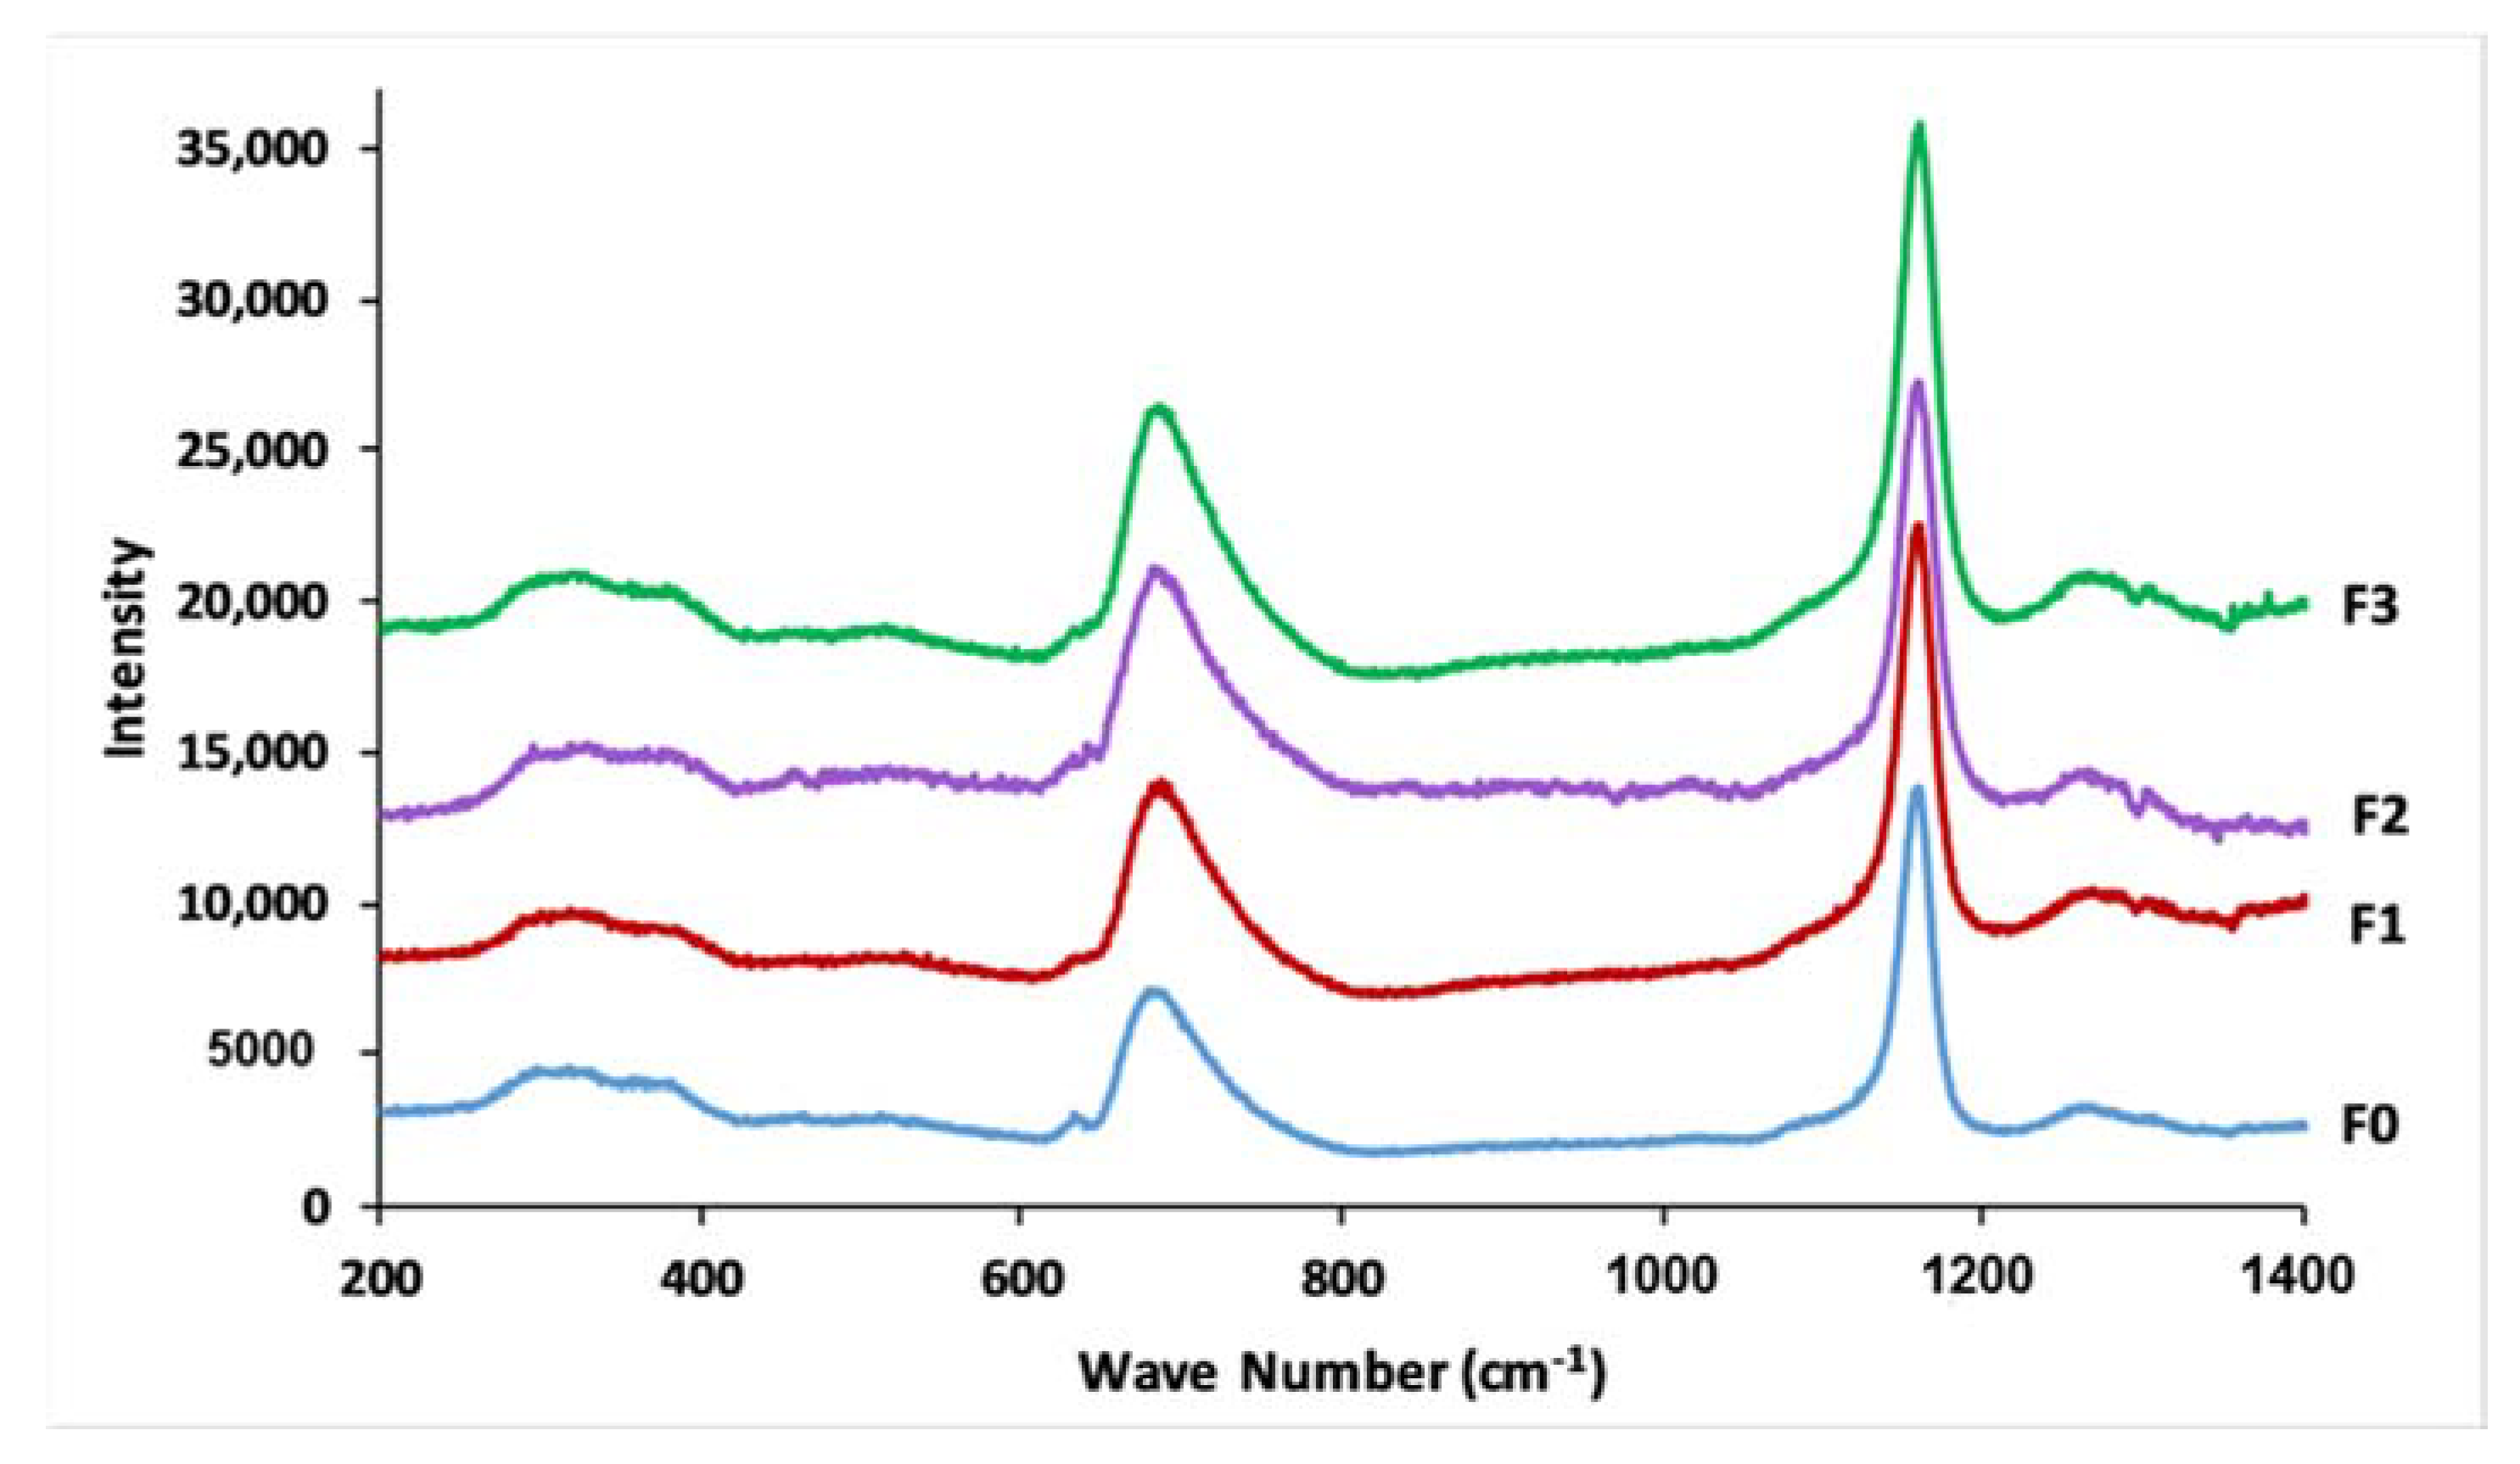
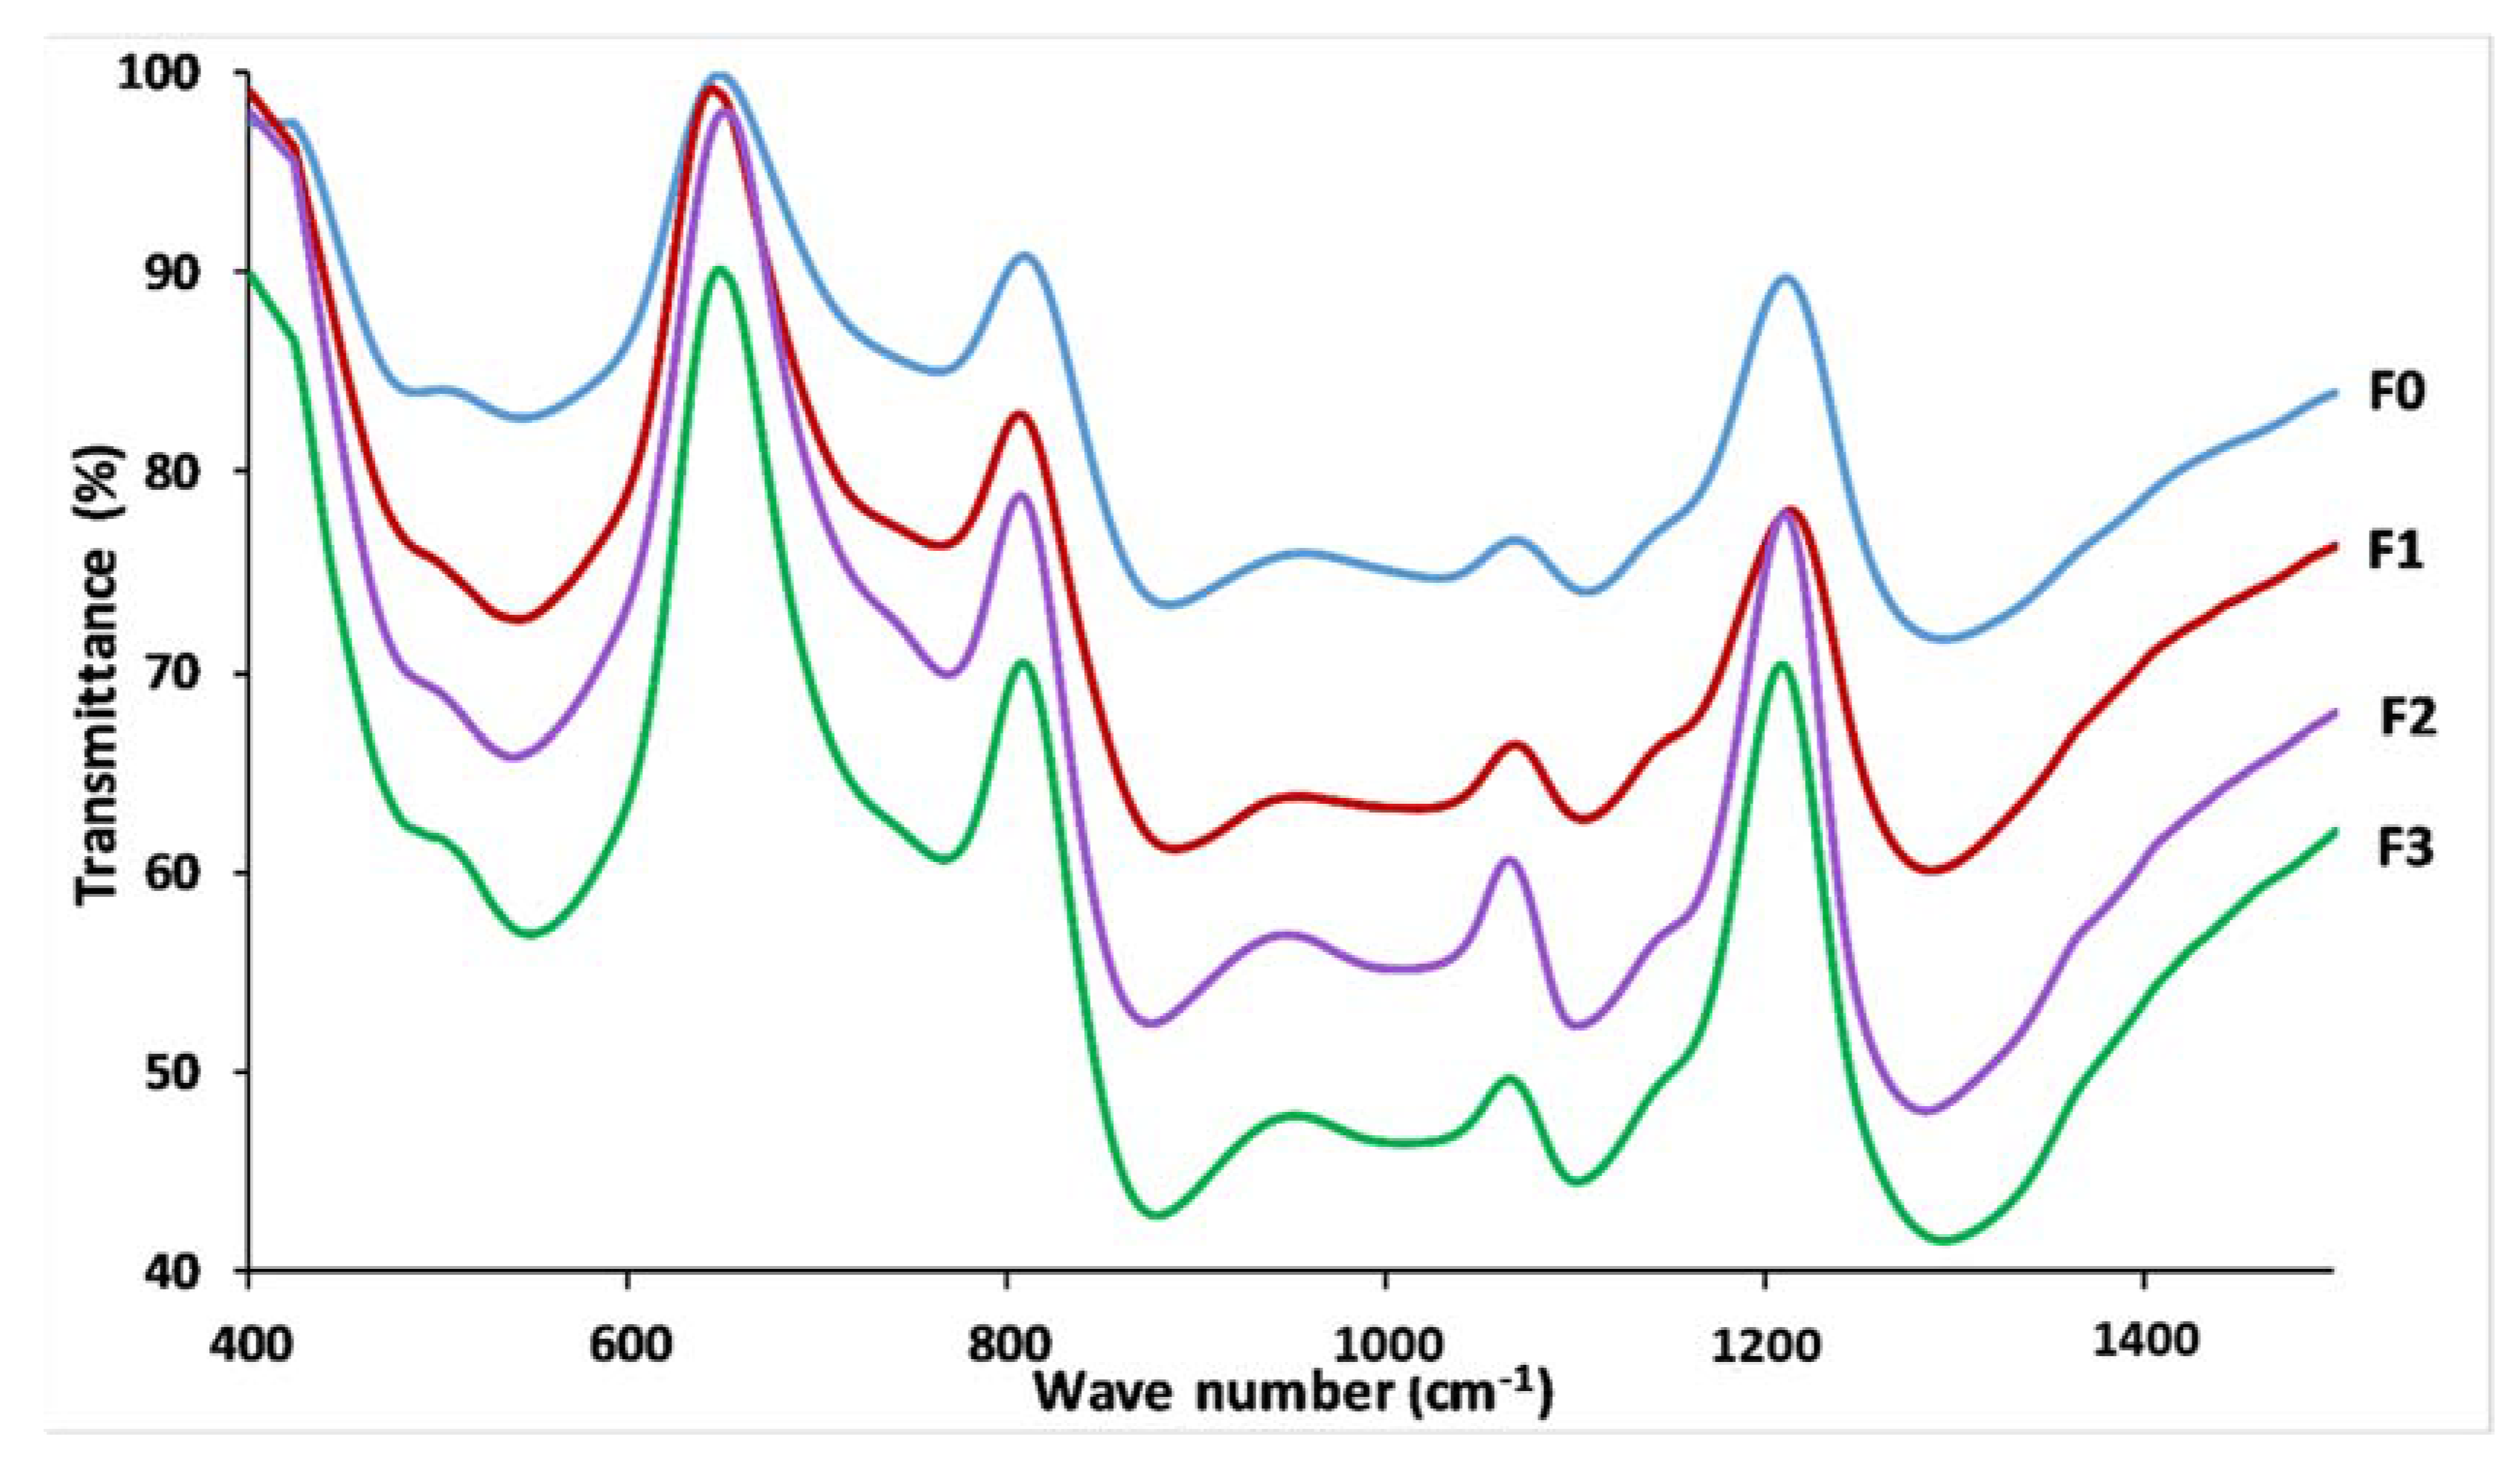
3.4. Glass Structure
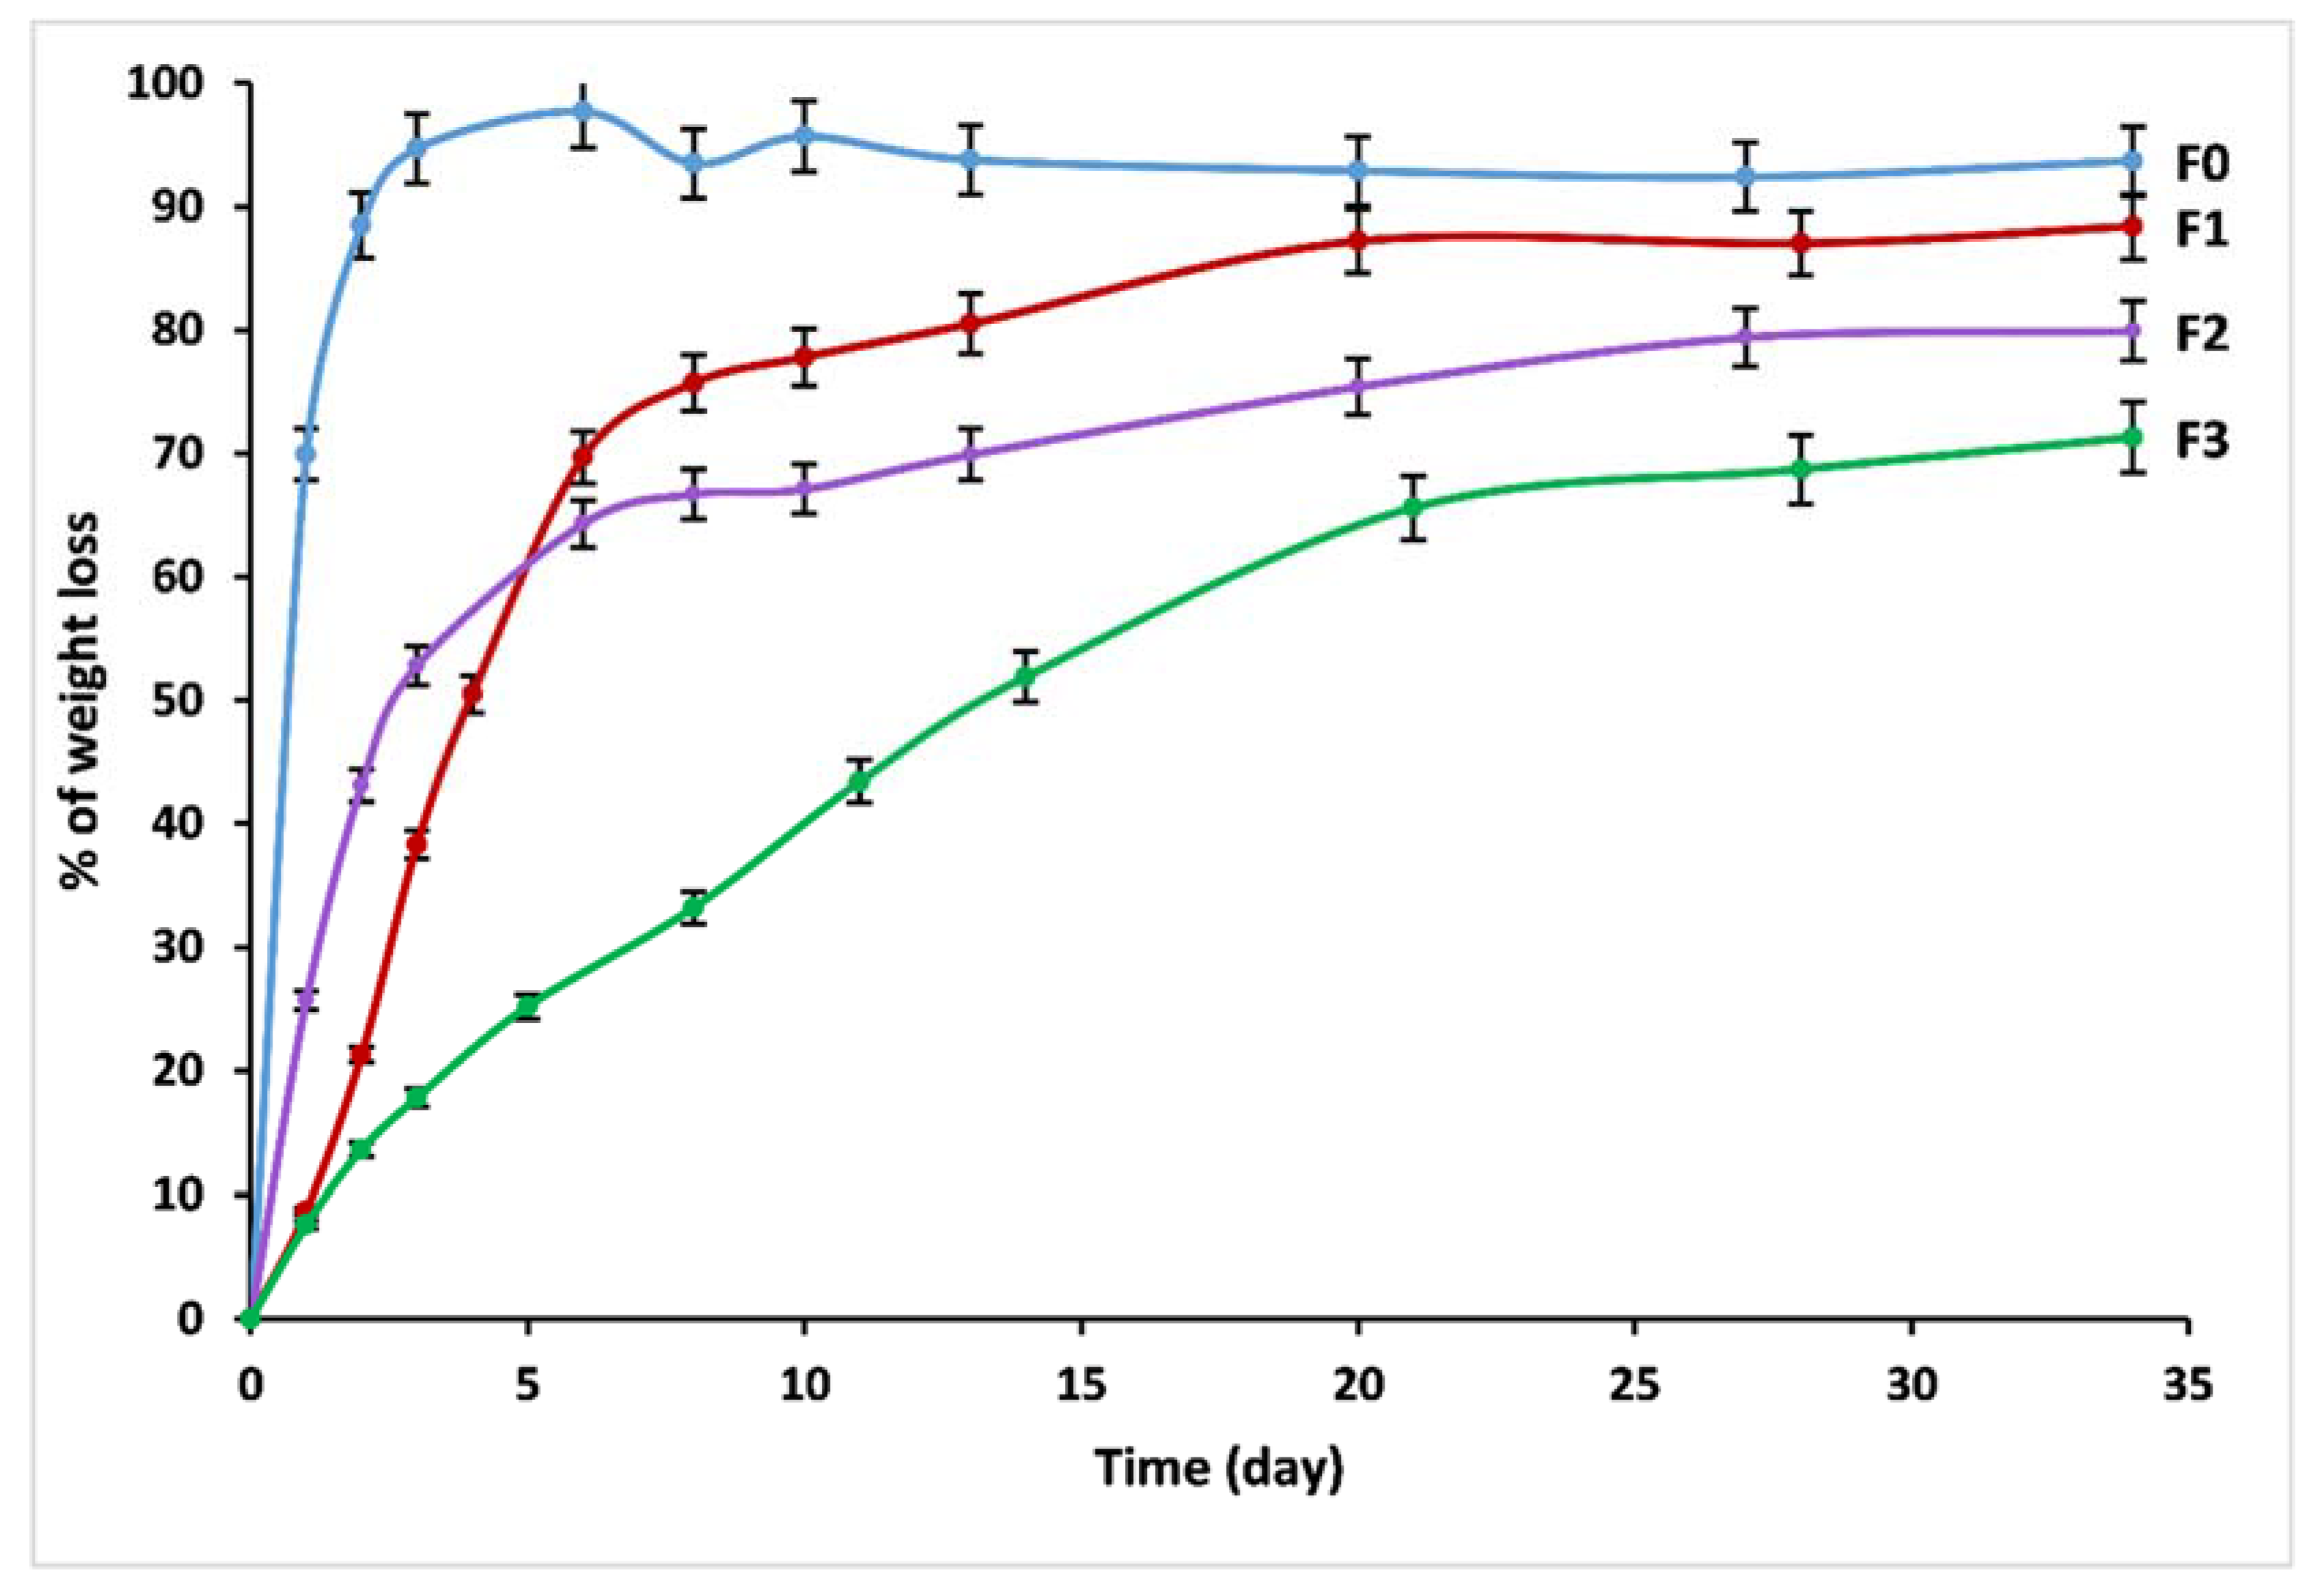
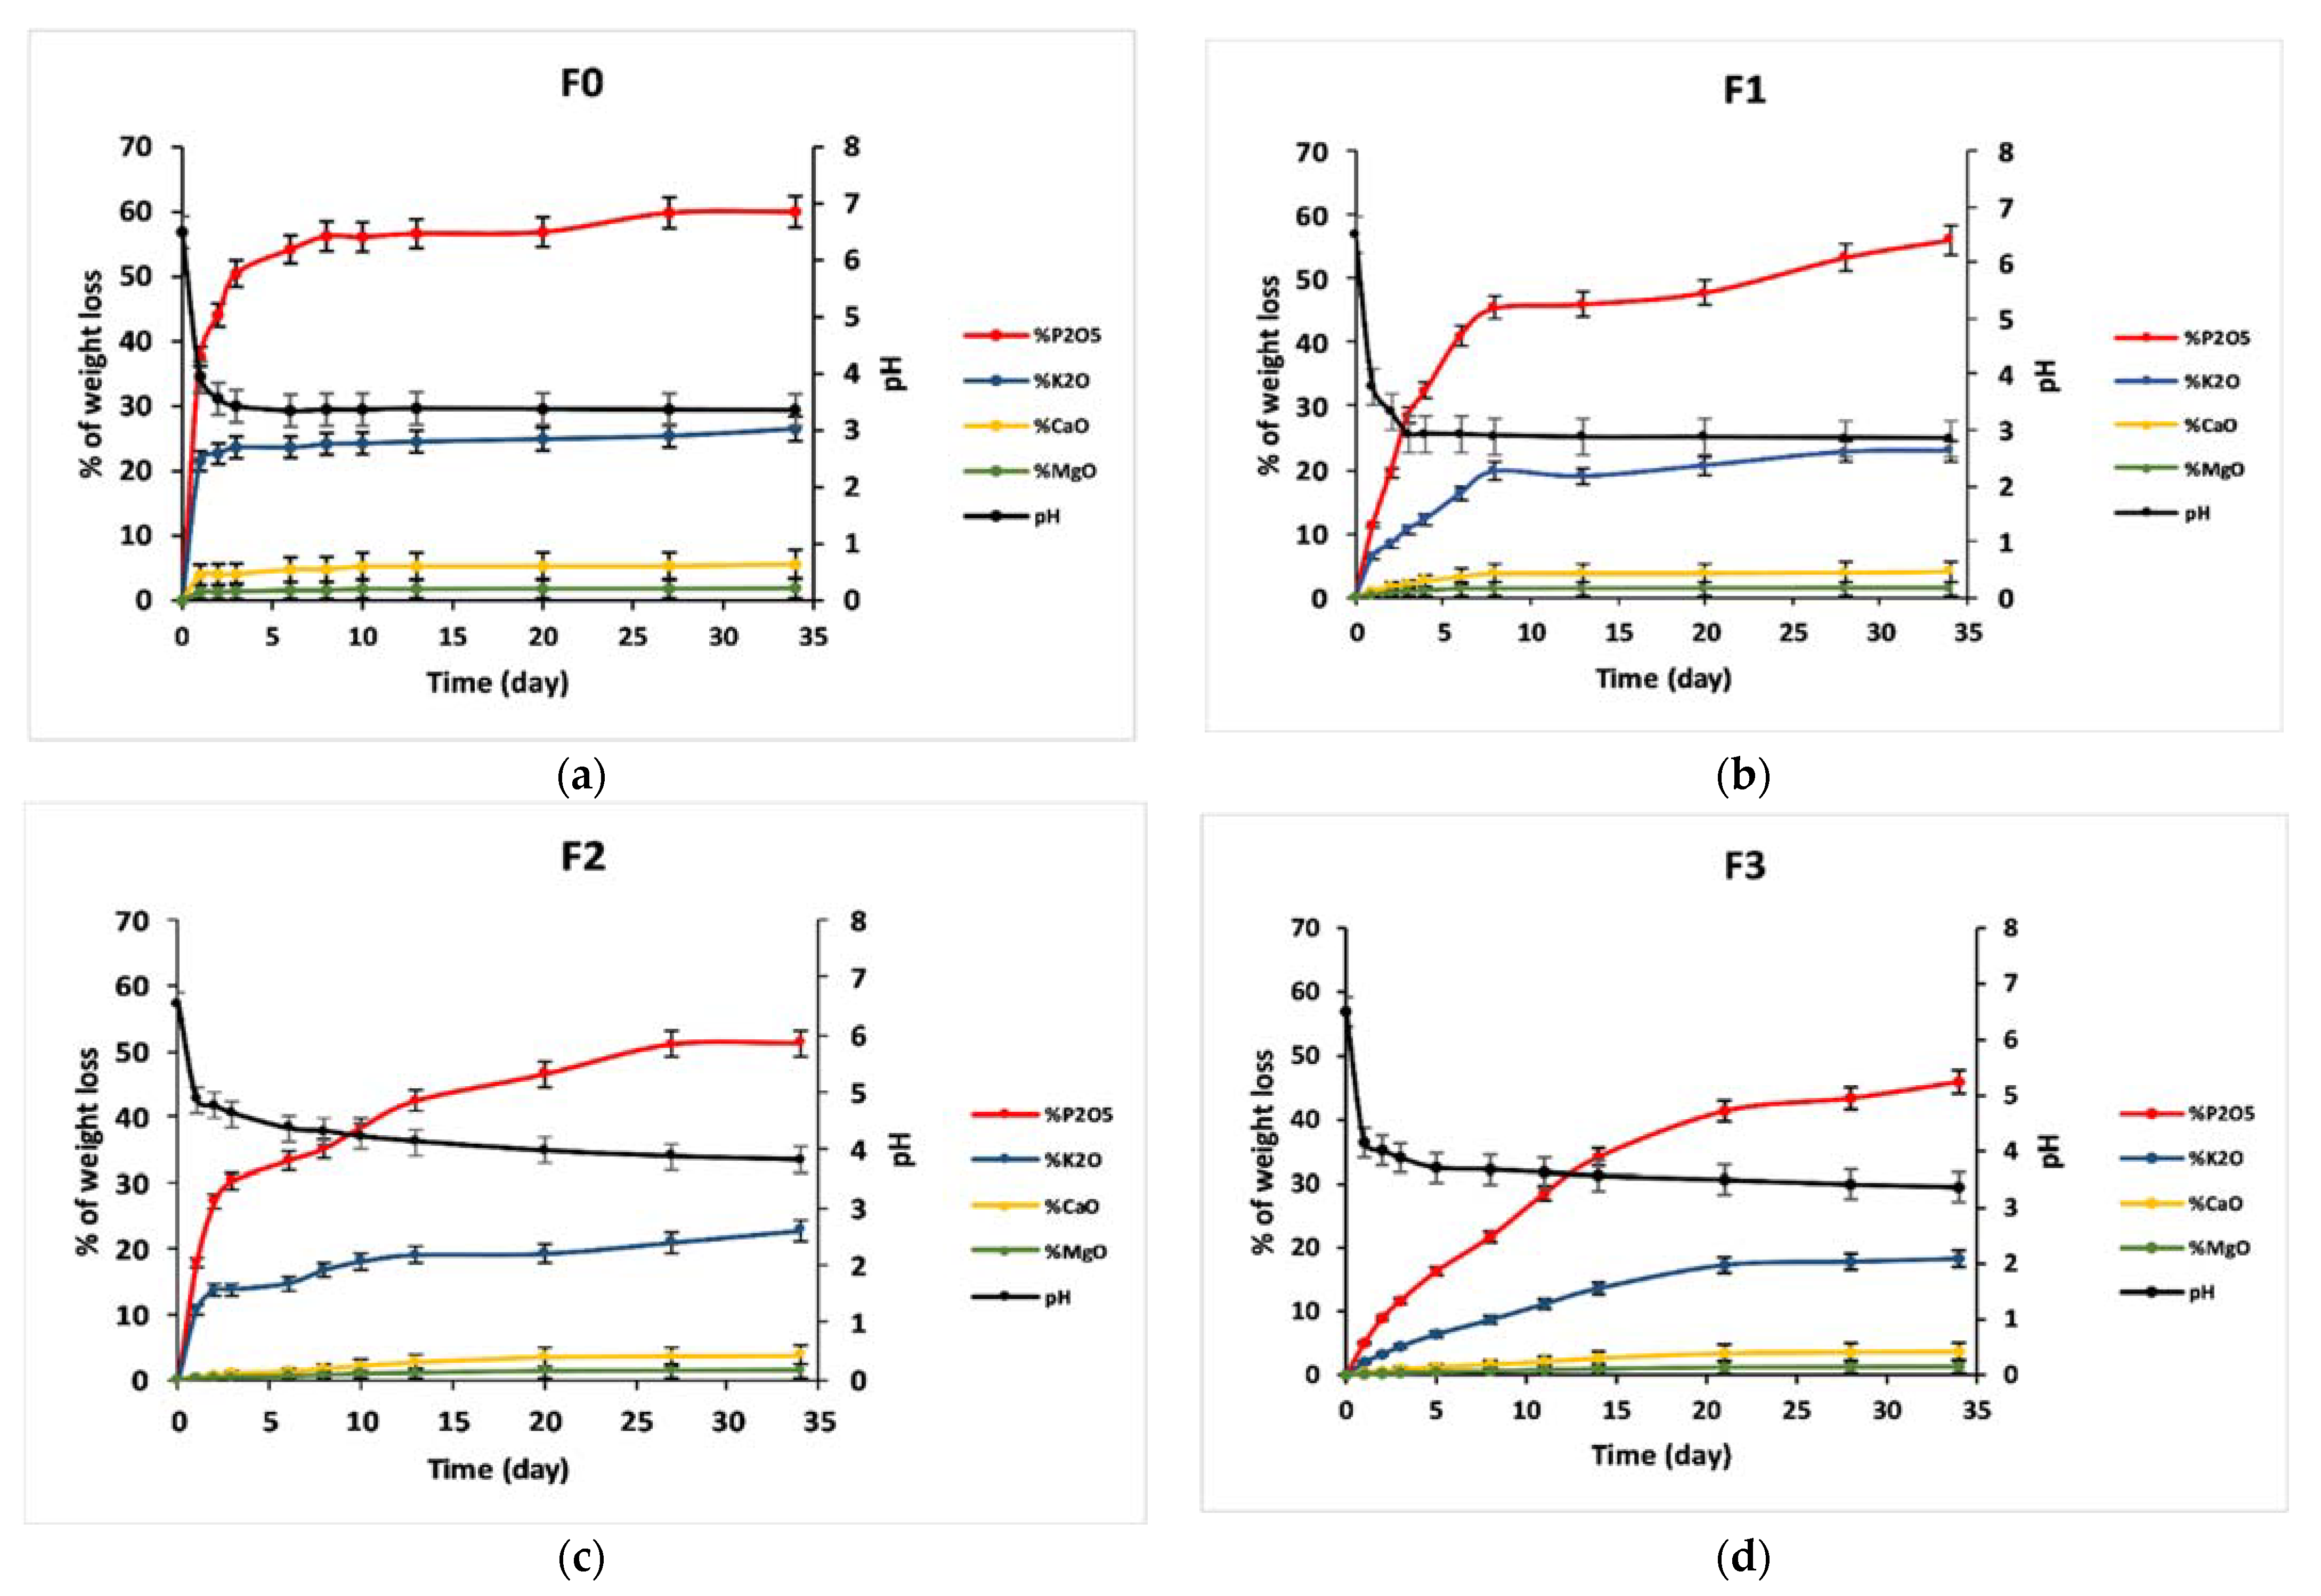
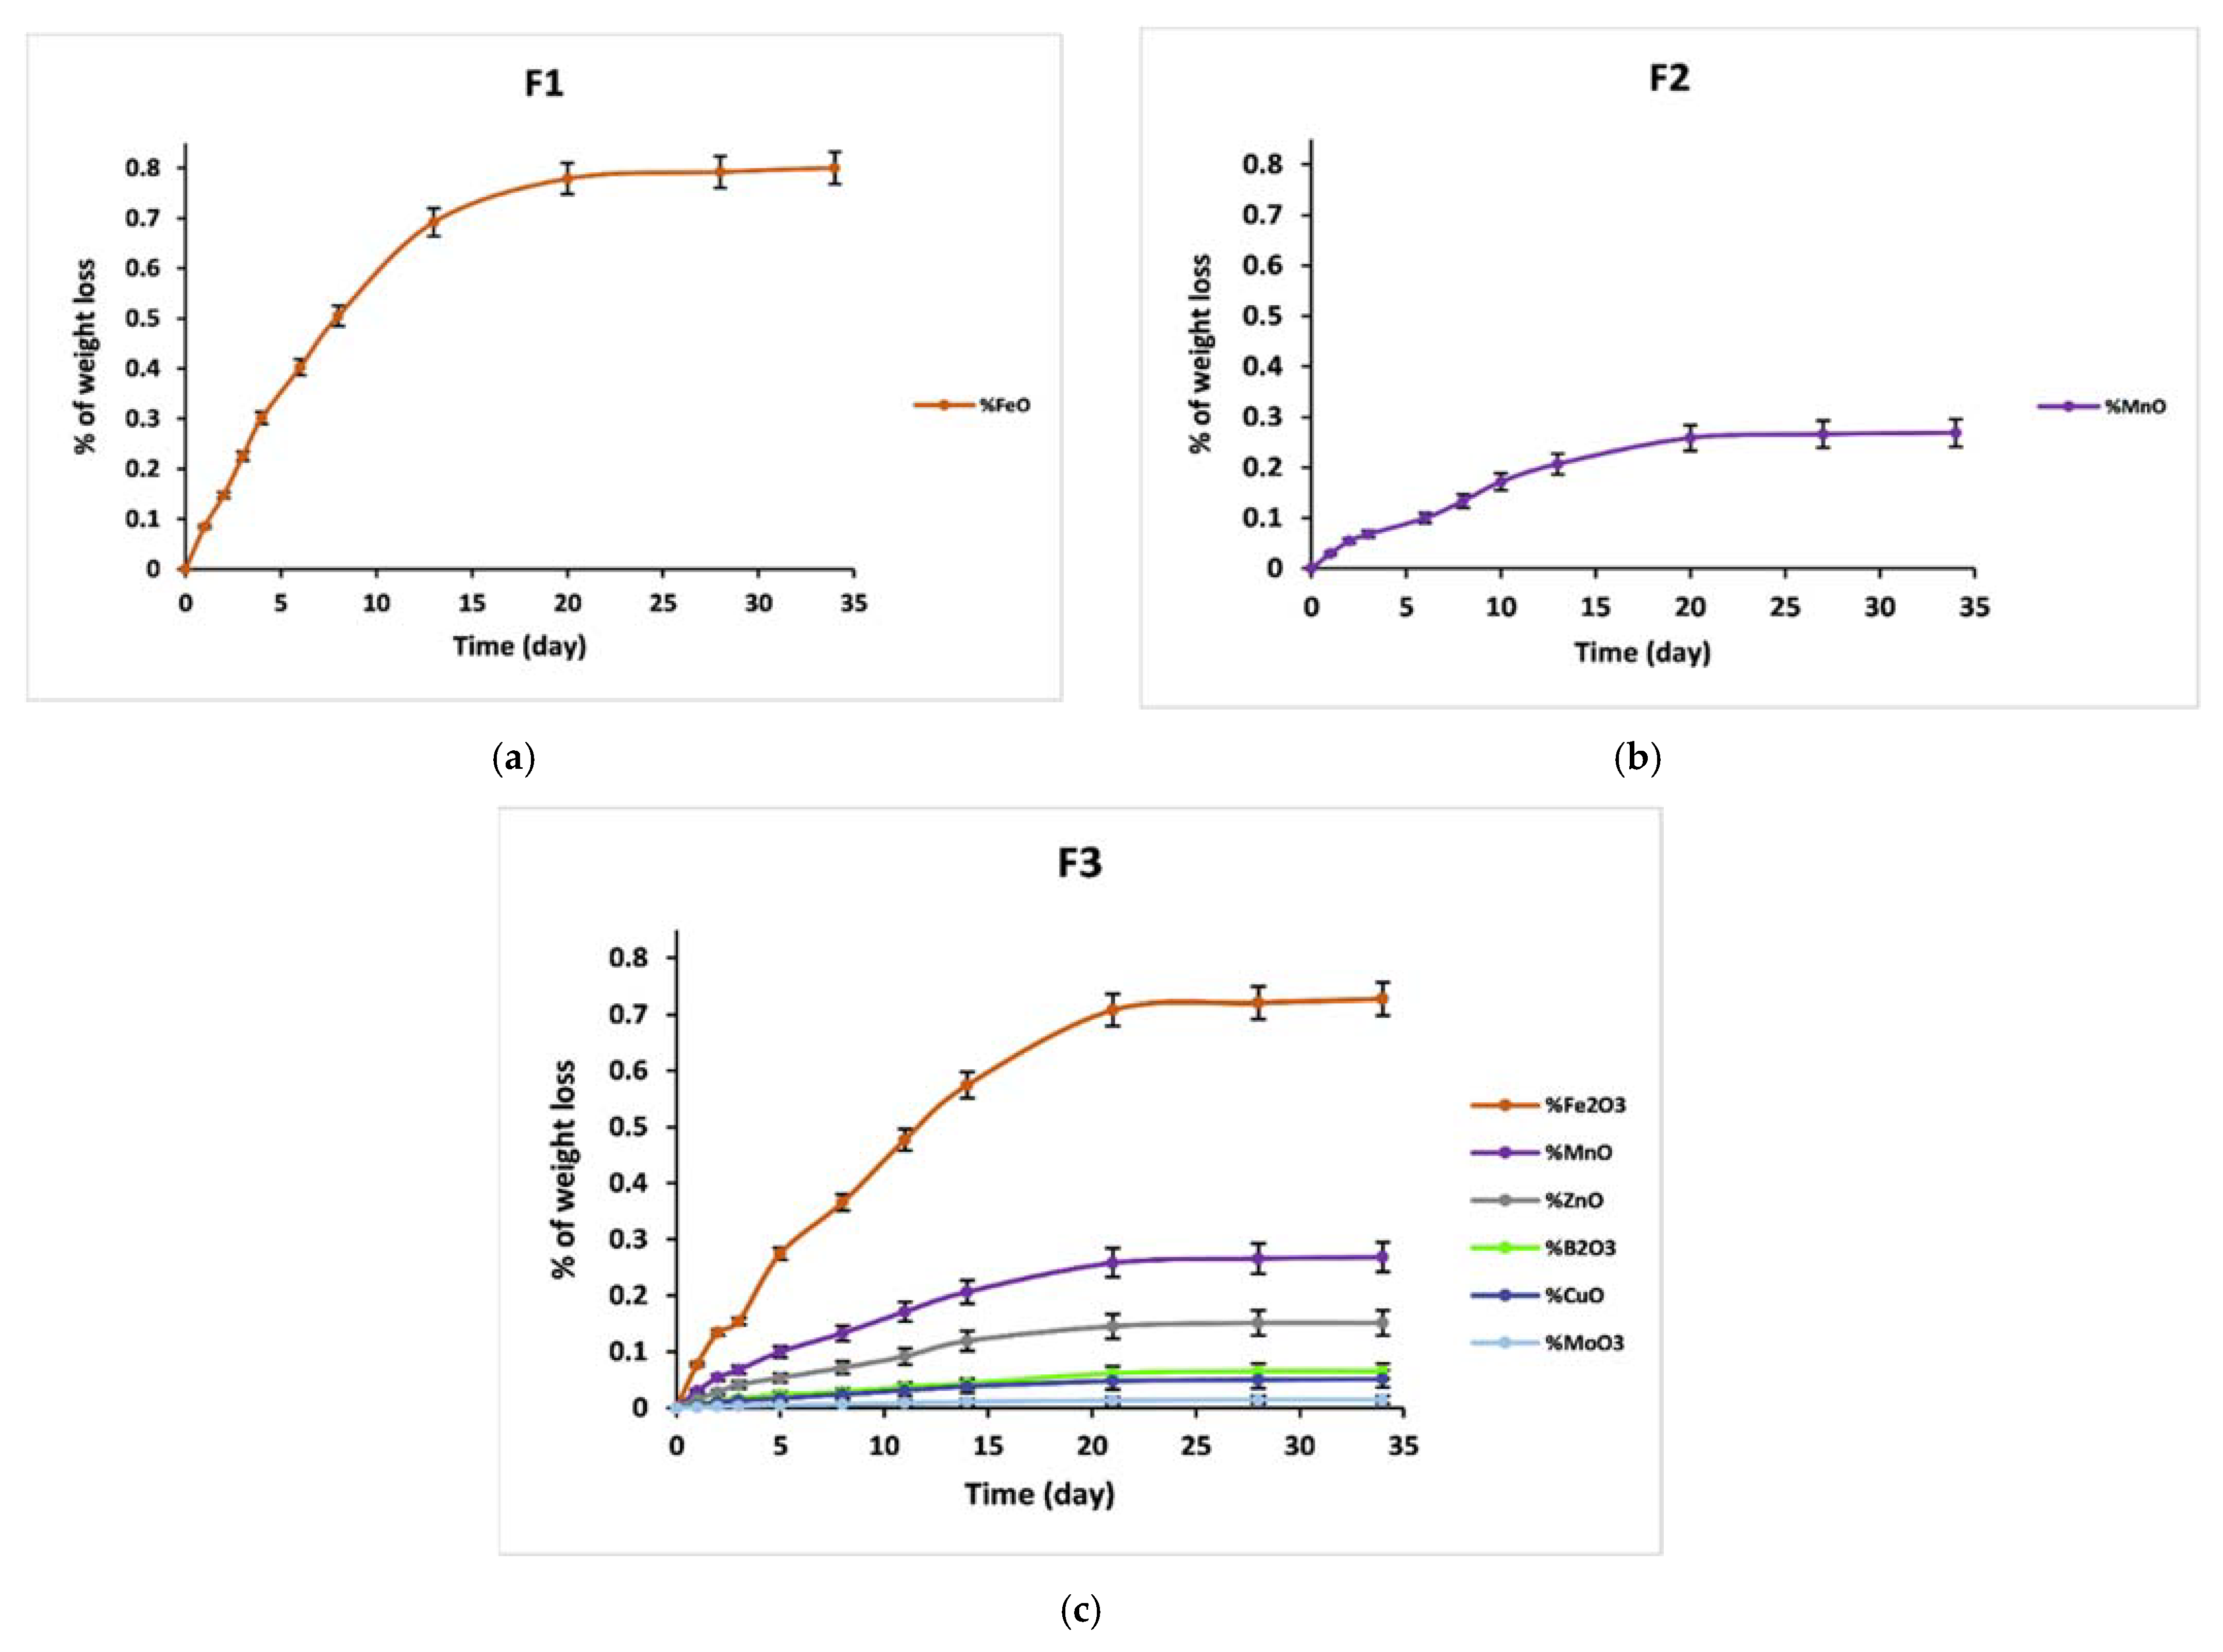
3.5. Dissolution Behavior
3.6. Growth Parameters
3.7. Photosynthetic Parameters
4. Conclusions
Author Contributions
Funding
Institutional Review Board Statement
Informed Consent Statement
Data Availability Statement
Acknowledgments
Conflicts of Interest
References
- ONU. World Population Prospects; No. 141; United Nations, Department of economics and Social Affairs: New York, NY, USA, 2019. [Google Scholar]
- Doering, O.; Sorensen, A. The Land that Shapes and Sustains us. In How to Feed World; Food and Agriculture Organization of the United Nations: Rome, Italy, 2018; pp. 46–58. [Google Scholar]
- Schmidhuber, J.; Bruinsma, J.; Boedeker, G. Capital requirements for agriculture in developing countries to 2050, FAO Expert Meet. In How to Feed World 2050; Food and Agriculture Organization of the United Nations, Economic and Social Development Department: Rome, Italy, 2009; p. 21. [Google Scholar]
- McKenzie, F.C.; Williams, J. Sustainable food production: Constraints, challenges and choices by 2050. Food Secur. 2015, 7, 221–233. [Google Scholar] [CrossRef]
- Fróna, D.; Szenderák, J.; Rákos, M.H. The challenge of feeding the poor. Sustainability 2019, 11, 5816. [Google Scholar] [CrossRef]
- Shiferaw, B.; Prasanna, B.M.; Hellin, J.; Bänziger, M. Crops that feed the world 6. Past successes and future challenges to the role played by maize in global food security. Food Secur. 2011, 3, 307–327. [Google Scholar] [CrossRef]
- Snapp, V.; Morrone, S. Perennial Wheat. Michigan State Univ. Ext. Bull. 2014, E3208, 1–3. [Google Scholar]
- Curtis, T.; Halford, N.G. Food security: The challenge of increasing wheat yield and the importance of not compromising food safety. Ann. Appl. Biol. 2014, 164, 354–372. [Google Scholar] [CrossRef] [PubMed]
- Scherr, S.J.; Yadav, S.N. Land Degradation in the Developing World: Implications for Food, Agriculture, and the Environment to 2020; International Food Policy Research Institute (IFPRI): Washington, DC, USA, 1996; p. 14. [Google Scholar]
- Belaid, A.; Morris, M.L. Wheat and Barley Production in Rainfed Marginal Environments of West Asia and North Africa: Problems and Prospects; CIMMYT Economics Working Paper; CIMMYT: Mexico City, Mexico, 1991; pp. 1–28. [Google Scholar]
- Ait-El-Mokhtar, M.; Boutasknit, A.; Ben-Laouane, R.; Anli, M.; El Amerany, F.; Toubali, S.; Lahbouki, S.; Wahbi, S.; Meddich, A. Vulnerability of Oasis Agriculture to Climate Change in Morocco. In Impacts of Climate Change on Agriculture and Aquaculture; IGI Global: Hershey, PA, USA, 2019; pp. 76–106. [Google Scholar]
- FAOSTAT. 2020. Available online: http://www.fao.org/faostat/en/#home (accessed on 8 November 2020).
- Prashar, P.; Shah, S. Impact of Fertilizers and Pesticides on Soil Microflora in Agriculture. Sustain. Agric. Rev. 2016, 331–361. [Google Scholar] [CrossRef]
- Government Canada. Effects of Manure and Fertilizer on Soil Fertility and Soil Quality; Agriculture and Resource Development Departement: Big Lakes County, AB, Canada, 2013; p. 74.
- Hazra, G.; Das, T. A Review on Controlled Release Advanced Glassy Fertilizer. Glob. J. Sci. Front. Res. B Chem. 2014, 14, 4. [Google Scholar]
- Rubio, J.; Rodríguez, R.; Ciruelos, A.; Ruiz, O.; Lozano, P.A.; De La Torre, R. New glass fertilizer for tomato crops to reduce environmental impact. Acta Hortic. 2017, 1159, 65–72. [Google Scholar] [CrossRef]
- Karapetyan, G.; Karapetyan, K.; Maksimov, L. Glassy Environmentally Friendly Action Fertilizers of Prolonged. Phosphorus Res. Bull. 2004, 15, 60–67. [Google Scholar] [CrossRef]
- Mandal, B.; Hazra, G.; Ghosh, G.K.; Das, T. Leaching pattern of phosphate glass fertilizers with different compositions under Soxhlet distillation conditions. Ceramica 2020, 66, 250–255. [Google Scholar] [CrossRef]
- Labbilta, T.; Mesnaoui, M.; Aouad, H.; Abouliatim, Y.; Khouloud, M.; Abielaala, L. Study of the Effect of Calcium Substitution by Magnesium in the Vitreous System 3P2O5-2K2O-(1 − x) CaO-x MgO. Materials 2020, 13, 2637. [Google Scholar] [CrossRef]
- Ahmina, W.; El Moudane, M.; Zriouil, M.; Taibi, M. Role of manganese in 20K2O-xMnO-(80-x)P2O5 phosphate glasses and model of structural units. J. Mater. Environ. Sci. 2016, 7, 694–699. [Google Scholar]
- Wacławska, I.; Szumera, M.; Stoch, P.; Sitarz, M. Structural role of Fe in the soil active glasses. Spectrochim. Acta Part A Mol. Biomol. Spectrosc. 2011, 79, 728–732. [Google Scholar] [CrossRef] [PubMed]
- Ouis, M.A.; Ghoneim, N.A.; ElBatal, H.A.; Shedeed, S.I. Evaluation of the Suitability of Agriglasses Containing ZnO for Plant Fertilization. Silicon 2012, 4, 61–71. [Google Scholar] [CrossRef]
- Szumera, M.; Wačawska, I. Effect of molybdenum addition on the thermal properties of silicate-phosphate glasses. J. Therm. Anal. Calorim. 2012, 109, 649–655. [Google Scholar] [CrossRef]
- Sułowska, J.; Wacławska, I.; Olejniczak, Z. Effect of glass composition on the interactions between structural elements in Cu-containing silicate-phosphate glasses. J. Therm. Anal. Calorim. 2014, 116, 51–59. [Google Scholar] [CrossRef][Green Version]
- Tan, C.; Ifty, A.; Andrew, J.P.; Nusrat, S.; Chenkai, Z.; Jinsong, L.; Chris, D.R.; Xiaoling, L. Structural, thermal and dissolution properties of MgO- and CaO-containing borophosphate glasses: Effect of Fe2O3 addition. J. Mater. Sci. 2017, 52, 7489–7502. [Google Scholar] [CrossRef]
- Makhlouk, R.; Beloued, N.; Aqdim, S. Study of Chromium-Lead-Phosphate Glasses by XRD, IR, Density and Chemical Durability. Adv. Mater. Phys. Chem. 2018, 08, 269–280. [Google Scholar] [CrossRef]
- Ahmed, A.A.; Ali, A.A.; El-Fiqi, A. Glass-forming compositions and physicochemical properties of degradable phosphate and silver-doped phosphate glasses in the P2O5 -CaO-Na2O-Ag2O system. J. Mater. Res. Technol. 2019, 8, 1003–1013. [Google Scholar] [CrossRef]
- Elalaoui, A.C. Fertilisation Minérale des Cultures: Les élèments fertilisants majeurs (N, P, K). Transf. Technol. Agric. 2007, 155, 4. [Google Scholar]
- Baker, N.R. Chlorophyll fluorescence: A probe of photosynthesis in vivo. Annu. Rev. Plant Biol. 2008, 59, 89–113. [Google Scholar] [CrossRef] [PubMed]
- Bellucci, D.; Sola, A.; Salvatori, R.; Anesi, A.; Chiarini, L.; Cannillo, V. Role of magnesium oxide and strontium oxide as modifiers in silicate-based bioactive glasses: Effects on thermal behaviour, mechanical properties and in-vitro bioactivity. Mater. Sci. Eng. C 2017, 72, 566–575. [Google Scholar] [CrossRef] [PubMed]
- Akamatsu, H.; Fujita, K.; Murai, S.; Tanaka, K. Magneto-optical properties of transparent divalent iron phosphate glasses. Appl. Phys. Lett. 2008, 92, 90–93. [Google Scholar] [CrossRef]
- Elisa, M.; Grigorescu, C.; Vasiliu, I.; Bulinski, M.; Kuncser, V.; Dana, P.; Filoti, G.; Meghea, A.; Iftimie, N.; Giurginca, M.; et al. Optical characterization of the phosphate glasses containing pair transition ions. Opt. Quantum Electron. 2007, 39, 523–531. [Google Scholar] [CrossRef]
- Machado, I.E.C.; Prado, L.; Gomes, L.; Prison, J.M.; Martinelli, J.R. Optical properties of manganese in barium phosphate glasses. J. Non-Cryst. Solids 2004, 348, 113–117. [Google Scholar] [CrossRef]
- Dietzel, A.Z. Die Kationenfeldstärken und ihre Beziehungen zu Entglasungsvorgängen, zur Verbindungsbildung und zu den Schmelzpunkten von Silicaten. Phys. Chem. Chem. Phys. 2010, 48, 9–23. [Google Scholar]
- Schwarz, J.; Tichá, H.; Tichý, L.; Mertens, R. Physical properties of PbO-ZnO-P2O5 glasses I. Infrared and Raman spectra. J. Optoelectron. Adv. Mater. 2004, 6, 737–746. [Google Scholar]
- Franks, K.; Abrahams, I.; Georgiou, G.; Knowles, J.C. Investigation of thermal parameters and crytallisation in a ternary CaO-Na2O-P2O5 based glass system. Biomaterials 2000, 22, 497–501. [Google Scholar] [CrossRef]
- Omrani, R.O.; Krimi, S.; Videau, J.J.; Khattech, I.; El Jazouli, A.; Jemal, M. Structural investigations and calorimetric dissolution of manganese phosphate glasses. J. Non-Cryst. Solids 2014, 389, 66–71. [Google Scholar] [CrossRef]
- Nian, S.; Zhang, Y.; Li, J.; Zhou, N.; Zou, W. Glass formation and properties of sodium zinc phosphate glasses doped with ferric oxide. Adv. Appl. Ceram. 2018, 117, 319–327. [Google Scholar] [CrossRef]
- Chaudhry, M.A.; Altaf, M. Electrical properties of Na2O-CdO-P2O5 glasses. Mod. Phys. Lett. B 2000, 14, 319–326. [Google Scholar] [CrossRef]
- Kiani, A.; Hanna, J.V.; King, S.P.; Rees, G.J.; Smith, M.E.; Roohpour, N.; Salih, V.; Knowles, J.C. Structural characterization and physical properties of P2O5-CaO-Na2O-TiO2 glasses by Fourier transform infrared, Raman and solid-state magic angle spinning nuclear magnetic resonance spectroscopies. Acta Biomater. 2012, 8, 333–340. [Google Scholar] [CrossRef] [PubMed]
- Videau, J.J.; El Hadrami, A.; Labrugère, C.; Couzi, M.; Montagne, L.; Mesnaoui, M.; Maazaz, M. Structural influence of alumina in Zn-Cd-Pb phosphate glasses. Phys. Chem. Glas. Eur. J. Glas. Sci. Technol. Part B 2007, 48, 363–372. [Google Scholar]
- Velli, L.L.; Varsamis, C.P.E.; Kamitsos, E.I.; Möncke, D.; Ehrt, D. Structural investigation of metaphosphate glasses. Phys. Chem. Glas. 2005, 46, 178–181. [Google Scholar]
- Karakassides, M.A.; Saranti, A.; Koutselas, I. Preparation and structural study of binary phosphate glasses with high calcium and/or magnesium content. J. Non-Cryst. Solids 2004, 347, 69–79. [Google Scholar] [CrossRef]
- Griebenow, K.; Bragatto, C.B.; Kamitsos, E.I.; Wondraczek, L. Mixed-modifier effect in alkaline earth metaphosphate glasses. J. Non-Cryst. Solids 2018, 481, 447–456. [Google Scholar] [CrossRef]
- Ma, T.; Jivkov, A.P.; Li, W.; Liang, W.; Wang, Y.; Xu, H.; Han, X. A mechanistic model for long-term nuclear waste glass dissolution integrating chemical affinity and interfacial diffusion barrier. J. Nucl. Mater. 2017, 486, 70–85. [Google Scholar] [CrossRef]
- Utton, C.A.; Hand, R.J.; Bingham, P.A.; Hyatt, N.C.; Swanton, S.W.; Williams, S.J. Dissolution of vitrified wastes in a high-pH calcium-rich solution. J. Nucl. Mater. 2013, 435, 112–122. [Google Scholar] [CrossRef]
- Hasan, M.S.; Ahmed, I.; Parsons, A.J.; Walker, G.S.; Scotchford, C.A. Material characterisation and cytocompatibility assessment of quinternary phosphate glasses. J. Mater. Sci. Mater. Med. 2012, 23, 2531–2541. [Google Scholar] [CrossRef]
- Ahmina, W.; El Moudane, M.; Shaim, A.; Zriouil, M.; Taibi, M. Chemical durability, electrical and dielectric properties of the ternary system (50-x)K2O-xMnO-50P2O5 phosphate glasses. Mater. Today Proc. 2019, 13, 466–473. [Google Scholar] [CrossRef]
- Papadopoulos, N.; Drosou, C.A. Influence of weather conditions on glass properties. J. Univ. Chem. Technol. Metall. 2012, 47, 429–438. [Google Scholar]
- Döhler, F.; Mandlule, A.; Van Wüllen, L.; Friedrich, M.; Brauer, D.S. 31P NMR characterisation of phosphate fragments during dissolution of calcium sodium phosphate glasses. J. Mater. Chem. B 2015, 3, 1125–1134. [Google Scholar] [CrossRef] [PubMed]
- Reis, S.T.; Karabulut, M.; Day, D.E. Chemical durability and structure of zinc-iron phosphate glasses. J. Non-Cryst. Solids 2001, 292, 150–157. [Google Scholar] [CrossRef]
- Abou-Baker, N.H.; Ouis, M.; Abd-Eladl, M. Appraisal of Agriglass in Promoting Maize Production Under Abiotic Stress Conditions. Silicon 2018, 10, 1841–1849. [Google Scholar] [CrossRef]
- Ouis, M.A.; Abd-Eladl, M.; Abou-Baker, N.H. Evaluation of Agriglass as an Environment Friendly Slow Release Fertilizer. Silicon 2016, 10, 293–299. [Google Scholar] [CrossRef]
- Bindraban, P.S.; Dimkpa, C.O.; Pandey, R. Exploring phosphorus fertilizers and fertilization strategies for improved human and environmental health. Biol. Fertil. Soils 2020, 56, 299–317. [Google Scholar] [CrossRef]
- Ion, M.; Şerdinescu, A.; Pîrcălabu, L.; Sava, M. Use of vitreous fertilizers with slow release of nutrients in viticulture. Curr. Trends Nat. Sci. 2012, 1, 101–106. [Google Scholar]
- Liu, H.; Shi, C.Y.; Zhang, H.; Wang, Z.Z.; Chai, S. Effects of potassium on yield, photosynthate distribution, enzymes’ activity and ABA content in storage roots of sweet potato (Ipomoea batatas Lam.). Aust. J. Crop Sci. 2013, 7, 735–743. [Google Scholar]


| Glass | Nominal Compositions | |||||||||
|---|---|---|---|---|---|---|---|---|---|---|
| % P2O5 | % K2O | % CaO | % MgO | % Fe2O3 | % MnO | % ZnO | % B2O3 | % CuO | % MoO3 | |
| F0 | 50.00 | 33.33 | 11.11 | 5.56 | 0.00 | 0.00 | 0.00 | 0.00 | 0.00 | 0.00 |
| F1 | 50.81 | 32.26 | 10.75 | 5.38 | 0.81 | 0.00 | 0.00 | 0.00 | 0.00 | 0.00 |
| F2 | 50.00 | 32.89 | 10.96 | 5.48 | 0.00 | 0.66 | 0.00 | 0.00 | 0.00 | 0.00 |
| F3 | 50.72 | 31.51 | 10.50 | 5.25 | 0.79 | 0.63 | 0.32 | 0.16 | 0.11 | 0.02 |
| Analyzed Compositions | ||||||||||
| % P2O5 | % K2O | % CaO | % MgO | % Fe2O3 | % MnO | % ZnO | % B2O3 | % CuO | % MoO3 | |
| F0 | 50.17 ± 1.01 | 33.26 ± 0.83 | 11.07 ± 0.24 | 5.50 ± 0.17 | 0.00 | 0.00 | 0.00 | 0.00 | 0.00 | 0.00 |
| F1 | 50.64 ± 1.00 | 32.43 ± 0.90 | 10.52 ± 0.33 | 5.57 ± 0.17 | 0.84 ± 0.02 | 0.00 | 0.00 | 0.00 | 0.00 | 0.00 |
| F2 | 49.94 ± 1.22 | 33.07 ± 0.82 | 10.78 ± 0.23 | 5.50 ± 0.21 | 0.00 | 0.71 ± 0.01 | 0.00 | 0.00 | 0.00 | 0.00 |
| F3 | 50.99 ± 1.19 | 31.45 ± 0.78 | 10.37 ± 0.28 | 5.23 ± 0.15 | 0.77 ± 0.02 | 0.64 ± 0.01 | 0.26 ± 0.01 | 0.15 ± 0.02 | 0.13 ± 0.02 | 0.01 ± 0.01 |
| Glass | F0 | F1 | F2 | F3 |
|---|---|---|---|---|
| Tg (°C) | 340 ± 2 | 345 ± 2 | 348 ± 1 | 353 ± 1 |
| Tc,on (°C) | 417 ± 5 | 453 ± 2 | 453 ± 3 | 573 ± 2 |
| Tliq (°C) | 658 ± 3 | 699 ± 4 | 670 ± 2 | 709 ± 3 |
| KH | 0.319 ± 0.002 | 0.4391 ± 0.001 | 0.484 ± 0.002 | 0.528 ± 0.002 |
| Glass | F0 | F1 | F2 | F3 |
|---|---|---|---|---|
| Density | 3.341 ± 0.002 | 3.382 ± 0.003 | 3.371 ± 0.003 | 3.426 ± 0.005 |
| Wave Number (cm−1) | Assignment | |||||||
|---|---|---|---|---|---|---|---|---|
| F0 | F1 | F2 | F3 | - | ||||
| FTIR | Raman | FTIR | Raman | FTIR | Raman | FTIR | Raman | |
| 1296 | 1270 | 1288 | 1269 | 1286 | 1272 | 1296 | 1269 | Vas (PO2−), Q2 |
| 1159 | 1174 | 1155 | 1171 | 1151 | 1174 | 1159 | 1172 | Vs (PO2−), Q2 |
| 1107 | 1103 | 1109 | 1101 | 1105 | 1103 | 1105 | 1101 | Vs (PO32−), Q1 |
| 962–1074 | - | 956–1074 | - | 958–1072 | - | 956–1072 | - | Vas (PO2−), Q1 |
| 885 | - | 889 | - | 877 | - | 879 | - | Vas (P-O-P), Q2 |
| 761 | 758 | 767 | 758 | 767 | 759 | 771 | 760 | Vs (P-O-P), Q1 |
| 717 | 691 | 715 | 691 | 719 | 690 | 719 | 689 | Vs (P-O-P), Q2 |
| 557 | 382 | 547 | 385 | 543 | 383 | 549 | 386 | δ(PO2−) |
| 487 | 296–332 | 491 | 294–336 | 486 | 301–340 | 491 | 290–335 | δ(PO32−) |
| Glass | F0 | F1 | F2 | F3 |
|---|---|---|---|---|
| V0 (g/day) | 0.69 | 0.14 | 0.17 | 0.03 |
| Fertilizer Treatment | Plant Height (cm) | Root Length (cm) | Number of Leaves | Leaf Area (cm2) | Shoot Fresh Weight (g) | Shout Dry Weight (g) | Root Fresh Weight (g) | Root Dry Weight (g) | Ear Fresh Weight (g) | Ear Dry Weight (g) | Total Grain Weight/Plant (g) | Number of Grain/Plant | 1000 Grain Weight (g) | Stomatal Conductance (mmol m−2 s−1) | Fv/Fm |
|---|---|---|---|---|---|---|---|---|---|---|---|---|---|---|---|
| Control | 60.43 ± 1.34 j | 17.33 ± 0.58 i | 5.33 ± 0.58 d | 17.85 ± 0.26 h | 2.27 ± 0.61 f | 0.5 ± 0.13 g | 0.95 ± 0.20 h | 0.23 ± 0.05 h | 1.18 ± 0.27 f | 0.68 ± 0.12 h | 0.46 ± 0.05 ef | 18.67 ± 3.21 f | 16.78 ± 0.87 i | 17.63 ± 1.66 j | 0.65 ± 0.03 g |
| NPK fertilizer | 67.27 ± 0.25 i | 18.67 ± 0.58 ghi | 7.00 ± 0.00 a | 28.60 ± 2.20 d–g | 3.44 ± 0.32 e | 0.88 ± 0.05 ef | 1.83 ± 0.10 de | 0.26 ± 0.11 gh | 1.99 ± 0.28 e | 0.74 ± 0.15 gh | 0.44 ± 0.10 f | 25.67 ± 4.04 b–f | 27.79 ± 4.22 cde | 23.37 ± 2.69 i | 0.74 ± 0.03 a–f |
| F0 R1 | 75.17 ± 2.75 d–g | 26.33 ± 1.15 a | 6.00 ± 0.00 bcd | 25.39 ± 2.94 fg | 3.75 ± 0.21 de | 1.20 ± 0.08 bc | 1.65 ± 0.15 ef | 0.43 ± 0.02 c–f | 1.99 ± 0.30 e | 0.87 ± 0.15 e–h | 0.47 ± 0.03 def | 25.67 ± 2.08 b–f | 22.18 ± 3.18 e–i | 22.33 ± 0.38 i | 0.68 ± 0.05 efg |
| F0 R1 + N | 82.13 ± 2.73 d–g | 23.00 ± 1.00 b–e | 6.33 ± 0.58 abc | 26.90 ± 2.71 efg | 4.52 ± 0.21 a–d | 1.23 ± 0.10 bc | 1.51 ± 0.18 efg | 0.33 ± 0.06 fgh | 2.42 ± 0.09 b–e | 1.06 ± 0.08 c–f | 0.71 ± 0.04 bcd | 28.33 ± 3.79 a–d | 24.02 ± 3.27 d–h | 25.33 ± 3.12 ghi | 0.80 ± 0.01 ab |
| F0 R2 | 82.10 ± 1.13 ab | 20.00 ± 0.00 f–i | 6.00 ± 0.00 abc | 39.42 ± 2.48 a | 4.49 ± 0.28 a–d | 1.37 ± 0.09 ab | 1.55 ± 0.35 efg | 0.49 ± 0.07 bcd | 2.88 ± 0.11 abc | 1.12 ± 0.13 b–e | 0.78 ± 0.15 abc | 30.67 ± 1.15 abc | 26.08 ± 2.94 c–g | 24.60 ± 1.22 ghi | 0.72 ± 0.05 efg |
| F0 R2 + N | 74.00 ± 2.21 d–h | 24.67 ± 1.53 abc | 6.33 ± 0.58 abc | 27.15 ± 1.93 efg | 5.01 ± 0.80 ab | 1.34 ± 0.01 ab | 1.58 ± 0.11 efg | 0.34 ± 0.07 e–h | 2.39 ± 0.19 b–e | 0.82 ± 0.11 fgh | 0.49 ± 0.13 def | 24.33 ± 5.13 c–f | 20.10 ± 1.83 ghi | 22.60 ± 2.21 i | 0.71 ± 0.03 d–g |
| F1 R1 | 80.23 ± 4.20 abc | 24.67 ± 2.89 abc | 5.67 ± 0.58 cd | 34.89 ± 2.52 a–d | 5.10 ± 0.85 a | 1.33 ± 0.19 ab | 1.87 ± 0.55 de | 0.32 ± 0.03 fgh | 3.15 ± 0.32 a | 1.33 ± 0.12 bc | 0.88 ± 0.12 abc | 33.33 ± 2.52 a | 26.43 ± 1.66 c–f | 27.27 ± 0.59 efg | 0.78 ± 0.06 a–d |
| F1 R1 + N | 77.00 ± 2.78 c–f | 23.33 ± 0.76 bcd | 6.33 ± 0.58 abc | 32.79 ± 4.45 a–e | 4.94 ± 0.24 abc | 1.32 ± 0.05 ab | 1.54 ± 0.17 efg | 0.44 ± 0.10 c–f | 3.09 ± 0.38 a | 1.25 ± 0.21 bcd | 0.81 ± 0.09 abc | 30.33 ± 3.21 abc | 24.06 ± 2.44 d–h | 28.37 ± 1.27 ef | 0.71 ± 0.01 c–g |
| F1 R2 | 82.77 ± 2.68 ab | 23.33 ± 0.58 bcd | 7.00 ± 0.00 a | 38.13 ± 3.95 ab | 5.26 ± 0.69 a | 1.43 ± 0.13 a | 2.29 ± 0.32 c | 0.54 ± 0.05 abc | 3.08 ± 0.34 abc | 1.34 ± 0.14 bc | 0.91 ± 0.15 ab | 30.33 ± 0.57 abc | 30.41 ± 4.75 c | 22.93 ± 1.56 i | 0.79 ± 0.04 abc |
| F1 R2 + N | 74.23 ± 1.07 d–h | 22.00 ± 2.65 c–f | 6.00 ± 0.00 bcd | 24.96 ± 1.28 fg | 4.91 ± 0.37 abc | 1.30 ± 0.07 ab | 1.55 ± 0.16 efg | 0.28 ± 0.01 gh | 2.93 ± 0.22 abc | 1.12 ± 0.15 b–e | 0.76 ± 0.10 abc | 30.00 ± 2.65 abc | 19.97 ± 0.53 hi | 23.83 ± 1.60 hi | 0.68 ± 0.03 fg |
| F2 R1 | 82.87 ± 2.73 a | 25.00 ± 2.00 ab | 6.33 ± 0.58 abc | 34.11 ± 6.20 abc | 4.54 ± 0.57 a–d | 1.35 ± 0.12 ab | 2.80 ± 0.20 b | 0.61 ± 0.09 ab | 2.77 ± 0.11 abc | 1.23 ± 0.09 bcd | 0.86 ± 0.11 abc | 22.33 ± 5.69 def | 45.54 ± 4.08 a | 44.33 ± 0.59 a | 0.77 ± 0.06 a–e |
| F2 R1 + N | 69.77 ± 0.97 hi | 17.33 ± 0.58 i | 7.00 ± 0.00 a | 32.22 ± 5.57 b–f | 3.41 ± 0.69 e | 0.92 ± 0.04 ef | 1.23 ± 0.09 fgh | 0.31 ± 0.06 fgh | 2.15 ± 0.39 de | 0.96 ± 0.19 d–h | 0.64 ± 0.14 c–f | 27.67 ± 1.53 a–d | 20.78 ± 0.67 fgh | 28.70 ± 0.87 ef | 0.76 ± 0.02 a–f |
| F2 R2 | 82.90 ± 4.37 a | 27.00 ± 2.00 a | 7.00 ± 0.00 a | 36.07 ± 2.19 abc | 4.75 ± 0.38 abc | 1.29 ± 0.12 ab | 4.75 ± 0.38 a | 0.51 ± 0.03 abc | 2.99 ± 0.27 ab | 1.17 ± 0.36 bcd | 0.80 ± 0.14 abc | 26.00 ± 3.60 a–e | 39.04 ± 8.53 b | 26.50 ± 1.70 fgh | 0.82 ± 0.04 a |
| F2 R2 + N | 78.47 ± 2.47 a–d | 21.33 ± 2.31 d–g | 7.00 ± 1.00 a | 31.69 ± 3.32 b–f | 4.63 ± 0.58 a–d | 1.25 ± 0.06 abc | 2.10 ± 0.09 cd | 0.46 ± 0.08 cde | 2.93 ± 0.36 abc | 1.31 ± 0.19 bc | 0.91 ± 0.14 ab | 32.67 ± 4.51 ab | 28.89 ± 1.23 cd | 38.03 ± 0.91 bc | 0.70 ± 0.07 efg |
| F3 R1 | 76.87 ± 2.32 c–f | 18.20 ± 1.56 hi | 6.67 ± 0.58 ab | 25.45 ± 1.50 fg | 3.56 ± 0.16 e | 0.98 ± 0.12 def | 1.63 ± 0.11 ef | 0.38 ± 0.05 d–g | 2.35 ± 0.04 cde | 1.05 ± 0.04 c–f | 0.71 ± 0.02 bcd | 27.33 ± 2.08 a–e | 27.30 ± 1.76 cde | 37.17 ± 1.22 bcd | 0.74 ± 0.05 a–f |
| F3 R1 + N | 73.57 ± 2.06 e–h | 20.33 ± 0.57 e–h | 6.67 ± 0.57 ab | 30.30 ± 3.54 c–f | 3.33 ± 0.13 e | 0.96 ± 0.08 def | 1.14 ± 0.16 gh | 0.25 ± 0.04 gh | 2.63 ± 0.21 a–d | 2.13 ± 0.15 a | 0.71 ± 0.14 bcd | 31.00 ± 5.20 abc | 23.80 ± 1.97 d–h | 35.33 ± 0.78 cd | 0.78 ± 0.03 a–d |
| F3 R2 | 78.03 ± 3.10 b–e | 20.67 ± 1.53 d–h | 7.00 ± 0.00 a | 35.60 ± 1.05 a–d | 4.15 ± 0.07 b–e | 1.10 ± 0.04 cd | 2.20 ± 0.19 cd | 0.62 ± 0.07 a | 2.96 ± 0.22 abc | 1.37 ± 0.04 b | 0.98 ± 0.05 a | 32.67 ± 1.15 ab | 30.14 ± 2.13 c | 39.00 ± 1.47 b | 0.81 ± 0.02 a |
| F3 R2 + N | 72.87 ± 3.07 fgh | 18.00 ± 1.00 hi | 7.00 ± 0.00 a | 22.84 ± 0.0.28 gh | 3.45 ± 0.37 e | 0.85 ± 0.05 f | 1.17 ± 0.05 gh | 0.37 ± 0.09 d–g | 2.43 ± 0.13 b–e | 0.99 ± 0.06 d–g | 0.70 ± 0.06 b–e | 28.00 ± 1.73 a–d | 24.86 ± 0.69 c–h | 34.50 ± 2.11 d | 0.76 ± 0.04 a–f |
Publisher’s Note: MDPI stays neutral with regard to jurisdictional claims in published maps and institutional affiliations. |
© 2021 by the authors. Licensee MDPI, Basel, Switzerland. This article is an open access article distributed under the terms and conditions of the Creative Commons Attribution (CC BY) license (http://creativecommons.org/licenses/by/4.0/).
Share and Cite
Labbilta, T.; Ait-El-Mokhtar, M.; Abouliatim, Y.; Khouloud, M.; Meddich, A.; Mesnaoui, M. Elaboration and Characterization of Vitreous Fertilizers and Study of Their Impact on the Growth, Photosynthesis, and Yield of Wheat (Triticum durum L.). Materials 2021, 14, 1295. https://doi.org/10.3390/ma14051295
Labbilta T, Ait-El-Mokhtar M, Abouliatim Y, Khouloud M, Meddich A, Mesnaoui M. Elaboration and Characterization of Vitreous Fertilizers and Study of Their Impact on the Growth, Photosynthesis, and Yield of Wheat (Triticum durum L.). Materials. 2021; 14(5):1295. https://doi.org/10.3390/ma14051295
Chicago/Turabian StyleLabbilta, Tariq, Mohamed Ait-El-Mokhtar, Younes Abouliatim, Mehdi Khouloud, Abdelilah Meddich, and Mohamed Mesnaoui. 2021. "Elaboration and Characterization of Vitreous Fertilizers and Study of Their Impact on the Growth, Photosynthesis, and Yield of Wheat (Triticum durum L.)" Materials 14, no. 5: 1295. https://doi.org/10.3390/ma14051295
APA StyleLabbilta, T., Ait-El-Mokhtar, M., Abouliatim, Y., Khouloud, M., Meddich, A., & Mesnaoui, M. (2021). Elaboration and Characterization of Vitreous Fertilizers and Study of Their Impact on the Growth, Photosynthesis, and Yield of Wheat (Triticum durum L.). Materials, 14(5), 1295. https://doi.org/10.3390/ma14051295