Abstract
In this research, phase transformation and the role of NaOH on the structure of coal fly ash (CFA) during an alkali-calcination process were identified by a combination of X-ray powder diffraction (XRD), Fourier transform infrared (FTIR) and deconvolution analysis. The variation in the different functional groups and structural parameters of the raw and post-alkali calcinated CFA were analysed by deconvolution of the FTIR results, conducted with a Gaussian approach. The results, firstly, provide a deep insight into the functional groups in CFA. In CFA systems, the vibration signals of Q0, Q1, Q2 and Q3 were detected and the dominant structural units associated with Si tetrahedron groups were isolated to Q3 and Q2. Deconvolution analysis of the band from 400 to 1400 cm−1 showed that the added NaOH resulted in an increase in Q1 at the cost of Q3 and Q2 and the degree of reaction of the CFA was, therefore, decreased. Concurrently, it was established that the changes in the Gaussian peak component were related to the calcination temperature and time that allowed us to tailor the model of the structural decomposition of CFA.
1. Introduction
Coal fly ash (CFA) is a typical coal-based solid waste that is produced in enormous amounts [1,2]. The production of CFA is expected to increase with economic increases, particularly in China, where the economy has displayed spectacular gross domestic product (GDP) growth in the last 30 years [3]. Currently, the inadequate processing of CFA can cause serious harm to cultivated land, groundwater pollution and regional air pollution of CFA landfills [4,5,6]. Hence, production, storage and transportation of CFA have been rigorously enforced by environmental protection regulations in order to reduce the damages as much as possible. Recycling of secondary resources has become essential with the depletion of primary resources [7]. The majority of CFA is used for constructing roads, the production of building sectors (bricks, blocks, tiles, etc.) [8] and in the concrete and cement manufacturing industries [9]. The increasing enforcement of environmental standards has forced researchers around the world to earnestly explore the development of high-quality treatments for CFA. Nevertheless, the progress of research for treating CFA is far behind that concerning the application of CFA in construction because of the complicated physio-chemical properties of CFA [10].
CFA is an incredibly complex anthropogenic material to characterize [11]. The characteristics of CFA are inherently heterogeneous, mainly depending on upstream raw materials, fuel combustion equipment, gas purification equipment and quenching process [12,13]. The CFA structure corresponds to a micro-crystal model, which means that it contains some small-scale micro-crystals in the matrix of its glass phase. It is also broadly described as a mixture of poor crystalline phases with hematite, magnetite, mullite quartz, as well as aluminosilicate glass phases [14]. The major constituents (Si, Ca, Al, K, Fe and so on) and trace elements (As, Ba, Co, Ni, U, Zr and other heavy metals) [15] occur as minerals and compounds in glass and other minerals and phases [16]. Another aspect of the inherent heterogeneities is that CFA often has a surface layer thickness ranging from nm to μm, formed from the readily-leachable material deposited while cooling [17]. In fact, the chemical composition and structure can be different between the outer layer and the interior of a single particle depending on the thermal history of the CFA [18]. The structure of the amorphous, or glassy, metal is a crucial parameter that defines the reactivity of the CFA [19]. It is known that the main glass network formers are Si4+ and Al3+ [20], and that these cations act as network modifiers in the CFA glass network [21]. Alkali calcination technology is an advanced and effective pre-treatment technique, during which the strong bonds between the silica and the metal within the compound can be disrupted. This allows a more effective release of the metal atoms from the SiO4 tetrahedrons [22]. Therefore, some studies [23,24,25] of hydrometallurgical alkaline explored approaches to removal silica from CFA. It is worth mentioning that there were indisputable benefits for the alkali-calcination step form shortening the time for zeolitisation and reducing the inclusion of amorphous-crystalline textures, thereby helping to purify the zeolite crystal phase [26,27,28]. Geopolymers are generally synthesized by conventional alkali mixing methods [29]. Additionally, researchers have obtained geopolymers after geopolymerisation of alkali calcinated CFA at a rate of 83.941 m2/g [30]. Alkali calcination reduces the complexity of the binder phases and reduces the amount of unreacted raw material, resulting in faster geopolymerisation. Furthermore, alkali calcination plays an important role in the high-efficiency recovery of valuable metals, especially REE from CFA [31]. It was noted that the leaching rate after alkali calcination was higher than that of conventional direct leaching [32]. Despite this progress, no in-depth research has been conducted to clarify the detailed chemical structure of CFA during the alkali calcination and there is still a lack of knowledge about the relative effects of experimental conditions on the evolution of the microstructure. In this study, fourier transform infrared spectroscopy (FTIR) was used to detect the slight changes occur in the bonding environment surrounding functional groups, and the variation in the functional groups was semi-quantitatively analysed by deconvolution of the spectrum. Furthermore, X-ray powder diffraction (XRD) and scanning electron microscopy (SEM) were used to determine phase transformation and changes of microstructure of CFA in the process of calcination.
2. Experimental
2.1. Sample Materials and Their Characterization
CFA Samples used in this research were collected from Da Tang coal-fired power plant located in Inner Mongolia of China. Analysis with an X-ray fluorescence spectrometer showed that the CFA was mainly composed of Al2O3 and SiO2, which together accounted for over 85.94% of the CFA. The chemical composition of the CFA was shown in Table 1. Due to the low Ca content, the CFA was classified as low calcium siliceous CFA. Table 1 also shows the Loss on ignition (LOI) of CFA was 3.41%, a low LOI value indicates that the CFA contains a large proportion of mineral ash.

Table 1.
Chemical composition of CFA.
The size distribution of the raw CFA was measured by a laser particle size analyser (Zetasizer Nano Zs90, Malvern, UK). Figure 1a shows that particle of sizes less than 6.663, 21.13, 58.85, 122.8 and 193.2 μm were present in 10%, 25%, 50%, 75% and 90% of the CFA, respectively.
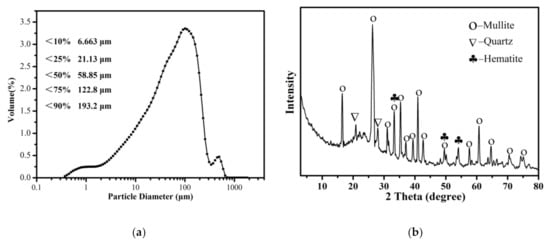
Figure 1.
(a) The particle size distributions of the raw CFA powder.(b) The XRD pattern of the raw CFA powder.
It can be seen from Figure 1b that mullite was the main mineral component of the CFA. In addition, some peaks that appeared in the XRD spectrum, matched well with the standard quartz (SiO2) structure. XRD patterns also show the presence of hematite. A broad diffraction “hump” was observed in the region of 15° to 30° indicating the presence of an amorphous glass phase in the raw CFA [33].
Analytically pure NaOH was used to roast the CFA at high temperatures. All reagents are made by Kelong Chemical Co. Ltd., Chengdu, China. Deionised water was used in all the experiments.
2.2. Experimental Procedure and Apparatus
The raw CFA was oven-dried to a constant weight at 105 °C for 24 h. In each experiment, 2 mL deionised water was added to increase the plasticity of the mixture, which was prepared by thoroughly mixing the CFA and NaOH using a mortar and pestle. Then, the samples were pressed in cylindrical steel dies with 30 mm diameter and 10 mm thickness, using a pressure of 8 MPa. This was done in order to prevent sintering behaviour between the sintered body and the corundum crucible at high temperatures. Next, when the temperature of the muffle furnace reached a predetermined temperature, the samples were placed in a cylindrical alumina crucible and isothermally calcined with free access to air. The reaction process was stopped after different lengths of time which points the molten product was rapidly removed from the muffle furnace and cooled in a dryer. Table 2 shows the mix designs adopted for the mixture along with their corresponding CFA/NaOH mass ratios and the sample labels are suffixed by the corresponding calcination temperature and calcination time. Finally, all of the cooled alkali-calcination products were ground and leached in water for 120 min at 60 °C, with continuous stirring. At the end of each leaching experiment, the slurry was filtered via a vacuum filter. The insoluble residues were washed with deionised water until a neutral pH was reached, then the remaining residues were dried and sampled for analysis.
Table 2.
Modification condition of CFA.
2.3. Characterization Techniques
The X-ray diffractometer (XRD, Ultima IV, Akishima, Japan) was utilized to analysis the difference of samples after alkali-calcination and the phases of CFA. The surface functional groups of CFA and its residues being leached with deionized water were analyzed by Fourier transform infrared spectroscopy (FTIR, Nicolet-5700, Madison, WI, USA) from 400 to 4000 cm−1 by means of the KBr tablet method. The microstructural development and chemical characteristics of samples were studied by a scanning electron microscope (SEM, Zeiss Instruments, Oberkochen, Germany) equipped with energy dispersive spectroscopy (EDS, Oxford, UK). To obtain clearer SEM pictures, the surface of samples was treated by gold plating, an EDS microanalysis instrument operating at an accelerating voltage of 10 kv in a high vacuum mode.
3. Results and Discussion
3.1. Analysis for Activated CFA by NaOH Calcination
In Figure 2, XRD results of the starting-CFA, reference samples calcined at 400 °C and 600 °C were presented, the mass ratio of the NaOH to CFA was 1:4. The mullite phase almost completely disappeared when the calcination temperature at 400 °C. Moreover, the quartz almost disappeared, while sodium aluminosilicate appeared in samples. This indicates that the mullite starts transforming in to the active NaAlSiO4 phase when the temperature at 400 °C. Additionally, as shown in Figure 2a,b, the Na2CO3 phase were detected. A possible explanation is that as the calcination time increased, further destruction of the CFA aggregation occured, which was achieved by increasing the exposure of unburned carbon that could react with NaOH. Furthermore, the excess NaOH might have reacted with CO2 in the air to form Na2CO3.
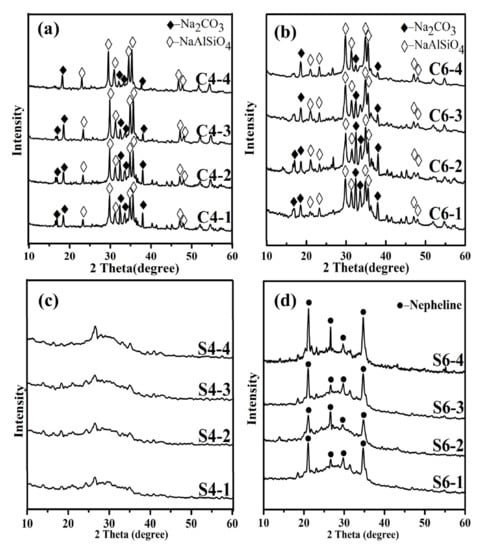
Figure 2.
XRD analysis of CFA samples roasted at different temperatures (a) 400 °C (b) 600 °C and after water leaching of the cake (c,d).
The XRD diffractions patterns of the water-leached residues were compared between Figure 2c,d. The mentioned hump in the diffraction patterns moved towards the 2θ angle positions approximately between 20° and 35°, while the intensity decreased. This change is related to the formation of a reaction compound in the amorphous phase [34,35]. The strong peaks belonging to quartz and mullite present in the raw CFA became significantly weaker in the diffractions of water-leached residues, which further indicates that quartz and mullite can be transformed into water-soluble phases at 400 °C, and the extraction rates were 8.62% and 9.86% for alumina and silica, respectively. The chemical composition of water-leached residues was shown in Table 3. There were also some differences in the XRD diffractions with the increase in temperature. The phase changes shown in Figure 2d indicate that nepheline appeared with the increase in the calcination temperature. It also presented broad peaks at 20°–35°. The phase changes shown in Figure 2d indicate that nepheline appeared with excessive NaOH addition under the higher calcination temperature (600 °C). Therefore, it can be concluded that sodium aluminosilicate is preferentially formed. Based on the above analysis, the following reactions were predicted to occur during the calcination experiment.
Table 3.
Chemical composition of the sample after water leaching.
Reaction temperature: 400–600 °C.
Al6Si2O13(mullite) + 6NaOH + 4SiO2 → 6NaAlSiO4(nepheline) + 3H2O
Al6Si2O13(mullite) + 6NaOH + 10SiO2 → 6NaAlSi2O6 + 3H2O
3.2. FTIR Characterization
The functional groups of raw CFA, S4-1, S4-2, S4-3, S4-4, S6-1, S6-2, S6-3 and S6-4 can be determined from the FTIR spectra in Figure 3. As shown in the Figure 3a. The IR region at 3446 cm−1 consists of vibrations due to water, hydroxyl or similar groups [36]. The peak at 1644 cm−1 was assigned to molecular water [37].

Figure 3.
FTIR spectra of (a) CFA, and (b) alkali calcinated slags after contact with water. CFA was dried at 105 °C for 48 h.
There were characteristic peaks in the range 800–1200 cm−1, which corresponded to the Si-O stretching vibration in the Qn units, where n refers to the bridging oxygen, known as Q4, Q3, Q2, Q1 and Q0 [38,39]. The existence of broad absorption bands means the long-range disorder in CFA structure and the wide existence of Qn units [40]. On the other hand, lower wavenumbers (1000 cm−1) could also have been caused by the incorporation of a larger amount of Al into the silicate backbone [41,42]. The FTIR spectra showed a decrease in absorption bands at 719 cm−1, which was attributed to the asymmetric and symmetric vibrations of Si-Ob-Al (Ob stands for bridging oxygen) [43]. These changes are consistent with more Si-Ob-Al groups being broken as the temperature increased, and with the presence of more Qn units. The FTIR spectra clearly indicated that decomposition of the CFA silicate network occurred. XRD analysis showed that sodium aluminiosilicate (a type of Q0 silicate species) appears when the Si-O bonds are decomposed by NaOH. Moreover, a series of signals in the 611 cm−1, typical of an Al-O band from aluminium-oxygen octahedron (AlO6) stretching vibrations [44].
The FTIR absorption spectra of S6-1, 2, 3 and 4 are shown in Figure 3b. In the spectra of S6-1 and S6-2, the most intense absorption bands lay in the 750–1250 cm−1 region, the next most intense between 540 and 750 cm−1 and the least intense between 1350 and 1550 cm−1. Note that the FTIR analyses of S6-3 and S6-4 showed a decrease in absorption bands in the 750–1250 cm−1 region as the calcination time increased. In addition, the FTIR analyses of S6-4 and S6-3 showed more consistent vibrations appearing in the range of 1423 cm−1, where the peaks appeared sharper than the vibrational peaks of S6-1 and S6-2. This band is related to the formation of nepheline by the reaction of NaOH with CFA. A detailed deconvolution analysis of the FTIR spectra and reasonable interpretation of the resolved bands can further help in understanding the various structural units of CFA.
3.3. Deconvolution Methods
In principle, the measured FTIR spectra represent a combination of multiple overlapping peaks. The relative amount of particular types of atomic bonds and structures can be estimated from the relative area of these peaks [45]. The main band corresponding to the Si(Al)-O-Si bond asymmetric stretching vibrations was more thoroughly investigated to acquire a more comprehensive understanding of the effect of NaOH on raw CFA during the alkali calcination process. An empirical deconvolution method was carried out, and the overlapping spectra are studied in more detail. This involved fitting the overlapping peaks generated in the 800 to 1300 cm−1 spectral range to a theoretical Gaussian curve. The R2-value of the combination of the deconvolved peaks to the original peaks was greater than 0.99.
The Gaussian bands fitted to the IR spectra of CFA, S4-1, S4-2, S4-3 and S4-4 are shown in Figure 4. It could be seen from the deconvolution results that the 800–1300 cm−1 band was characterized by multiple sharp peaks, indicating the diversity of functional groups. The absorption signal that occurred between 1139 and 1161 cm−1 was associated with asymmetric stretching of Si (Al)-O-Si in mullite or mullite-like structures [46]. The component bands located around 1100 cm−1 were associated with the presence of Q3 units in the amorphous glasses [47]. Respectively, as the activation time increased, both peaks decreased in intensity. This could be ascribed to the increase in metal cations in the outer body of the glass network breaking the Si-O and Al-O. The absorbance ratio of the symmetric stretching of Si-O-Si in the Q3 unit and asymmetric stretching of (Si, Al)-O-Si in the amorphous glasses were also observed to decrease with increased activation time, which reveals that the number of functional groups decreased after calcination. The peak assignments of the deconvolved bands in the 800 to 1300 cm−1 range of the spectrum are given in Table 4.
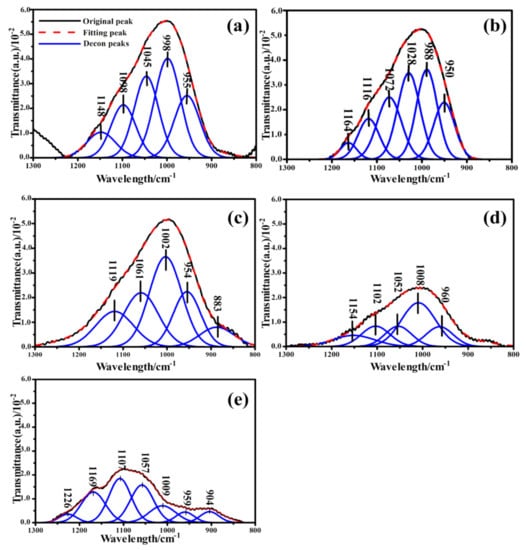
Figure 4.
(a) Deconvolution of the FTIR spectra of CFA in the region between 1300 and 800 cm−1; Deconvolution of the FTIR spectra of samples calcined at 400 °C in the region between 1300 and 800 cm−1. The reaction time of (b) 0.5 h; (c) 1 h; (d) 15 h; (e) 2 h.
Table 4.
Assignment of the deconvolved bands [48].
Comprehensive consideration of the number of functional groups consumed in the 800–1300 cm−1 band reflected the degree of three-dimensional structural degradation in the samples. To quantify the active bonds, it was assumed that the relative areas of the resolved bonds were proportional to their concentration in the samples. Overall, the content of functional groups after the alkali calcination was significantly reduced. According to Figure 5 and the FTIR spectra deconvolution data, it can be seen that (Si, Al)-O-Si in the amorphous glasses, followed by Si-O-Si in the Q2 and Q3 units, were the most consumed functional groups during the alkali calcination process. The (Si, Al)-O-Si in the Q3 units were largely consumed. Alkali calcination removes various functional groups from the CFA by breaking the chemical bonds. Therefore, Q3 structures were the most active functional groups in the alkali calcination process, followed by Q2 structures. The obtained results suggest that the glass partially denatured with NaOH, losing a large fraction of its chain-like and branched-chain structures. Consistent with previously reported studies [49], the network of the CFA particles broken under the action of OH−. Moreover, as the concentration of OH− increases, the damage to the network became more intense [50]. Therefore, this clearly indicates that destruction of the aluminosilicate network occurred in the glass.
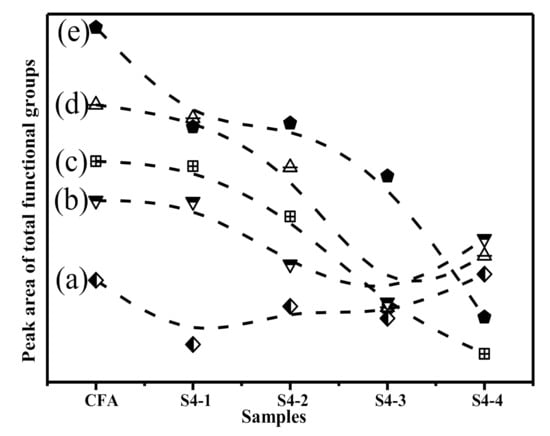
Figure 5.
The area under each Gaussian function of samples: (a) Asymmetric stretching of (Si,Al)-O-Si in mullite or mullite-like structures. (b) Asymmetric stretching of (Si,Al)-O-Si in Q3 units; (c) Symmetric stretching of Si-O-Si in Q2 units; (d) Symmetric stretching of Si-O-Si in Q3 units; (e) Asymmetric stretching of (Si,Al)-O-Si in amorphous glasse.
Standard procedures for resolving the FTIR curve of the samples were followed to obtain the deconvoluted spectra to gain detailed information on the functional groups and their linkages in the studied samples (S6-1, S6-2, S6-3 and S6-4). Figure 6 shows the deconvoluted spectra and the assignment of bands in the 1300–800 cm−1 region. Based on the fitted curve, four bands were distinguished. Hence, the deconvolution of the spectra provides information about the complex composition of different bands that had been masked in the unresolved spectra [51]. These masked bands occurred at about 1110, 1020, 959 and 849 cm−1. It was also observed that there was good correspondence between the above absorption peak positions of the deconvoluted spectra and those in the original spectra of the studied samples. The absorption peak intensity of S6-1 and S6-2 was significantly higher than that of S6-3 and S6-4, which reveals that the number of functional groups has a certain impact on the calcination additives at higher temperatures.
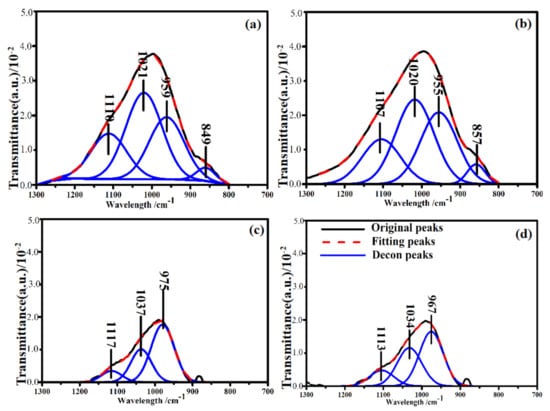
Figure 6.
Deconvolution of the FTIR spectra of samples calcined at 600 °C in the region between 1300 and 800 cm−1. The reaction time of (a) 0.5 h; (b) 1 h; (c) 1.5 h; (d) 2 h.
A peak was observed in S6-1 centred at 1110 cm−1 (Figure 6a), which is due to asymmetric stretching of the Si-O-Si in Q3 units. This peak was also present in S6-2, S6-3 and S6-4. The area of this peaks was higher in S6-1 and S6-2 compared to S6-3 and S6-4 (Figure 7). When the glass structure was broken in the alkali calcination reactions, the peaks related to Q3 units reduce in the CFA. The peak at 1020 cm−1 which was attributed to asymmetric stretching of (Si, Al)-O-Si in the amorphous glasses reduced as the reaction time increased, The variation in the wavenumbers of the samples shows the differences in the Al substitution in the structure of the studied samples. Symmetric stretching of Si-O-Si in the Q2 units was the main contribution to the 955 cm−1 area bands. The peak areas were found to vary in an identical manner as already discussed earlier in the results. The availability of Si and Al in the alkali calcination reactions could be the reasons for reduced functional groups.
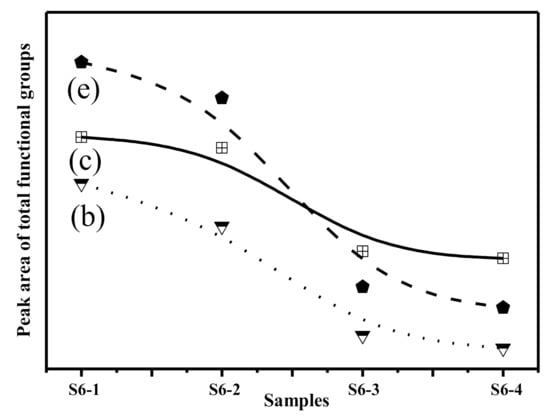
Figure 7.
Variation of functional groups after alkaline activation. (b) Asymmetric stretching of (Si, Al)-O-Si in Q3 units; (c) Symmetric stretching of Si-O-Si in Q2 units; (e) Asymmetric stretching of (Si, Al)-O-Si in amorphous glasses.
3.4. SEM and EDS Analysis
SEM analysis was conducted on the ultrapure washed samples (Figure 8). A zoomed image taken at 2500× magnification showed large-diameter spheres enclosing sub-microspheres. The SEM images also showed some irregularly shaped particles, cohesive bodies, and debris of spheres; these materials appeared more irregular. The surfaces of the CFA spheres were relatively smooth at the scale of observation allowed by the SEM, regardless of the particle size. Morphological changes were observed with the change in calcination time. With increasing reaction time, the number of spherical particles started to decrease. Although the larger particles kept their ball-like skeletal structure, they exhibited cracks on their surfaces at high magnification (Figure 8b). This also indicated that there was an abundant amount of NaOH dissolved Si and Al on the surface of the CFA under high-temperature conditions. Under the elevated temperature, NaOH tended to melt and form liquid phases, and the increase in fluidity resulted in the further destruction of the CFA structure. It can be noticed form in Figure 8d,e that there were typical morphologies after reaction. Figure 8f show that the complete dissolution of CFA particles is not achieved even after long reaction times. In addition, the mullite particles with an acicular structure was also found in in sample (S4-4) (Figure 8g,h).
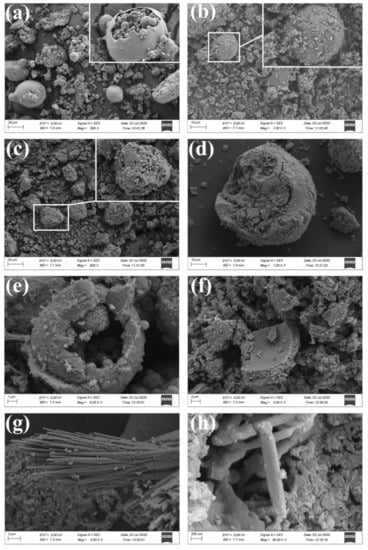
Figure 8.
SEM micrographs of the solid samples with variation in calcination time; (a) CFA, (b) S4-1, (c) S4-2, (d,e), S4-3, (f), S4-4. SEM micrographs of the mullite particles with an acicular structure in sample (S4-4) (g,h).
The apparent-shape micrographs and the element composition of the CFA and S4-4 are illustrated in Figure 9. In order to further determine the distribution of each element in the CFA and S4-4, the EDS spectra of two selected areas (labelled 1 and 2) were analysed. From Figure 9a, it can be found that the elemental composition of area 1 included many roughly similar spherical solids, mainly containing the elements of Al, O, Si and Fe (and occasionally K and Ca), which have been reported to reside within the structure of CFA [52]. The spherical solids were cryptocrystalline aluminosilicates which comprised Al, Si and O. As the EDS images suggest (Figure 9i), other elements such as Fe were distributed in a more random pattern. The analysis also shows high concentrations of Na (Figure 9k), but Na is not actually an original element of the CFA. It is thought that calcination using NaOH as an ionised solvent plays an important role in the dissolution of Si4+ and Al3+ species present in the aluminosilicate matrix of CFA at temperatures above 350 °C [53]. The network of CFA was attacked by sufficient Na+ ions in the initial period to further break the Si-O and Al-O bonds. On the other hand, Na+ fills the holes in the (SiO4) tetrahedron and act as network modifiers, reducing the integrality of the network by replacing bridging oxygens by non-bridging oxygens. In addition, the presence of a high OH− concentration contributes to the release of Si and Al from the CFA [54] and the disruption of inner Si-O and Al-O bonds led to the generation of irregular interconnected units. New Si-Al phases formed after partial disruption of the CFA spheres and re-precipitation at the sphere solution interface. Such newly formed coatings could act as a passivation layer on residues. Hence, it is very difficult for the molten NaOH to act as a liquid media for efficient material transfer during the condensation reaction. The results suggest that NaOH could provide charge compensating ions and facilitate the decomposition of aluminosilicates.

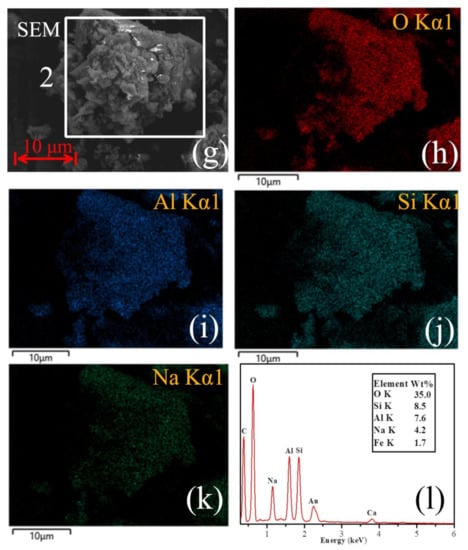
Figure 9.
(a) SEM images obtained from the raw CFA, (b) O distribution map of the area 1, (c) Al distribution map of the area 1,(d) Si distribution map of the area 1, (e) Fe distribution map of the area 1, (f) EDS X-ray spectrum from Figure 1 (a) area. (g) SEM images obtained from the sample S4-4, (h) O distribution map of the area 2, (i) Al distribution map of the area 2, (j) Si distribution map of the area 2, (k) Fe distribution map of the area 2, (l) EDS X-ray spectrum from Figure 1 (g) area.
4. Conclusions
- The main aim of this research was to investigate in-depth the vibrations of the functional groups of CFA during NaOH calcination. The chemical structure of the CFA was found to consist of silicate chains. XRD and FTIR analyses were combined to reveal the decomposition pathways of CFA at the molecular level during the alkali calcination process using NaOH.
- The aluminosilicate network in the raw CFA gradually disaggregated into clusters with different degrees of reaction during the NaOH calcination process. The number of small clusters increased with temperature, which facilitated structural rearrangements.
- The results of the FTIR and XRD undoubtedly demonstrated the existence of Si-O-Si linkages in the glass phases of CFA. Pronounced Si-O-Al linkages were present in the structure on account of substitution reactions with a certain portion of the Al in the aluminosilicate. Based on the deconvolution of the main region of interest (800–1300 cm−1), several special peaks were identified. The information on the thermal history of the CFA and the chemical and molecular structural changes during the NaOH calcination were clearly identified. The calcination temperature and time were both positively correlated with the reduction of functional groups.
- In the future, combining current methods with those in other fields, such as alkali calcination followed by hydro-chemical process to synthesize zeolite and alkali calcination followed by recovery of other valuable materials, will contribute to multipurpose use of CFA.
Author Contributions
Conceptualization, J.Y., and T.P.; methodology, J.Y.; software, L.Z.; validation, T.P., and L.C.; formal analysis, J.Y.; investigation, J.Y.; resources, L.C.; data curation, T.P., and L.C.; writing—original draft preparation, L.Z.; writing—review and editing, L.Z.; visualization, T.P., and L.C.; supervision, H.S.; project administration, H.S.; funding acquisition, H.S. All authors have read and agreed to the published version of the manuscript.
Funding
This research was funded by the Longshan academic talent research and Innovation Team Project of Southwest University of Science and Technology (SWUST), grant number (17LZXT11) and The APC was funded by the Longshan academic talent research and Innovation Team Project of SWUST.
Institutional Review Board Statement
Not applicable.
Informed Consent Statement
Not applicable.
Data Availability Statement
Data sharing not applicable.
Acknowledgments
We thank all the interviewees for sharing their ideas and experiences with us during our field studies and all the anonymous reviewers who help us to improve the paper.
Conflicts of Interest
The authors declare no conflict of interest.
References
- Beltrao-Nunes, A.P.; Sennour, R.; Arus, V.A.; Anoma, S.; Pires, M.; Bouzizi, N.; Roy, R.; Azzouz, A. CO2 capture by coal ash-derived zeolites-roles of the intrinsic basicity and hydrophilic character. J. Alloys Compd. 2019, 778, 866–877. [Google Scholar] [CrossRef]
- Xiu, F.R.; Yu, X.; Qi, Y.Y. A high-efficiency and low-temperature subcritical water dechlorination strategy of polyvinyl chloride using coal fly ash (CFA) and coal gangue (CG) as enhancers. J. Cleaner Prod. 2020, 260, 121085. [Google Scholar] [CrossRef]
- Eddy, B.; Koopman, R.B.; Carolina, L.R. Structural change in the Chinese economy and changing trade relations with the world. China Econ. Rev. 2021, 65, 101573. [Google Scholar] [CrossRef]
- Twardowska, I.; Szczepanska, J. Solid waste, terminological and long-term environmental risk assessment problems exemplified in a power plant fly ash study. Sci. Total Environ. 2002, 285, 29–51. [Google Scholar] [CrossRef]
- Ye, Y.P.; Zeng, X.Q.; Qian, W.L.; Wang, M.W. Synthesis of pure zeolites from supersaturated silicon and aluminum alkali extracts from fused coal fly ash. Fuel 2008, 87, 1880–1886. [Google Scholar]
- Aldahri, T.; Behin, J.; Kazemian, H.; Rohani, S. Effect of microwave irradiation on crystal growth of zeolitized coal fly ash with different solid/liquid ratios. Adv. Powder Technol. 2017, 28, 2865–2874. [Google Scholar] [CrossRef]
- Tripathy, A.K.; Behera, B.; Aishvarya, V.; Sheik, A.R.; Dash, B.; Sarangi, C.K.; Tripathy, B.C.; Sanjay, K.; Bhattacharya, I. Sodium fluoride assisted acid leaching of coal fly ash for the extraction of alumina. Miner. Eng. 2019, 131, 140–145. [Google Scholar] [CrossRef]
- Tripathy, A.K.; Mahalik, S.; Sarangi, C.K.; Tripathy, B.C.; Sanjay, K.; Bhattacharya, I.N. A pyro-hydrometallurgical process for the recovery of alumina from waste aluminium dross. Miner. Eng. 2019, 137, 181–186. [Google Scholar] [CrossRef]
- Sigvardsen, N.M.; Ottosen, L.M. Characterization of coal bio ash from wood pellets and low-alkali coal fly ash and use as partial cement replacement in mortar. Cem. Concr. Compos. 2019, 95, 25–32. [Google Scholar] [CrossRef]
- Wang, N.N.; Sun, X.Y.; Zhao, Q.; Yang, Y.; Wang, P. Leachability and adverse effects of coal fly ash: A review. J. Hazard. Mater. 2020, 396, 122725. [Google Scholar] [CrossRef]
- Yao, Z.T.; Ji, X.S.; Sarker, P.; Tang, J.H.; Ge, L.Q.; Xia, M.S.; Xi, Y.Q. A comprehensive review on the applications of coal fly ash. Earth-Sci. Rev. 2015, 141, 105–121. [Google Scholar] [CrossRef]
- Mukherjee, A.B.; Zevenhoven, R.; Bhattacharya, P.; Sajwan, K.S.; Kikuchi, R. Mercury flow via coal and coal utilization by-products: A global perspective. Resour. Conserv. Recycl. 2008, 52, 571–591. [Google Scholar] [CrossRef]
- Wang, Y.S.; Alrefaei, Y.; Dai, J.G. Influence of coal fly ash on the early performance enhancement and formation mechanisms of silico-aluminophosphate geopolymer. Resour. Conserv. Recycl. 2020, 127, 105932. [Google Scholar] [CrossRef]
- Gomes, S.; François, M. Characterization of mullite in silicoaluminous fly ash by XRD, TEM, and 29 Si MAS NMR. Cem. Concr. Res. 2000, 30, 175–181. [Google Scholar] [CrossRef]
- Wan, X.; Wang, W.; Ye, T.M.; Guo, Y.W.; Gao, X.B. A study on the chemical and mineralogical characterization of MSWI fly ash using a sequential extraction procedure. J. Hazard. Mater. 2006, 134, 197–201. [Google Scholar] [CrossRef]
- Vassilev, S.; Menendez, R.; Borrego, A.; Diaz-Somoano, M.; Martinez-Tarazona, M. Phase-mineral and chemical composition of coal fly ashes as a basis for their multicomponent utilization. 3. Characterization of magnetic and char concentrates. Fuel 2004, 83, 1563–1583. [Google Scholar] [CrossRef]
- Ugurlu, A. Leaching characteristics of fly ash. Environ. Geol. 2004, 46, 890–895. [Google Scholar] [CrossRef]
- Kashiwakura, S.; Takahashi, T.; Maekawa, H.; Nagasaka, T. Application of 11B MAS-NMR to the characterization of boron in coal fly ash generated from Nantun coal. Fuel 2010, 89, 1006–1011. [Google Scholar] [CrossRef]
- Gollakota, A.R.K.; Volli, V.; Shu, C.M. Progressive utilisation prospects of coal fly ash: A review. Sci. Total Environ. 2019, 672, 951–989. [Google Scholar] [CrossRef] [PubMed]
- Zhou, C.Y.; Gao, Q.; Luo, W.J.; Zhou, Q.; Wang, H.Q.; Yan, C.J.; Duan, P. Preparation, characterization and adsorption evaluation of spherical mesoporous Al-MCM-41 from coal fly ash. J. Taiwan Inst. Chem. Eng. 2015, 52, 147–157. [Google Scholar] [CrossRef]
- Li, C.; Sun, H.; Li, L. Glass Phase Structure of Blast Furnace Slag. Adv. Mater. Res. 2010, 168–170, 3–7. [Google Scholar] [CrossRef]
- Zhao, C.M.; Wang, G.C.; Li, S.L.; Ai, X.G.; Wang, Z.R.; Zhai, Y.C. Reaction pathway led by silicate structure transformation on decomposition of CaSiO3 in alkali fusion process using NaOH. Trans. Nonferrous Met. Soc. China 2015, 25, 3827–3833. [Google Scholar] [CrossRef]
- Shoppert, A.; Valeev, D.; Loginova, I.; Chaikin, L. Complete Extraction of Amorphous Aluminosilicate from Coal Fly Ash by Alkali Leaching under Atmospheric Pressure. Metals 2020, 10, 1684. [Google Scholar] [CrossRef]
- Ju, T.Y.; Jiang, J.G.; Meng, Y.; Yan, F.; Xua, Y.W.; Gao, Y.C.; Aihemaitia, A. An investigation of the effect of ultrasonic waves on the efficiency of silicon extraction from coal fly ash. Ultrason. Sonochem. 2020, 60, 104765. [Google Scholar] [CrossRef]
- Ma, Z.B.; Zhang, X.L.; Guo, Y.X.; Cheng, F.Q. Extraction of Valuable Metals and Preparation of Mesoporous Materials from Circulating Fluidized Bed-Derived Fly Ash via an Acid−Alkali-Based Alternate Method. ACS Omega 2020, 5, 31295–31305. [Google Scholar] [CrossRef] [PubMed]
- Kazemian, H.; Naghdali, Z.; Ghaffari Kashani, T.; Farhadi, F. Conversion of high silicon fly ash to Na-P1 zeolite: Alkaline fusion followed by hydrothermal crystallization. Adv. Powder Technol. 2010, 21, 279–283. [Google Scholar] [CrossRef]
- Izidoro, J.C.; Fungaro, D.A.; Abbott, J.E.; Wang, S.B. Synthesis of zeolites X and A from fly ashes for cadmium and zinc removal from aqueous solutions in single and binary ion systems. Fuel 2013, 103, 827–834. [Google Scholar] [CrossRef]
- Lee, Y.R.; Soe, J.T.; Zhang, S.Q.; Ahn, J.W.; Park, M.B.; Ahn, W.S. Synthesis of nanoporous materials via recycling coal fly ash and other solid wastes, a mini review. Chem. Eng. J. 2017, 317, 821–843. [Google Scholar] [CrossRef]
- Koshy, N.; Dondrob, K.; Hu, L.M.; Wen, Q.B.; Meegoda, J.N. Synthesis and characterization of geopolymers derived from coal gangue, fly ash and red mud. Constr. Build. Mater. 2019, 206, 287–296. [Google Scholar] [CrossRef]
- Demir, F.; Derun, E.M. Response surface methodology application to fly ash based geopolymer synthesized by alkali fusion method. J. Non-Cryst. Solids. 2019, 524, 119649. [Google Scholar] [CrossRef]
- Pan, J.H.; Hassas, B.V.; Rezaee, M.; Zhou, C.C.; Pisupati, S.V. Recovery of rare earth elements from coal fly ash through sequential chemical roasting, water leaching, and acid leaching processes. J. Cleaner Prod. 2021, 284, 124725. [Google Scholar] [CrossRef]
- Tang, M.C.; Zhou, C.C.; Pan, J.H.; Zhang, N.N.; Liu, C.; Cao, S.S.; Hu, T.T.; Ji, W.S. Study on extraction of rare earth elements from coal fly ash through alkali fusion-Acid leaching. Miner. Eng. 2019, 136, 36–42. [Google Scholar] [CrossRef]
- Mokgehle, T.M.; Richards, H.; Chimuka, L.; Gitari, W.M.; Tavengwa, N.T. Sulphates removal from AMD using CFA hydrothermally treated zeolites in column studies. Miner. Eng. 2019, 141, 105851. [Google Scholar] [CrossRef]
- Guo, Y.X.; Yan, K.Z.; Cui, L.; Cheng, F.Q.; Luo, H.H. Effect of Na2CO3 additive on the activation of coal gangue for alumina extraction. Int. J. Miner. Process. 2014, 131, 51–57. [Google Scholar] [CrossRef]
- Huang, Z.X.; Fan, M.H.; Tian, H.J. Rare earth elements of fly ash from Wyoming’s Powder River Basin coal. J. Rare Earths 2020, 38, 219–226. [Google Scholar] [CrossRef]
- Huang, X.R.; Zhao, H.H.; Hu, X.F.; Liu, F.H.; Wang, L.; Zhao, X.; Gao, P.P.; Ji, P.H. Optimization of preparation technology for modified coal fly ash and its adsorption properties for Cd2+. J. Hazard. Mater. 2020, 392, 122461. [Google Scholar] [CrossRef] [PubMed]
- Wang, M.T.; Cheng, J.S.; Li, M.; He, F. Structure and properties of soda lime silicate glass doped with rare earth. Phys. B Condens. Matter 2011, 406, 187–191. [Google Scholar] [CrossRef]
- Dantas, N.O.; Ayta, W.E.F.; Silva, A.C.A.; Cano, N.F.; Silva, S.W. Effect of Fe2O3 concentration on the structure of the SiO2-Na2O-Al2O3-B2O3 glass system. Spectrochim. Acta Part A Mol. Biomol. Spectrosc. 2011, 81, 140–143. [Google Scholar] [CrossRef]
- Sun, Y.Q.; Zhang, Z.T.; Liu, L.L.; Wang, X.D. FTIR, Raman and NMR investigation of CaO-SiO2-P2O5 and CaO-SiO2-TiO2-P2O5 glasses. J. Non-Cryst. Solids 2015, 420, 26–33. [Google Scholar] [CrossRef]
- Clayden, N.J.; Esposito, S.; Aronne, A.; Pernice, P. Solid state 27Al NMR and FTIR study of lanthanum aluminosilicate glasses. J. Non-Cryst. Solids 1999, 258, 11–19. [Google Scholar] [CrossRef]
- Phair, J.; Van Deventer, J. Effect of the silicate activator pH on the microstructural characteristics of waste-based geopolymers. Int. J. Miner. Process. 2002, 66, 121–143. [Google Scholar] [CrossRef]
- Zhou, X.X.; Shen, J. Micromorphology and microstructure of coal fly ash and furnace bottom slag based light-weight geopolymer. Constr. Build. Mater. 2020, 242, 118–168. [Google Scholar] [CrossRef]
- Sore, S.O.; Messan, A.; Prud’Homme, E.; Escadeillas, G.; Tsobnang, F. Synthesis and characterization of geopolymer binders based on local materials from Burkina Faso-Metakaolin and rice husk ash. Constr. Build. Mater. 2016, 124, 301–311. [Google Scholar] [CrossRef]
- Luo, Y.; Zheng, S.L.; Ma, S.H.; Liu, C.L.; Ding, J.; Wang, X.H. Novel two-step process for synthesising β-SiC whiskers from coal fly ash and water glass. Ceram. Int. 2018, 44, 10585–10595. [Google Scholar] [CrossRef]
- Valcke, S.; Pipilikaki, P.; Fischer, H.; Verkuijlen, M.; Eck, E. FT-IR and 29Si-NMR for evaluating aluminium-silicate precursors for geopolymers. Mater. Struct. 2015, 48, 557–569. [Google Scholar] [CrossRef]
- Fernández-Jimenez, A.; Torre, A.G.; Palomo, A.; Lópoez-Olmo, G.; Aolnso, M.M.; Aranda, M. Quantitative determination of phases in the alkali activation of fly ash. Part I. Potential ash reactivity. Fuel 2006, 85, 625–634. [Google Scholar] [CrossRef]
- Zhang, J.J.; Liu, B.; Zhao, S.Z.; Shen, H.L.; Liu, J.; Zhang, S.S. Preparation and characterization of glass ceramic foams based on municipal solid waste incineration ashes using secondary aluminum ash as foaming agent. Constr. Build. Mater. 2020, 262, 120781. [Google Scholar] [CrossRef]
- Zhang, Z.H.; Wang, H.; Provis, J.L. Quantitative study of the reactivity of fly ash in geopolymerization by FTIR. J. Sustain. Cem. Mater. 2012, 1, 154–166. [Google Scholar] [CrossRef]
- Su, H.F.; Tan, F.R.; Lin, J.F. An integrated approach combines hydrothermal chemical and biological treatment to enhance recycle of rare metals from coal fly ash. Chem. Eng. J. 2020, 395, 124640. [Google Scholar] [CrossRef]
- Li, H.Q.; Hui, J.B.; Wang, C.Y.; Bao, W.J.; Sun, Z.H. Extraction of alumina from coal fly ash by mixed-alkaline hydrothermal method. Hydrometallurgy 2014, 147–148, 183–187. [Google Scholar] [CrossRef]
- Asemani, M.; Rabbani, A. Detailed FTIR spectroscopy characterization of crude oil extracted asphaltenes: Curve resolve of overlapping bands. J. Pet. Sci. Eng. 2020, 185, 106618. [Google Scholar] [CrossRef]
- Belviso, C. Ultrasonic vs hydrothermal method: Different approaches to convert fly ash into zeolite. How they affect the stability of synthetic products over time? Ultrason. Sonochem. 2018, 43, 9–14. [Google Scholar] [CrossRef] [PubMed]
- Chen, D.S.; Zhao, L.S.; Liu, Y.H.; Qi, T.; Wang, J.C.; Wang, L.N. A novel process for recovery of iron, titanium, and vanadium from titanomagnetite concentrates: NaOH molten salt roasting and water leaching processes. J. Hazard. Mater. 2013, 244–245, 588–595. [Google Scholar] [CrossRef] [PubMed]
- Murayama, N.; Yamamoto, H.; Shibata, J. Mechanism of zeolite synthesis from coal fly ash by alkali hydrothermal reaction. Int. J. Miner. Process. 2002, 64, 1–17. [Google Scholar] [CrossRef]
Publisher’s Note: MDPI stays neutral with regard to jurisdictional claims in published maps and institutional affiliations. |
© 2021 by the authors. Licensee MDPI, Basel, Switzerland. This article is an open access article distributed under the terms and conditions of the Creative Commons Attribution (CC BY) license (http://creativecommons.org/licenses/by/4.0/).