3.1. The Effect of the Aggregate on the Volume Changes of Concrete
All produced concrete mixtures reached the degree of consistency S4 through the slump cone test, more specifically, a slump of about 190 mm. To achieve the same degree of consistency for all produced concretes, it was necessary to make small corrections to the water–cement ratio and the dose of the superplasticizer, as can be seen in the
Table 4 and
Table 5 with the composition of the individual formulas. As expected, a higher dose of water and superplasticizer was needed for the crushed aggregates. More specifically, it was an increase in the water dose by up to 7 kg/m
3 of concrete. This increase was necessary for the mixture containing (excluding the mined fine aggregate) crushed fine aggregate, and it can be expected that this increased dose was necessary due to the wetting of the surface of all aggregate grains. These results are in accordance with the general determinations regarding the specific surface of the aggregate described above. Also, in the following evaluation of the volume changes of the concrete composites, the connections between the parameters of the aggregate, such as grain shape, and the absorptivity and achieved volume changes will be further sought.
The
Table 9 show the same workability was obtained in all mixtures. In mixtures with mined aggregates, such as PM and PMQ, less water content was used than in other mixtures. This result is in correlation with the statement made in the introduction [
23].
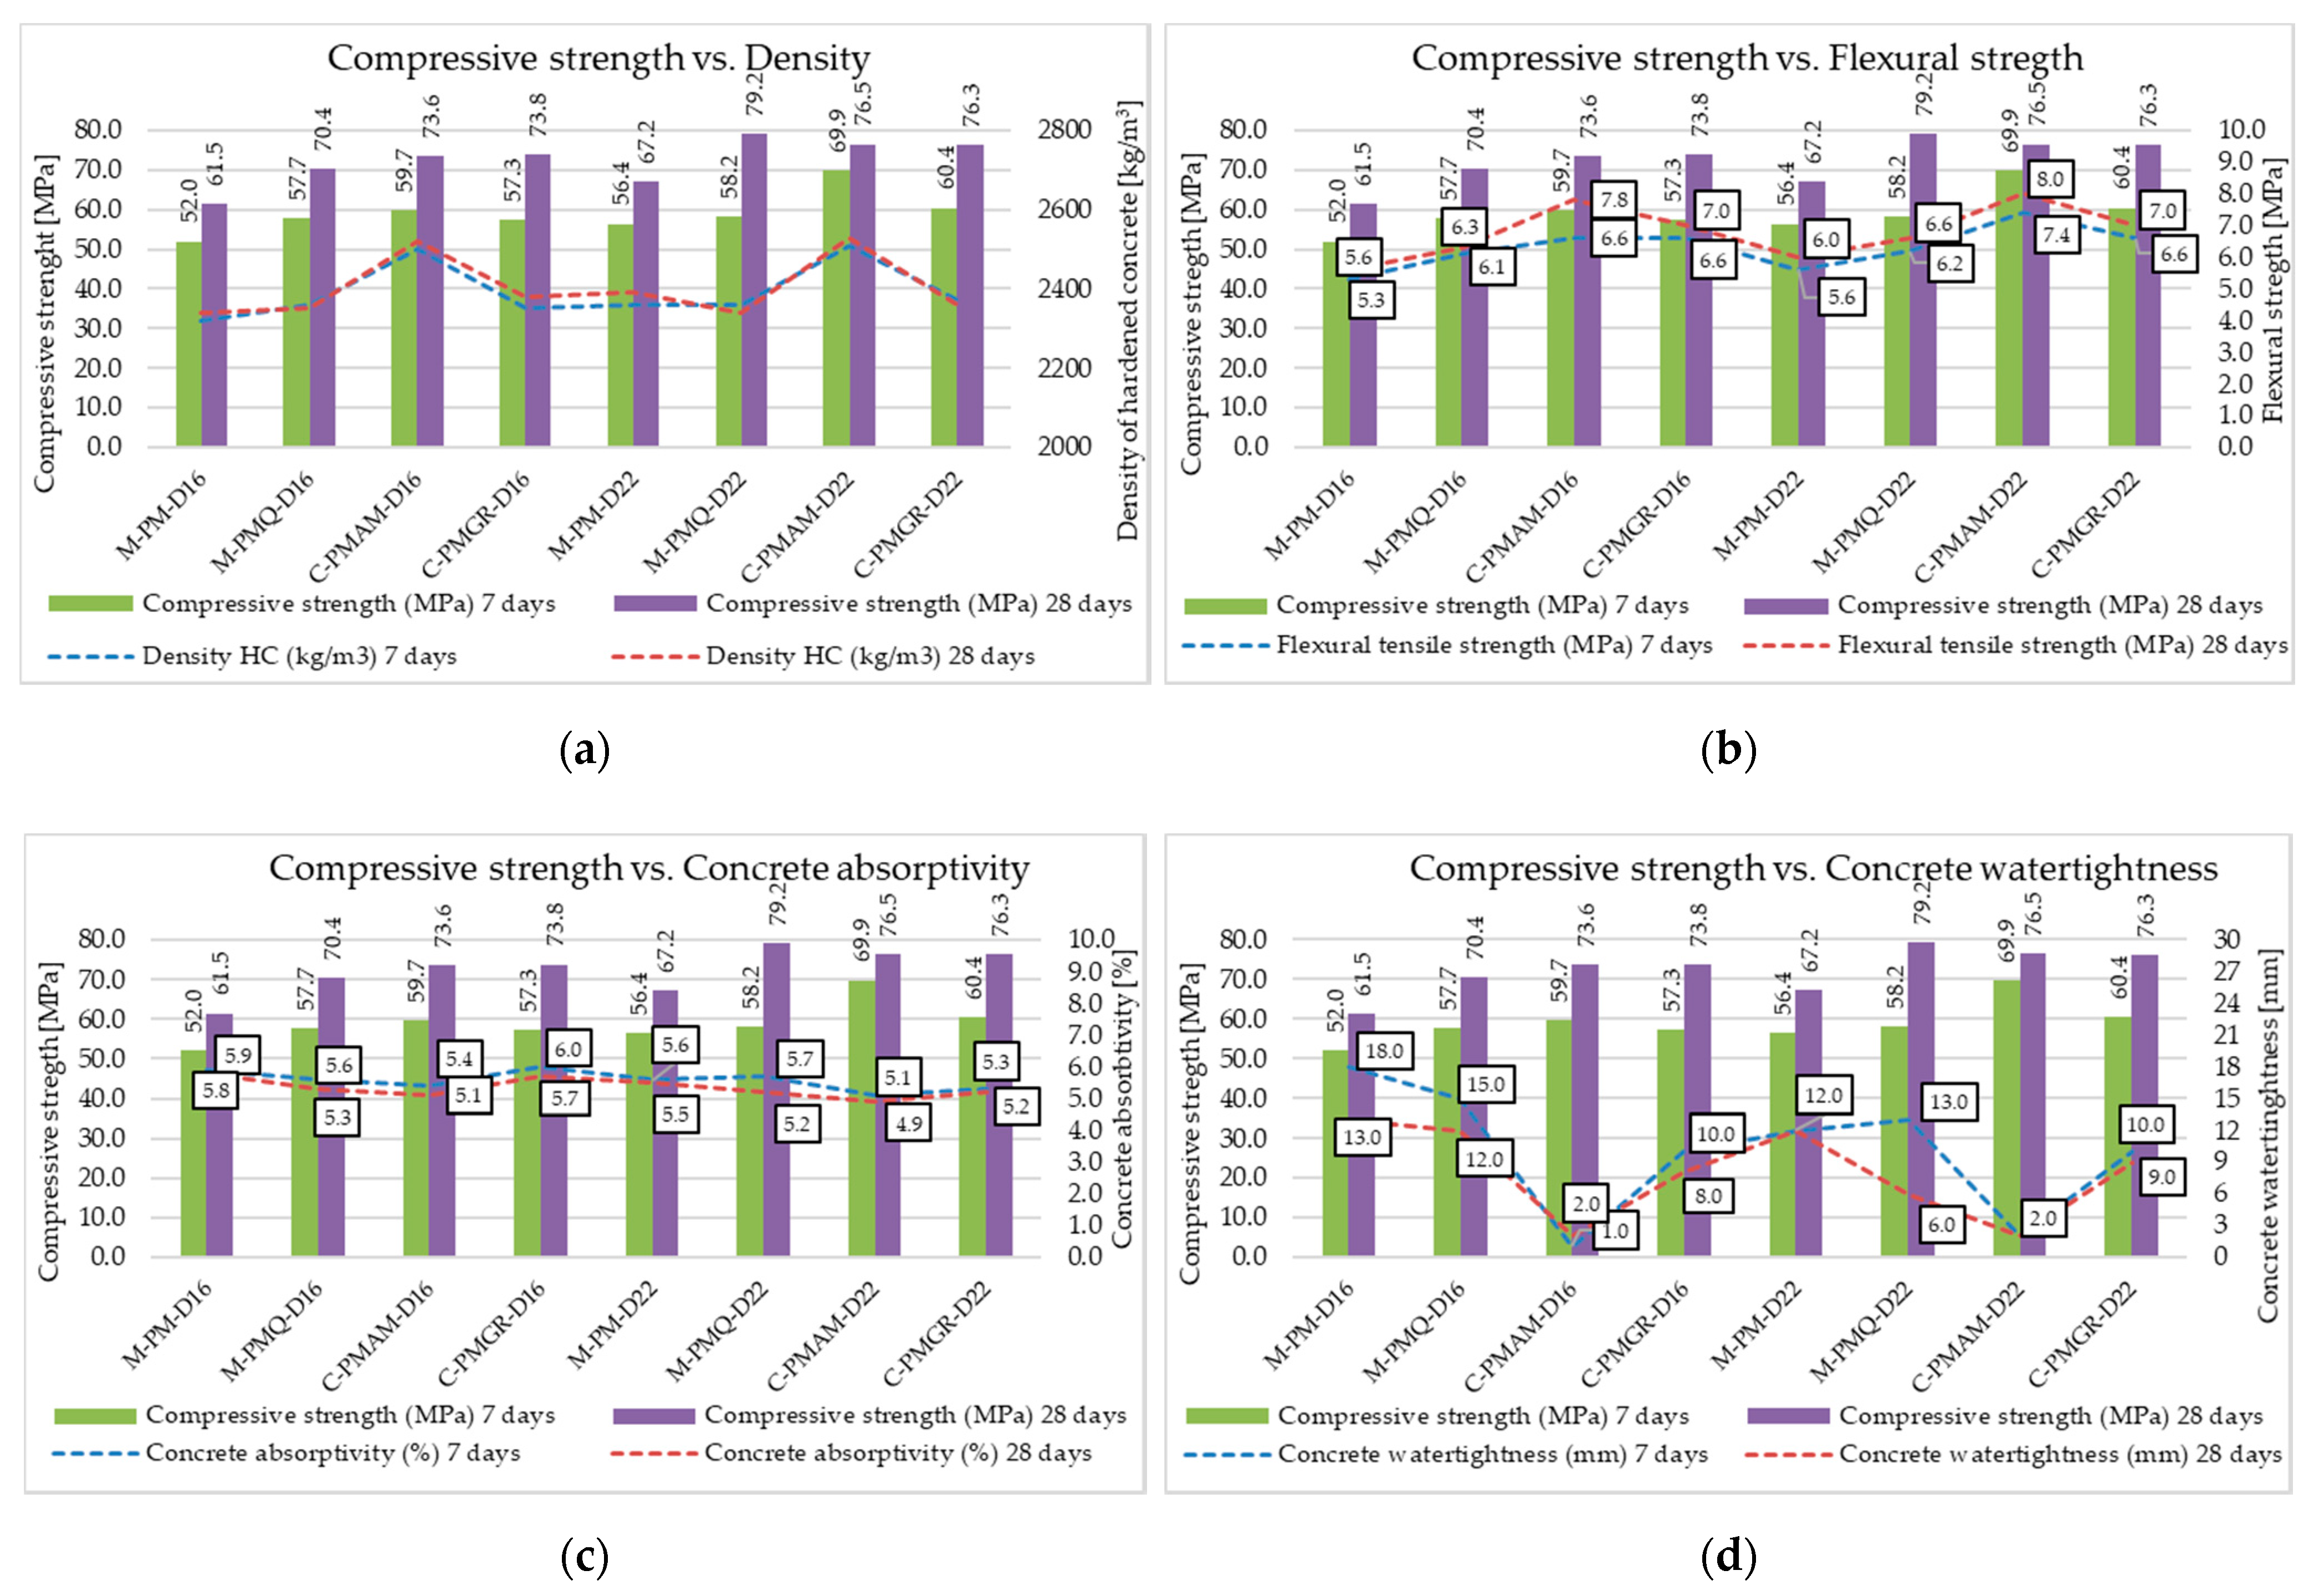
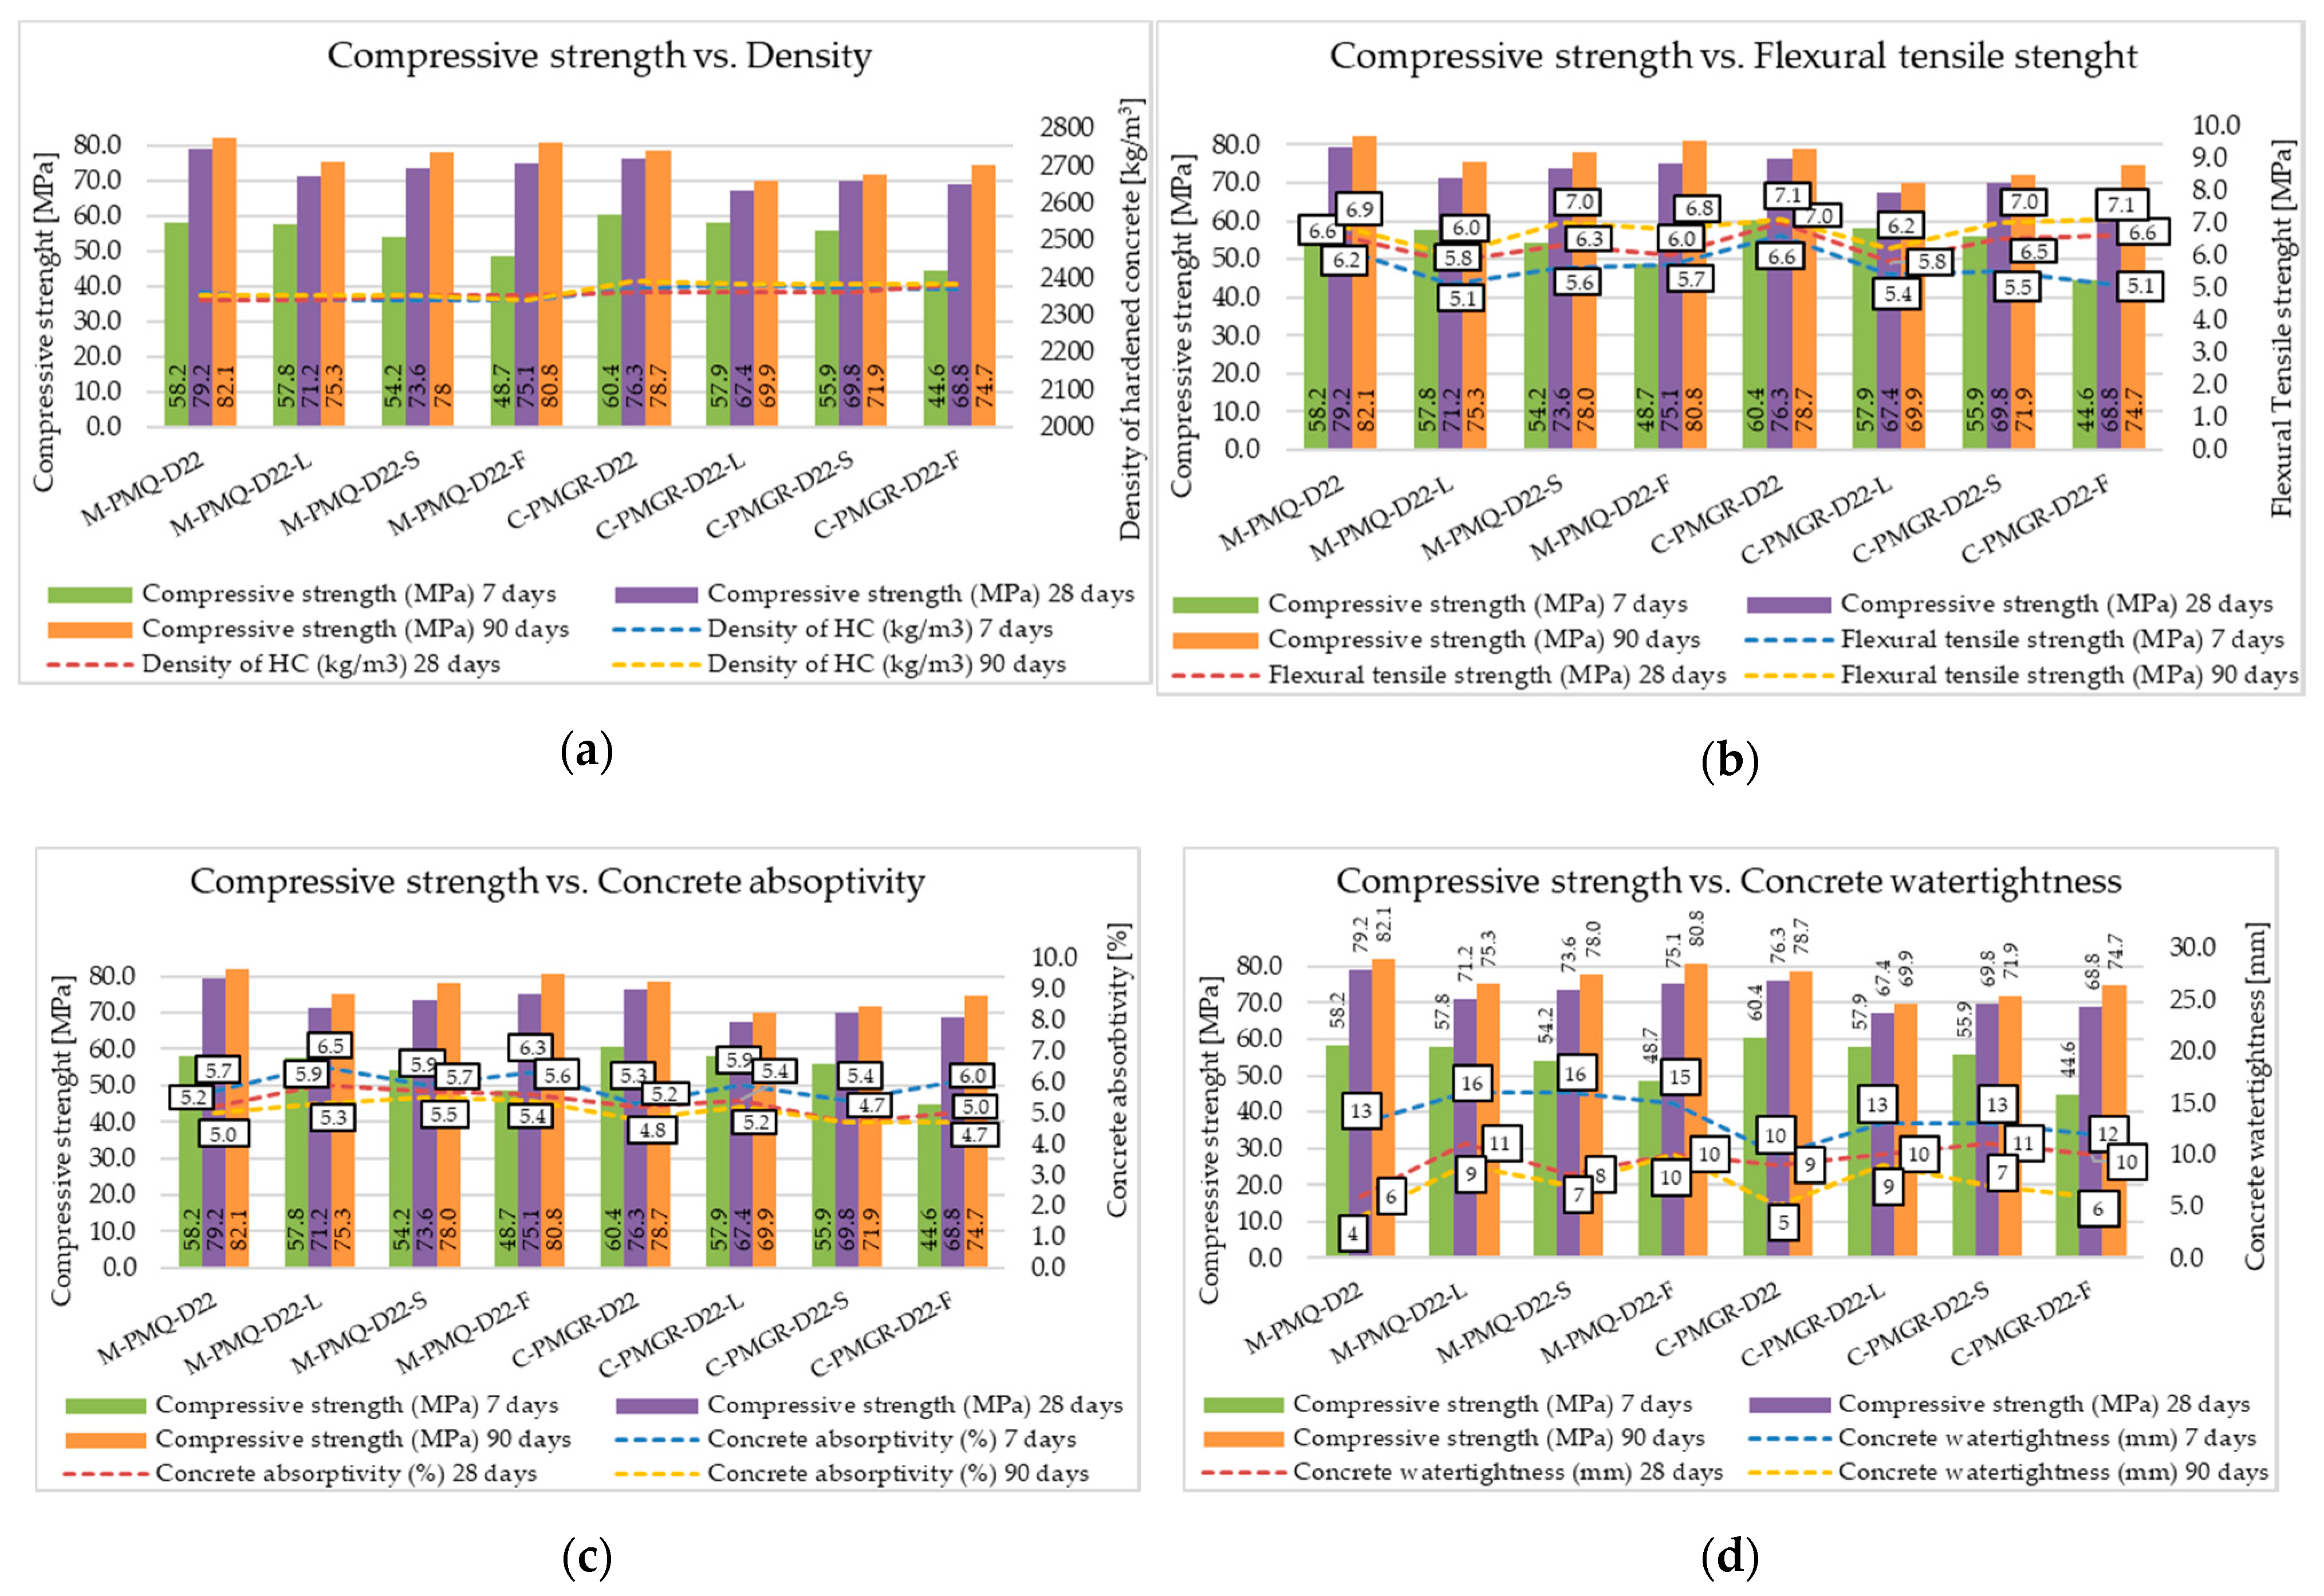
According to the achieved results of the compressive strength of concrete, it can be said that the required strength class was achieved for all the formulas. However, the achieved results showed in
Figure 7, clearly point to the effect of the type of aggregate, especially on the strength parameters of concrete. According to the achieved results, the influence of the bulk density of the type of aggregate used on the resulting bulk density of the concrete is obvious. Aggregates with the highest bulk density (Zelesice—amphibolite type) increased the bulk density of concrete to a value of around 2500 kg/m
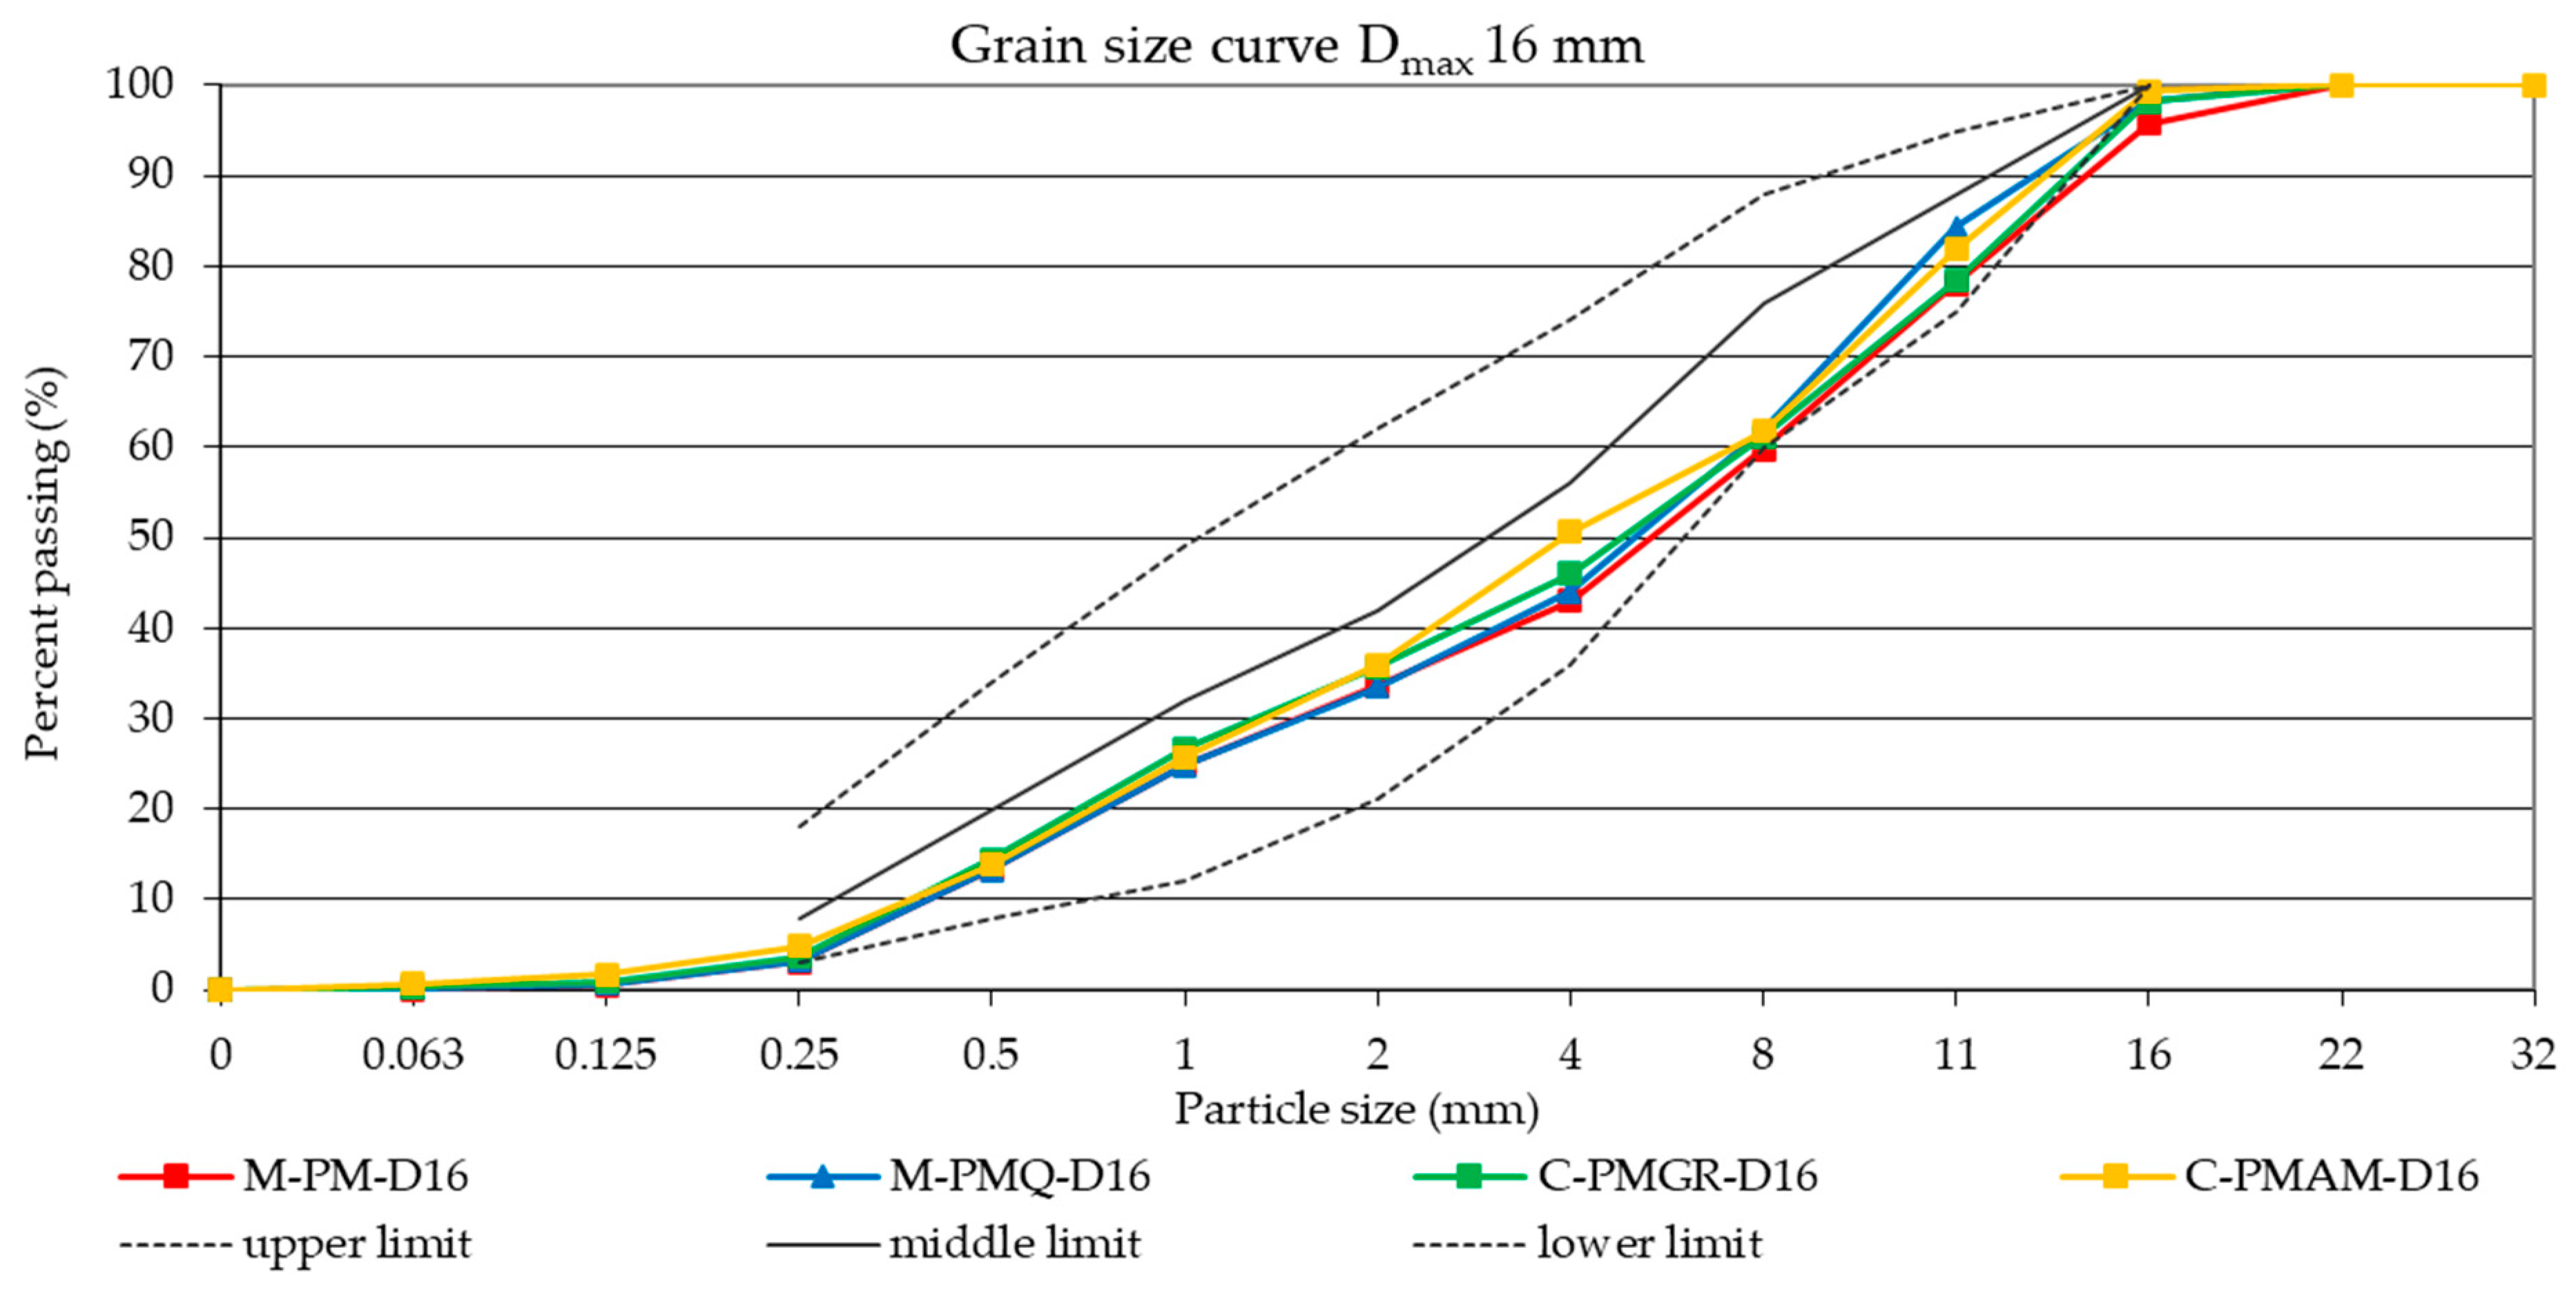
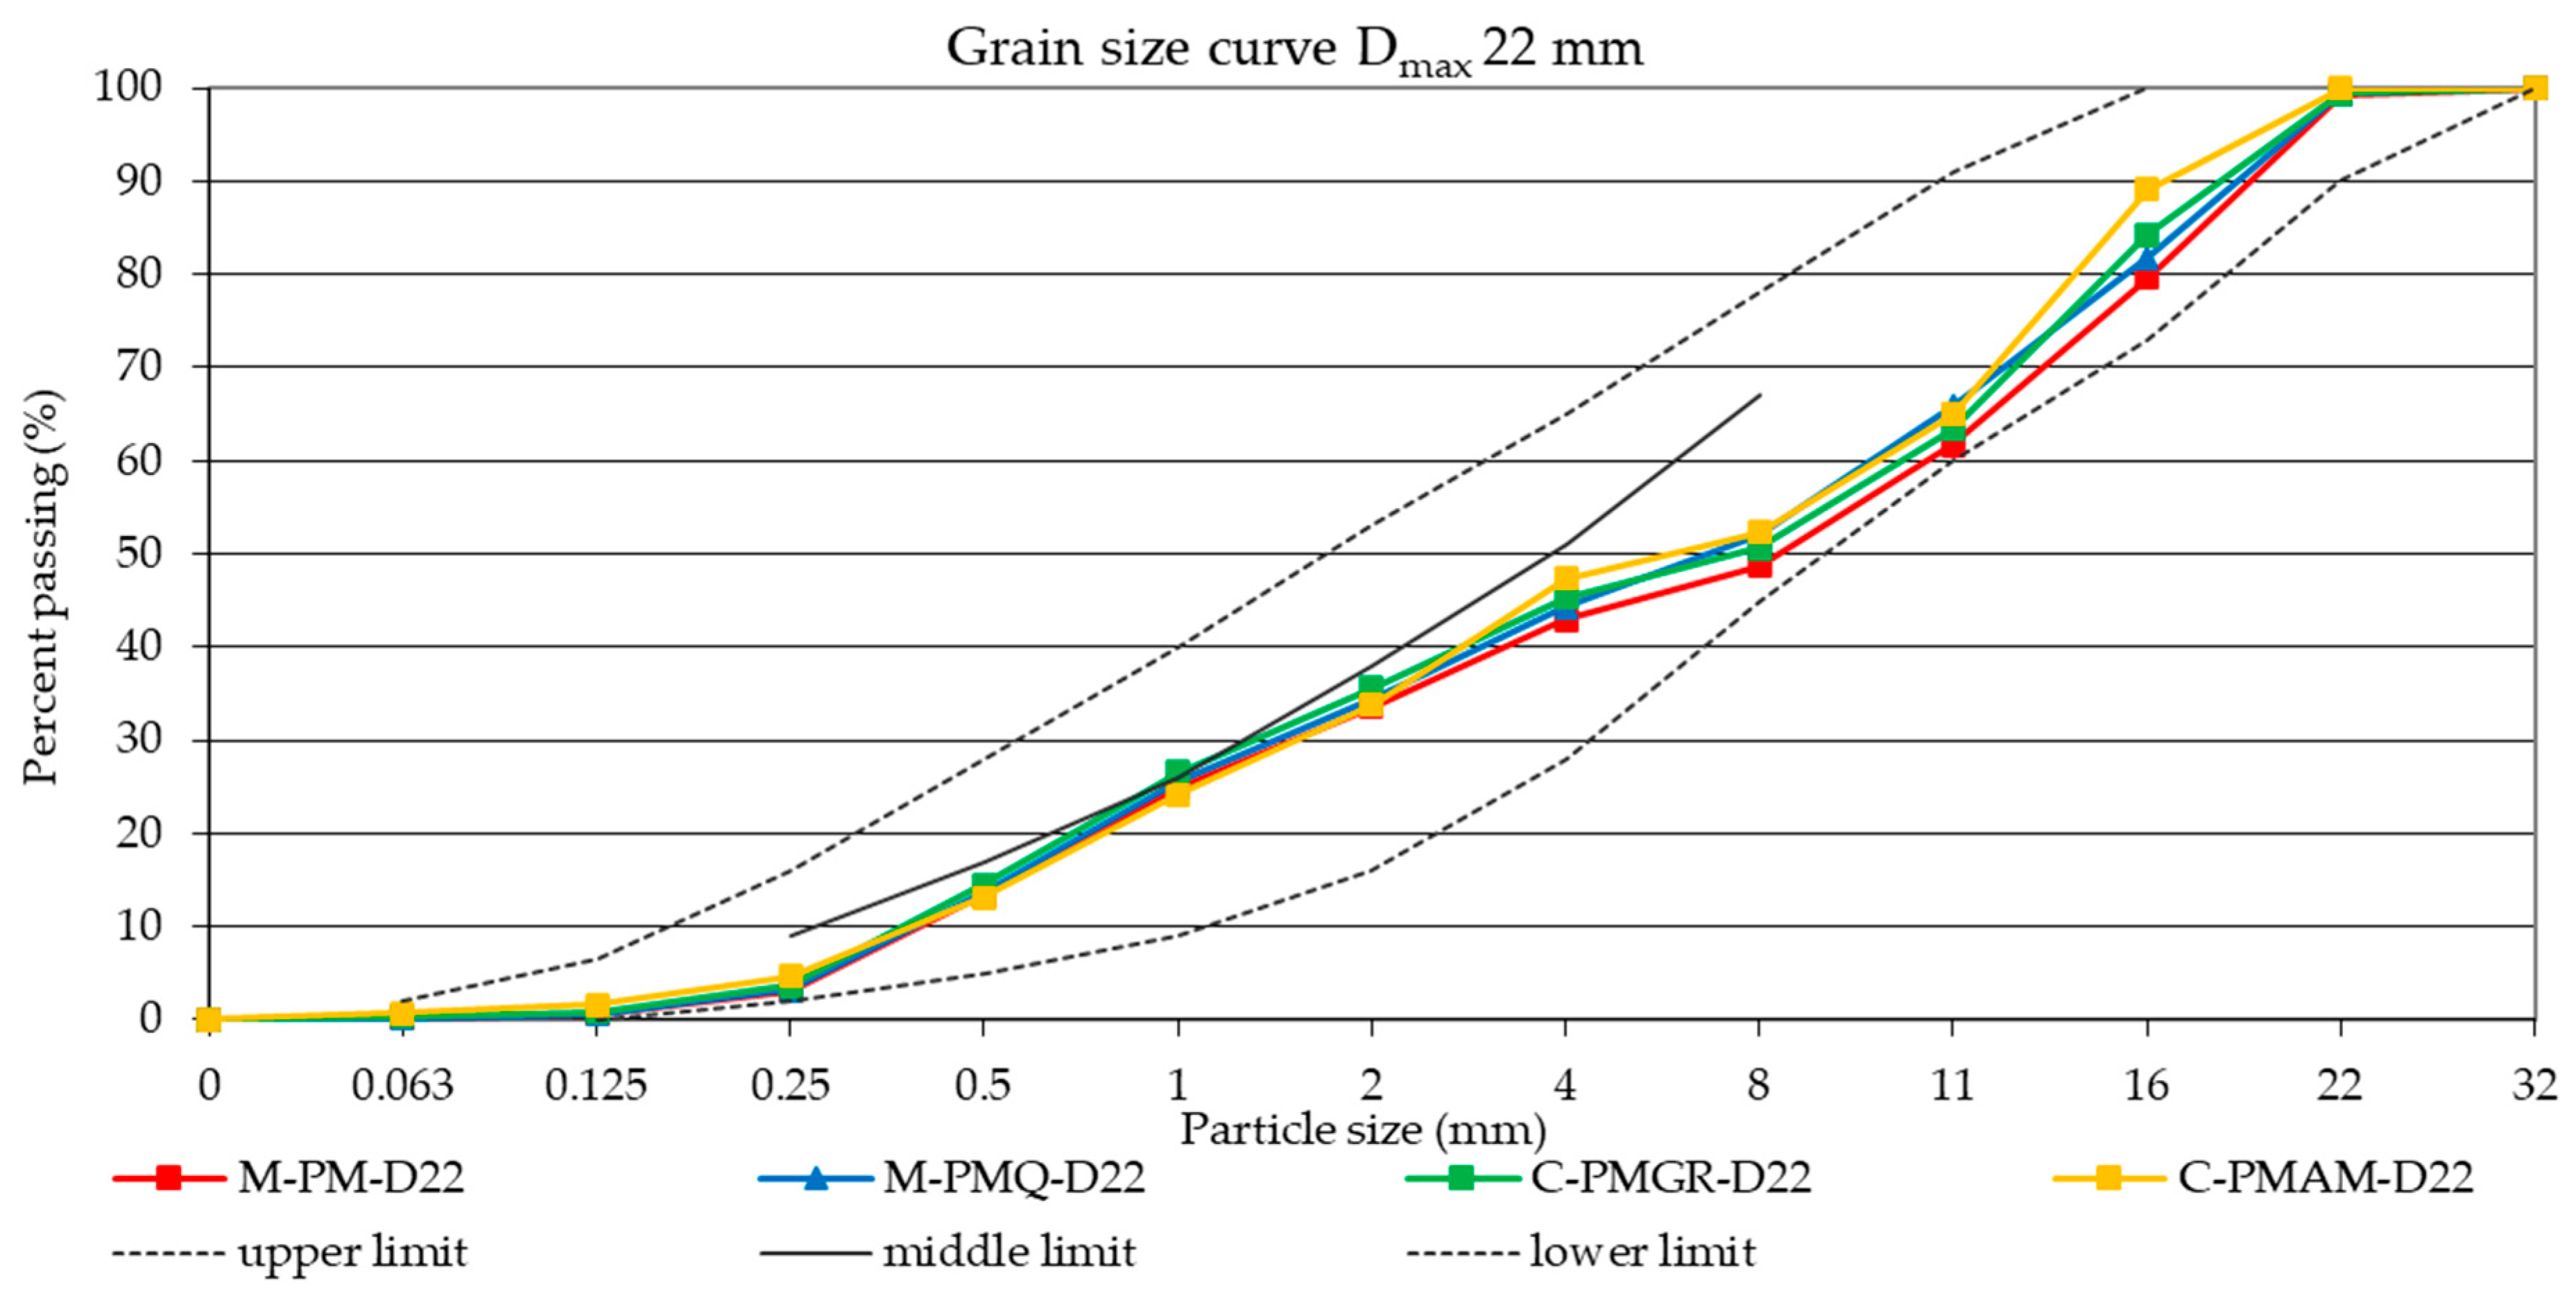
3. The results show a significant difference between the compressive strength of concrete made from psammitic fluvial rock of the mined type and the remaining aggregates used. Based on these results, it can be concluded that it was the lowest quality aggregate of all the aggregates used in terms of its mechanical properties. On the contrary, no significant difference in the compressive strength of concrete was observed when using high-quality quartz-type mined aggregate compared to high-quality crushed aggregates used in this experiment. The results further showed a slight increase in the mechanical parameters of all produced concretes using a discontinuous grading curve and a larger maximum aggregate grain size, namely D
max 22 mm. From a practical point of view, the formation of a discontinuous grading curve omitting the 4–8 mm fraction appears to be economically advantageous and, according to the results, is suitable for the production of concretes of higher strength classes.
Furthermore, a significant difference in the flexural strength of concrete was observed between formulas made with mined aggregates and formulas made with crushed aggregates. It is obvious that the assumed larger specific surface of coarse aggregates, according to the achieved results, may seem more suitable for achieving higher values of flexural properties. These results correlate with the conclusion about a better incorporation of crushed aggregate into the matrix of cement stone, which can have a positive effect on the flexural strength of concrete. However, these obtained results probably also correspond to the mechanical parameters of the aggregates used, whereby metamorphic rocks of granodiorite type and igneous rocks of amphibolite type generally achieve significantly higher mechanical parameters than mined rocks. Therefore, it is not possible to unequivocally confirm or disprove these conclusions about increasing the bending parameters of concrete by better incorporating the grains of crushed aggregates into the cement matrix. The effect of the maximum aggregate grain size and the continuous or discontinuous aggregate grading curve was not clearly observed, although slightly higher values of flexural strength were achieved by concretes with a continuous grading curve and a maximum aggregate grain size of 22 mm.
Significant differences between individual formulas, especially between mined and crushed aggregates, can be seen in the water tightness of concrete. Recipes with mined aggregates show lower resistance to the action of pressurized water, and this may directly relate to their higher absorptivity values. However, this trend was not directly confirmed by the water absorption test. The use of crushed fine aggregates in a suitable mixing ratio with natural fine aggregates seems to be highly suitable for practice based on all the achieved results. This technology of concrete production could bring a significant increase in the resistance of concrete, for example to the action of pressurized water, as evidenced by the obtained results.
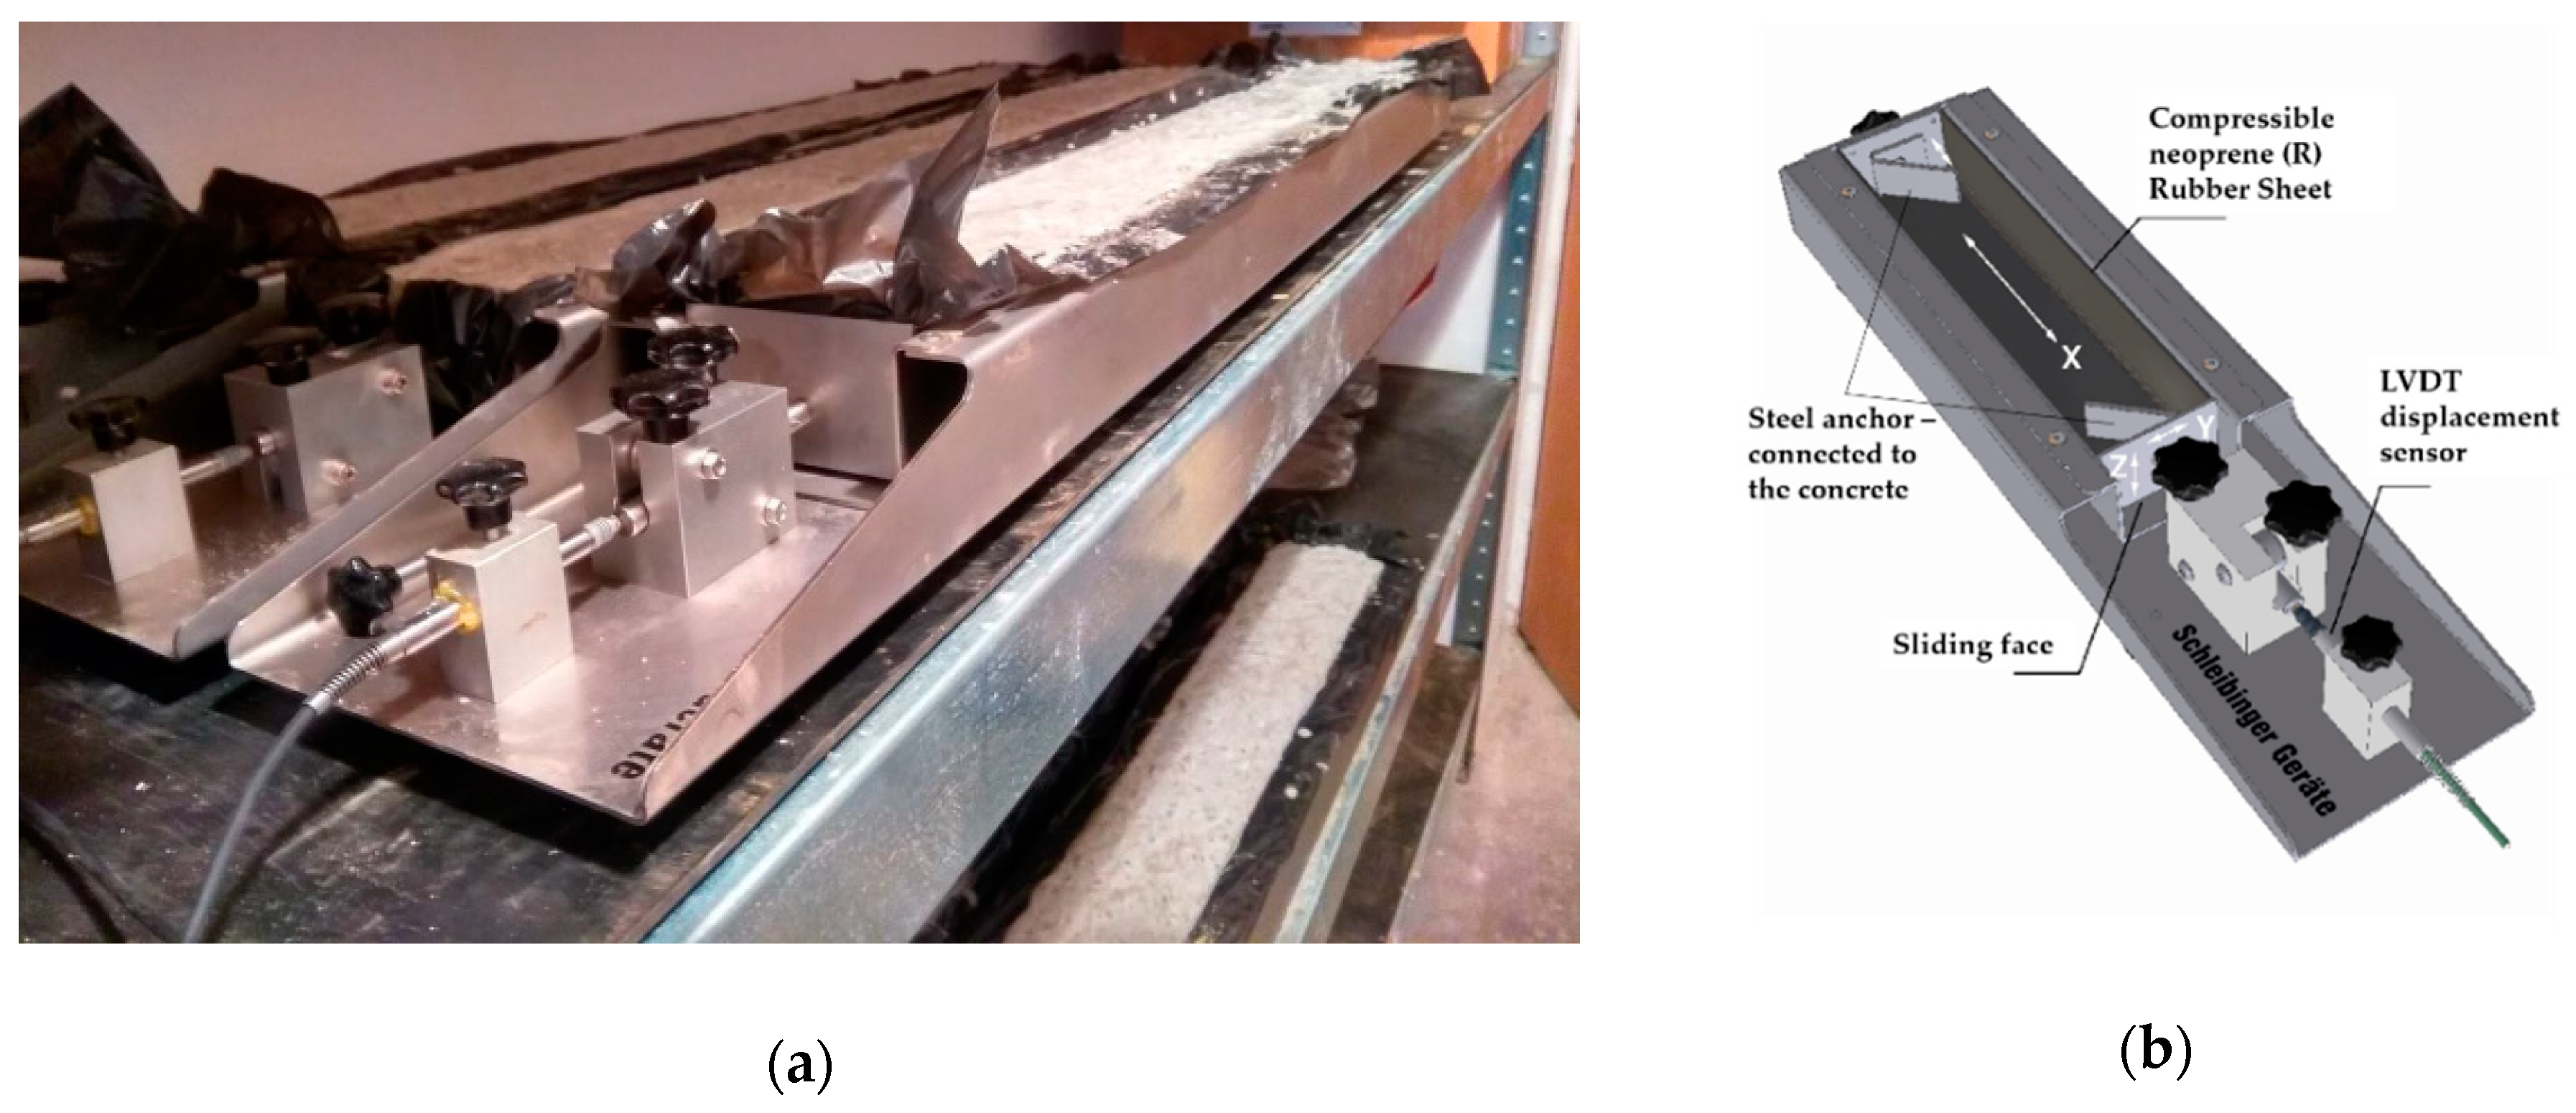
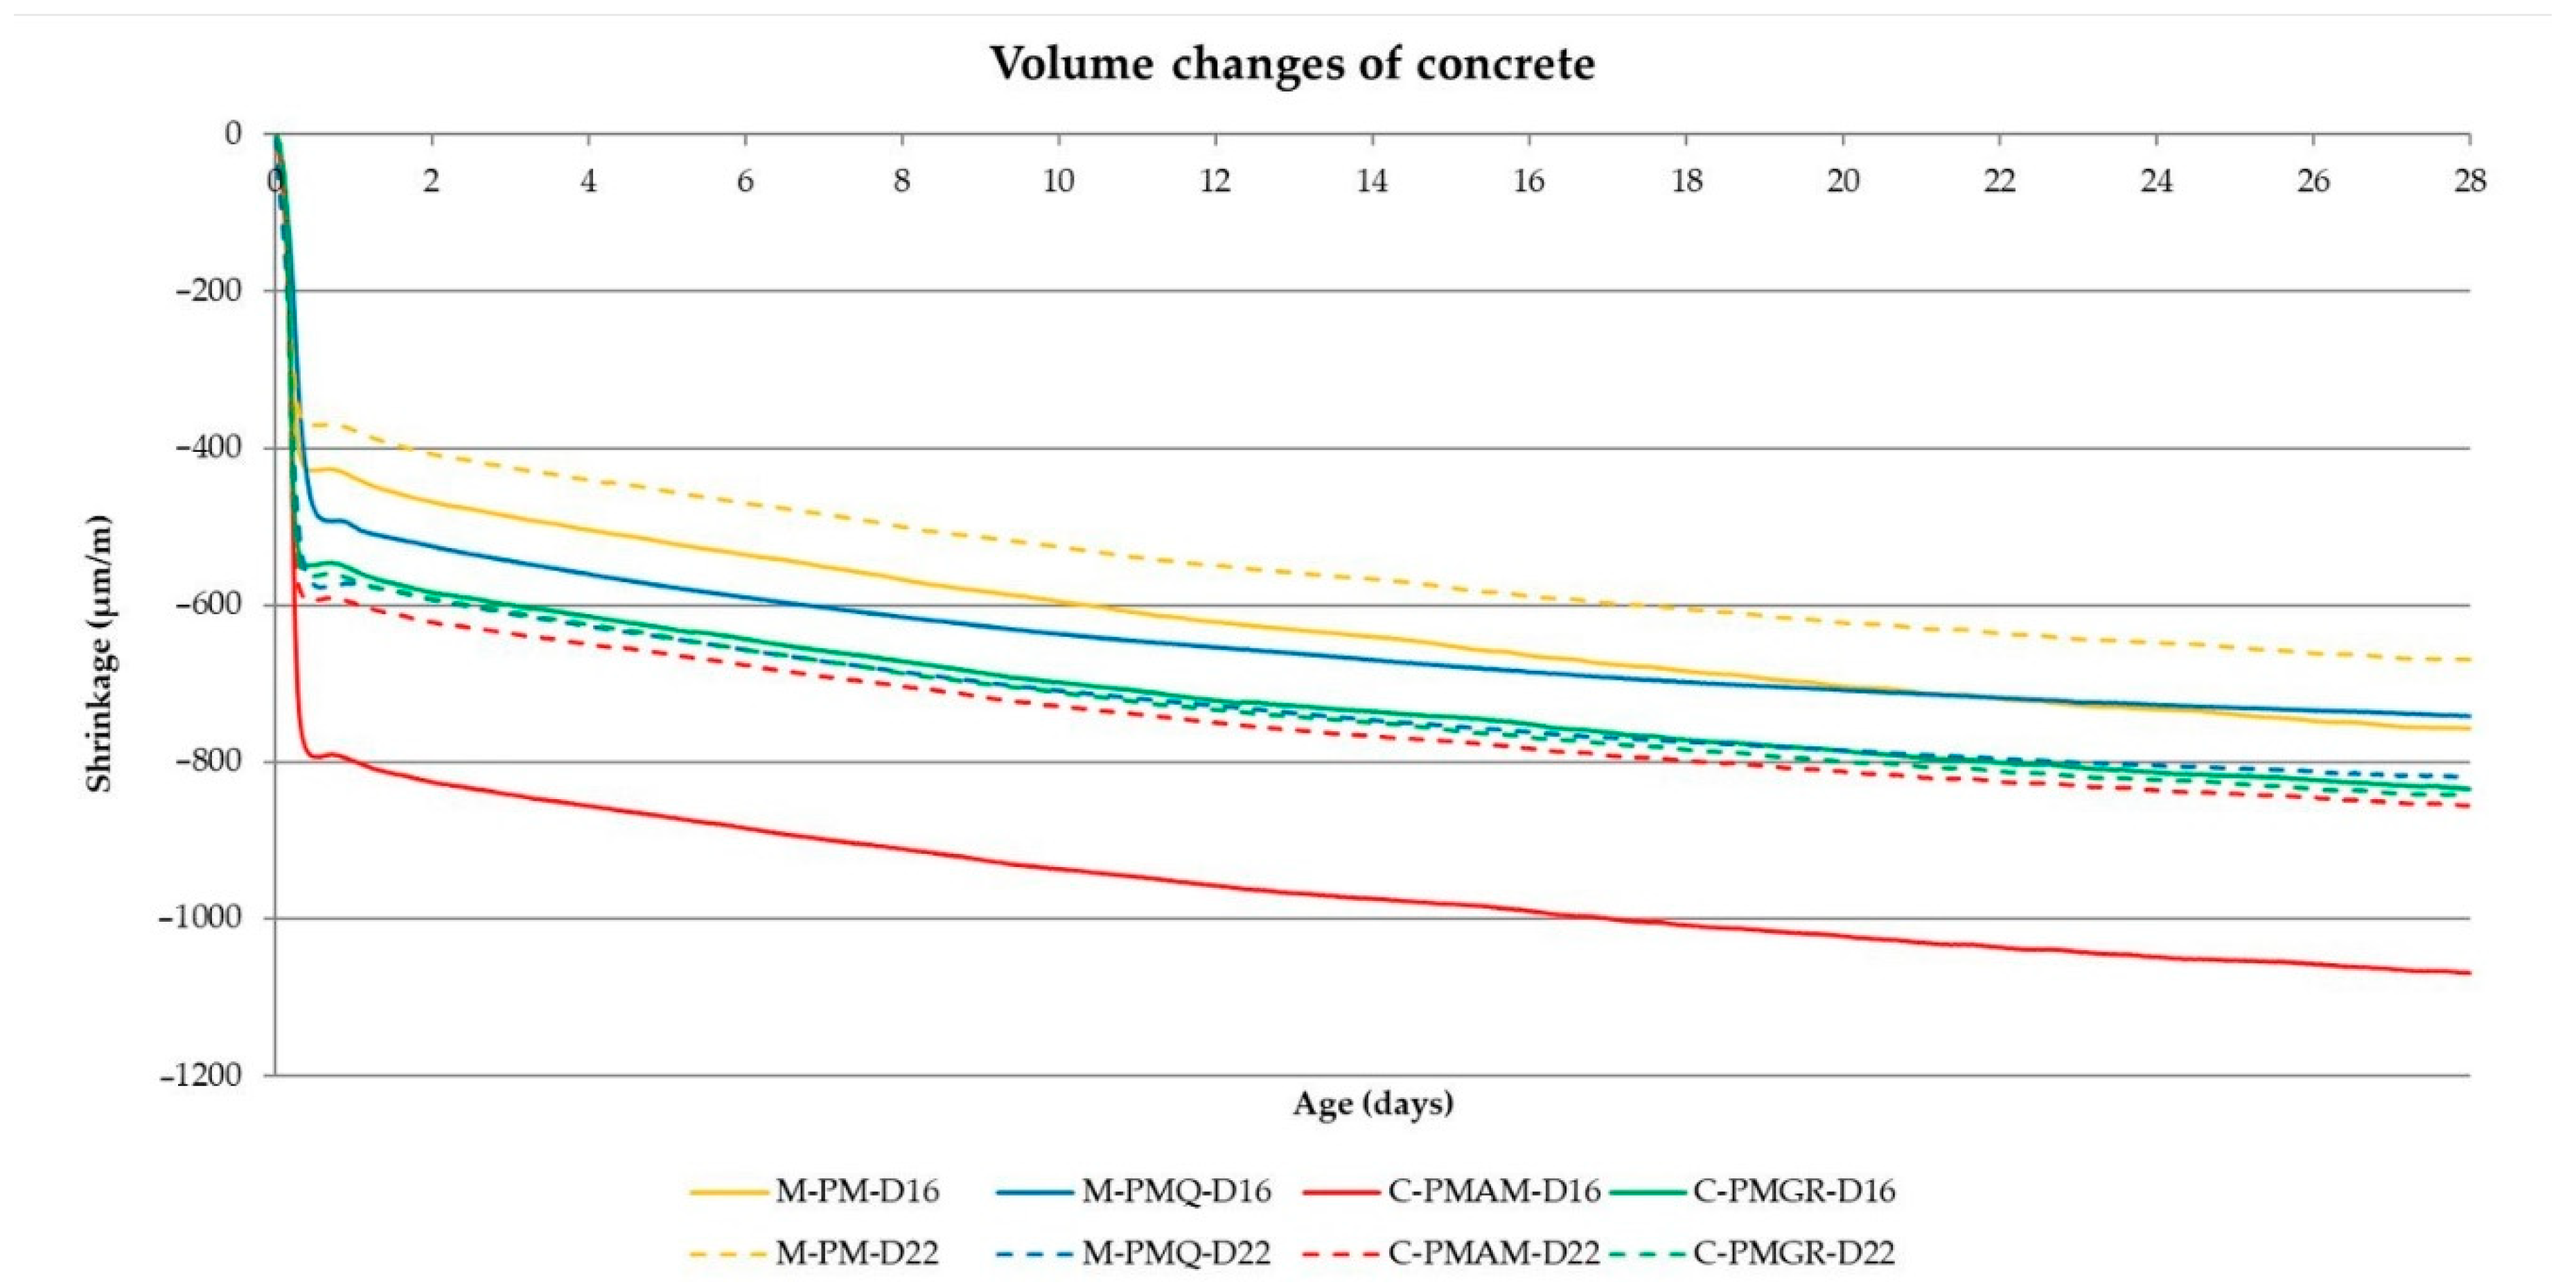
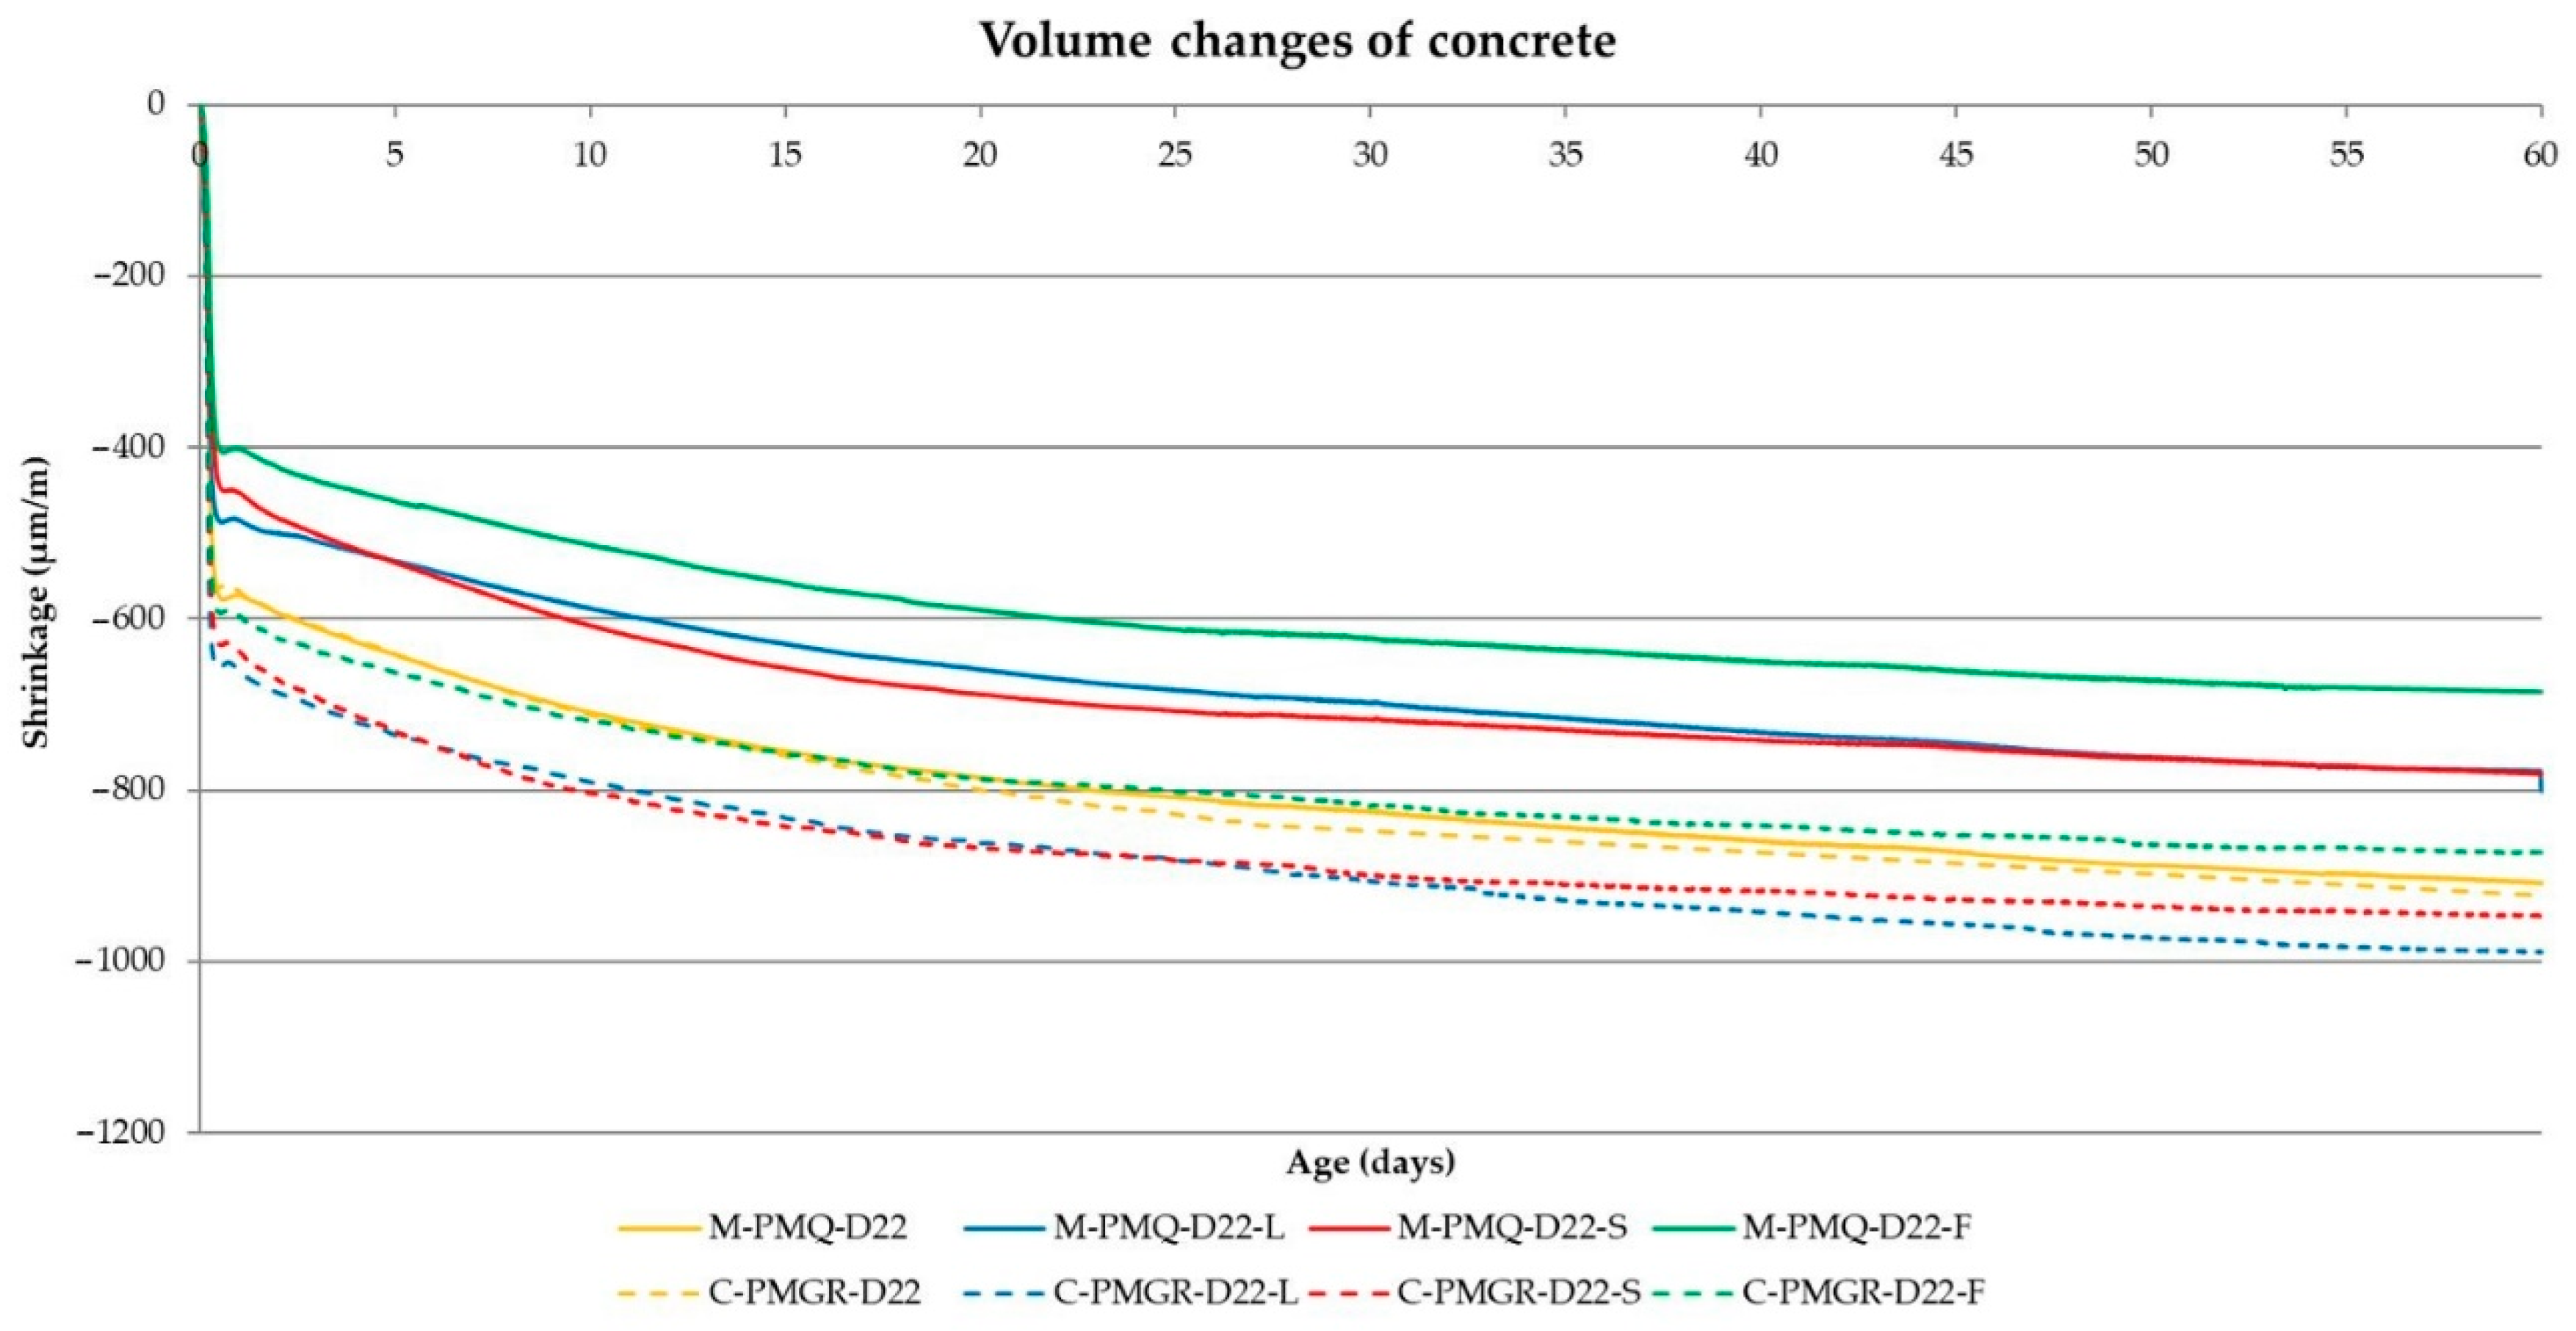
The main part of the performed experiment was to determine the impact of the type of aggregate on the volume changes of concrete. These results are shown in
Table 10. In the experiment, the evaluation of the achieved volume changes after 24 h from the production of the mixtures and after 3, 7, 14 and 28 days proves to be important. Therefore, these values are included in the following
Table 10 with the results. The course of the volume changes is shown in
Figure 8 and
Figure 9.
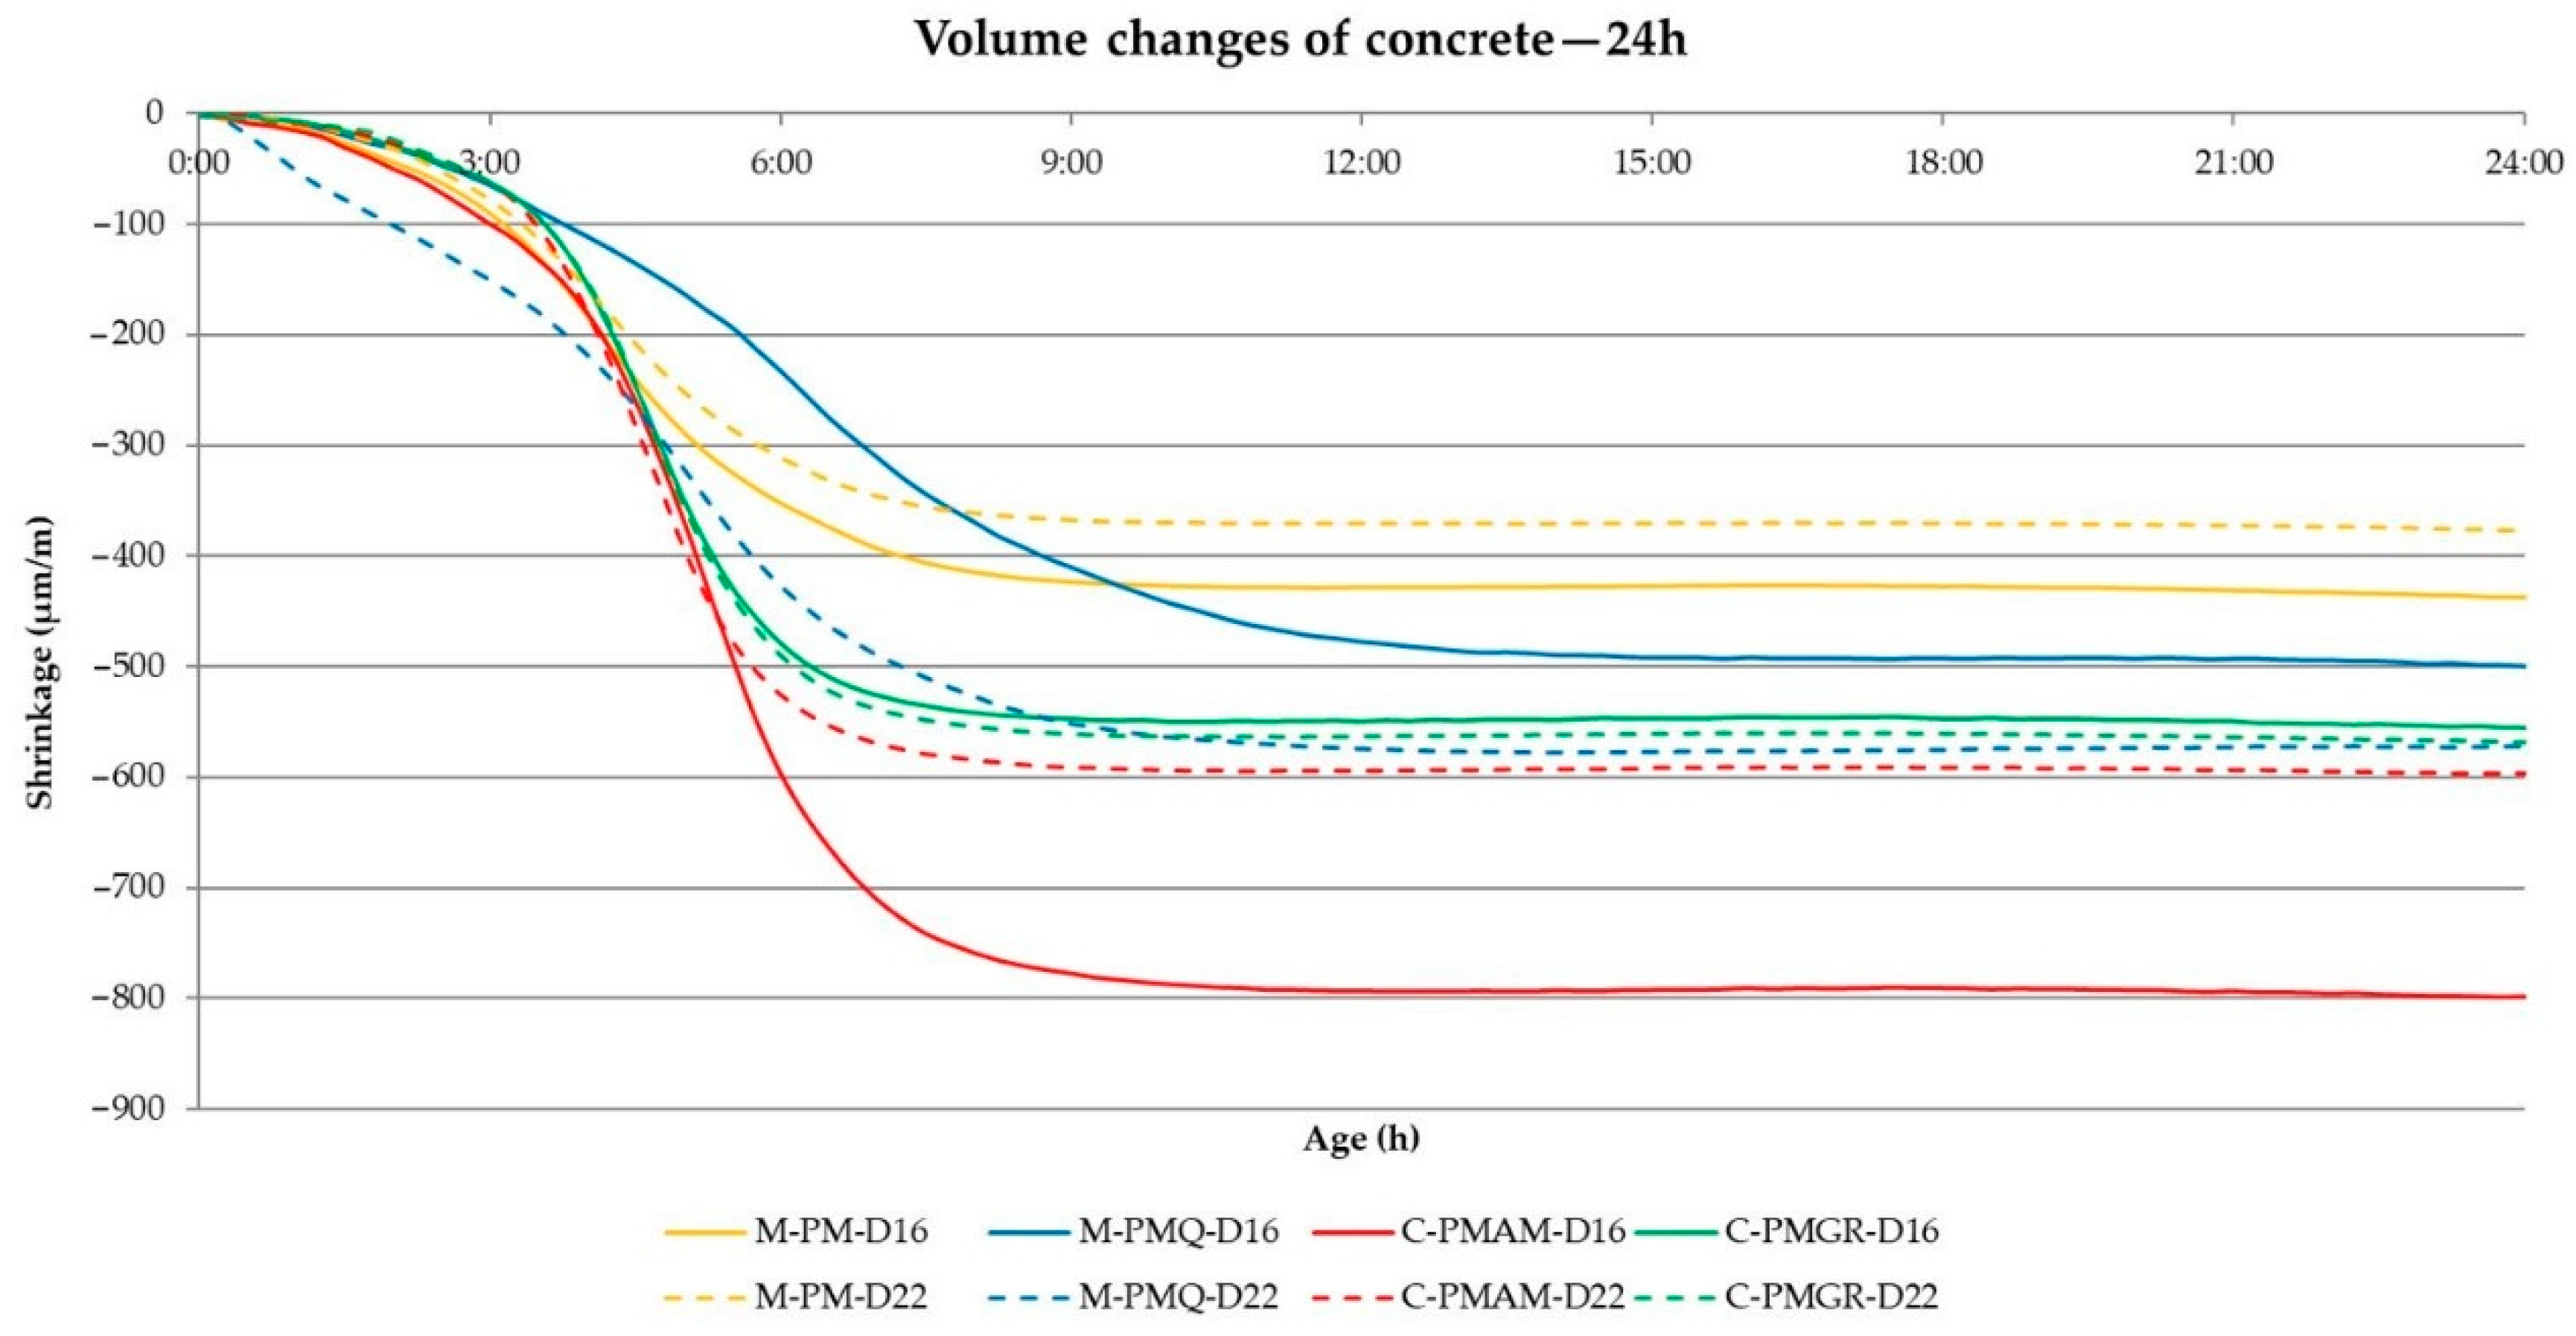
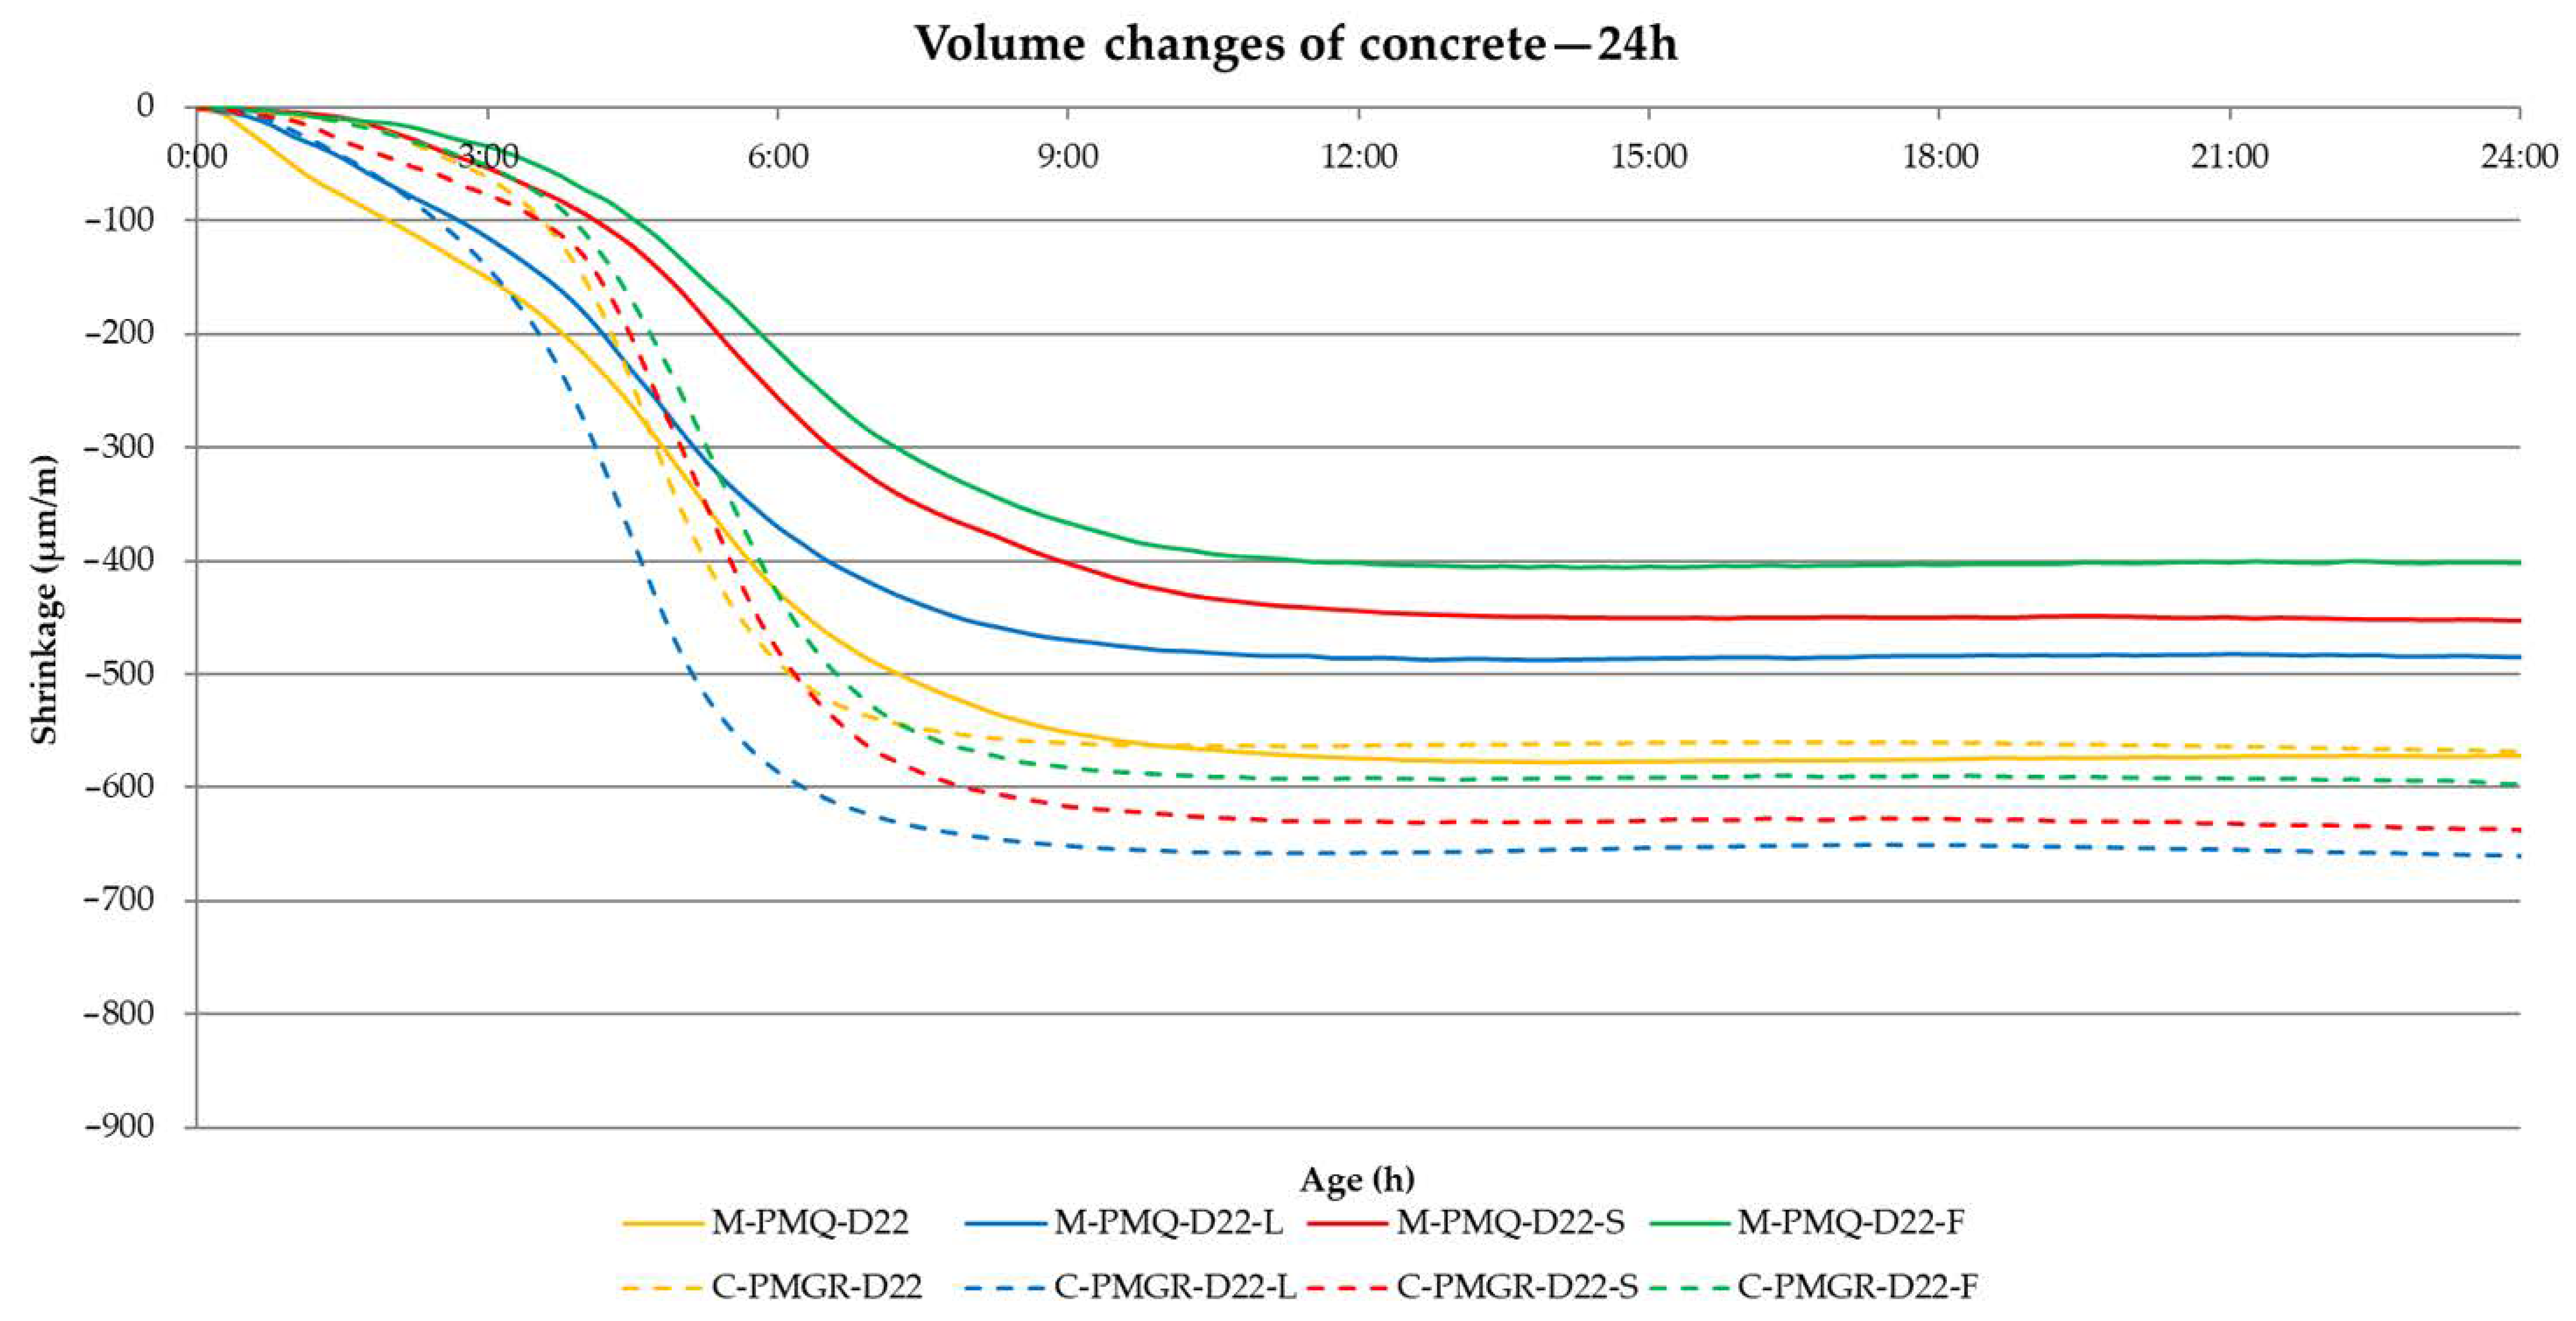
From the results of the volume changes of all produced concrete mixtures, it can be said that in all cases, more than 50% of the total volume changes will take place within 24 h of production (see
Table 10 and
Figure 8 and
Figure 9).
In addition, a difference between the formulas with mined and crushed aggregates can be observed for all mixtures. Although the consistency of all mixtures was the same, the final shrinkage value is lower in mixtures with aggregates PM and PMQ, where there was also lower w/c. Based on the course of the volume changes, these results show that a major part of the volume changes is due to drying shrinkage, which corresponds to the results presented by many researchers.
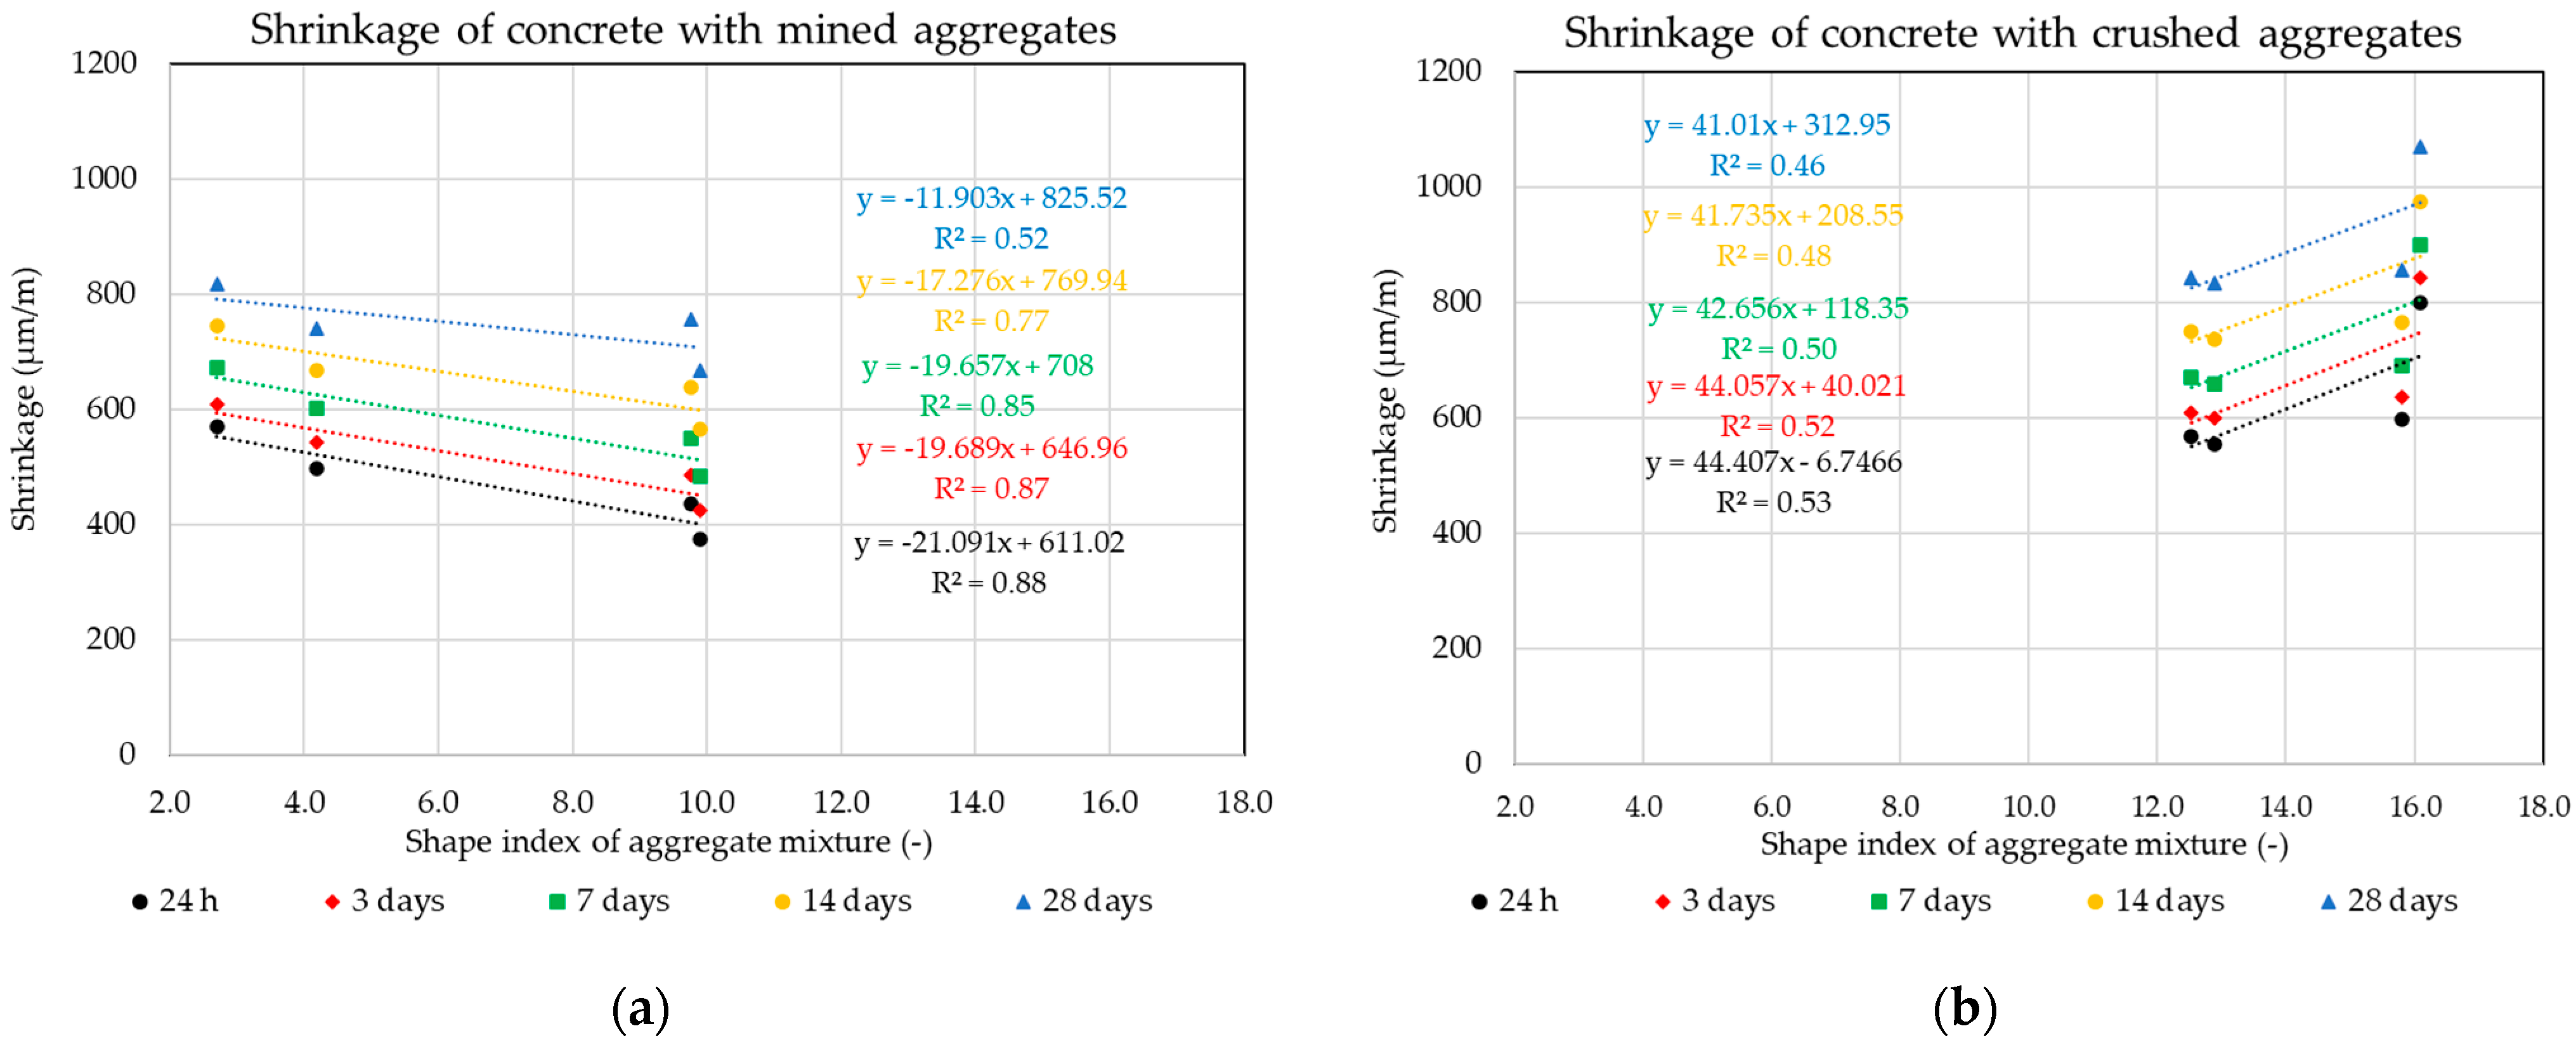
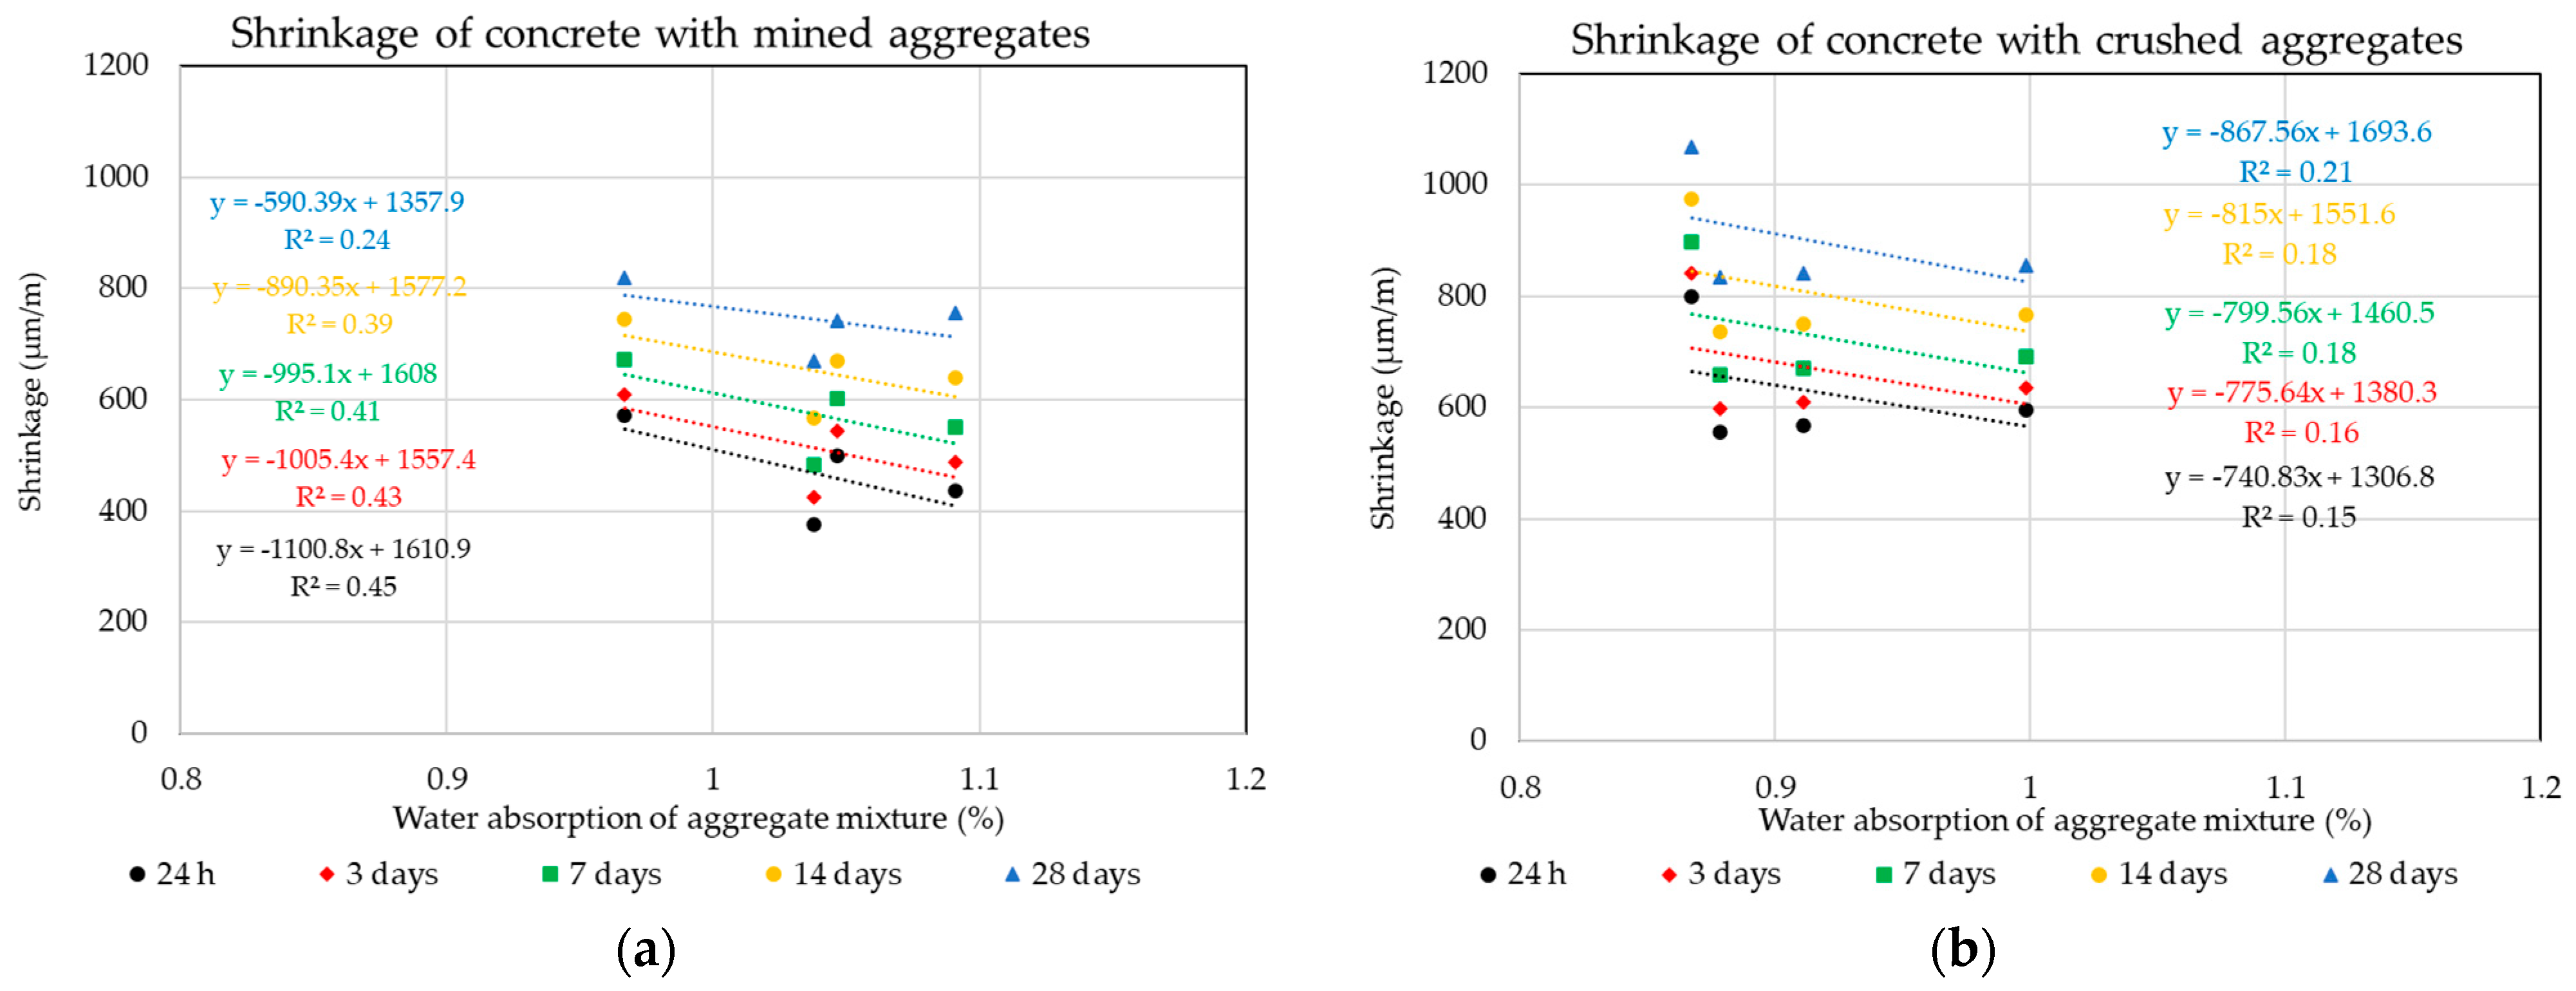
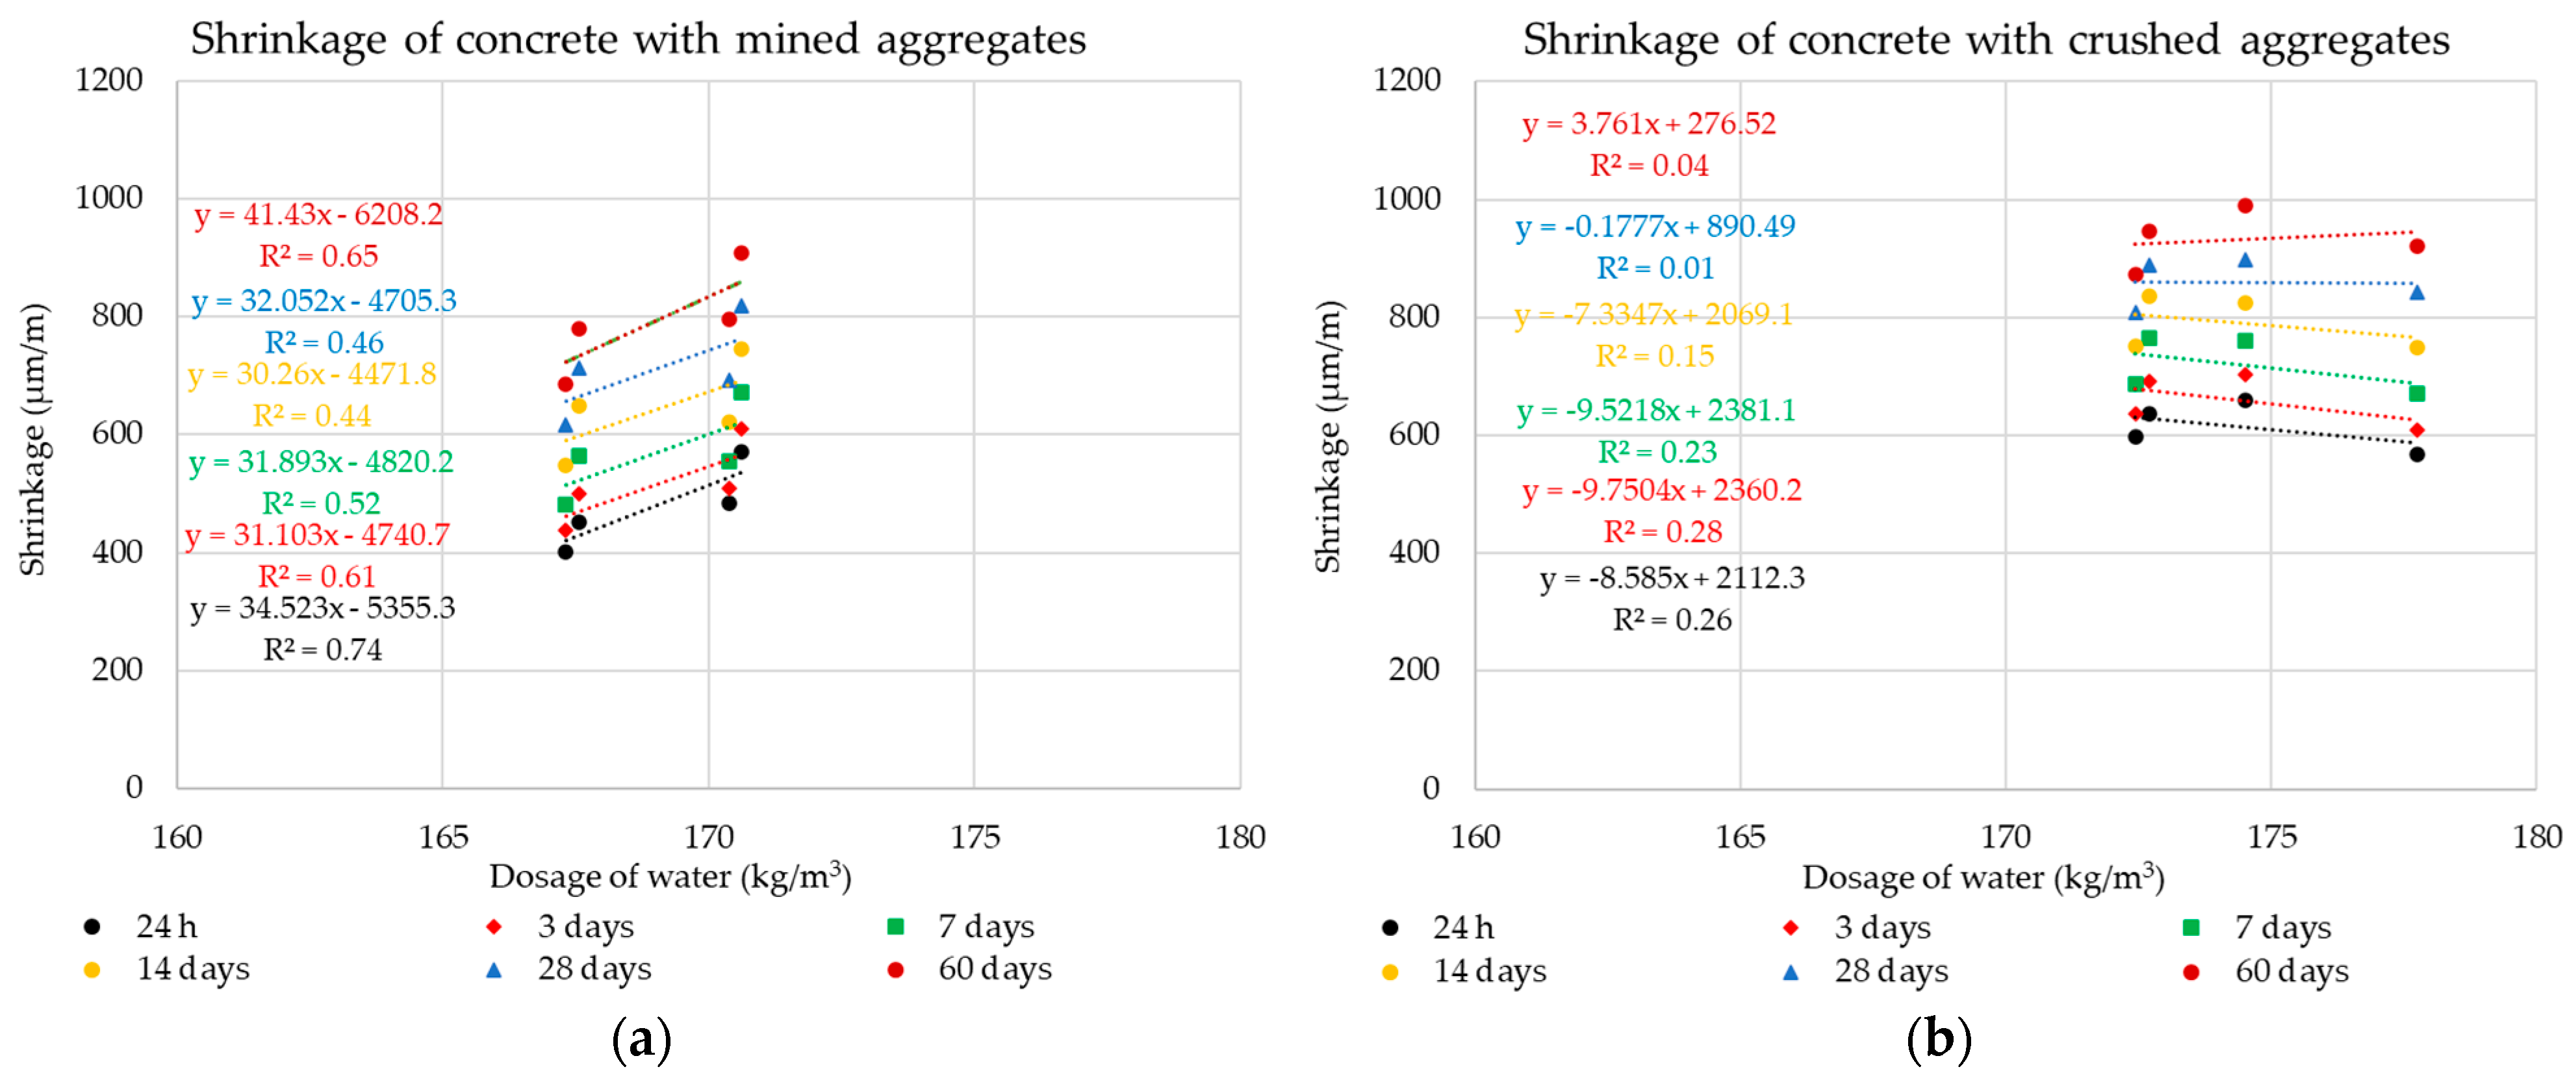
The following graphs in
Figure 10,
Figure 11,
Figure 12 and
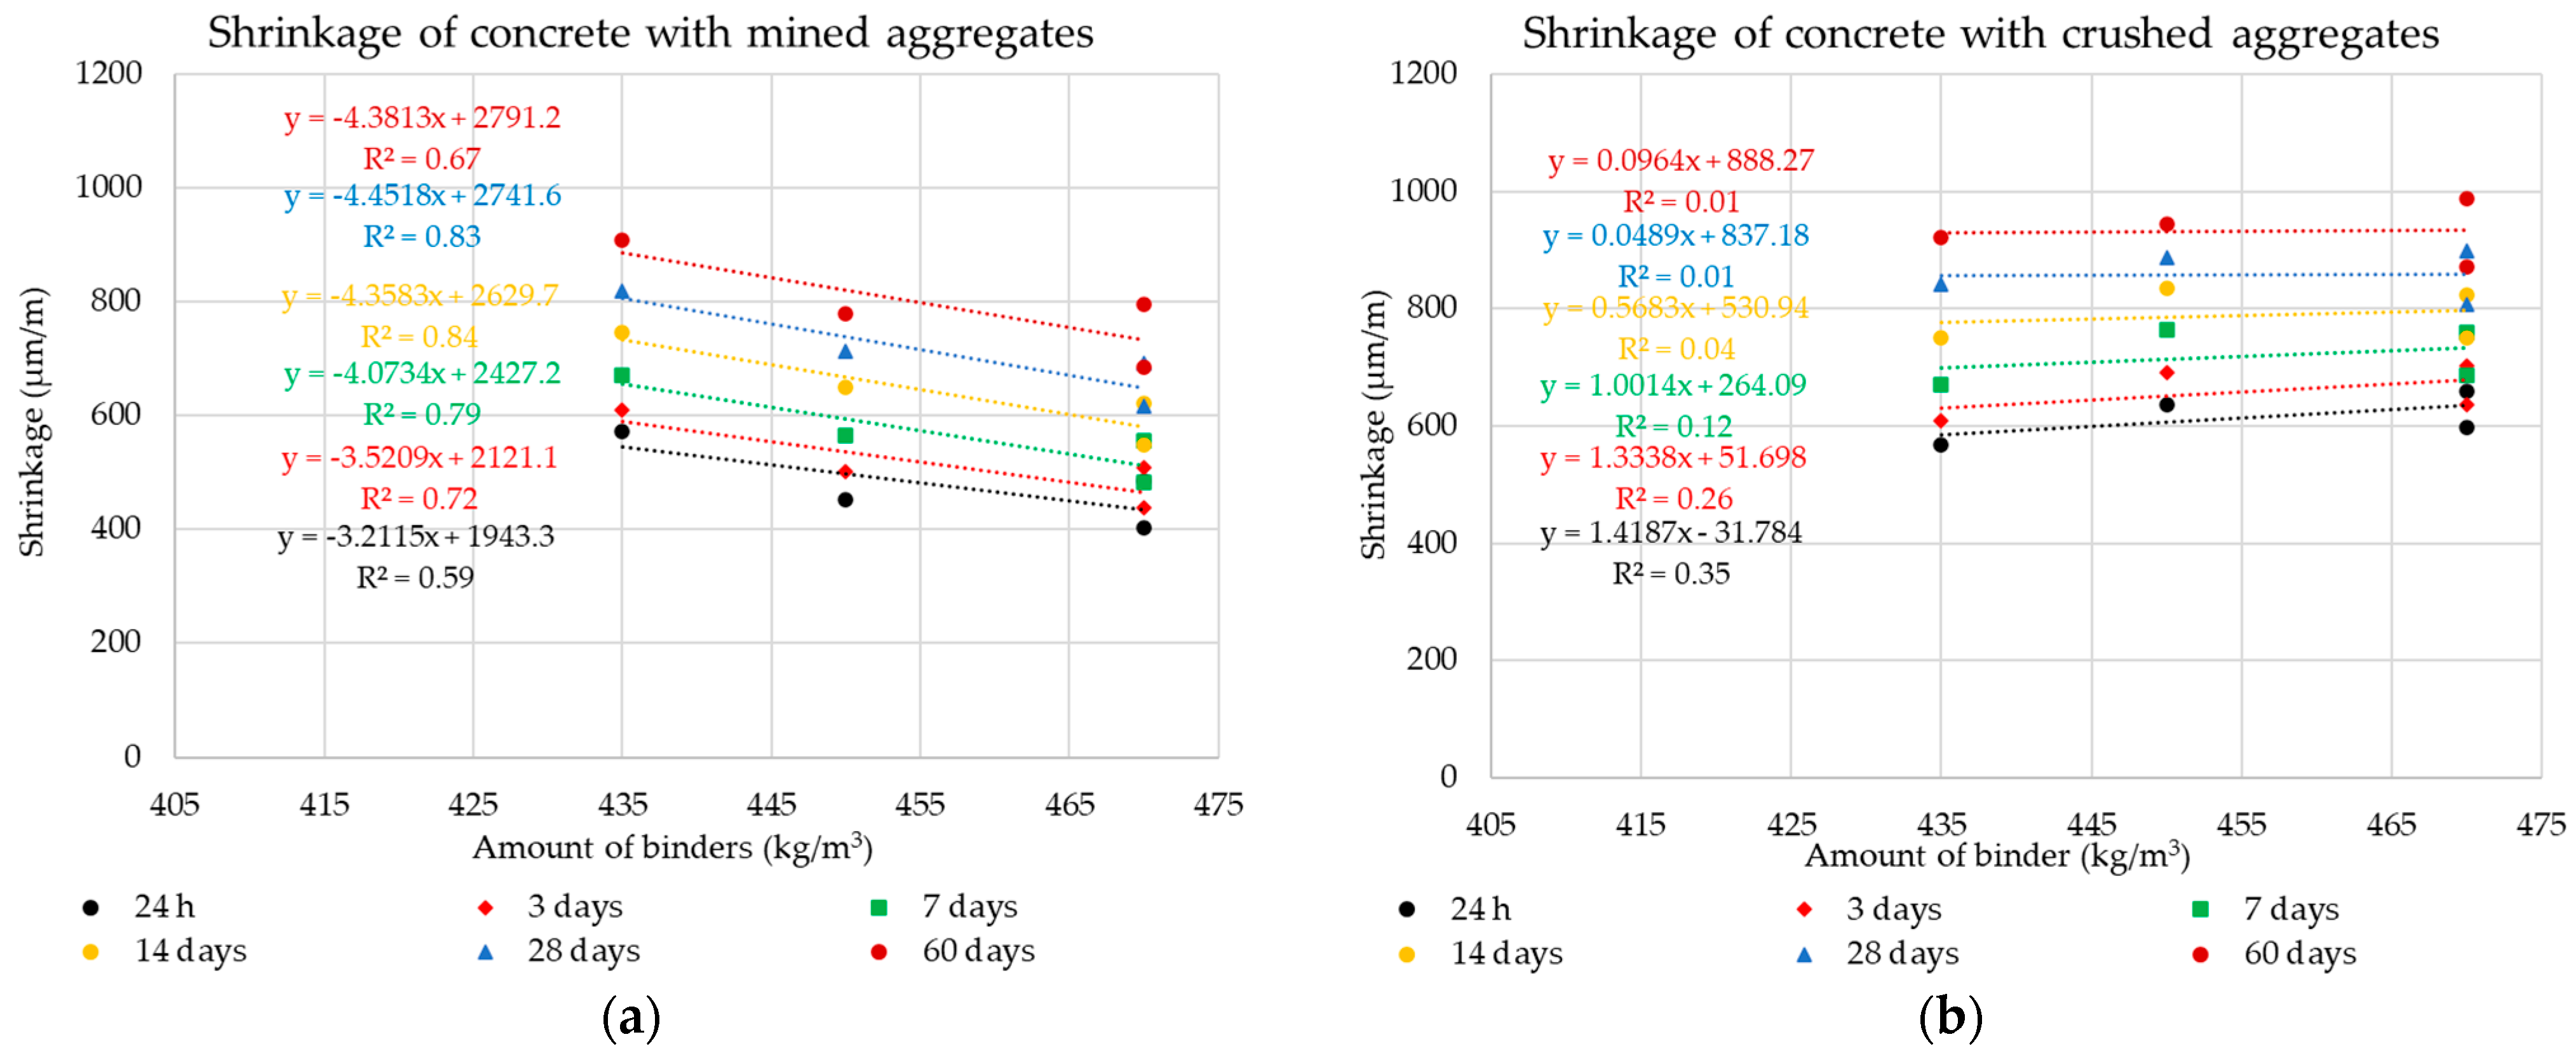
Figure 13 show the individual monitored dependencies, more specifically the effect of the shape index, the water absorption of the aggregate on the volume changes of concrete, the amount of particles size less the 0.125 mm and the dose of water on the volume changes of concrete.
These dependencies are further analyzed using the statistical method of Pearson’s correlation coefficient. Pearson’s correlation coefficient is a statistical indicator of the strength of a linear dependence between two quantities. It takes values from −1.0 to 1.0, and the closer the value is to 1 or −1, the stronger the linear correlation between the tested quantities. Positive values then indicate a positive linear correlation and negative, vice versa. Reaching a value of 0 means that there is no linear correlation between the monitored variables [
51,
52].
The water absorption values of the aggregate mixture for the individual formulas were calculated from the weighted averages according to the given composition and the representation of the individual fractions. The same procedure was used for the shape of aggregate grains using the shape index value. Due to the impossibility of including small, crushed aggregate in the shape of grains, the dependence of the amount of all fine fractions up to 0.125 mm on the volume changes of concrete was determined. The binder component and all grains of the aggregate mixture with a size of less than 0.125 mm are included in these fine fractions.
In order to more accurately determine the possible dependencies of the individual monitored parameters of the aggregate on the volume changes of concrete, the calculation of the Pearson’s correlation coefficient was performed. This coefficient was determined for a given parameter every 24 h and 7 and 28 days. The results are contained in
Table 11.
The results of the statistical analysis of the results obtained using the Pearson’s coefficient demonstrates that for conventional ready-mixed concretes, the production of mixtures with a discontinuous grading curve is not unsuitable from the point of view of negatively influencing the undesired volume changes of the composite. A significant dependence was observed in the overall water absorption of the aggregate mixture on the volume changes of the composite. The results of the experiment clearly prove that although the mined aggregates used achieve higher values of water absorption, this parameter is linearly and indirectly dependent on the resulting volume changes of the composite. This fact directly relates to the linear dependence of the water dose for the production of the mixture and its resulting volume change. It is obvious that although the mined aggregates used have a higher water absorption value, lower doses of mixing water were used for the production of the mixtures with these aggregates, which had a positive effect on the resulting volume changes of concrete composites [
17,
18,
19]. This result points to the inconsistency of published conclusions by many researchers that crushed aggregates with a larger specific surface can have a positive effect against undesirable volume changes of the composite and concrete mixtures produced using crushed aggregates, achieving lower volume changes [
53,
54]. The results of the experiment show that a higher dose of mixing water was required to moisten the surface of crushed aggregates, while achieving the same degree of consistency as mixtures with mined aggregates causes higher values of volume changes, especially in the first 24 h after their production. This fact is due to the higher value of shrinkage by drying, and the results show that this value is negatively affected mainly by the number of fine fractions in the aggregate and the shape of the aggregate, which indicates the specific surface of the resulting mixture of coarse aggregates.
For practice, it is beneficial to prove the effect of the type of aggregate used on the volume changes of the composite from its production to the age of 28 days. It is obvious that the effect of aggregate is most noticeable especially in the first 24 h after the production of the mixture, when the most significant volume changes occur mainly due to drying.
3.2. The Effect of Mineral Additives on the Volume Changes of Concrete
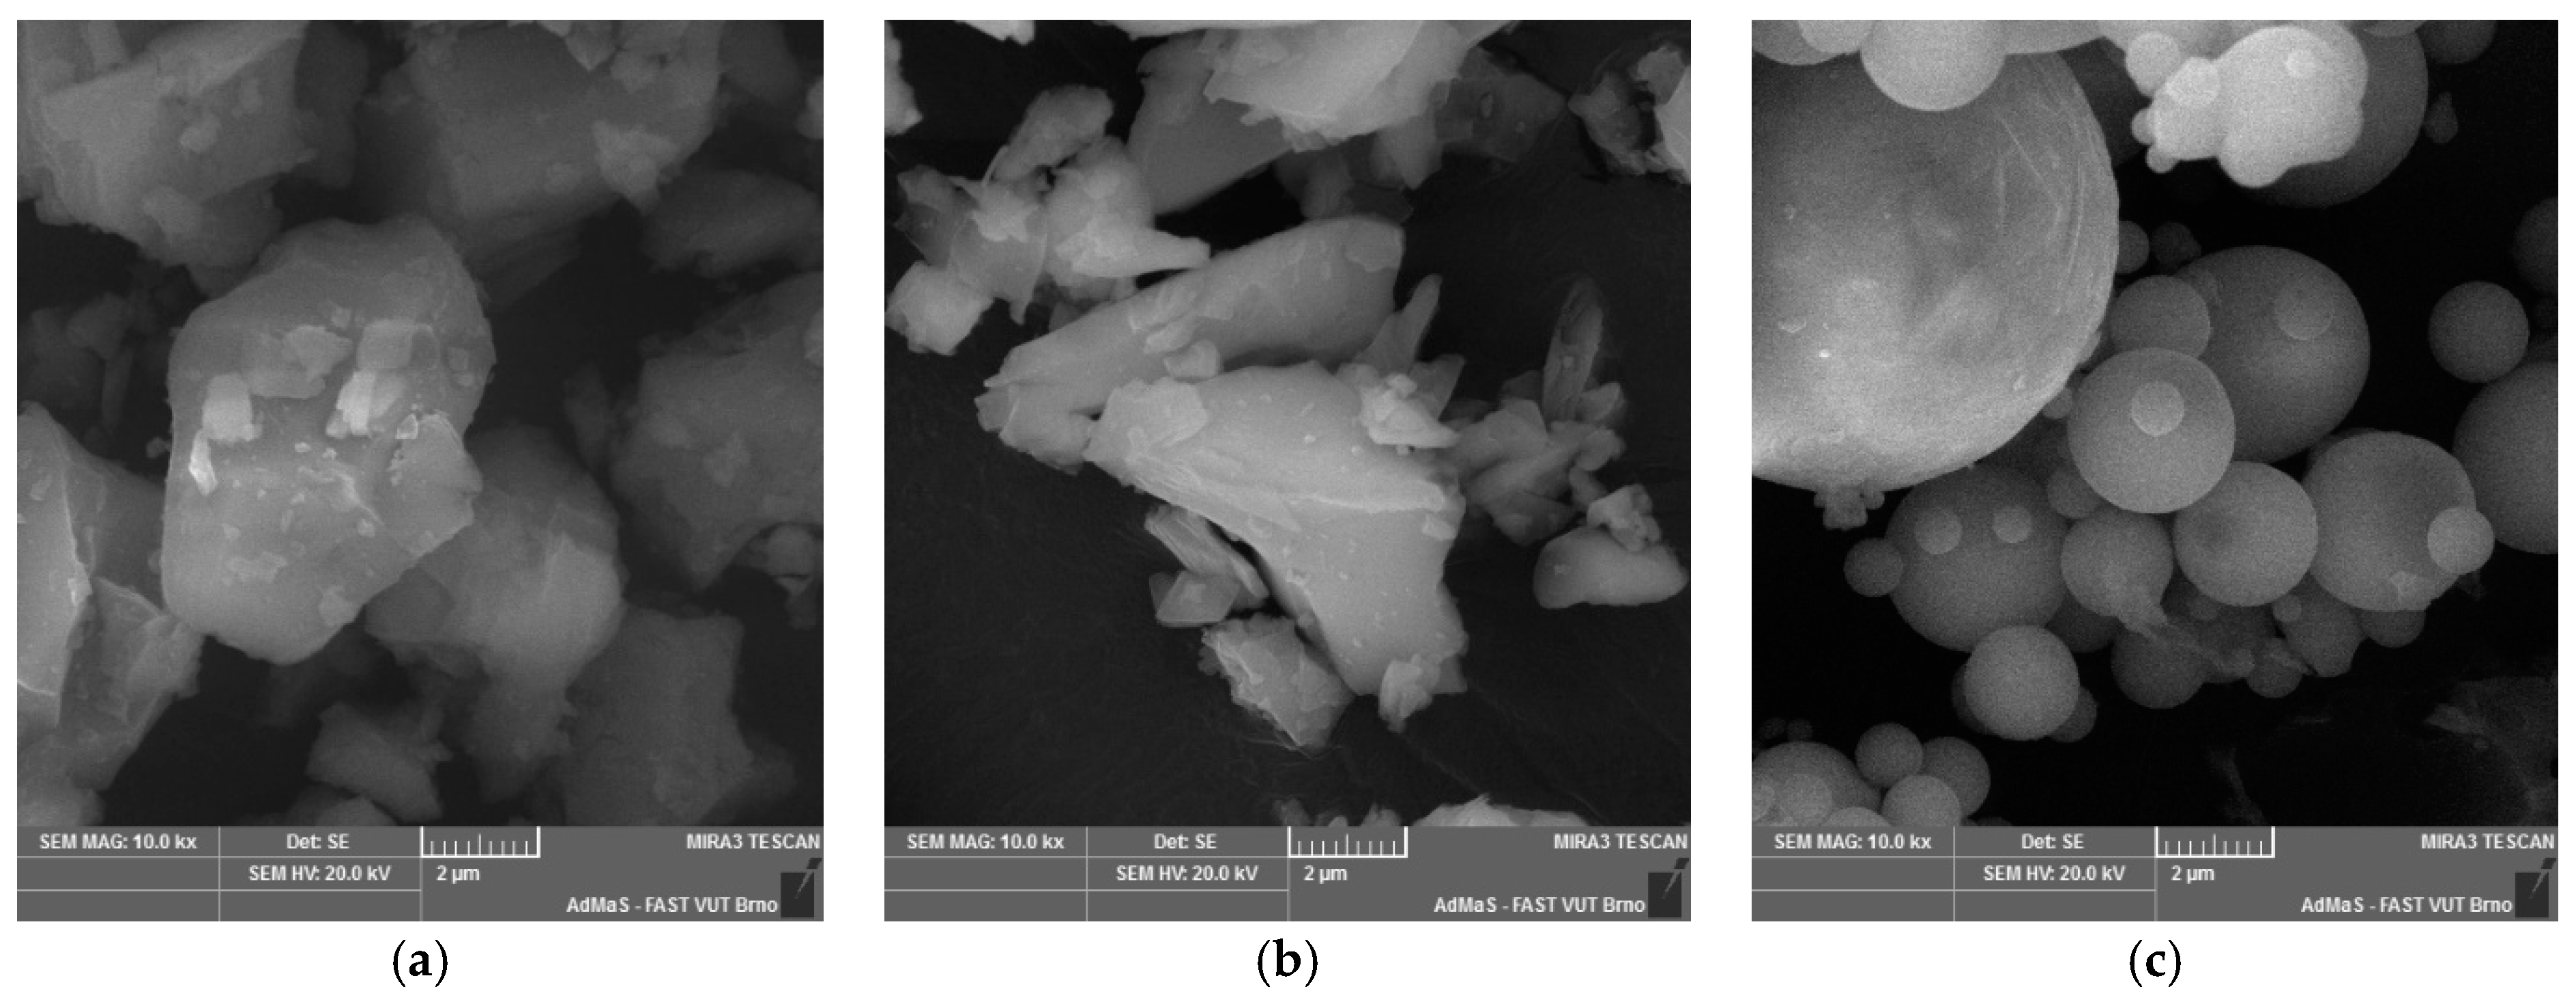
The concrete mixtures produced reached, as in the previous part of the experiment, a cone slump of about 190 mm. This degree of cone slump was again achieved thanks to a small correction of the water–cement ratio and the dose of the superplasticizer, as can be seen from the tables with the composition of individual formulas. For the mineral additives, the correction of the water–cement ratio and the dose of the superplasticizer were expected according to their grain morphology. From the analysis of the grain morphology of the mineral additives used under the scanning electron microscope, it is evident that the grains of the high-temperature fly ash are predominantly spherical in nature with a vitrified surface. For this mineral additive, a positive effect on the consistency of the concrete mixture was expected due to its addition. This fact has been proven in many research studies in which the effect of a sliding bearing is attributed to high-temperature fly ash, which have a ball shape [
55]. In the performed experiment, this fact was proven despite the different amount of binder component in the individual formulas to achieve the same strength parameters. The achieved results of the fresh concrete properties are contained in
Table 12, and the mechanical and physical parameters of hardened concrete are contained in
Figure 14.
The required strength class C 45/55 has been achieved for all mixtures, and for the use of the active additives, their pozzolanic or latent hydraulic activity is then evident with an increasing time from production. Although the compressive strength results after 28 days show slight mutual differences, these differences do not exceed more than 13%. The results show that concretes made of quality mined aggregates, which, for this experiment, are of the quartz type, can achieve higher compressive strengths than the concretes with crushed aggregates with the same composition. Regarding the flexural strength of concrete, the results obtained are the opposite, and, in accordance with previously written conclusions, concretes with crushed aggregate achieve higher values.
The results and courses of the volume changes of the concrete mixtures are contained in
Table 13, and
Figure 15 and
Figure 16. The performance of the test corresponds to the previous experiment described in
Section 2.1.
The results of the volume changes of the individual mixtures confirm the conclusion about the most significant part of the volume changes within 24 h of production in
Figure 16.
The results of the experiment indicate the suitability of using mineral additives to reduce volume changes. It has been proven that all the mineral additives used can be helpful in eliminating volume changes in concrete mixtures, where the most significant effect can be seen when using very finely ground limestone and high-temperature fly ash. For very finely ground limestone, this fact can be attributed to its practically inert nature, and for high-temperature fly ash, its grain morphology, which has a positive effect on the possible reduction of the water–cement ratio [
55].
It also seems constructive to point out the difference in the values of the volume changes for the mixtures with mined and crushed aggregates determined by both methods. Although most of the worldwide published results describe the suitability of using crushed aggregates for volume changes of the mixture, the opposite is true when determining volume changes immediately from the production of the mixture. Based on the graphical course of the volume changes in the first hours of maturation, this fact should probably be attributed to the different loss of moisture from the mixture, when a larger dose of water to moisten the grains of the crushed aggregate causes a larger value of volume changes. This trend can be seen in
Figure 16 and
Figure 17, which illustratively show the course of the volume changes within 12 h of the production of a mixture of concrete and fly ash using mined, crushed aggregate.
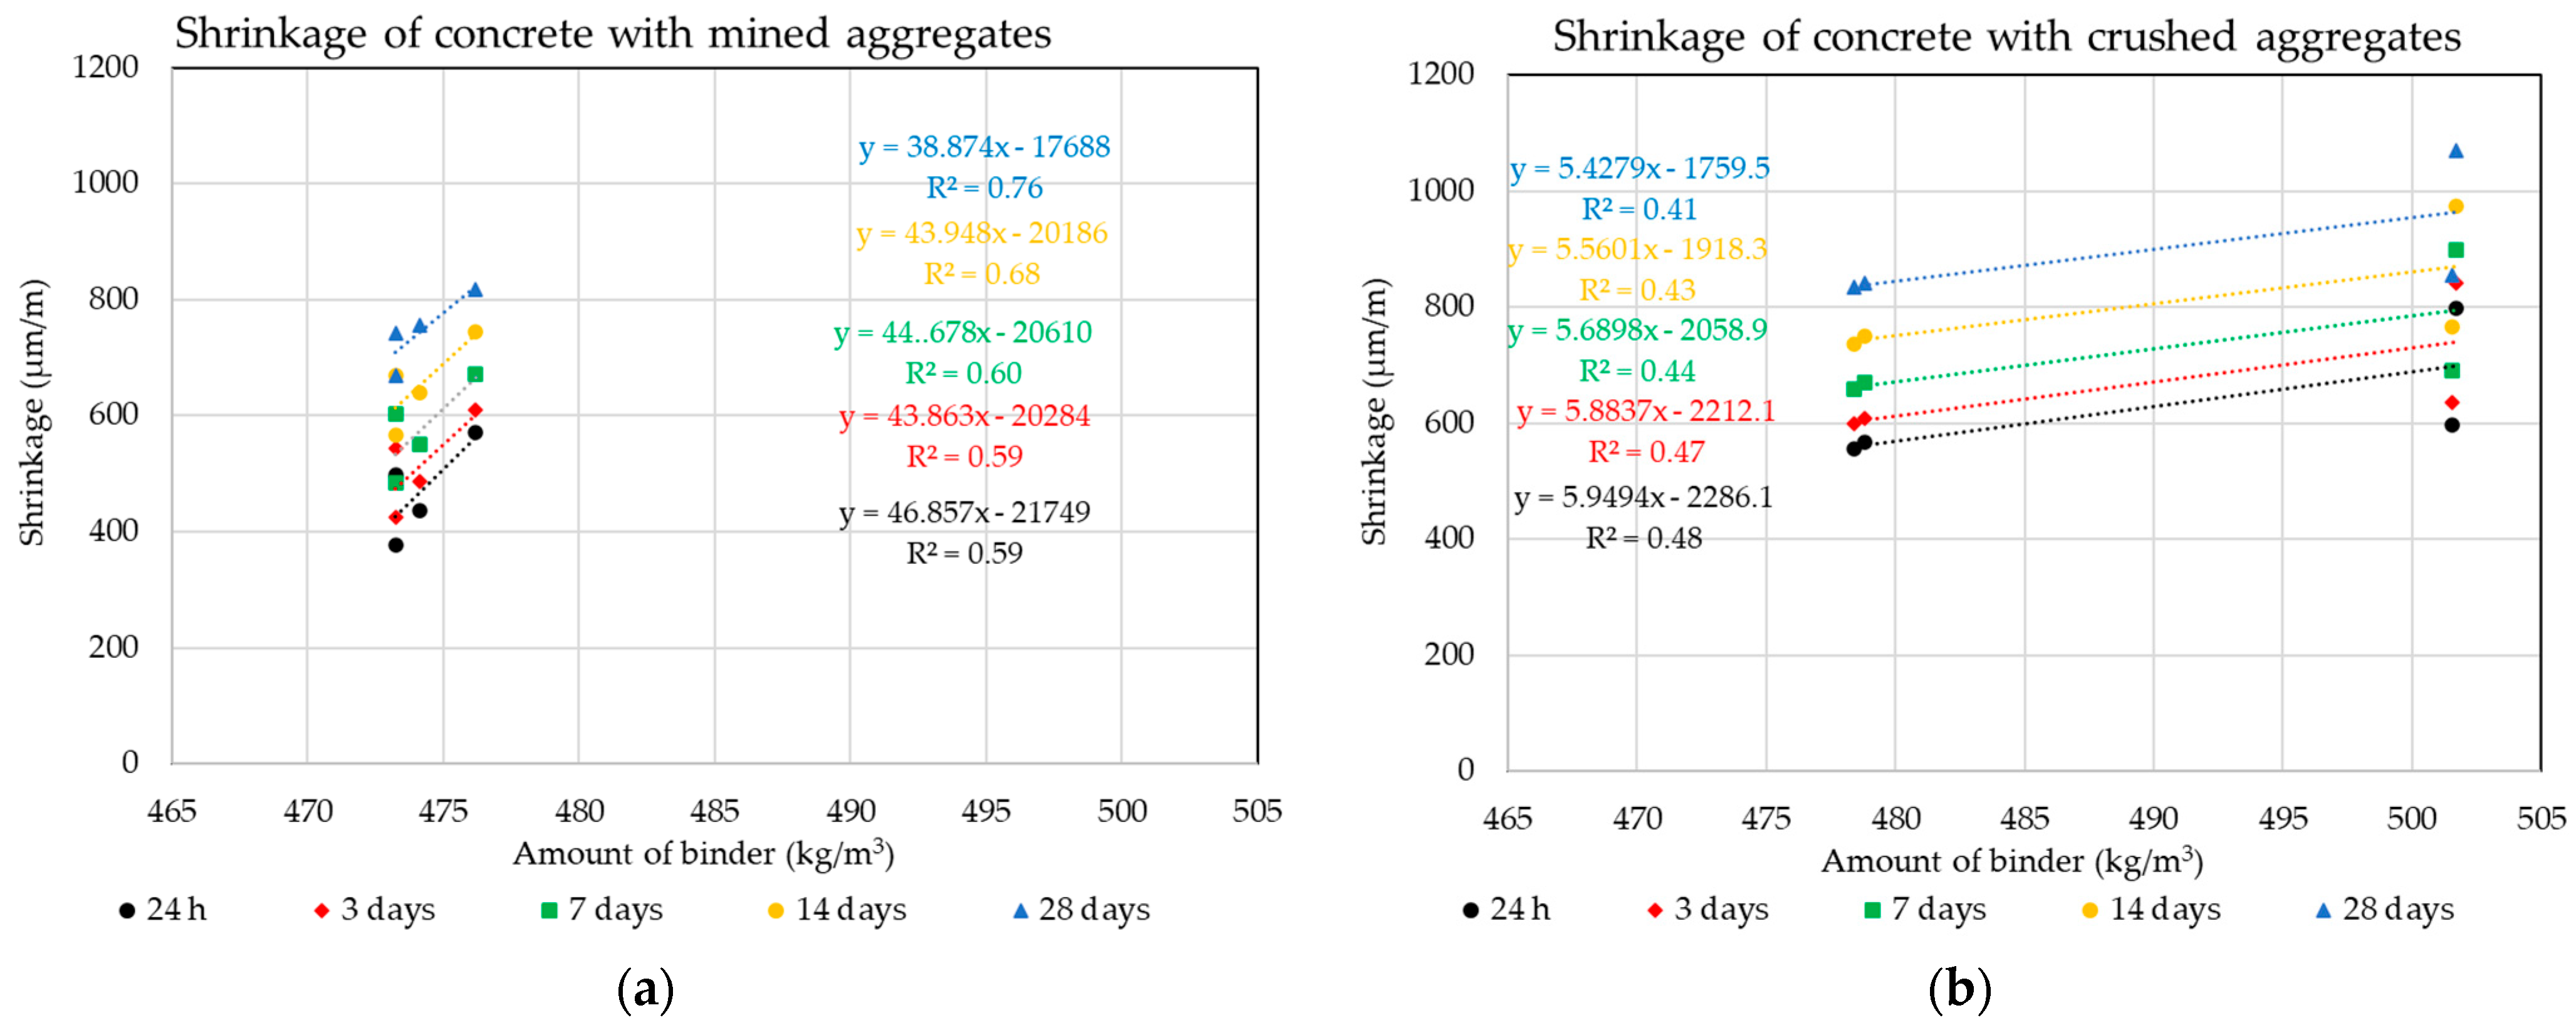
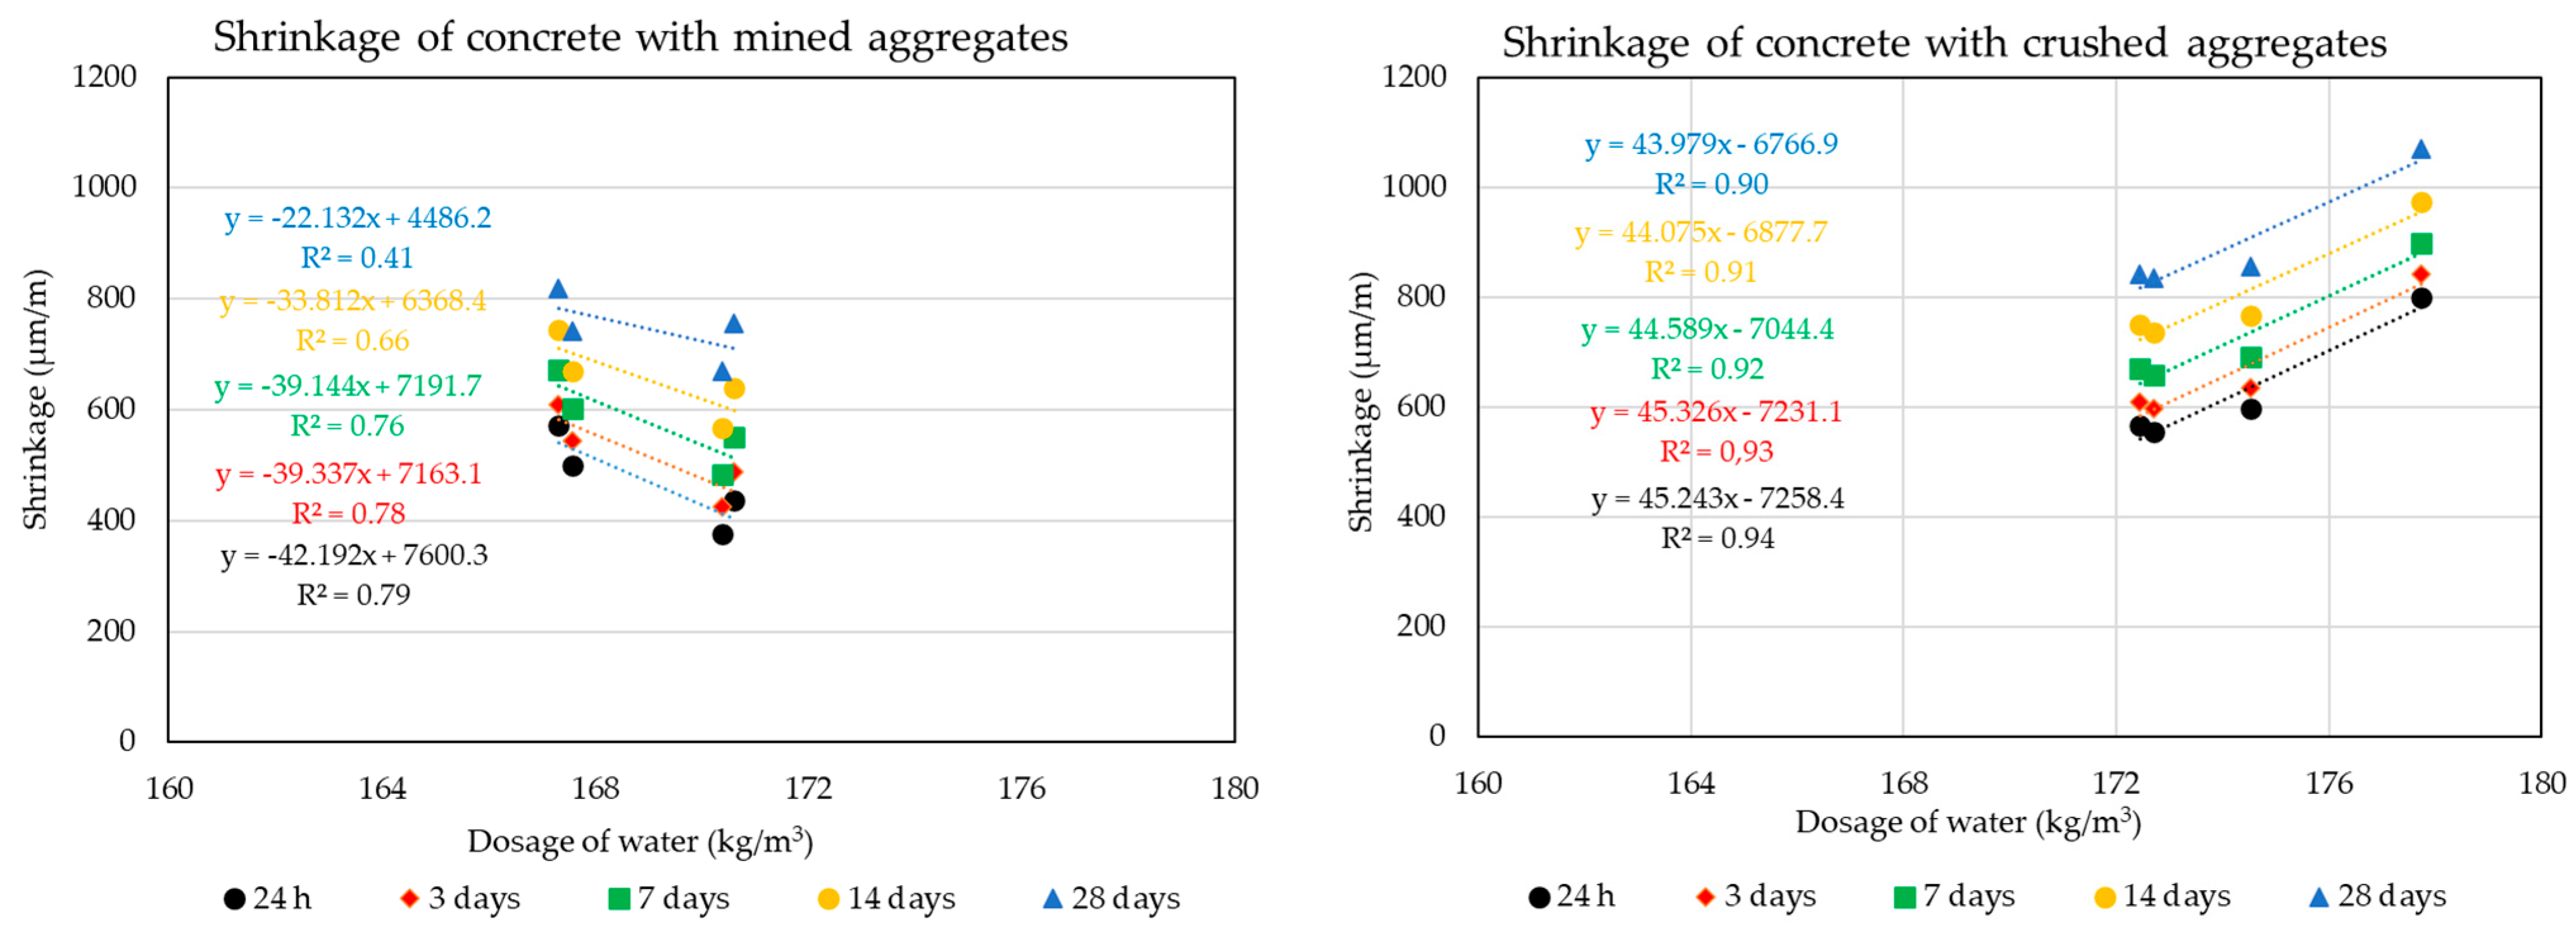
The following graphs in
Figure 18 and
Figure 19 show the effect of the dose of binder components and the amount of water on this parameter. These dependencies are further analyzed again using the statistical method of Pearson’s correlation coefficient.
The results of the calculation of the Pearson’s correlation coefficient are contained in
Table 14.
Using Pearson’s correlation coefficient, it was not possible to prove a direct dependence of the amount of binder component, which is formed by Portland cement and different doses of diverse additives, on the volume changes of the composite (see
Figure 18 and
Figure 19). This fact testifies in particular to the different behavior of individual types of additives. It is clear from the results that even higher doses of the binder component when using finely ground limestone or high-temperature fly ash, which is increased mainly by the dose of these additives, do not have a negative effect on the resulting volume changes of the composite. The results of the experiment show that high-temperature fly ash and very finely ground limestone can be an effective way for eliminating undesirable volume changes of concrete mixtures of higher strength classes.
These results further directly relate to the dose of water required to achieve the same degree of consistency of all mixtures and the resulting volume changes. It is obvious that in this part of the study, a dependence was found between the dose of mixing water and the volume changes of the composite. This fact directly relates to the water–cement ratio, which, however, is significantly influenced by the grain morphology of the individual types of additives. The most suitable grain shape from the point of view of morphology from the images of the grains of the individual additives used (
Figure 13) shows high-temperature fly ash. This shape of grain is the most suitable from the point of view of the rheology of the fresh concrete mixtures. The grains of this additive are predominantly spherical with a minimum of surface defects. The remaining two additives used underwent a grinding mechanism, which corresponds to their grain shape. For the ground blast furnace slag, a significant sharpness of individual grains is evident, which is given by their high strength and resistance to grinding. It is obvious that the process of grinding blast furnace slag has a negative impact on its effect on the rheological behavior of cement composites. For finely ground limestones, their grains are not so sharp-edged.
In addition to the effect of the individual types of additives used on the rheology of composites, their impact on the resulting volume changes of concrete is further attributed to their chemical effect. Very finely ground limestone behaves almost inertly from the point of view of chemical processes, and its use as a filler makes it possible, above all, to form a denser matrix of the composite. This can have a partial effect on the outflow of water from the composite after its production, which can have a direct effect on drying shrinkage. The course of the volume changes of the mixtures with very finely ground limestone correspond to this statement and is evident, especially with a longer maturation period. Although, for example, for the mixtures with ground blast furnace slag, shrinkage is almost complete after 28 days. For mixtures with very finely ground limestone, a more pronounced direction of the shrinkage curve can be seen even after this age. This difference between the volume changes after 28 and 60 days can still be about 15% for the mixtures with very finely ground limestone. For these mixtures, it is necessary to pay increased attention to the volume changes with a longer maturation period.
Of all the types of additives used, the use of high-temperature fly ash seems to be the most suitable for practicing eliminating negative volume changes. In addition, this additive has an incredibly positive effect on the development of hydration temperatures, which is widely used in the concreting of massive structures. In concrete mixtures, where the use of high-temperature fly ash is unsuitable, it is possible to eliminate volume changes using very finely ground limestone or ground blast furnace slag.


 ,
, 


