5.1.1. Relationship between Fracture Toughness and Crack Propagation Resistance
The fracture criterion for crack instability propagation is
. From the stress field near the crack tip, the fracture toughness
in the two-parameter fracture model is obtained. Using the mode I flat plate crack as an example, the relationship between stress intensity factor
and energy release rate
is given by Equation (1):
In the critical state, the relationship is given by Equation (2):
In fracture mechanics, the criterion for fracture is
. Therefore, the energy release rate
on the left side can be used to measure whether a crack will propagate, and this is the crack propagation force.
on the right side denotes the resistance of crack propagation, which reflects the ability of the material to prevent cracks, as expressed by
. When the crack propagation force is greater than the crack propagation resistance, the crack begins to propagate. In this case, the energy release rate
is shown in Equation (3):
Based on Equation (3),
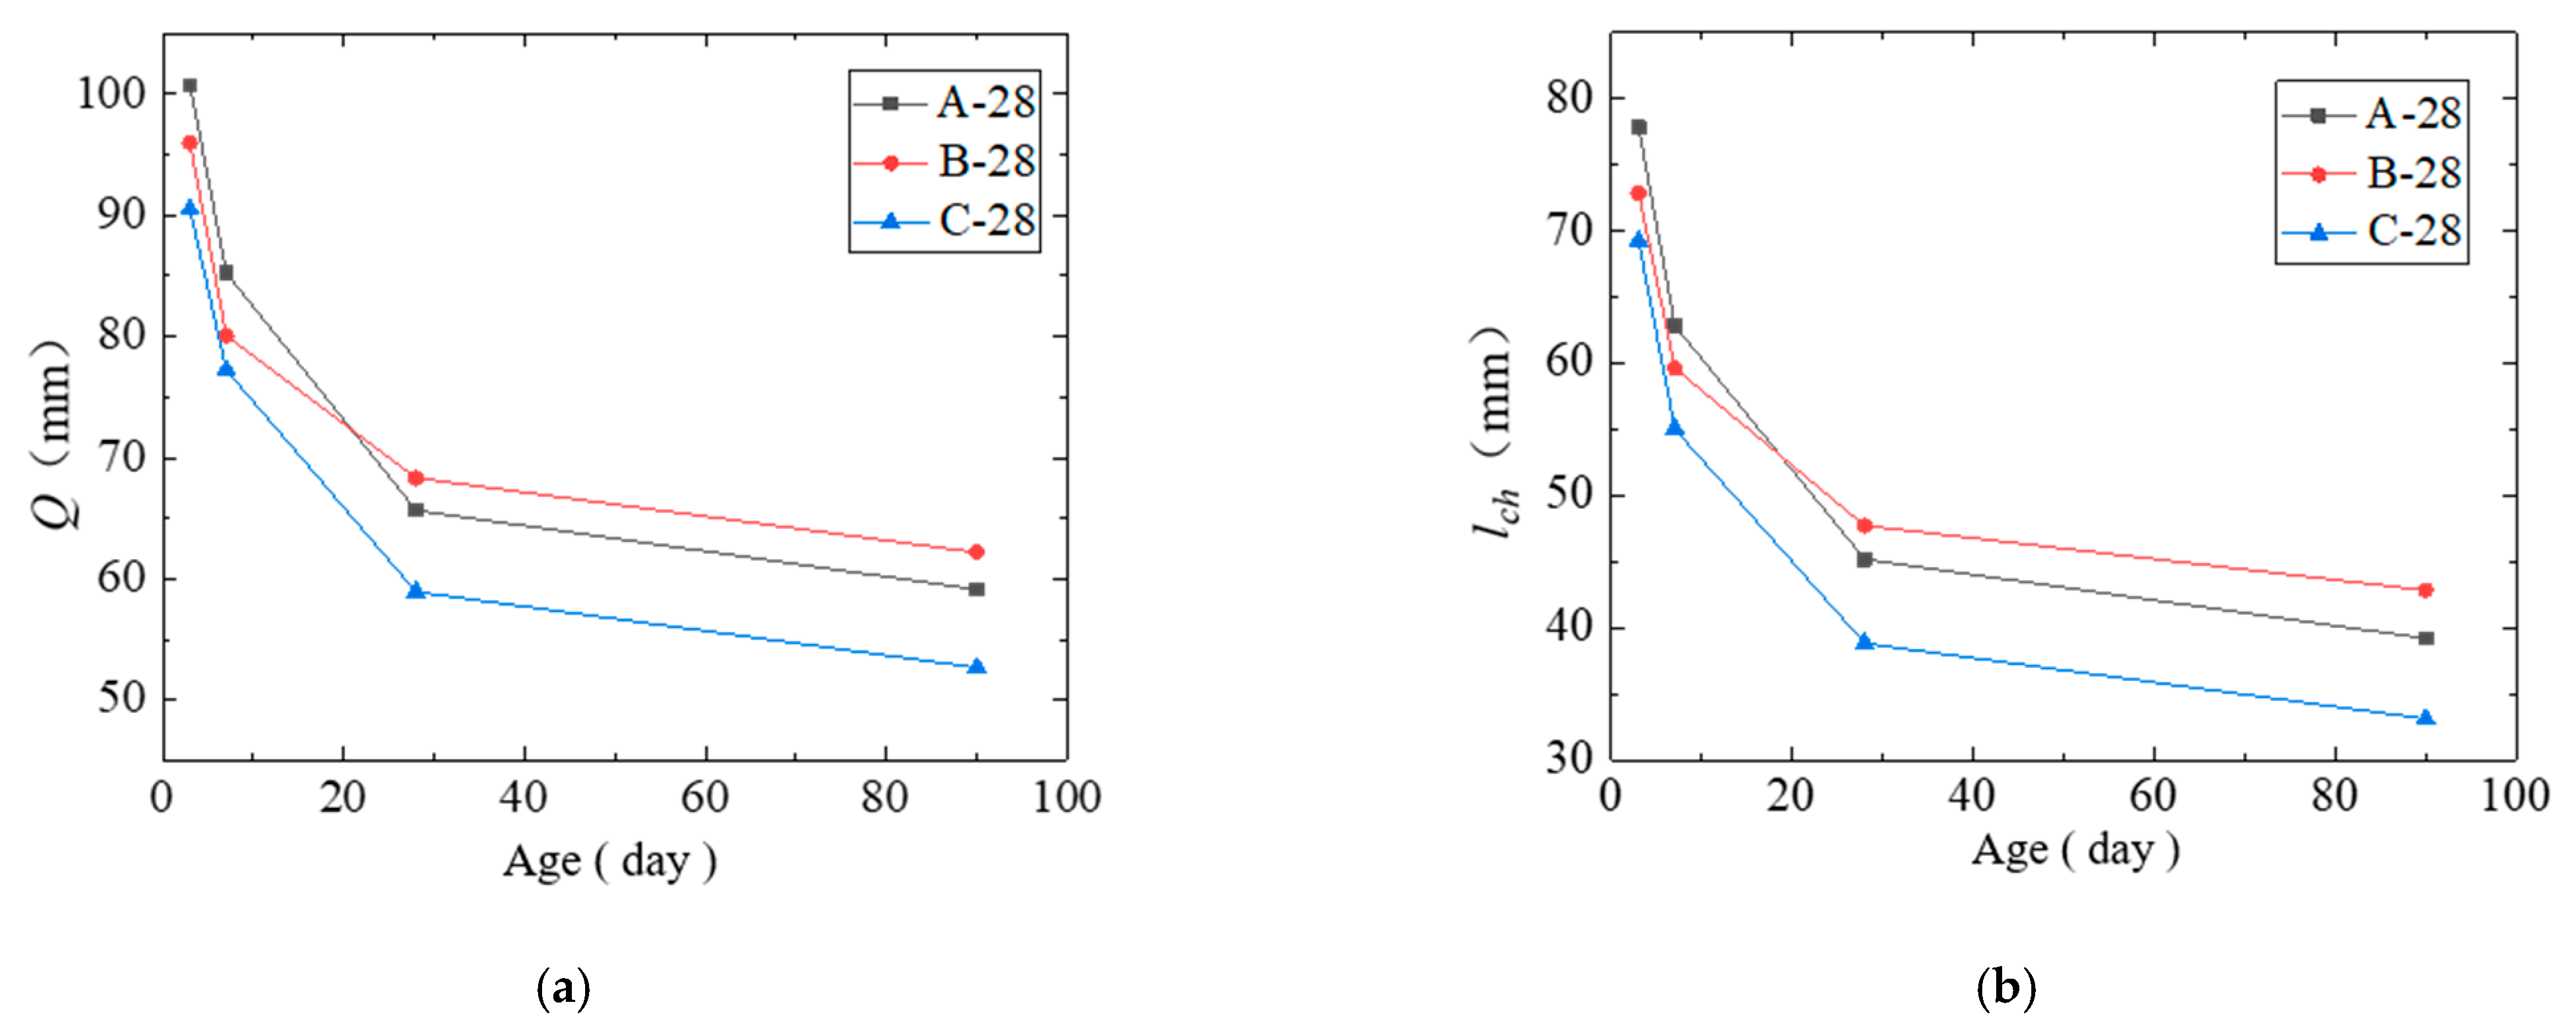
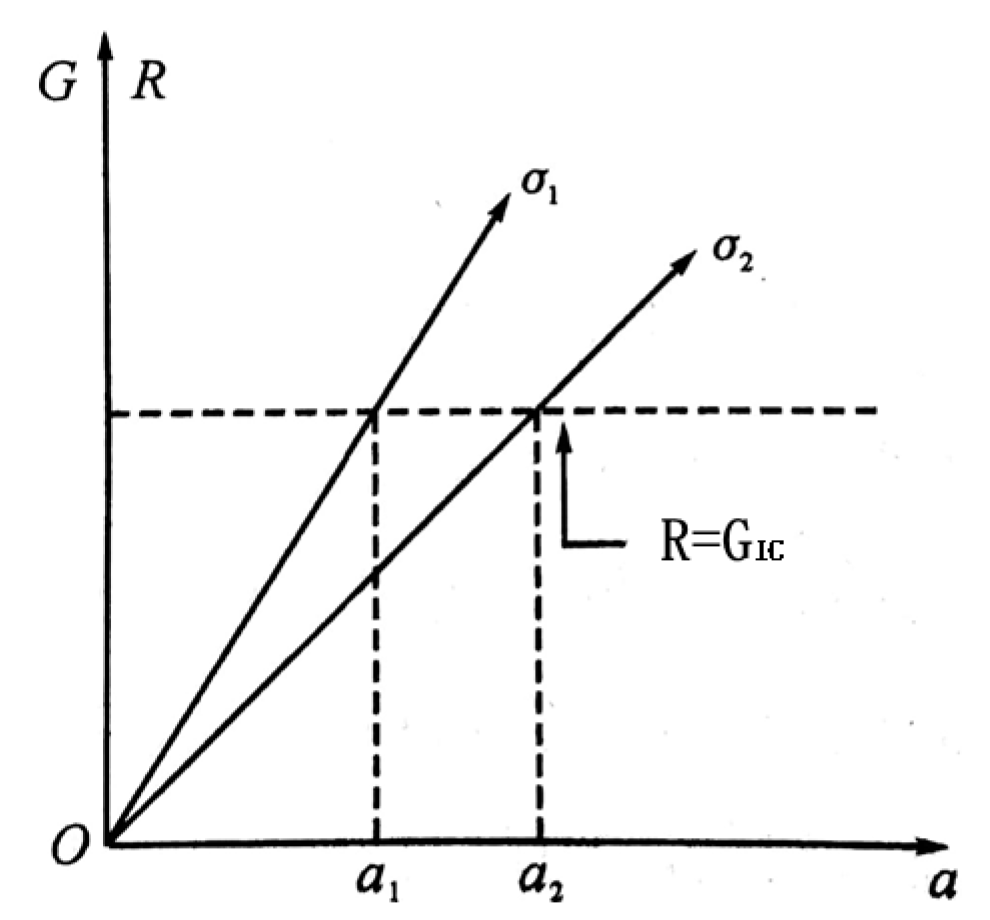
Figure 20 shows the relationship of
,
, and
. The horizontal axis is the crack length
, and the vertical axis is the crack propagation resistance
and crack propagation force
. When the tensile stress is constant, the crack propagation force
increases linearly as
increased. When brittle fracture occurs, the crack propagation resistance
is determined by
, and the fracture toughness is a material constant that does not change with the crack length,
. Therefore, the dotted line represents the crack propagation resistance line.
When the tensile stress
is applied, the crack propagation resistance
is reached when the length of the crack reaches
, and instability and fracture occur when the length of the crack exceeds
, and this is also true when tensile stress
is applied. Thus, Equation (4) was obtained:
5.1.2. Study on Mode I Crack Damage and Fracture Based on Energy Release
(1) The crack-tip damage zone in concrete is the transition zone at the crack tip, which is a micro-crack zone that is caused by tensile stresses. It is appropriate to use the maximum tensile stress theory to study the mode I crack of concrete.
Based on the maximum tensile stress theory:
where
is the first principal stress in elasticity and the maximum tensile stress;
is the tensile strength of the material.
(2) The damage strain energy release rate can be calculated according to the following equations:
For damaged materials, the elastic strain energy is given by:
The elastic complementary energy is given by:
The damage strain energy release rate is:
Equation (9) is obtained after tensor calculus:
Therefore, the hydrostatic pressure can be determined by
, and the deviatoric stress tensor as
, where the von Mises equivalent stress is given by Equation (10):
Equation (11) can be obtained from Equation (9):
where
is the triaxial stress factor, which is expressed by Equation (12):
Therefore, a mode I crack under uniaxial stress can be expressed, where
,
,
:
Where Equation (13)’s equivalent stress is .
(3) The following is a discussion on the relationship between and . When the concrete bears the load, a damaged area appears first. When the load increases, the damaged area increases, resulting in a release of energy. When the critical state is reached, the fracture zone appears, and a critical value for energy release also appears, with the damage energy release rate being equal to the fracture energy release rate. When the load increases further, cracks appear in the concrete, and the cracks expand as the load increases.
The cracks are generated in the damage zone and are accompanied by the release of energy. When the material is damaged by loading, the damage deterioration process will be shortened, accelerating the fracture of the material.
Equation (14) presents the energy relationship in the critical state:
where
is the elastic strain energy;
is the damage variable;
is the crack length; and
is the critical damage variable.
Equation (14) expresses that and are constant at the beginning of macroscopic crack formation, and they are in a critical state. Equation (14) also establishes the relationship between damage and fracture. However, this study only focuses on the mode I crack, which is an open crack, and the loading mode is the same as that of the Loland model. Therefore, the Loland model is used to study the coupling relationship between damage and fracture.
(4) The damage and fracture coupling of the mode I crack are analyzed in this section. The tip of the mode I crack exists as a microcrack damage zone, the shape and size of this zone are depicted in
Figure 21 and Equation (15):
where
is the tensile strength;
is the stress intensity factor; and
is the radius of the microcrack damage zone.
For a mode I crack, the expression of
is given in Equation (16):
(5) The equivalent principle of effective stress and strain can also be obtained. In damage mechanics, the damage variable is defined as the ratio of the damaged area
to an area without damage
,
. Effective stress
is defined by Equation (17):
where
is the nominal stress.
Without considering the material damage, the elastic constitutive equation without considering material damage is
. The nominal stress is replaced by the effective stress, and the elastic constitutive equation of the damaged material can be obtained by Equation (18):
The stress–strain relationship of the damaged concrete is given by Equation (19):
The expression of the mode I crack stress intensity factor of concrete considering damage is:
The effective stress of the materials can be expressed by Equation (21):
Additionally, the constitutive relation follows:
where
is the ultimate strain when
;
is the peak strain; and
is the net elastic modulus of damaged concrete, according to:
where
is the elastic modulus of the undamaged material, and
is the initial damage to a material before loading.
5.1.3. Effect of Loading Age on Fracture Toughness
(1) To assess the damage caused by immediate strain, the Loland damage model considers the initial damage of materials and considers that the damage will occur when the load is applied, which indicates that the damage evolves gradually under load.
The data obtained from the uniaxial tensile test of concrete were fitted, and the damage evolution is given by Equation (24):
where
, and
are the material constants, and when
,
,
, and when
,
. Therefore, Equation (25) can be obtained:
where
).
According to [
27], the critical damage variable
, initial damage
, peak stress
, peak strain
, ultimate strain
, initial elastic modulus
MPa, and tensile strength
MPa.
The above data are substituted into Equation (23); therefore,
MPa, and
,
,
, and
are obtained. The material constants mentioned above are substituted into the damage evolution equation, and Equation (26) is obtained:
(2) The creep deformation caused by the load increases the internal strain energy of the material. When the accumulated strain energy exceeds a certain limit, some strain energy is released due to the micro-crack and will be converted into the surface energy of the crack, which causes crack initiation and expansion inside the concrete. The overall elastic modulus of the concrete decreases with the development of microcracks; thus, creep deformation increases. The coupling effect of damage and creep causes the cracks to develop more rapidly, leading to concrete failure. Based on the statistical damage constitutive model and the randomness of defect distribution, the internal damage of the concrete under long-term continuous load is considered.
The damage variable is defined as the ratio of the number of damaged micro units to the total number of units in the material. Combined with the continuous damage statistical strength theory, it can accurately reflect the mechanical properties of brittle materials.
Assuming that
obeys the Weibull distribution, its probability density distribution function can be expressed by Equation (27):
where
is the unit strength of the concrete material;
and
are the concrete Weibull parameters; and
is the Weibull distribution variable of the micro-unit. When
exceeds
, the micro-unit begins to damage, according to:
Equation (27) is substituted into Equation (28), and the damage variable
can be expressed by Equation (29):
Based on Equation (29), determining the micro-unit strength is the most important value in the statistical damage model. is defined as the effective strain energy of the micro-unit, where , is the effective stress, and is the effective strain. The failure condition of the micro-unit occurs when the strain energy exceeds the critical value.
Based on the test,
and
MPa. The damage variable
is given by Equation (30):
(3) Tensile creep
is assessed. The MC2010 model is suitable for ordinary concrete, where compressive stress < 0.4
, the average compressive strength is 20–130 MPa after 28 days, the relative humidity is 40–100%, average temperature is 5–30 °C, and the loading age > 1 day. Therefore, this model was suitable for assessing tensile concrete, and the MC2010 model [
28] was applied in this study.
The creep of concrete under
is given by Equation (31):
where
is the creep of concrete, and
is the elastic modulus of concrete after the 28th day.
For the compressive strength of concrete at the 28th day
, Equation (32) follows:
where
MPa, and
is the coefficient related to aggregate type, which in this case, consisted of limestone,
.
The creep coefficient of concrete is given by Equation (33):
where
is the nominal creep coefficient;
is time function of the creep process;
is the relative humidity correction factor;
is the correction factor of the concrete strength; and
is the correction factor of the loading age of the concrete, according to:
where
is the relative humidity of the surrounding environment;
is the effective thickness of the section;
,
is the cross-section area of the section;
is the circumference of the specimen in contact with the atmosphere;
is concrete age;
is the loading age of the concrete;
is the average compressive strength at the 28th day; and
,
MPa,
is the characteristic value of concrete strength, and
,
MPa,
= 40%,
= 50 mm,
= 50 MPa.
(4) The immediate strain of concrete
is given by:
where
is the immediate strain of the concrete, and
is the elastic modulus at loading age
; therefore,
where
is the coefficient related to concrete, which is given by:
where
is the function that describes time development, which is given by:
where
is the coefficient depending on the strength grade of the cement, and for 42.5R cement,
.
5.1.4. Effect of Curing Conditions on Fracture Toughness
The coupling effect of temperature and time can be considered according to maturity, and the relationship between fracture parameters and maturity can be established.
The previous experimental data and discussion indicated that the fracture toughness was approximately logarithmic with the age, and this regulation was consistent with the research results that have been obtained by many scholars. For example, the research conducted by Mi Zhengxiang [
29] showed that the fracture behavior of concrete was approximately logarithmic with the age. Furthermore, Lin Chen [
30] believed that the fracture toughness of concrete increased predictably with an increase in compressive strength, and the relationship between fracture toughness and compressive strength was approximately in the form of a double broken line, and the turning point was 40% of the compressive strength of concrete at the 28th day. In addition,
changed logarithmically with the age because the setting degree and hydration degree at each age were different. Therefore, in the early stages of cement hydration,
increased more intensely, and then gradually slowed down with the age.
In this study, maturity was introduced to include the effects of curing condition, temperature, and age on fracture characteristics. Combined with the fracture test results of the concrete under different curing conditions at each age, the relationship between fracture parameters and maturity of the concrete was studied. Finally, a relationship between fracture toughness and the equivalent maturity of the concrete was obtained.
Nures [
31] and Saul [
32] defined the maturity
of concrete as a function of temperature
and time
:
where
is maturity, °C×d;
is the average temperature in
, °C;
is the reference temperature, °C; where
= −10 °C;
t is the total time, d; and
is the time step, d.
The concrete maturity was calculated by Equation (44), and the development model of the fracture toughness for concrete maturity was established in [
33]. However, the correlation coefficient
was only above 0.56.
Based on the double-broken line relationship between fracture toughness and compressive strength from [
34], the effect of the curing temperature on the fracture properties of concrete before 28 days had passed was greater than the mechanical properties. However, after a certain age, the effect decreased, and the fracture parameters increased with the age. This may explain the low correlation coefficient. Considering the effects of temperature and age on the fracture parameters of the concrete, the proportion of temperature effect in the first 28 days should be increased. Therefore, the equivalent maturity proposed by Guan Junfeng [
33] was applied:
where
is equivalent maturity, °C×d;
is the equivalent temperature, °C;
is the age, d; and
is curing time, d.
In Equation (44), the temperature is the internal temperature of the concrete. Because the specimen was small, the internal temperature of the concrete could disperse quickly, and the increase of temperature was not high. Ni Tongyuan [
34] found that the internal temperature increase in concrete was less than 5 °C before 0.8 days; thus, the effect of the internal temperature in concrete was not considered. Due to the different effect proportions of temperature and age, the curing temperature was used as the equivalent temperature before the 28th day, and the average curing temperature during the first 28 days was used as the equivalent temperature after the 28th day.
For three days of steam curing, the temperature was 45 °C, and natural curing was applied from the 3rd to the 28th day, the temperature was 45 °C, and the equivalent temperature was
. For standard curing for 28 days, the temperature was 21 °C, and the equivalent temperature was
. In the samples that had been naturally cured for 28 days, the temperature was 14.5 °C, and the equivalent temperature was
. After the 28th day, the equivalent maturity of the three curing methods was as follows:
By substituting the equivalent maturity into the relationship between the maturity and stress intensity factors, the change in the stress intensity factor with time under different curing conditions could be obtained:
The time-dependent model of concrete fracture toughness under different curing conditions and continuous load could therefore be expressed by:
In Equation (50), , , and are the pending parameters, and , , , , , and are the unknown parameters in the creep equation, and is the age when load begins to apply.


