
Assessment of the Starch-Amylolytic Complex of Rye Flours by Traditional Methods and Modern One

 ,
,  and
and
Abstract
:1. Introduction
2. Materials and Methods
2.1. Materials
2.2. Methods
2.2.1. Chemical Composition of Rye Flour
2.2.2. Properties of a Starch–Amylolytic Complex of Rye Flour
Falling Number and Amylograph Properties
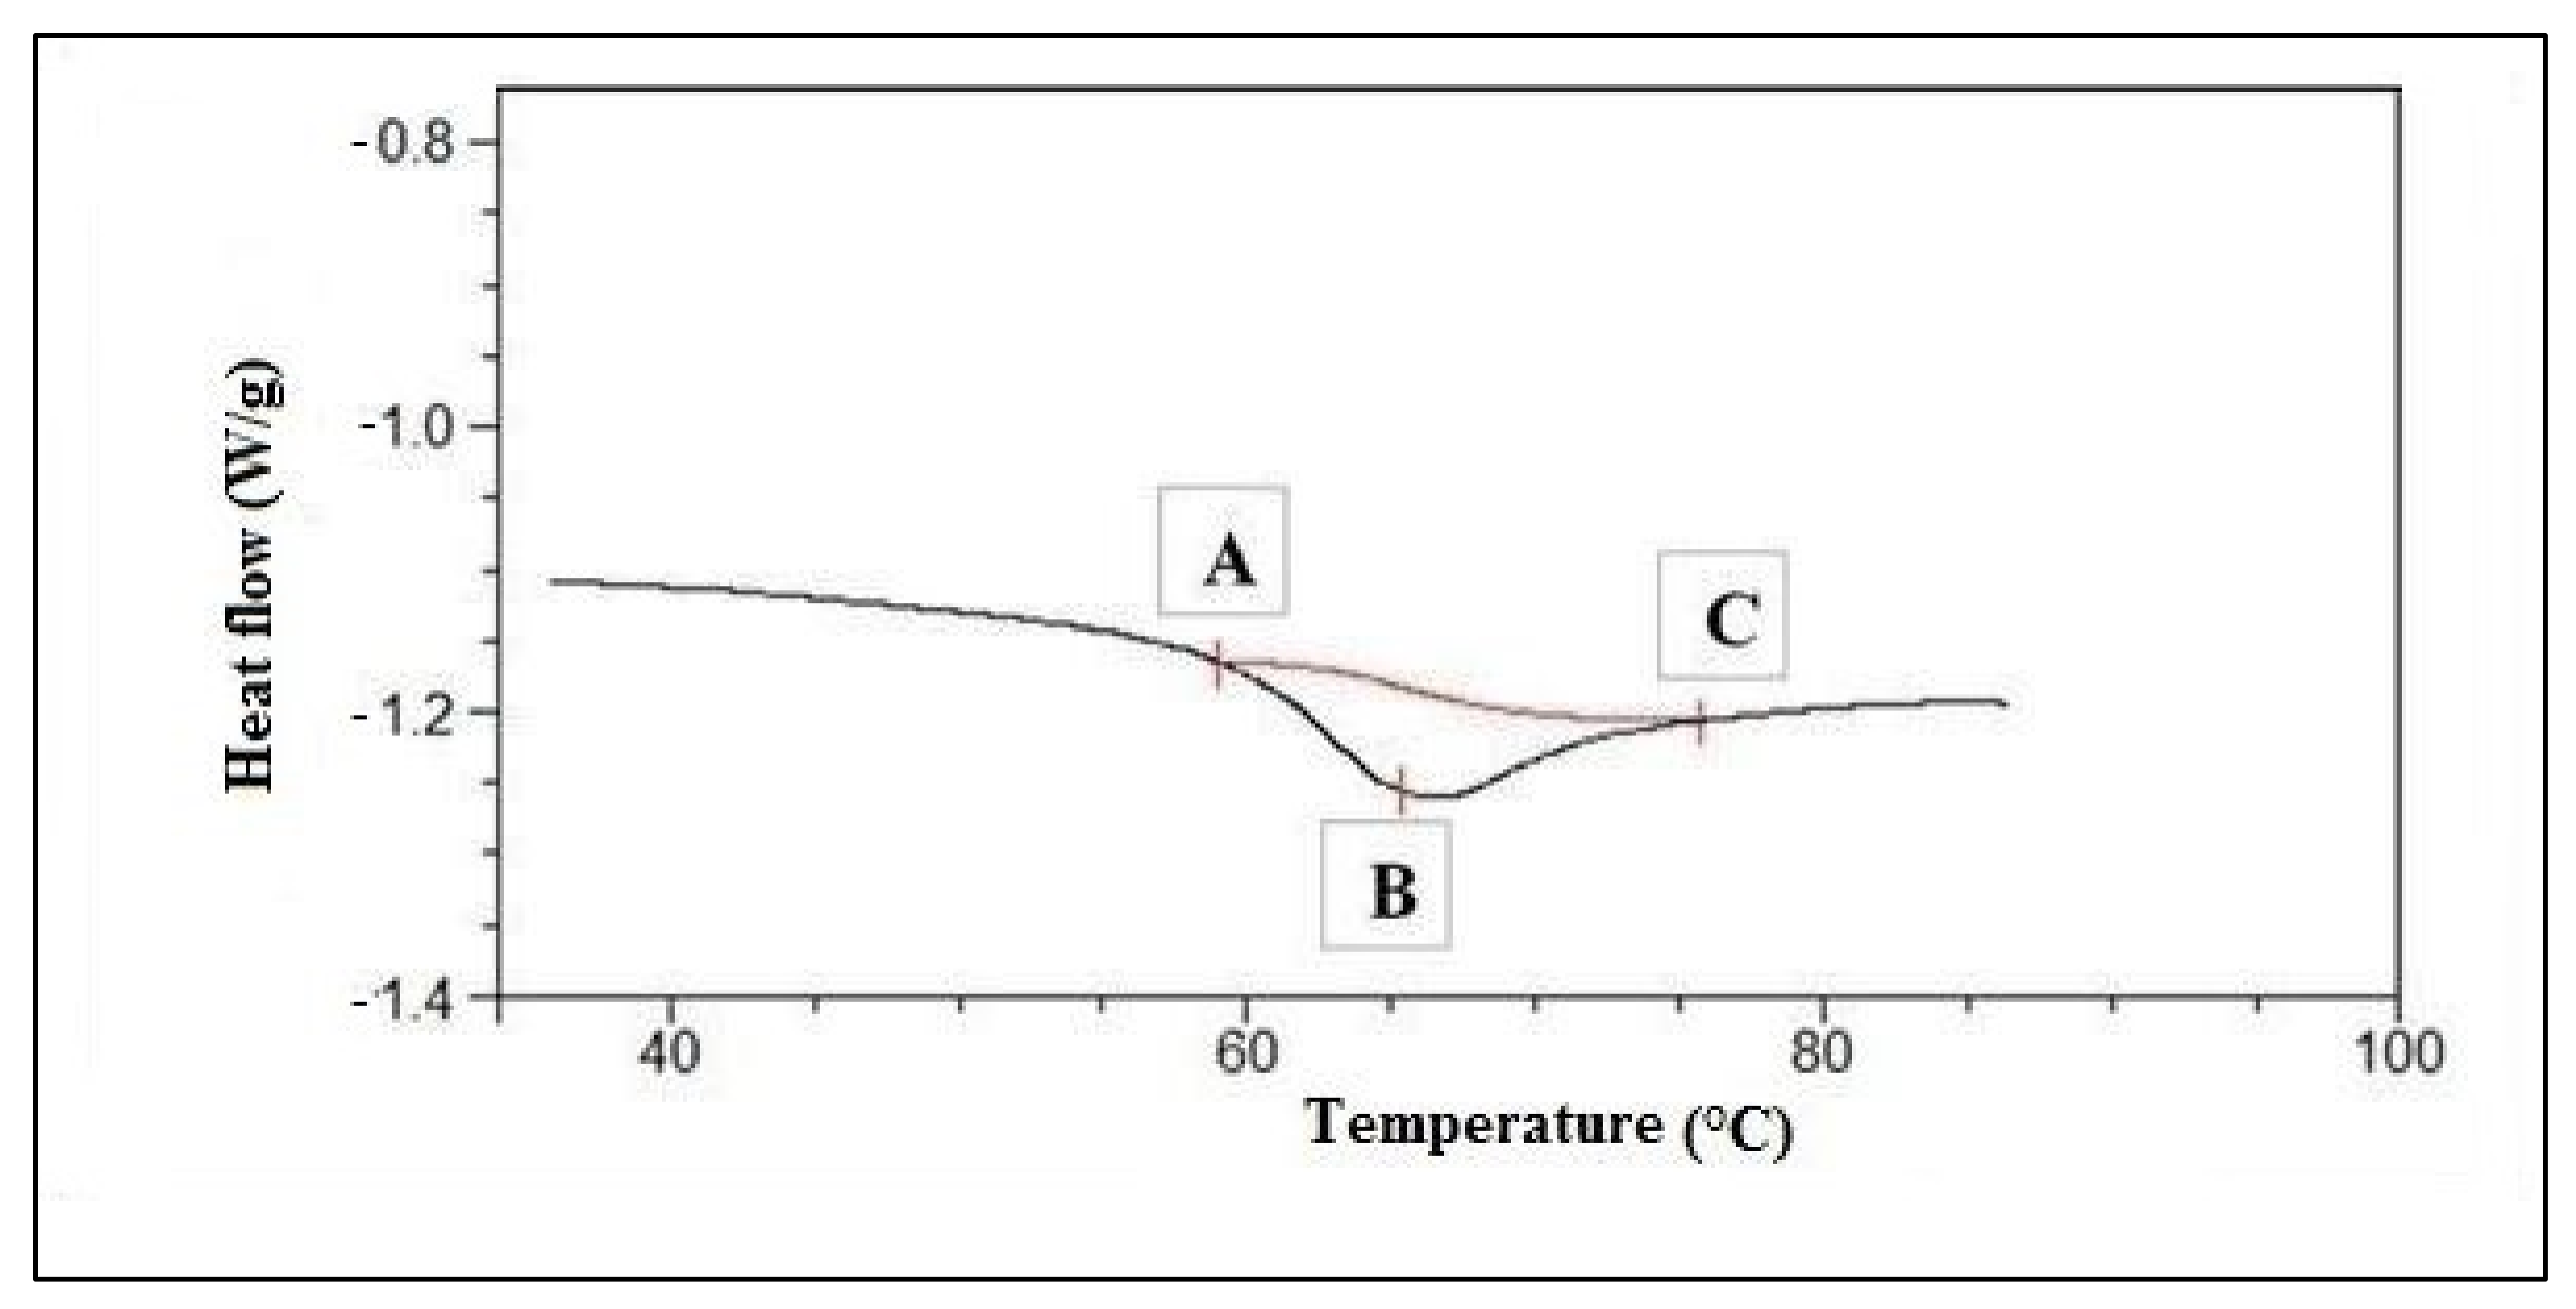
Differential Scanning Calorimetry
2.2.3. Baking Trial
2.2.4. Statistical Analysis
3. Results and Discussion
3.1. Basic Chemical Composition of Tested Rye Flour
3.2. Properties of Starch–Amylolytic Complex
3.2.1. Falling Number and Amylograph Properties
3.2.2. Differential Scanning Calorimetry
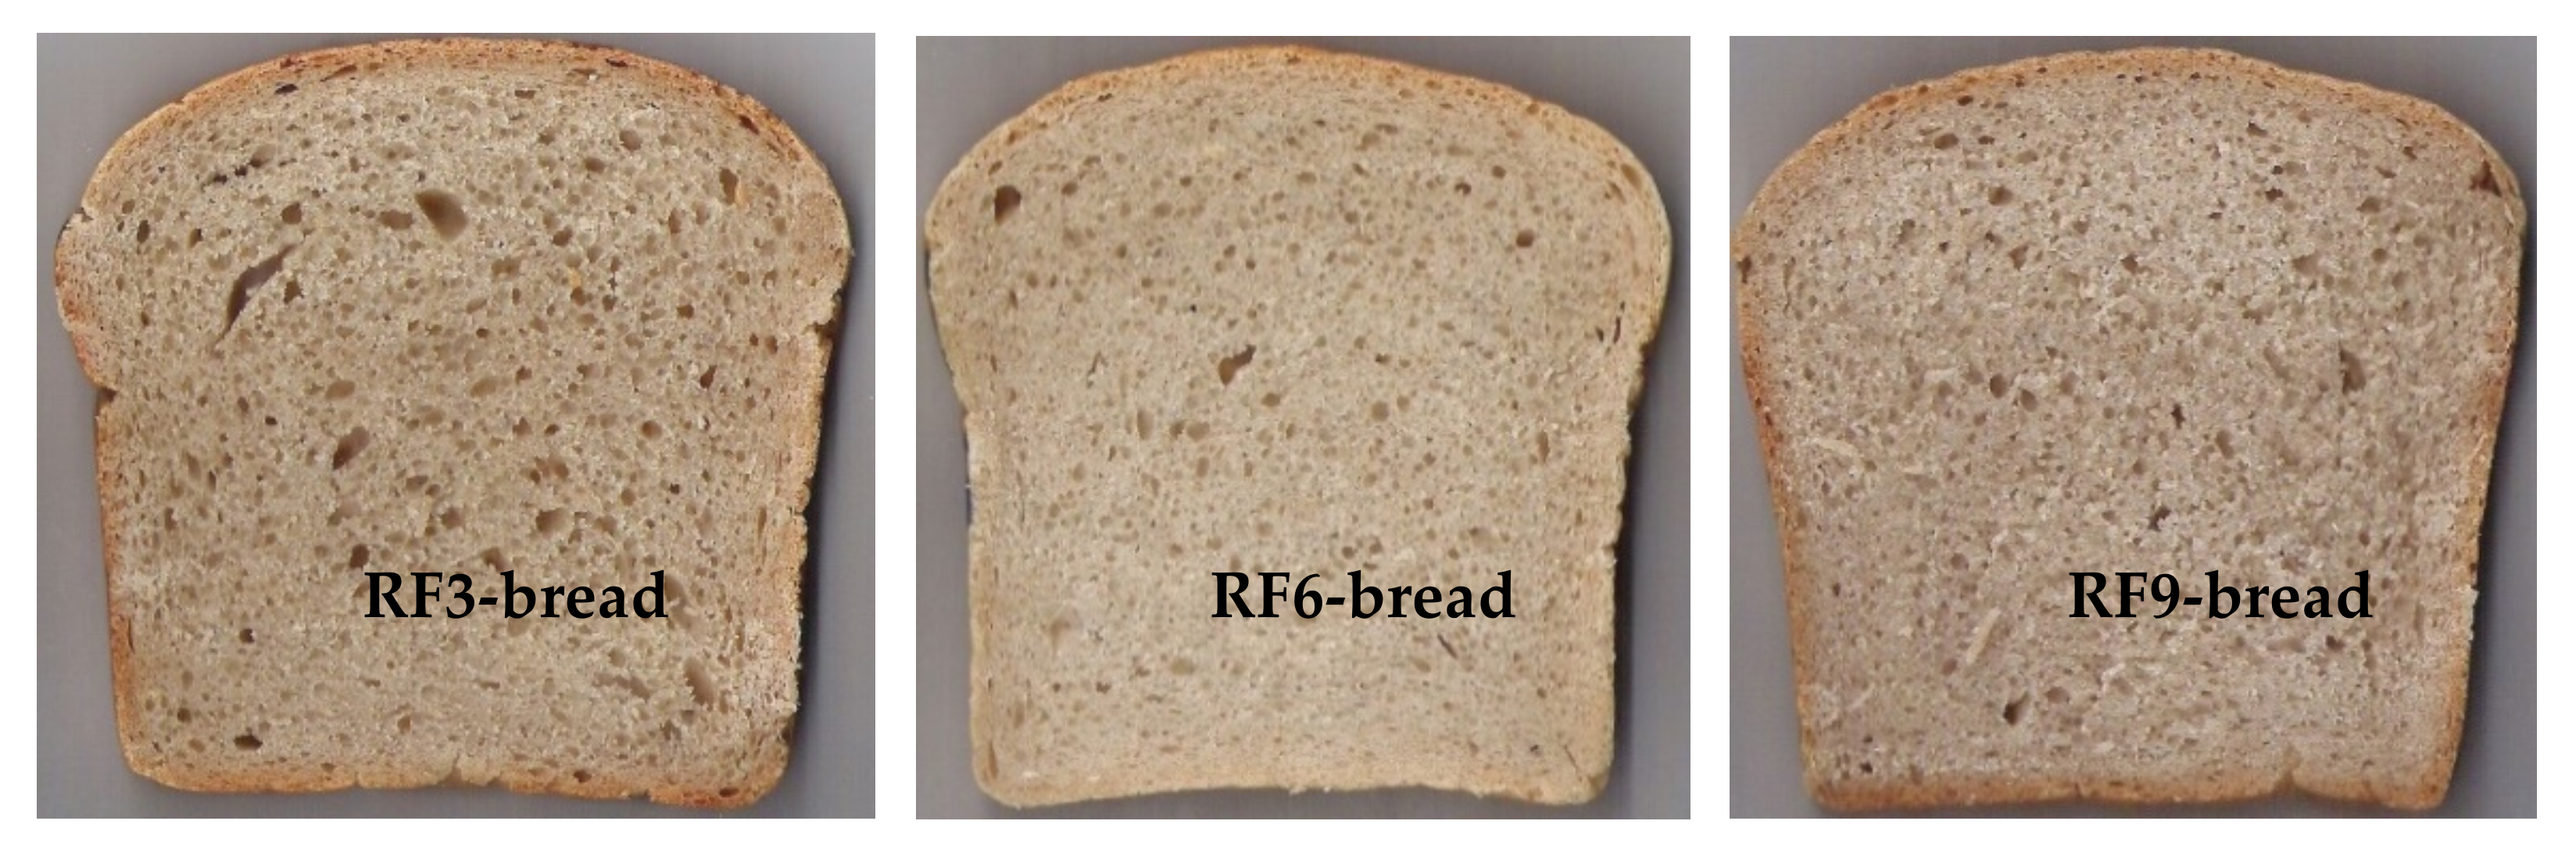
3.3. Bread Quality Parameters
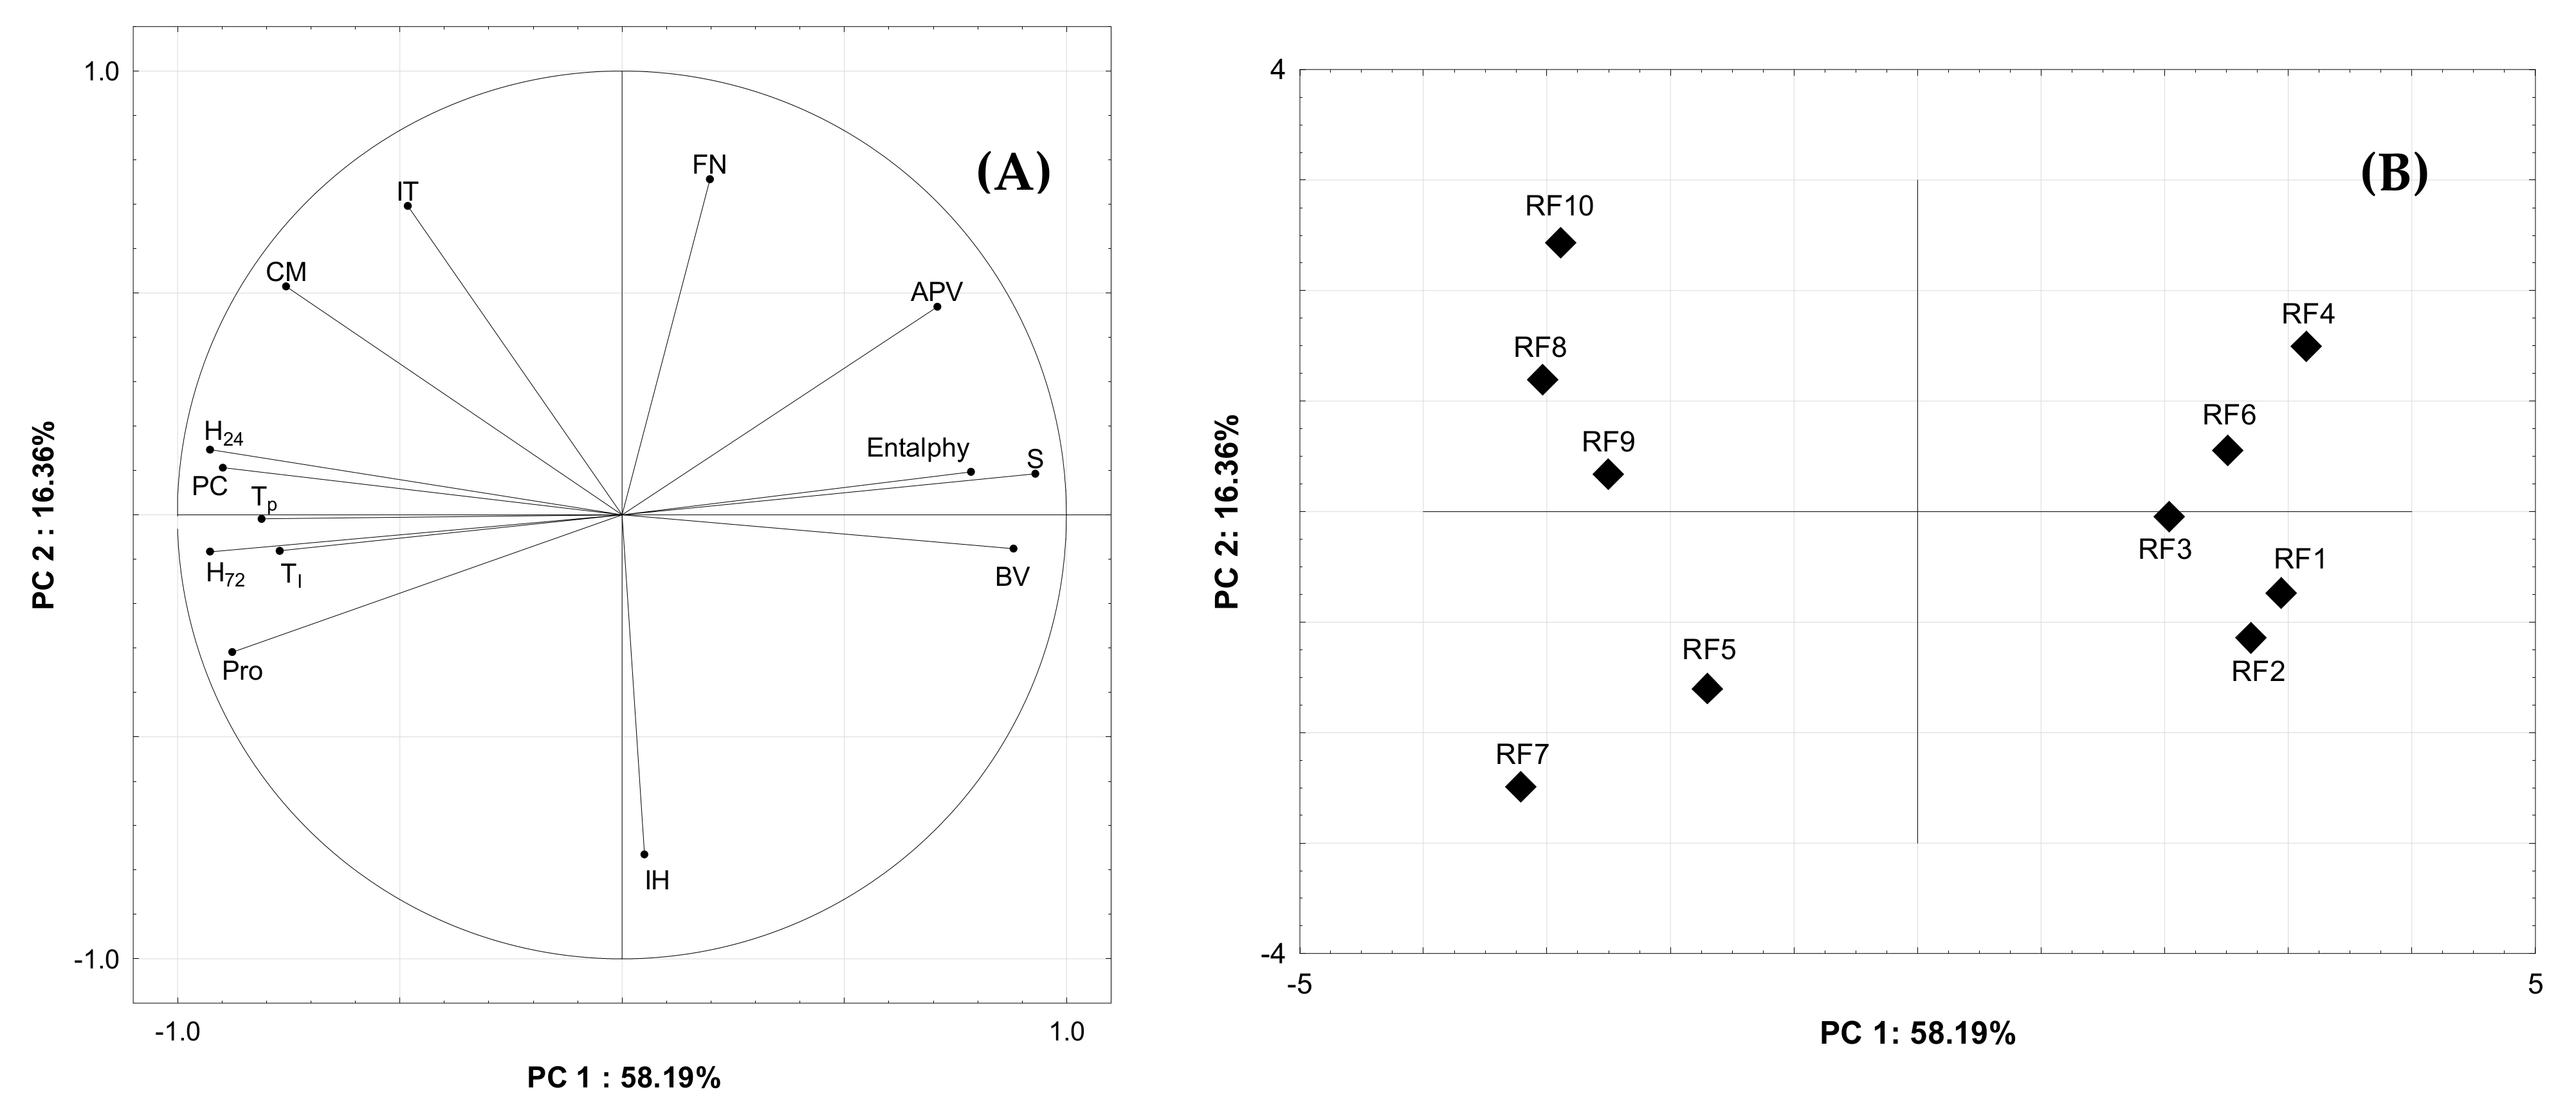
3.4. Principal Component Analysis
4. Conclusions
Author Contributions
Funding
Institutional Review Board Statement
Informed Consent Statement
Data Availability Statement
Conflicts of Interest
References
- Wrigley, C.; Bushuk, W. Rye: Grain-Quality Characteristics and Management of Quality Requirements. In Cereal Grains: Assessing and Managing Quality, 2nd ed.; Wrigley, C., Batey, I., Miskelly, D., Eds.; Woodhead Publishing Ltd.: Cambridge, UK, 2017; pp. 153–178. [Google Scholar] [CrossRef]
- Gräber, S. Influence of enzyme treatment on the rheology of rye doughs. Food/Nahrung 1999, 43, 249–252. [Google Scholar] [CrossRef]
- Gomand, S.V.; Verwimp, T.; Goesaert, H.; Delcour, J.A. Structural and physicochemical characterization of rye starch. Carbohydr. Res. 2011, 346, 2727–2735. [Google Scholar] [CrossRef] [PubMed]
- Goesaert, H.; Brijs, K.; Veraverbeke, W.S.; Courtin, C.M.; Gebruers, K.; Delcour, J.A. Wheat flour constituents: How they impact bread quality, and how to impact their functionality. Trends Food Sci. Technol. 2005, 16, 12–30. [Google Scholar] [CrossRef]
- Ai, Y.; Jane, J. Gelatinization and rheological properties of starch. Starch–Stärke 2015, 67, 213–224. [Google Scholar] [CrossRef]
- Li, H.; Wang, R.; Zhang, Q.; Li, G.; Shan, Y.; Ding, S. Morphological, structural, and physicochemical properties of starch isolated from different lily cultivars grown in China. Int. J. Food Prop. 2019, 22, 737–757. [Google Scholar] [CrossRef] [Green Version]
- Michalska, A.; Ceglińska, A.; Zieliński, H. Bioactive compounds in rye flours with different extraction rates. Eur. Food Res. Technol. 2007, 225, 545–551. [Google Scholar] [CrossRef]
- Verwimp, T.; Courtin, C.M.; Delcour, J.A. Food Biochemistry and Food Processing. In Rye Constituents and Their Impact on Rye Processing, 2nd ed.; Simpson, B.K., Ed.; John Wiley & Sons, Inc.: Hoboken, NJ, USA, 2012; pp. 654–672. [Google Scholar]
- Beck, M.; Jekle, M.; Selmair, P.L.; Koehler, P.; Becker, T. Rheological properties and baking performance of rye dough as affected by transglutaminase. J. Cereal Sci. 2011, 54, 29–36. [Google Scholar] [CrossRef]
- Poutanen, K.; Katina, K.; Heiniö, R.-L. Rye. In Bakery Products Science and Technology; Zhou, W., Hui, Y.H., De Leyn, I., Pagani, M.A., Rosell, C.M., Selman, J.D., Therdthai, N., Eds.; John Wiley & Sons, Inc.: Hoboken, NJ, USA, 2014; pp. 75–87. [Google Scholar]
- Stępniewska, S.; Słowik, E.; Cacak-Pietrzak, G.; Romankiewicz, D.; Szafrańska, A.; Dziki, D. Prediction of rye flour baking quality based on parameters of swelling curve. Eur. Food Res. Technol. 2018, 244, 989–997. [Google Scholar] [CrossRef] [Green Version]
- Cornejo-Ramírez, Y.I.; Martínez-Cruz, O.; Del Toro-Sánchez, C.L.; Wong-Corral, F.J.; Borboa-Flores, J.; Cinco-Moroyoqu, F.J. The structural characteristics of starches and their functional properties. CyTA J. Food 2018, 16, 1003–1017. [Google Scholar] [CrossRef]
- Radosta, S.; Kettlitz, B.; Schierbaum, F.; Gernat, C. Studies on Rye Starch Properties and Modification. Part II: Swelling and Solubility Behaviour of Rye Starch Granules. Starch-Stärke 1992, 44, 8–14. [Google Scholar] [CrossRef]
- ISO 712:2009. Cereals and Cereal Products—Determination of Moisture Content—Reference Method; ISO: Geneva, Switzerland, 2009. [Google Scholar]
- ISO 20483:2013. Cereals and Pulses—Determination of the Nitrogen Content and Calculation of the Crude Protein Content—Kjeldahl Method; ISO: Geneva, Switzerland, 2009. [Google Scholar]
- ISO 2171:2007. Cereals, Pulses and By-Products—Determination of Ash Yield by Incineration; ISO: Geneva, Switzerland, 2007. [Google Scholar]
- Hashimoto, S.; Shogren, M.D.; Pomeranz, Y. Cereal pentosans: Their estimation and significance. I. Pentosans in wheat and milled wheat products. Cereal Chem. 1987, 64, 30–34. [Google Scholar]
- ISO 10520:1997. Native Starch—Determination of Starch Content—Ewers Polarimetric Method; ISO: Geneva, Switzerland, 1997. [Google Scholar]
- ISO 3093:2009. Wheat, Rye and Their Flours, Durum Wheat and Durum Wheat Semolina—Determination of the Falling Number according to Hagberg-Perten; ISO: Geneva, Switzerland, 2009. [Google Scholar]
- ISO 7973:1992. Cereals and Milled Cereal Products—Determination of the Viscosity of Flour—Method Using an Amylograph; ISO: Geneva, Switzerland, 1992. [Google Scholar]
- Hadidi, M.; Majidiyan, N.; Jelyani, A.Z.; Moreno, A.; Hadian, Z.; Mousavi Khanegah, A. Alginate/Fish Gelatin-Encapsulated Lactobacillus acidophilus: A Study on Viability and Technological Quality of Bread during Baking and Storage. Foods 2021, 10, 2215. [Google Scholar] [CrossRef] [PubMed]
- Hădărugă, D.I.; Costescu, C.I.; Corpaş, L.; Hădărugă, N.G.; Isengard, H.-D. Differentiation of rye and wheat flour as well as mixtures by using the kinetics of Karl Fischer water titration. Food Chem. 2016, 195, 49–55. [Google Scholar] [CrossRef] [PubMed]
- Cardoso, R.V.C.; Fernandes, Â.; Heleno, S.A.; Rodrigues, P.; Gonzaléz-Paramás, A.M.; Barros, L.; Ferreira, I.C.F.R. Physicochemical characterization and microbiology of wheat and rye flours. Food Chem. 2019, 280, 123–129. [Google Scholar] [CrossRef] [Green Version]
- Stępniewska, S.; Hassoon, W.H.; Szafrańska, A.; Cacak-Pietrzak, G.; Dziki, D. Procedures for Breadmaking Quality Assessment of Rye Wholemeal Flour. Foods 2019, 8, 331. [Google Scholar] [CrossRef] [PubMed] [Green Version]
- He, Y.; Lin, Y.; Chen, C.; Tsai, M.; Lin, A.H. Impacts of Starch and the Interactions Between Starch and Other Macromolecules on Wheat Falling Number. Compr. Rev. Food Sci. Food Saf. 2019, 18, 641–654. [Google Scholar] [CrossRef] [PubMed] [Green Version]
- Michalska, A.; Zieliński, H. Effect of flour extraction rate on bioactive compounds content of two rye varieties. Polish J. Food Nutr. Sci. 2006, 56, 297–303. [Google Scholar]
- Cyran, M.; Cygankiewicz, A. Variability in the content of water-extractable and water-unextractable non-starch polysaccharides in rye flour and their relationship to baking quality parameters. Cereal Res. Commun. 2004, 32, 143–150. [Google Scholar] [CrossRef]
- Ponomareva, M.L.; Ponomarev, S.N.; Mannapova, G.S.; Gilmullina, L.F.; Fomin, S.I.; Ilalova, L.V.; Vafina, G.S.; Kirillova, E.S. Testing methods for describing rye whole meal quality. Res. J. Pharm. Biol. Chem. Sci. 2018, 9, 2403–2413. [Google Scholar]
- Blazek, J.; Copeland, L. Pasting and swelling properties of wheat flour and starch in relation to amylose content. Carboh. Polym. 2008, 71, 380–387. [Google Scholar] [CrossRef]
- Makowska, A.; Szwengiel, A.; Kubiak, P.; Tomaszewska-Gras, J. Characteristics and structure of starch isolated from triticale. Starch-Stärke 2014, 66, 895–902. [Google Scholar] [CrossRef]
- Brites, C.M.; Santos, C.A.L.d.; Bagulho, A.S.; Beirão-da-Costa, M.L. Effect of wheat puroindoline alleles on functional properties of starch. Eur. Food Res. Technol. 2008, 226, 1205–1212. [Google Scholar] [CrossRef] [Green Version]
- Fredriksson, H.; Silverio, J.; Andersson, R.; Eliasson, A.-C.; Åman, P. The influence of amylose and amylopectin characteristics on gelatinization and retrogradation properties of different starches. Carbohydr. Polym. 1998, 35, 119–134. [Google Scholar] [CrossRef]
- Sasaki, T. Effect of Wheat Starch Characteristics on the Gelatinization, Retrogradation, and Gelation Properties. Jpn. Agric. Res. Q. JARQ 2005, 39, 253–260. [Google Scholar] [CrossRef] [Green Version]
- Tester, R.F.; Morrison, W.R. Swelling and gelatinization of cereal starches. II. Waxy rice starches. Cereal Chem. 1990, 67, 558–563. [Google Scholar]
- Chen, P.; Liu, X.; Zhang, X.; Sangwan, P.; Yu, L. Phase Transition of Waxy and Normal Wheat Starch Granules during Gelatinization. Int. J. Polym. Sci. 2015, 2015, 397128. [Google Scholar] [CrossRef]
- Gudmundsson, M.; Eliasson, A.-C. Thermal and viscous of rye starch extracted from different varieties. Cereal Chem. 1991, 68, 172–177. [Google Scholar] [CrossRef]
- Piecyk, M.; Worobiej, E.; Wołosiak, R.; Drużyńska, B.; Ostrowska-Ligęza, E. Effect of different processes on composition, properties and in vitro starch digestibility of grass pea flour. J. Food Meas. Charact. 2019, 13, 848–856. [Google Scholar] [CrossRef] [Green Version]
- Eliasson, A.-C. Carbohydrates. In Food, 3rd ed.; CRC Press; Taylor & Francis Group: Boca Raton, FL, USA, 2017. [Google Scholar]
- Pejcz, E.; Spychaj, R.; Gil, Z. Technological methods for reducing the content of fructan in rye bread. Eur. Food Res. Technol. 2020, 246, 1839–1846. [Google Scholar] [CrossRef]
- Ostasiewicz, A.; Zaręba, D.; Ceglińska, A. The influence of lactobacillus acidophilus la-5 probioticstrain of lactic acid bacteria on rye bread quality. Bromatol. Chem. Toksykol. 2010, XLII, 176–183. [Google Scholar]
- Buksa, K.; Nowotna, A.; Praznik, W.; Gambuś, H.; Ziobro, R.; Krawontka, J. The role of pentosans and starch in baking of wholemeal rye bread. Food Res. Int. 2010, 43, 2045–2051. [Google Scholar] [CrossRef]


| Rye Flour | MO (%) | AC (% d.m.) | Pro (N × 6.25) (% d.m.) | PC (% d.m.) | S (% d.m.) |
|---|---|---|---|---|---|
| RF1 | 13.2 ± 0.07 c | 0.72 ± 0.02 a,b | 7.8 ± 0.07 c | 4.9 ± 0.03 i | 70.3 ± 0.4 a |
| RF2 | 12.4 ± 0.07 d | 0.81 ± 0.10 a | 7.0 ± 0.07 d,e | 5.8 ± 0.04 f | 70.5 ± 0.6 a |
| RF3 | 12.8 ± 0.14 d | 0.77 ± 0.04 a,b | 7.3 ± 0.14 d | 5.1 ± 0.05 g,h | 70.8 ± 0.3 a |
| RF4 | 13.3 ± 0.00 c | 0.74 ± 0.01 a,b | 6.8 ± 0.00 e | 5.0 ± 0.04 h | 70.9 ± 0.1 a |
| RF5 | 13.2 ± 0.07 c | 0.82 ± 0.04 a | 9.0 ± 0.07 a | 6.0 ± 0.07 e | 67.5 ± 0.7 b |
| RF6 | 13.7 ± 0.14 c | 0.60 ± 0.01 b | 6.4 ± 0.07 f | 5.2 ± 0.04 g | 71.1 ± 0.3 a |
| RF7 | 15.6 ± 0.07 a | 0.88 ± 0.06 a | 9.2 ± 0.07 a | 6.8 ± 0.01 c | 63.5 ± 0.4 c |
| RF8 | 15.4 ± 0.14 a | 0.88 ± 0.03 a | 8.9 ± 0.00 a | 7.2 ± 0.06 a | 63.5 ± 0.6 c |
| RF9 | 13.7 ± 0.00 b | 0.79 ± 0.01 a,b | 8.5 ± 0.14 b | 6.1 ± 0.03 d | 67.3 ± 0.4 b |
| RF10 | 13.6 ± 0.14 b,c | 0.81 ± 0.07 a | 8.1 ± 0.14 c | 7.1 ± 0.04 b | 66.4 ± 0.7 b |
| Para−Maters | PC | S | FN | APV | IT | To | Tp | Enthalpy | BV | H24 | H72 | IH | CM |
|---|---|---|---|---|---|---|---|---|---|---|---|---|---|
| Pro | 0.724 * | −0.886 ** | NS | −0.826 ** | NS | 0.690 * | 0.651 * | −0.638 * | NS | 0.766 ** | 0.789 ** | NS | NS |
| PC | −0.913 ** | NS | NS | NS | 0.701 * | 0.726 * | −0.728 * | −0.710 * | 0.731 * | 0.729 * | NS | 0.632 * | |
| S | NS | 0.701 * | NS | −0.740 * | −0.707 * | 0.678 * | 0.706 * | −0.782 ** | −0.815 ** | NS | NS | ||
| FN | 0.733 * | NS | NS | NS | NS | NS | NS | NS | NS | NS | |||
| APV | NS | NS | NS | NS | NS | NS | −0.608 * | NS | NS | ||||
| IT | NS | NS | NS | NS | NS | NS | −0.734 * | NS | |||||
| To | 0.744 * | NS | NS | NS | NS | NS | NS | ||||||
| Tp | NS | NS | 0.718 * | 0.688 * | NS | NS | |||||||
| Enthalpy | 0.883 ** | −0.701 * | −0.803 ** | NS | NS | ||||||||
| BV | −0.857 ** | −0.892 ** | NS | NS | |||||||||
| H24 | 0.954 ** | NS | 0.735 * | ||||||||||
| H72 | NS | 0.654 * | |||||||||||
| IH | NS |
| Rye Flour | FN (s) | APV (AU) | IT (°C) | FT (°C) |
|---|---|---|---|---|
| RF1 | 200 ± 8 d,e | 545 ± 7 e | 53.0 ± 1.4 a,b | 68.0 ± 0.7 c,d |
| RF2 | 232 ± 4 c | 830 ± 14 b | 51.5 ± 0.4 b | 71.5 ± 0.7 b,c |
| RF3 | 213 ± 3 d | 640 ± 0 c | 53.0 ± 0.0 a,b | 70.0 ± 0.4 b,c |
| RF4 | 288 ± 6 a | 1045 ± 7 a | 52.5 ± 0.7 a,b | 77.0 ± 1.4 a |
| RF5 | 216 ± 1 c,d | 500 ± 14 f | 52.0 ± 0.4 a,b | 70.0 ± 0.4 b,c |
| RF6 | 288 ± 4 a | 840 ± 14 b | 52.5 ± 0.7 a,b | 77.0 ± 0.4 a |
| RF7 | 183 ± 3 e | 275 ± 7 g | 52.0 ± 0.4 a,b | 66.5 ± 0.7 d |
| RF8 | 280 ± 6 a | 620 ± 14 c,d | 52.5 ± 0.7 a,b | 75.0 ± 0.4 a |
| RF9 | 217 ± 3 c,d | 590 ± 0 d | 53.0 ± 0.7 a,b | 70.0 ± 0.0 b,c |
| RF10 | 254 ± 6 b | 525 ± 7 e,f | 54.0 ± 0.4 a | 69.5 ± 0.7 b,c |
| Gelatinization | ||||
|---|---|---|---|---|
| Rye Flour | To (°C) | Tp (°C) | Tc (°C) | Enthalpy (J g−1) |
| RF1 | 55.9 ± 0.7 e | 60.8 ± 0.4 f | 73.9 ± 0.3 c | 6.0 ± 0.1 b |
| RF2 | 56.5 ± 0.4 b,c,d,e | 62.8 ± 0.3 c,d,e | 72.6 ± 0.1 c,d | 4.4 ± 0.2 c |
| RF3 | 58.2 ± 0.4 a,b,c,d | 64.0 ± 0.1 a,b,c | 76.6 ± 0.1 a,b | 6.2 ± 0.2 b |
| RF4 | 56.7 ± 0.8 c,d,e | 62.1 ± 0.4 d,e,f | 75.5 ± 0.4 b | 6.5 ± 0.1 a |
| RF5 | 58.4 ± 0.3 a,b,c | 63.2 ± 0.1 b,c,d | 72.2 ± 0.3 d | 2.4 ± 0.3 g |
| RF6 | 56.0 ± 0.7 d,e | 61.3 ± 0.7 e,f | 73.3 ± 0.4 c,d | 3.6 ± 0.4 d |
| RF7 | 58.8 ± 0.4 a,b | 64.6 ± 0.1 a,b | 77.4 ± 0.1 a | 3.5 ± 0.1 d |
| RF8 | 59.3 ± 0.4 a | 64.5 ± 0.6 a,b | 75.8 ± 0.4 b | 2.7 ± 0.4 f |
| RF9 | 57.0 ± 0.3 b,c,d,e | 64.8 ± 0.1 a | 72.6 ± 0.3 c,d | 3.1 ± 0.2 e |
| RF10 | 58.1 ± 0.8 a,b,c,d,e | 63.9 ± 0.4 a,b,c | 73.5 ± 0.1 c,d | 3.4 ± 0.4 d |
| Rye Flour | BV (cm3 100 g−1) | H24 (N) | H72 (N) | IH (N) | CM (%) |
|---|---|---|---|---|---|
| RF1 | 206 ± 10 a,b | 37.2 ± 1.0 e | 50.8 ± 0.1 f | 13.6 ± 0.8 b | 45.4 ± 0.3 b |
| RF2 | 201 ± 10 a,b,c | 33.4 ± 0.7 f | 51.0 ± 0.7 f | 17.6 ± 0.0 c | 45.5 ± 0.4 b |
| RF3 | 208 ± 3 a | 37.6 ± 0.4 e | 50.2 ± 0.7 f | 12.6 ± 0.3 b | 45.7 ± 0.6 b |
| RF4 | 199 ± 8 a,b,c | 41.0 ± 0.7 d | 54.2 ± 1.1 e | 13.2 ± 0.4 b | 46.0 ± 0.3 a,b |
| RF5 | 173 ± 3 c,d | 52.4 ± 0.4 c | 69.6 ± 0.4 b | 17.2 ± 0.1 c | 46.2 ± 0.7 a,b |
| RF6 | 188 ± 4 a,b,c,d | 38.4 ± 0.3 d,e | 56.6 ± 0.4 d | 18.2 ± 0.1 c,d | 46.4 ± 0.1 a,b |
| RF7 | 178 ± 11 b,c,d | 53.2 ± 0.3 c | 72.8 ± 0.4 a | 19.6 ± 0.1 d | 46.4 ± 0.3 a,b |
| RF8 | 179 ± 4 a,b,c,d | 53.0 ± 1.1 c | 66.5 ± 0.7 c | 13.5 ± 0.4 b | 46.5 ± 0.6 a,b |
| RF9 | 169 ± 10 d | 62.0 ± 0.8 a | 75.1 ± 0.1 a | 13.1 ± 0.7 b | 46.9 ± 0.3 a,b |
| RF10 | 174 ± 3 c,d | 56.2 ± 0.8 b | 66.6 ± 0.5 c | 10.5 ± 0.3 a | 47.7 ± 0.7 a |
Publisher’s Note: MDPI stays neutral with regard to jurisdictional claims in published maps and institutional affiliations. |
© 2021 by the authors. Licensee MDPI, Basel, Switzerland. This article is an open access article distributed under the terms and conditions of the Creative Commons Attribution (CC BY) license (https://creativecommons.org/licenses/by/4.0/).
Share and Cite
Stępniewska, S.; Cacak-Pietrzak, G.; Szafrańska, A.; Ostrowska-Ligęza, E.; Dziki, D. Assessment of the Starch-Amylolytic Complex of Rye Flours by Traditional Methods and Modern One. Materials 2021, 14, 7603. https://doi.org/10.3390/ma14247603
Stępniewska S, Cacak-Pietrzak G, Szafrańska A, Ostrowska-Ligęza E, Dziki D. Assessment of the Starch-Amylolytic Complex of Rye Flours by Traditional Methods and Modern One. Materials. 2021; 14(24):7603. https://doi.org/10.3390/ma14247603
Chicago/Turabian StyleStępniewska, Sylwia, Grażyna Cacak-Pietrzak, Anna Szafrańska, Ewa Ostrowska-Ligęza, and Dariusz Dziki. 2021. "Assessment of the Starch-Amylolytic Complex of Rye Flours by Traditional Methods and Modern One" Materials 14, no. 24: 7603. https://doi.org/10.3390/ma14247603
APA StyleStępniewska, S., Cacak-Pietrzak, G., Szafrańska, A., Ostrowska-Ligęza, E., & Dziki, D. (2021). Assessment of the Starch-Amylolytic Complex of Rye Flours by Traditional Methods and Modern One. Materials, 14(24), 7603. https://doi.org/10.3390/ma14247603