
Core-Shell Fe2O3@La1−xSrxFeO3−δ Material for Catalytic Oxidations: Coverage of Iron Oxide Core, Oxygen Storage Capacity and Reactivity of Surface Oxygens

 , ,
, , 
Abstract
1. Introduction
2. Materials and Methods
2.1. Preparation of Materials
2.1.1. Preparation of Pure LSF Perovskite
2.1.2. Fe2O3 Hematite Source
2.1.3. Preparation of Fe2O3@LSF Core-Shell Materials
2.2. Materials Characterization
3. Results and Discussion
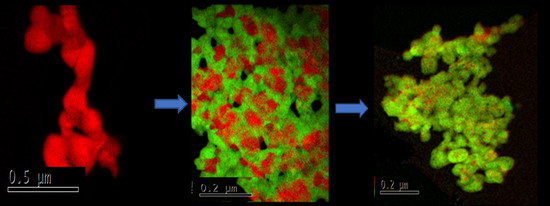
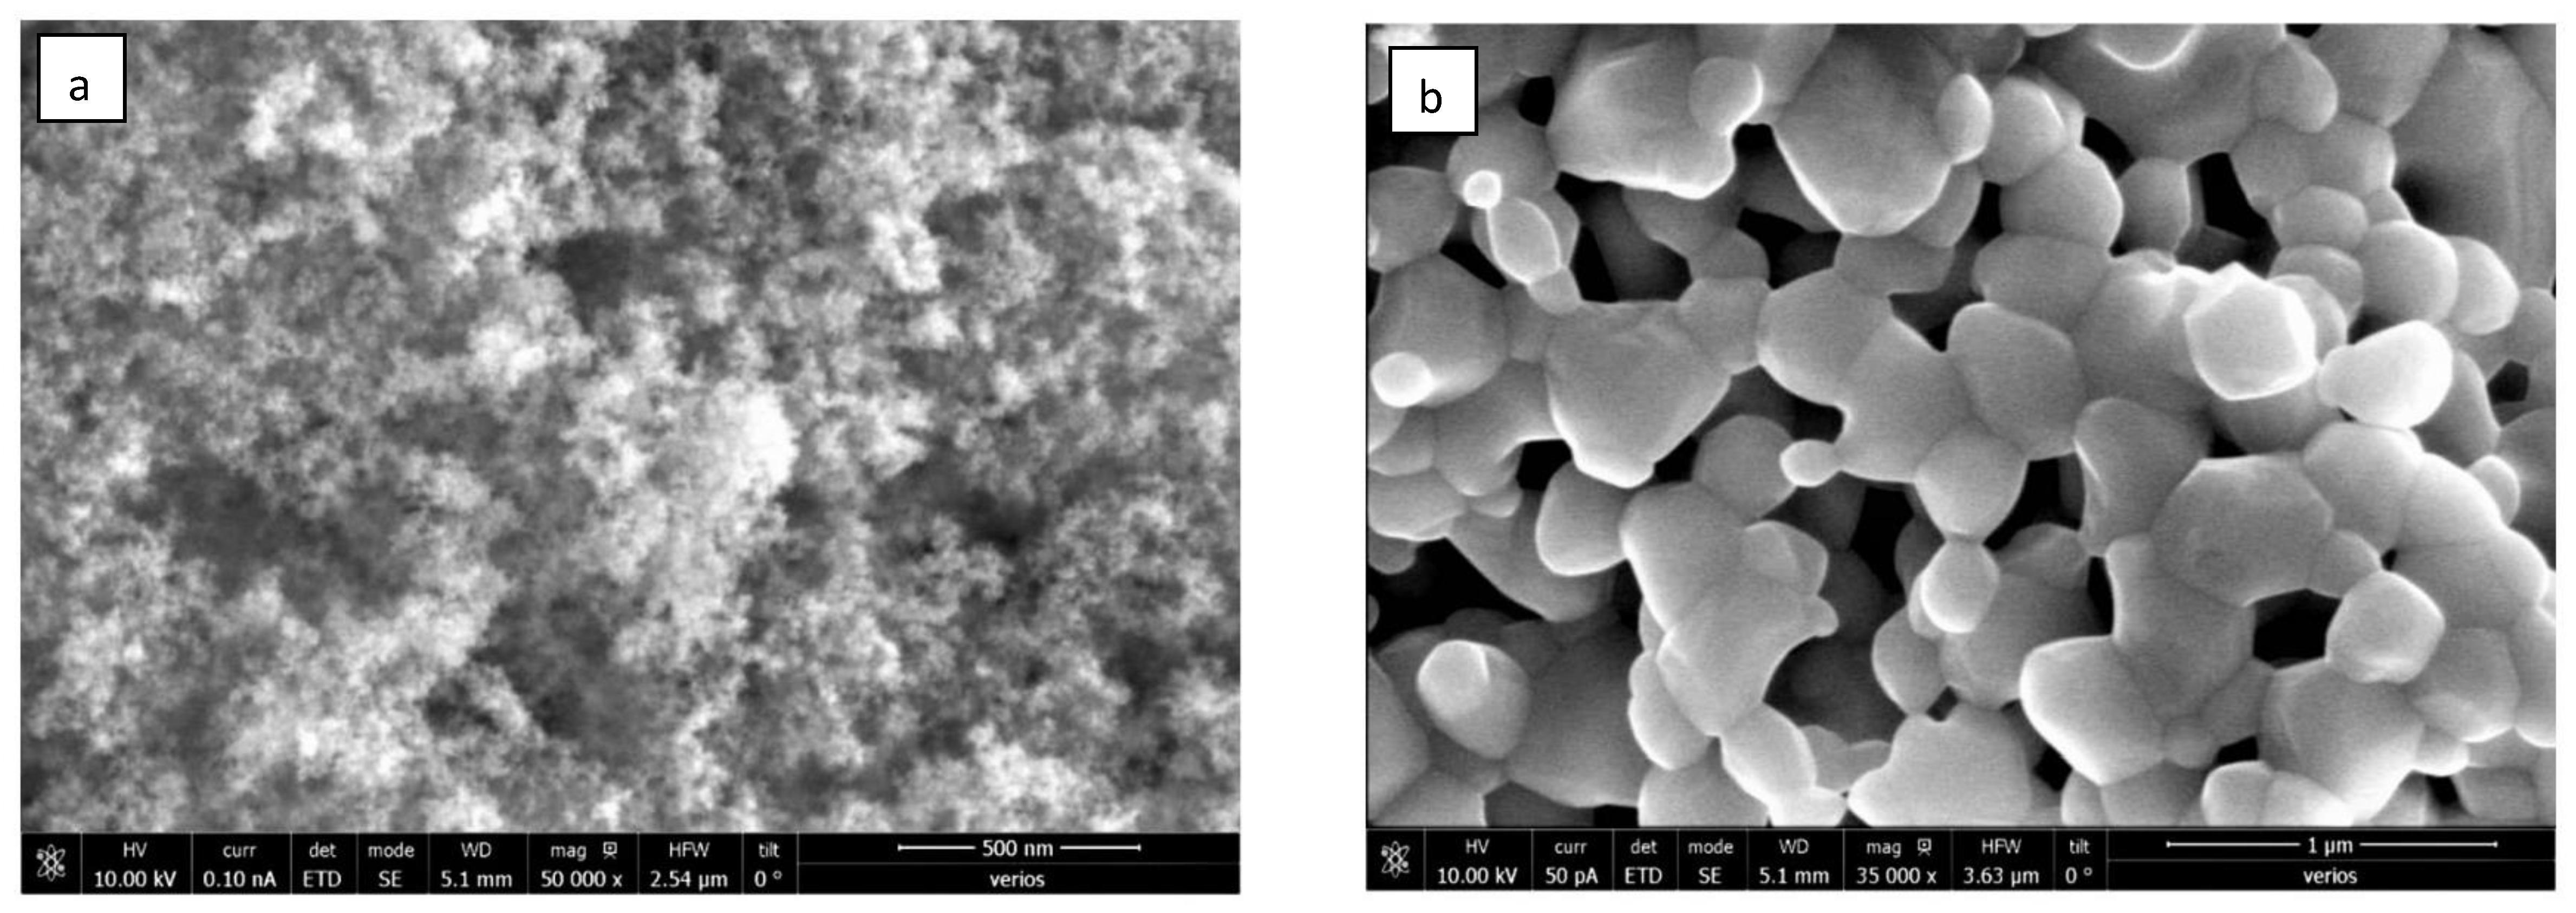
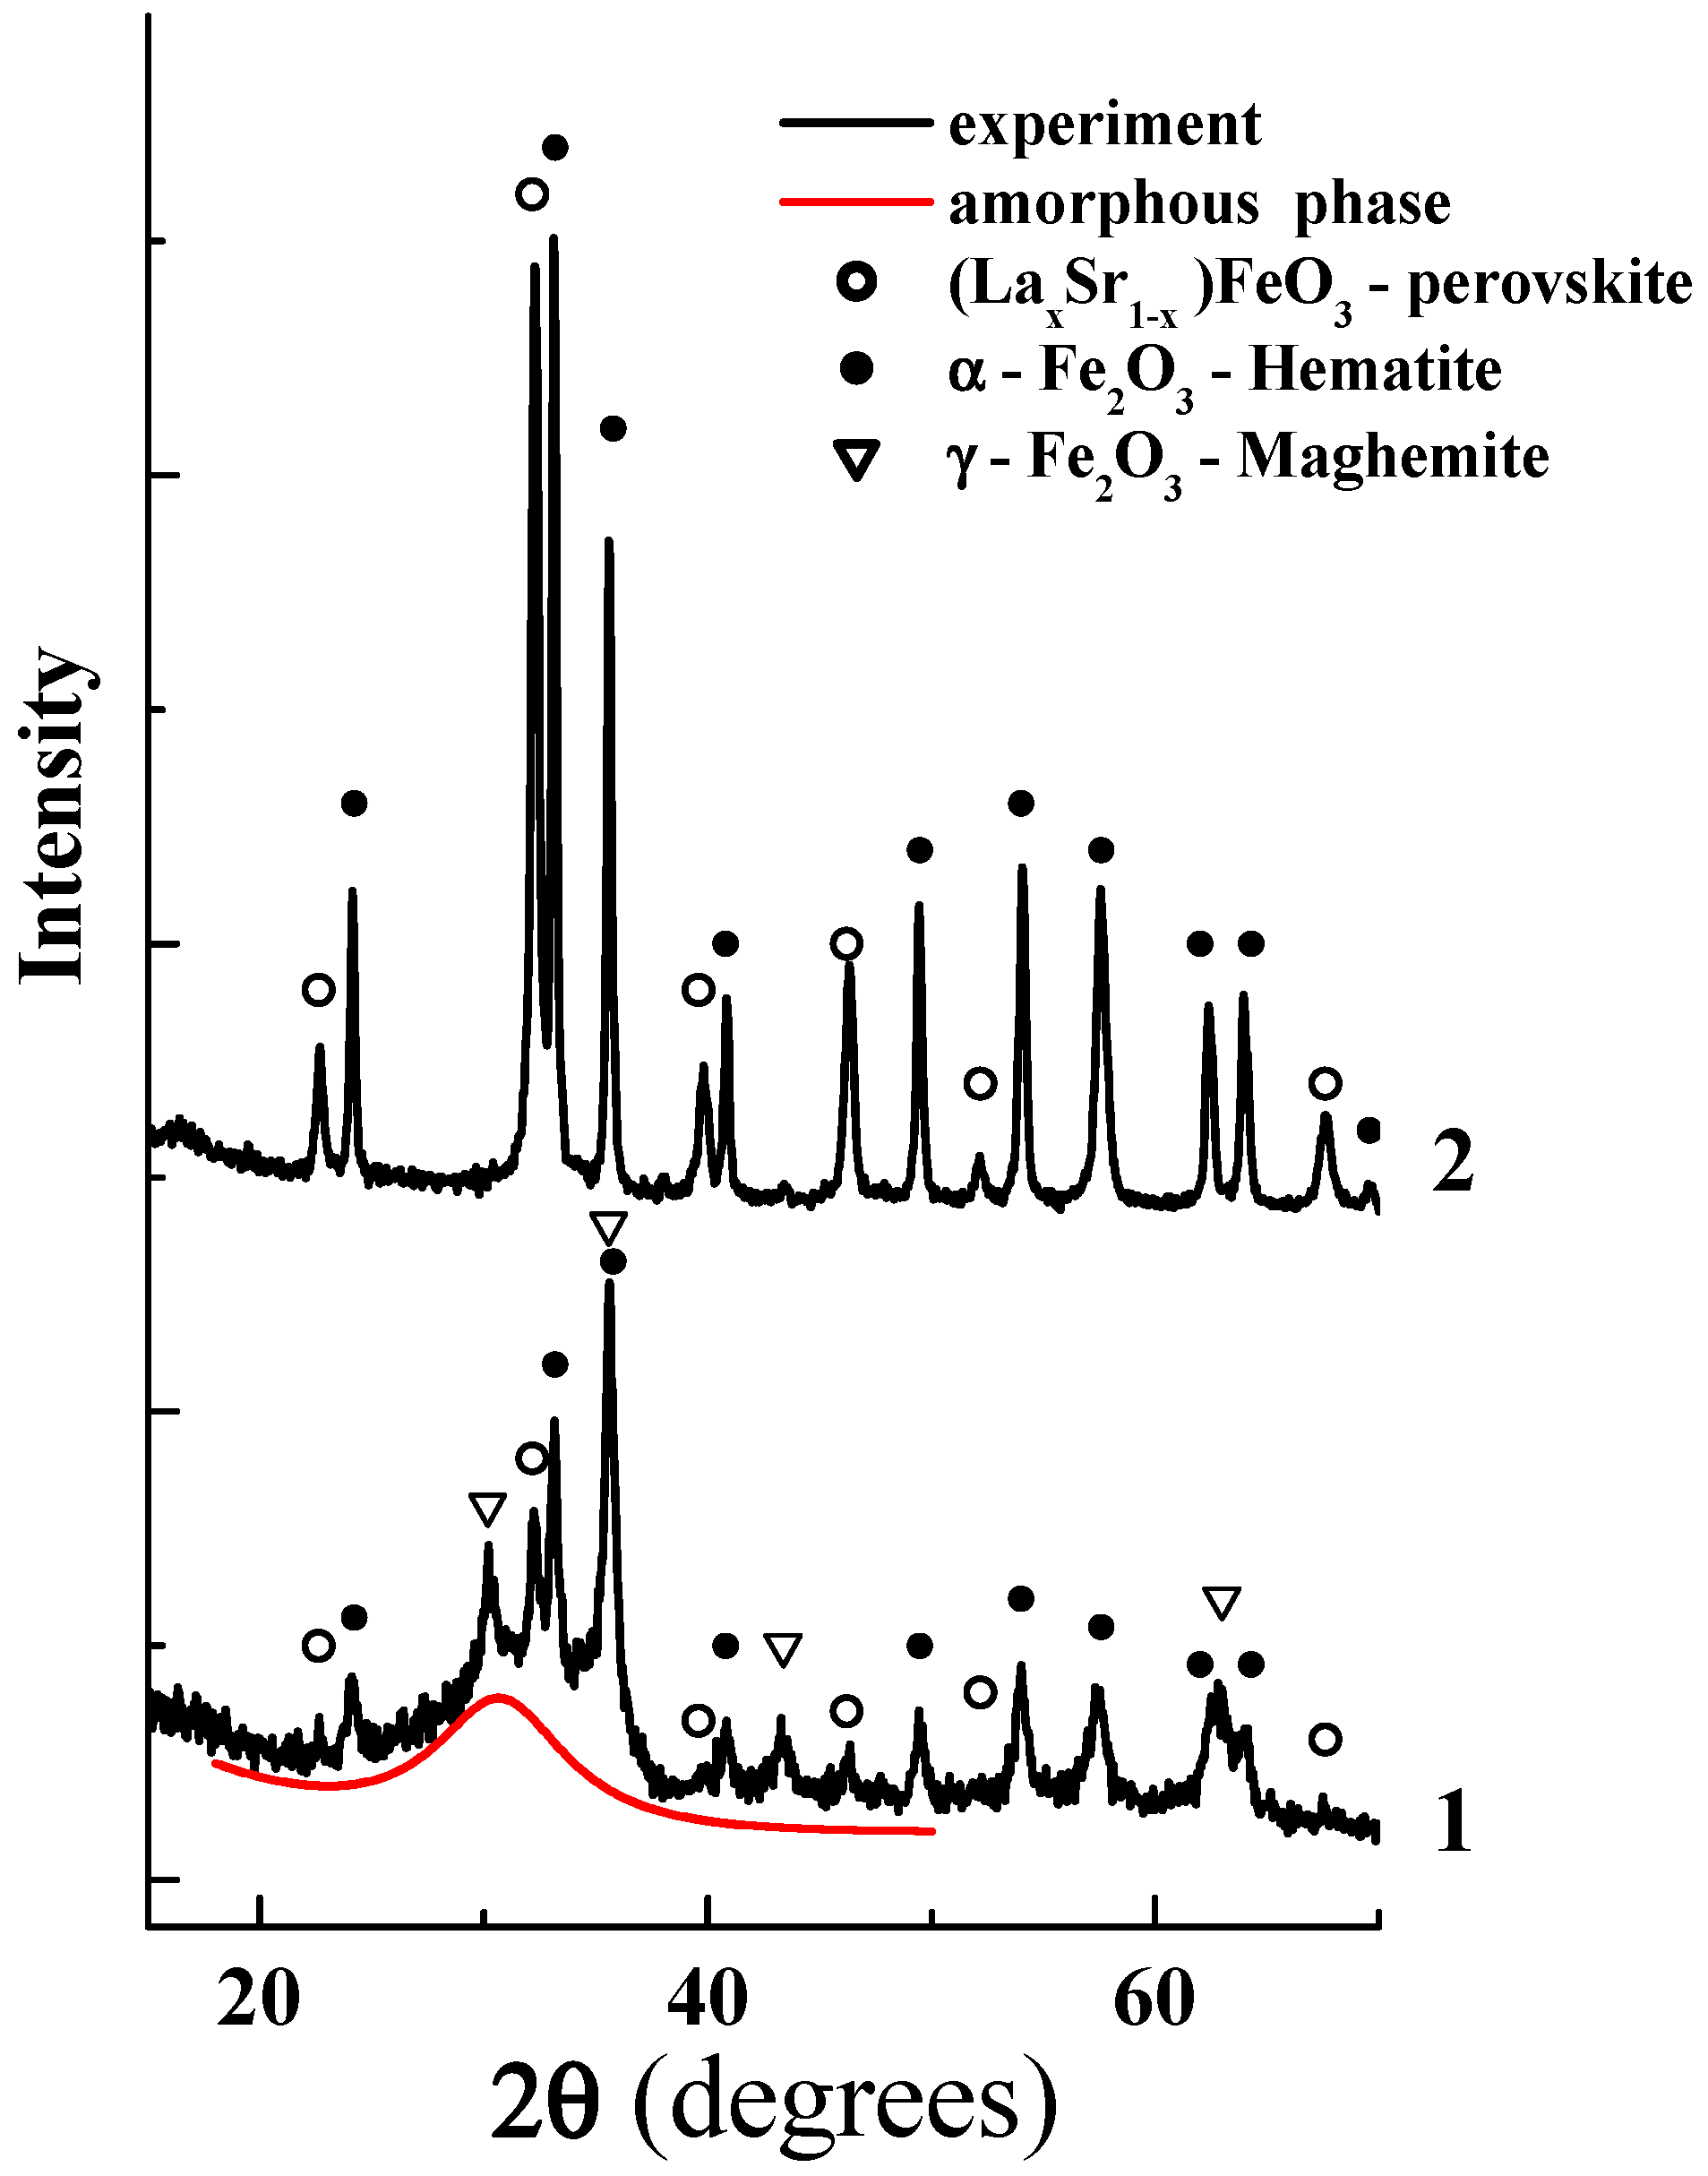
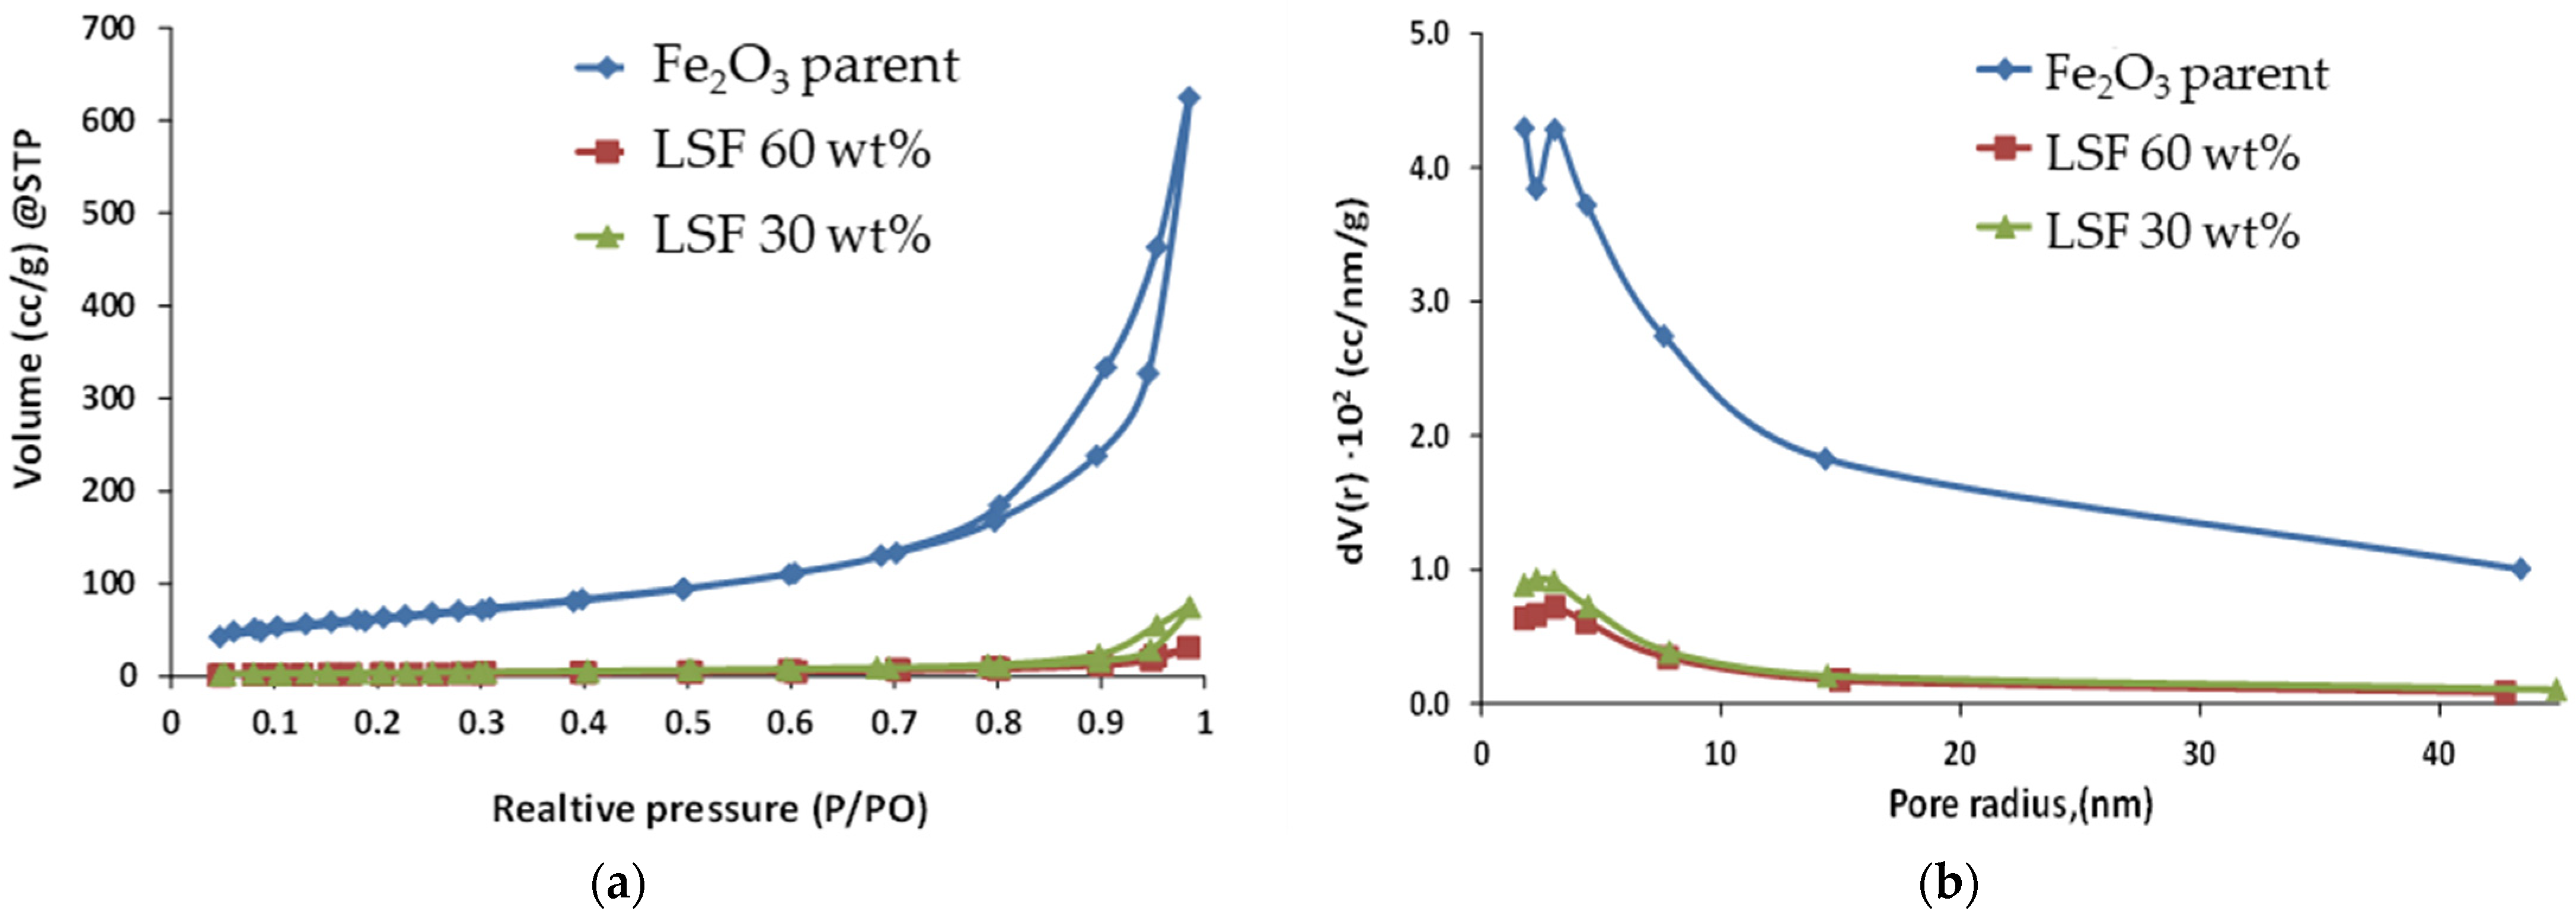
3.1. Structure and Morphology of Synthesized Core-Shell Materials
3.2. Content-State-Distribution-Reactivity of Surface Oxygen Atoms in Hematite, LSF and Core-Shell Hematite@LSF
4. Conclusions
Supplementary Materials
Author Contributions
Funding
Data Availability Statement
Acknowledgments
Conflicts of Interest
References
- Sun, Z.; Zhou, X.; Luo, W.; Yue, Q.; Zhang, Y.; Cheng, X.; Li, W.; Kong, B.; Deng, Y.; Zhao, D. Interfacial engineering of magnetic particles with porous shells: Towards magnetic core—Porous shell microparticles. Nano Today 2016, 11, 464–482. [Google Scholar] [CrossRef]
- Su, H.; Tian, Q.; Hurd Price, C.A.; Xu, L.; Qian, K.; Liu, J. Nanoporous core@shell particles: Design, preparation, applications in bioadsorption and biocatalysis. Nano Today 2020, 31, 100834. [Google Scholar] [CrossRef]
- Das, S.; Perez-Ramirez, J.; Gong, J.; Dewangan, N.; Hidajat, K.; Gates, B.C.; Kawi, S. Core-shell structured catalysts for thermocatalytic, photocatalytic, and electrocatalytic conversion of CO2. Chem. Soc. Rev. 2020, 49, 2937–3004. [Google Scholar] [CrossRef]
- Malayil Gopalan, S.; Deepak, V.; Jaehoon, K. Magnetic core-shell nanocatalysts: Promising versatile catalysts for organic and photocatalytic reactions. Catal. Rev. Sci. Eng. 2020, 62, 163–311. [Google Scholar] [CrossRef]
- Walker, J.S.; Rees, N.V.; Mendes, P.M. Progress towards the ideal core@shell nanoparticle for fuel cell electrocatalysis. J. Exp. Nanosci. 2018, 13, 258–271. [Google Scholar] [CrossRef]
- Chuanping, L.; Yongdong, J. Shell-Isolated Plasmonic Nanostructures for Biosensing, Catalysis, and Advanced Nanoelectronics. Adv. Funct. Mater. 2021, 31, 2008031. [Google Scholar] [CrossRef]
- Wang, Z.; Qi, J.; Yang, N.; Yu, R.; Wang, D. Core-shell nano/microstructures for heterogeneous tandem catalysis. Mater. Chem. Front. 2021, 5, 1126–1139. [Google Scholar] [CrossRef]
- Abdalwadood, H.E.; Ge, L.; Li, Z.; Liu, S.; Wang, S.; Zonghua, Z. Catalytic partial oxidation of methane to syngas: Review of perovskite catalysts and membrane reactors. Catal. Rev. Sci. Eng. 2021, 63, 1–67. [Google Scholar] [CrossRef]
- Yang, C.; Grimaud, A. Factors Controlling the Redox Activity of Oxygen in Perovskites: From Theory to Application for Catalytic Reactions. Catalyst 2017, 7, 149. [Google Scholar] [CrossRef]
- He, F.; Chen, J.; Liu, S.; Huang, Z.; Wei, G.; Wang, G.; Cao, Y.; Zhao, K. La1-xSrxFeO3 perovskite-type oxides for chemical looping steam methane reforming: Identification of the surface elements and redox cyclic performance. Int. J. Hydrogen Energy 2019, 44, 10265–10276. [Google Scholar] [CrossRef]
- Protasova, L.; Snijkers, F. Recent developments in oxygen carrier materials for hydrogen production via chemical looping processes. Fuel 2016, 181, 75–93. [Google Scholar] [CrossRef]
- Imtiaz, Q.; Hosseini, D.; Mueller, C.R. Review of oxygen carriers for chemical looping with oxygen uncoupling (CLOU): Thermodynamics, material development and synthesis. Energy Technol. 2013, 1, 633–647. [Google Scholar] [CrossRef]
- Galinsky, L.N.; Huang, Y.; Shafiefarhood, A.; Li, F. Iron Oxide with Facilitated O2–Transport for Facile Fuel Oxidation and CO2 Capture in a Chemical Looping Scheme. ACS Sustain. Chem. Eng. 2013, 1, 364–373. [Google Scholar] [CrossRef]
- Neal, L.M.; Shafiefarhood, A.; Li, F. Dynamic Methane Partial Oxidation Using a Fe2O3@La0.8Sr0.2FeO3−δ Core−Shell Redox Catalyst in the Absence of Gaseous Oxygen. ACS Catal. 2014, 4, 3560–3569. [Google Scholar] [CrossRef]
- Lobera, M.P.; Escolástico, S.; Garcia-Fayos, S.; Serra, J.M. Ethylene Production by ODHE in Catalytically Modified Ba0.5Sr0.5Co0.8Fe0.2O3−δ Membrane Reactors. ChemSusChem 2012, 5, 1587–1596. [Google Scholar] [CrossRef]
- Ten Elshof, J.E.; Bouwmeester, H.J.M.; Verweij, H. Oxygen transport through La1−xSrxFeO3−δ membranes. II. Permeation in air/CO, CO2 gradients. Solid State Ionics. 1996, 89, 81–92. [Google Scholar] [CrossRef]
- Ten Elshof, J.E.; Lankhorst, M.H.R.; Bouwmeester, H.J.M. Oxygen Exchange and Diffusion Coefficients of Strontium-Doped Lanthanum Ferrites by Electrical Conductivily Relaxation. J. Electrochem. Soc. 1997, 144, 1060–1067. [Google Scholar] [CrossRef]
- Patrakeev, M.V.; Bahteeva, J.A.; Mitberg, E.B.; Leonidov, I.A.; Kozhevnikov, V.L.; Poeppelmeierb, K.R. Electron/hole and ion transport in La1-xSrxFeO3-δ. Solid State Chem. 2003, 172, 219–231. [Google Scholar] [CrossRef]
- He, F.; Trainham, J.; Parsons, G.; Newman, J.S.; Li, F. A hybrid solar-redox scheme for liquid fuel and hydrogen coproduction. Energy Environ. Sci. 2014, 7, 2033–2042. [Google Scholar] [CrossRef]
- Ghosh Chaudhuri, R.; Paria, S. Core/shell nanoparticles: Classes, properties, synthesis mechanisms, characterization, and applications. Chem. Rev. 2012, 112, 2373–2433. [Google Scholar] [CrossRef]
- Liu, R.; Zhao, Y.; Huang, R.; Zhao, Y.; Zhou, H. Multiferroic ferrite/perovskite oxide core/shell nanostructure. J. Mater. Chem. 2010, 20, 10655–10670. [Google Scholar] [CrossRef]
- Chang, H.Y.; Wang, S.H.; Wang, Y.M.; Lai, C.W.; Lin, C.H.; Cheng, S.Y. Novel core-shell structure of perovskite anode and characterization. Int. J. Hydrogen Energy 2012, 37, 1771–1778. [Google Scholar] [CrossRef]
- Oliveira, P.N.; Alanis, D.; Bini, R.D.; Silva, D.M.; Dias, G.S.; Santos, I.A.; Cótica, L.F.; Guo, R.; Bhalla, A.S. Synthesis and characterization of structural, microstructural and ferroic properties of CoFe2O4 nanoparticles and CoFe2O4:BaTiO3 core-shell nanocomposites. Integr. Ferroelectr. 2016, 174, 88–97. [Google Scholar] [CrossRef]
- Lee, J.H.; Jang, J.T.; Choi, J.S.; Moon, S.H.; Noh, S.H.; Kim, J.W.; Kim, J.G.; Kim, I.S.; Park, K.I.; Cheon, J. Exchange-coupled magnetic nanoparticles for efficient heat induction. Nat. Nanotechnol. 2011, 6, 418–422. [Google Scholar] [CrossRef] [PubMed]
- Chang, H.Y.; Cheng, S.Y.; Sheu, C.I.; Wang, Y.H. Core–shell structure of strontium titanate self-grown by a hydrothermal process for use in grain boundary barrier layers. Nanotechnology 2003, 14, 603–608. [Google Scholar] [CrossRef]
- Zeng, G.; Shao, J.; Gu, R.; Li, Y. Facile fabrication of a highly active shell–core LaNi(Mg, Al)O3@Mg–Al catalyst for ethanol steam reforming. Catal. Today 2014, 233, 31–37. [Google Scholar] [CrossRef]
- Huang, C.; Wu, J.; Chen, Y.T.; Tian, M.; Rykov, A.I.; Hou, B.; Lin, J.; Chang, C.R.; Pan, X.; Wang, J.; et al. In situ encapsulation of iron (0) for solar thermochemical syngas production over iron-based perovskite material. Commun. Chem. (Nat. Commun.) 2018, 1, 55. [Google Scholar] [CrossRef]
- Koch, G.; Hävecker, M.; Teschner, D.; Carey, S.J.; Wang, Y.; Kube, P.; Hetaba, W.; Lunkenbein, T.; Auffermann, G.; Timpe, O.; et al. Surface Conditions That Constrain Alkane Oxidation on Perovskites. ACS Catal. 2020, 10, 7007–07020. [Google Scholar] [CrossRef]
- Suib, S.L.; Prech, J.; Cejka, J.; Kuwahara, Y.; Mori, K.; Yamashita, H. Some novel porous materials for selective catalytic oxidations. Mater. Today 2020, 32, 244–259. [Google Scholar] [CrossRef]
- Anpo, M.; Costentin, G.; Giamello, E.; Lauron-Pernot, H.; Sojka, Z. Characterization and reactivity of oxygen species at the surface of metal oxides. J. Catal. 2021, 393, 259–280. [Google Scholar] [CrossRef]
- Zhong, Z.; Chen, K.; Ji, Y.; Yan, Q. Methane combustion over B-site partially substituted perovskite-type LaFeO3 prepared by sol-gel method. Appl. Catal. A Gen. 1997, 156, 29–41. [Google Scholar] [CrossRef]
- Chen, D.; Yang, G.; Ciucci, F.; Tadé, M.O.; Shao, Z. 3D core-shell architecture from infiltration and beneficial reactive sintering as highly efficient and thermally stable oxygen reduction electrode. J. Mater. Chem. A 2014, 2, 1284–1293. [Google Scholar] [CrossRef]
- Wang, W.; Qu, J.; Zhao, B.; Yang, G.; Shao, Z. Core-shell structured Li0.33La0.56TiO3 perovskite as a highly efficient and sulfur-tolerant anode for solid-oxide fuel cells. J. Mater. Chem. A 2015, 3, 8545–8551. [Google Scholar] [CrossRef]
- Roduner, E. Size matters: Why nanomaterials are different. Chem. Soc. Rev. 2006, 35, 583–592. [Google Scholar] [CrossRef] [PubMed]
- Schwaminger, S.P.; García, P.F.; Merck, G.K.; Bodensteiner, F.A.; Heissler, S.; Günther, S.; Berensmeier, S. Nature of Interactions of Amino Acids with Bare Magnetite Nanoparticles. J. Phys. Chem. C 2015, 119, 23032–23041. [Google Scholar] [CrossRef]
- Bürger, A.; Magdans, U.; Gies, H. Adsorption of amino acids on the magnetite-(111)-surface: A force field study. J. Mol. Modeling 2013, 19, 851–857. [Google Scholar] [CrossRef]
- Biesingera, M.C.; Laua, L.W.M.; Gerson, A.R.; Smart, R.S.C. Resolving surface chemical states in XPS analysis of first row transition metals oxides and hydroxides: Sc, Ti, V, Cu and Zn. Appl. Surf. Sci. 2010, 257, 887–898. [Google Scholar] [CrossRef]
- Mierwaldt, D.; Mildner, S.; Arrigo, R.; Knop-Gericke, A.; Franke, E.; Blumenstein, A.; Hoffmann, J.; Jooss, C. In Situ XANES/XPS Investigation of Doped Manganese Perovskite Catalysts. Catalysts 2014, 4, 129–145. [Google Scholar] [CrossRef]
- Stoerzinger, K.A.; Hong, W.T.; Crumlin, E.J.; Bluhm, H.; Biegalski, M.D. Water Reactivity on the LaCoO3 (001) Surface: An Ambient Pressure X-ray Photoelectron Spectroscopy Study. J. Phys. Chem. C 2014, 118, 19733–19741. [Google Scholar] [CrossRef]
- Stoerzinger, K.A.; Hong, W.T.; Azimi, G.; Giordano, L.; Lee, Y.-L.; Crumlin, E.J.; Biegalski, M.D.; Bluhm, H.; Varanasi, K.K.; Shao-Horn, Y. Reactivity of Perovskites with Water: Role of Hydroxylation in Wetting and Implications for Oxygen Electrocatalysis. J. Phys. Chem. C 2015, 119, 18504–18512. [Google Scholar] [CrossRef]
- Ma, H.Q.; Tan, X.; Zhu, H.M.; Zhang, J.Y.; Zhang, L. XPS Characterization of La1–xCexFeO3 perovskite as high temperature water-gas shift catalysts. J. Chin. Soc. Rare Earths 2003, 21, 412–445. [Google Scholar] [CrossRef]
- Symianakis, E.; Malko, D.; Ahmad, E.; Mamede, A.S.; Paul, J.F.; Harrison, N.; Kucernak, A. Electrochemical characterization and quantified surface termination obtained by low energy ion scattering and X-ray photoelectron spectroscopy of orthorhombic and rhombohedral LaMnO3 powders. J. Phys. Chem. C 2015, 119, 12209–12217. [Google Scholar] [CrossRef]
- Graat, P.C.J.; Somers, M.A.J. Simultaneous determination of composition and thickness of thin iron-oxide films from XPS Fe 2p spectra. Appl. Surf. Sci. 1996, 100/101, 36–40. [Google Scholar] [CrossRef]
- Roosendaal, S.J.; van Asselen, B.J.; Elsenaar, W.M.; Vredenberg, A.; Habraken, F.H.P.M. The oxidation state of Fe(100) after initial oxidation in O2. Surf. Sci. 1999, 442, 329–337. [Google Scholar] [CrossRef]
- Widatallah, H.M.; Al-Rawas, A.D.; Johnson, C.; Al-Harthi, S.H.; Gismelseed, A.M.; Moore, E.A.; Stewart, S.J. The formation of nanocrystalline SrFeO3−δ using mechano-synthesis and subsequent sintering: Structure and mössbauer studies. J. Nanosci. Nanotechnol. 2009, 9, 2510–2517. [Google Scholar] [CrossRef]
- Abdel-Khalek, E.K.; Motawea, M.A.; Aboelnasr, M.A.; El-Bahnasawy, H.H. Study the oxygen vacancies and Fe oxidation states in CaFeO3-δ perovskite nanomaterial. Physica B 2022, 624, 413415. [Google Scholar] [CrossRef]
- Zhao, K.; Chen, J.; Li, H.; Zheng, A.; He, F. Effects of Co-substitution on the reactivity of double perovskite oxides LaSrFe2-xCoxO6 for the chemical-looping steam methane reforming. J. Energy Inst. 2019, 92, 594–603. [Google Scholar] [CrossRef]
- Berry, F.J.; Marco, J.F.; Ren, X. Reduction properties of phases in the system La0.5Sr0.5MO3 (M = Fe, Co). J. Solid State Chem. 2005, 178, 961–969. [Google Scholar] [CrossRef]
- Zhong, H.; Zeng, R. Structure of LaSrMO4 (M = Mn, Fe, Co, Ni, Cu) and their catalytic properties in the total oxidation of hexane. J. Serb. Chem. Soc. 2006, 71, 1049–1059. [Google Scholar] [CrossRef]
- Haibel, E.; Füglein, E.; Schulze, A.S.; Walter, D. Thermal decomposition of carbonated lanthanum hydroxide. J. Therm. Anal. Calorim. 2019, 138, 3571–3575. [Google Scholar] [CrossRef]
- Haibel, E.; Berendts, S.; Walter, D. Thermogravimetric and X-ray diffraction investigation on carbonated lanthanum oxide and lanthanum hydroxide formed in humid CO2 atmosphere. J. Therm. Anal. Calorim. 2018, 134, 261–267. [Google Scholar] [CrossRef]
- Füglein, E.; Walter, D. Thermal analysis of lanthanum hydroxide. J. Therm. Anal. Calorim. 2012, 110, 199–202. [Google Scholar] [CrossRef]
- Parkinson, G.S. Iron oxide surfaces. Surf. Sci. Rep. 2016, 71, 272–365. [Google Scholar] [CrossRef]
- Tang, J.J.; Liu, B. Reactivity of the Fe2O3 (0001) Surface for Methane Oxidation: A GGA+ U Study. J. Phys. Chem. C 2016, 120, 6642–6650. [Google Scholar] [CrossRef]
- Eltouny, N.; Ariya, P.A. Competing reactions of selected atmospheric gases on Fe3O4 nanoparticles surfaces. Phys. Chem. Chem. Phys. 2014, 16, 23056–23066. [Google Scholar] [CrossRef]
- Tortes Sanchez, R.M.; Curt, E.M.; Volzone, C.; Mercader, R.C.; Cavalieri, A.L. Study of Fe (II) oxidation in ground magnetite. Mat. Res. Bull. 1990, 25, 553–561. [Google Scholar] [CrossRef]
- De Alwin, C.; Leftwich, T.R.; Mukherjee, P.; Denofre, A.K.; Perrine, A. Spontaneous selective deposition of iron oxide nanoparticles on graphite as model catalysts. Nanoscale Adv. 2019, 1, 4729–4744. [Google Scholar] [CrossRef]
- Jozwiak, W.K.; Kaczmarek, E.; Maniecki, T.P.; Ignaczak, W.; Maniukiewicz, W. Reduction behavior of iron oxides in hydrogen and carbon monoxide atmospheres. Appl. Catal. A. 2007, 326, 17–27. [Google Scholar] [CrossRef]
- Feng, Y.; Wang, N.; Guo, X.; Zhang, S. Characteristics of dopant distribution and surface oxygen vacancy formation for modified Fe2O3 in chemical looping combustion. Fuel 2020, 276, 117942. [Google Scholar] [CrossRef]
- Albrecht, M.; Rodemerck, U.; Schneider, M.; Bröring, M.; Baabe, D.; Kondratenko, E.V. Unexpectedly efficient CO2 hydrogenation to higher hydrocarbons over non-doped Fe2O3. Appl. Catal. B 2017, 204, 119–126. [Google Scholar] [CrossRef]
- Chen, T.; Lyu, J.; Wang, Q.; Bai, P.; Wu, Y.; Xiangh, G. Mechanistic study on boron adsorption and isotopic separation with magnetic magnetite nanoparticles. J. Mater Sci 2021, 56, 4624–4640. [Google Scholar] [CrossRef]
- Ossowski, T.; Kiejna, A. Oxygen adsorption on Fe(110) surface revisited. Surf. Sci. 2015, 637–638, 35–41. [Google Scholar] [CrossRef]
- Papagno, L.; Caputi, L.S.; Chiarello, G. Structural study of clean and oxygen-covered Fe(110) by surface extended energy-loss fine-structure technique. Surf. Sci. 1986, 175, L767–L772. [Google Scholar] [CrossRef]
- Mani, P.; Kim, Y.; Lakhera, S.K.; Neppolian, B.H.; Choi, H. Complete arsenite removal from groundwater by UV activated potassium persulfate and iron oxide impregnated granular activated carbon. Chemosphere 2021, 277, 130225. [Google Scholar] [CrossRef]
- Zhang, Z.; Lu, J.; Yun, T.; Zheng, M.; Pan, J.; Sow, C.H.; Tok, E.S. Desorption of Ambient Gas Molecules and Phase Transformation of α-Fe2O3 Nanostructures during Ultrahigh Vacuum Annealing. J. Phys. Chem. C 2013, 117, 1509–1517. [Google Scholar] [CrossRef]
- Ivanov, D.V.; Pinaeva, L.G.; Isupova, L.A.; Sadovskaya, E.M.; Prosvirin, I.P.; Gerasimov, E.Y.; Yakovleva, I.S. Effect of surface decoration with LaSrFeO4 on oxygen mobiity and catalytic activity of La0.4Sr0.6FeO3−ı in high-temperature N2O decomposition, methane combustion and ammonia oxidation. Appl. Catal. A Gen. 2013, 457, 42–51. [Google Scholar] [CrossRef]


| Calcination Temperature, °C | 25 | 275 | 300 | 350 | 600 | 700 | 800 | 1000 |
|---|---|---|---|---|---|---|---|---|
| Content of hematite phases, wt% | ||||||||
| - well crystallized | 74 | 81 | 97 | 100 | 100 | 100 | 100 | 100 |
| - small nanocrystals < 4 nm | 26 | 19 | 3 | -- | -- | -- | -- | -- |
| Crystal size of well crystallized hematite phase, nm | 10 | 20 | 20 | 25 | 45 | 50 | >50 | >>50 |
| Surface area, m2/g | 229 | 127 | 99 | 50 | 45 | 8 | 2.7 | 1.0 |
| Pore volume, cm3/g | 0.97 | 0.64 | 0.42 | 0.23 | 0.1 | 0.06 | 0.01 | 0.004 |
| Average pore diameter, nm | 8.46 | 10.1 | 8.5 | 9.1 | 7.3 | 9.2 | 7.4 | 8.0 |
| LSF Shell Thickness (nm) | LSF Content, wt% | Total OSC, wt% O |
|---|---|---|
| 3 | 32 | 23.6 |
| 4 | 39 | 22.2 |
| 5 | 45 | 21.0 |
| 6 | 57 | 18.6 |
| Materials | Normalized Surface Concentrations of Metal Atoms, XPS, (at. %) | Normalized Bulk Concentrations of Metal Atoms (at. %) | Core Surface Coverage with LSF, % | ||||
|---|---|---|---|---|---|---|---|
| La | Sr | Fe | La | Sr | Fe | ||
| Fe2O3 | -- | -- | 100 | -- | -- | 100 | 0 |
| LSF | 35 | 21 | 44 | 33 | 12 | 55 | 100 |
| CS-4 | 20 | 19 | 61 | 22 | 6 | 72 | 70 |
| CS-3 | 20 | 23 | 57 | 20 | 5 | 75 | 77 |
| CS-5 | 40 | 15 | 46 | 21 | 5 | 74 | 98 |
| Materials | Surface Area, m2/g | Total Amount of Reacted Hydrogen, (mmol/g) | Equivalent Amount of Removed Oxygen, (mmol/g) | TPR Peaks Positions, °C |
|---|---|---|---|---|
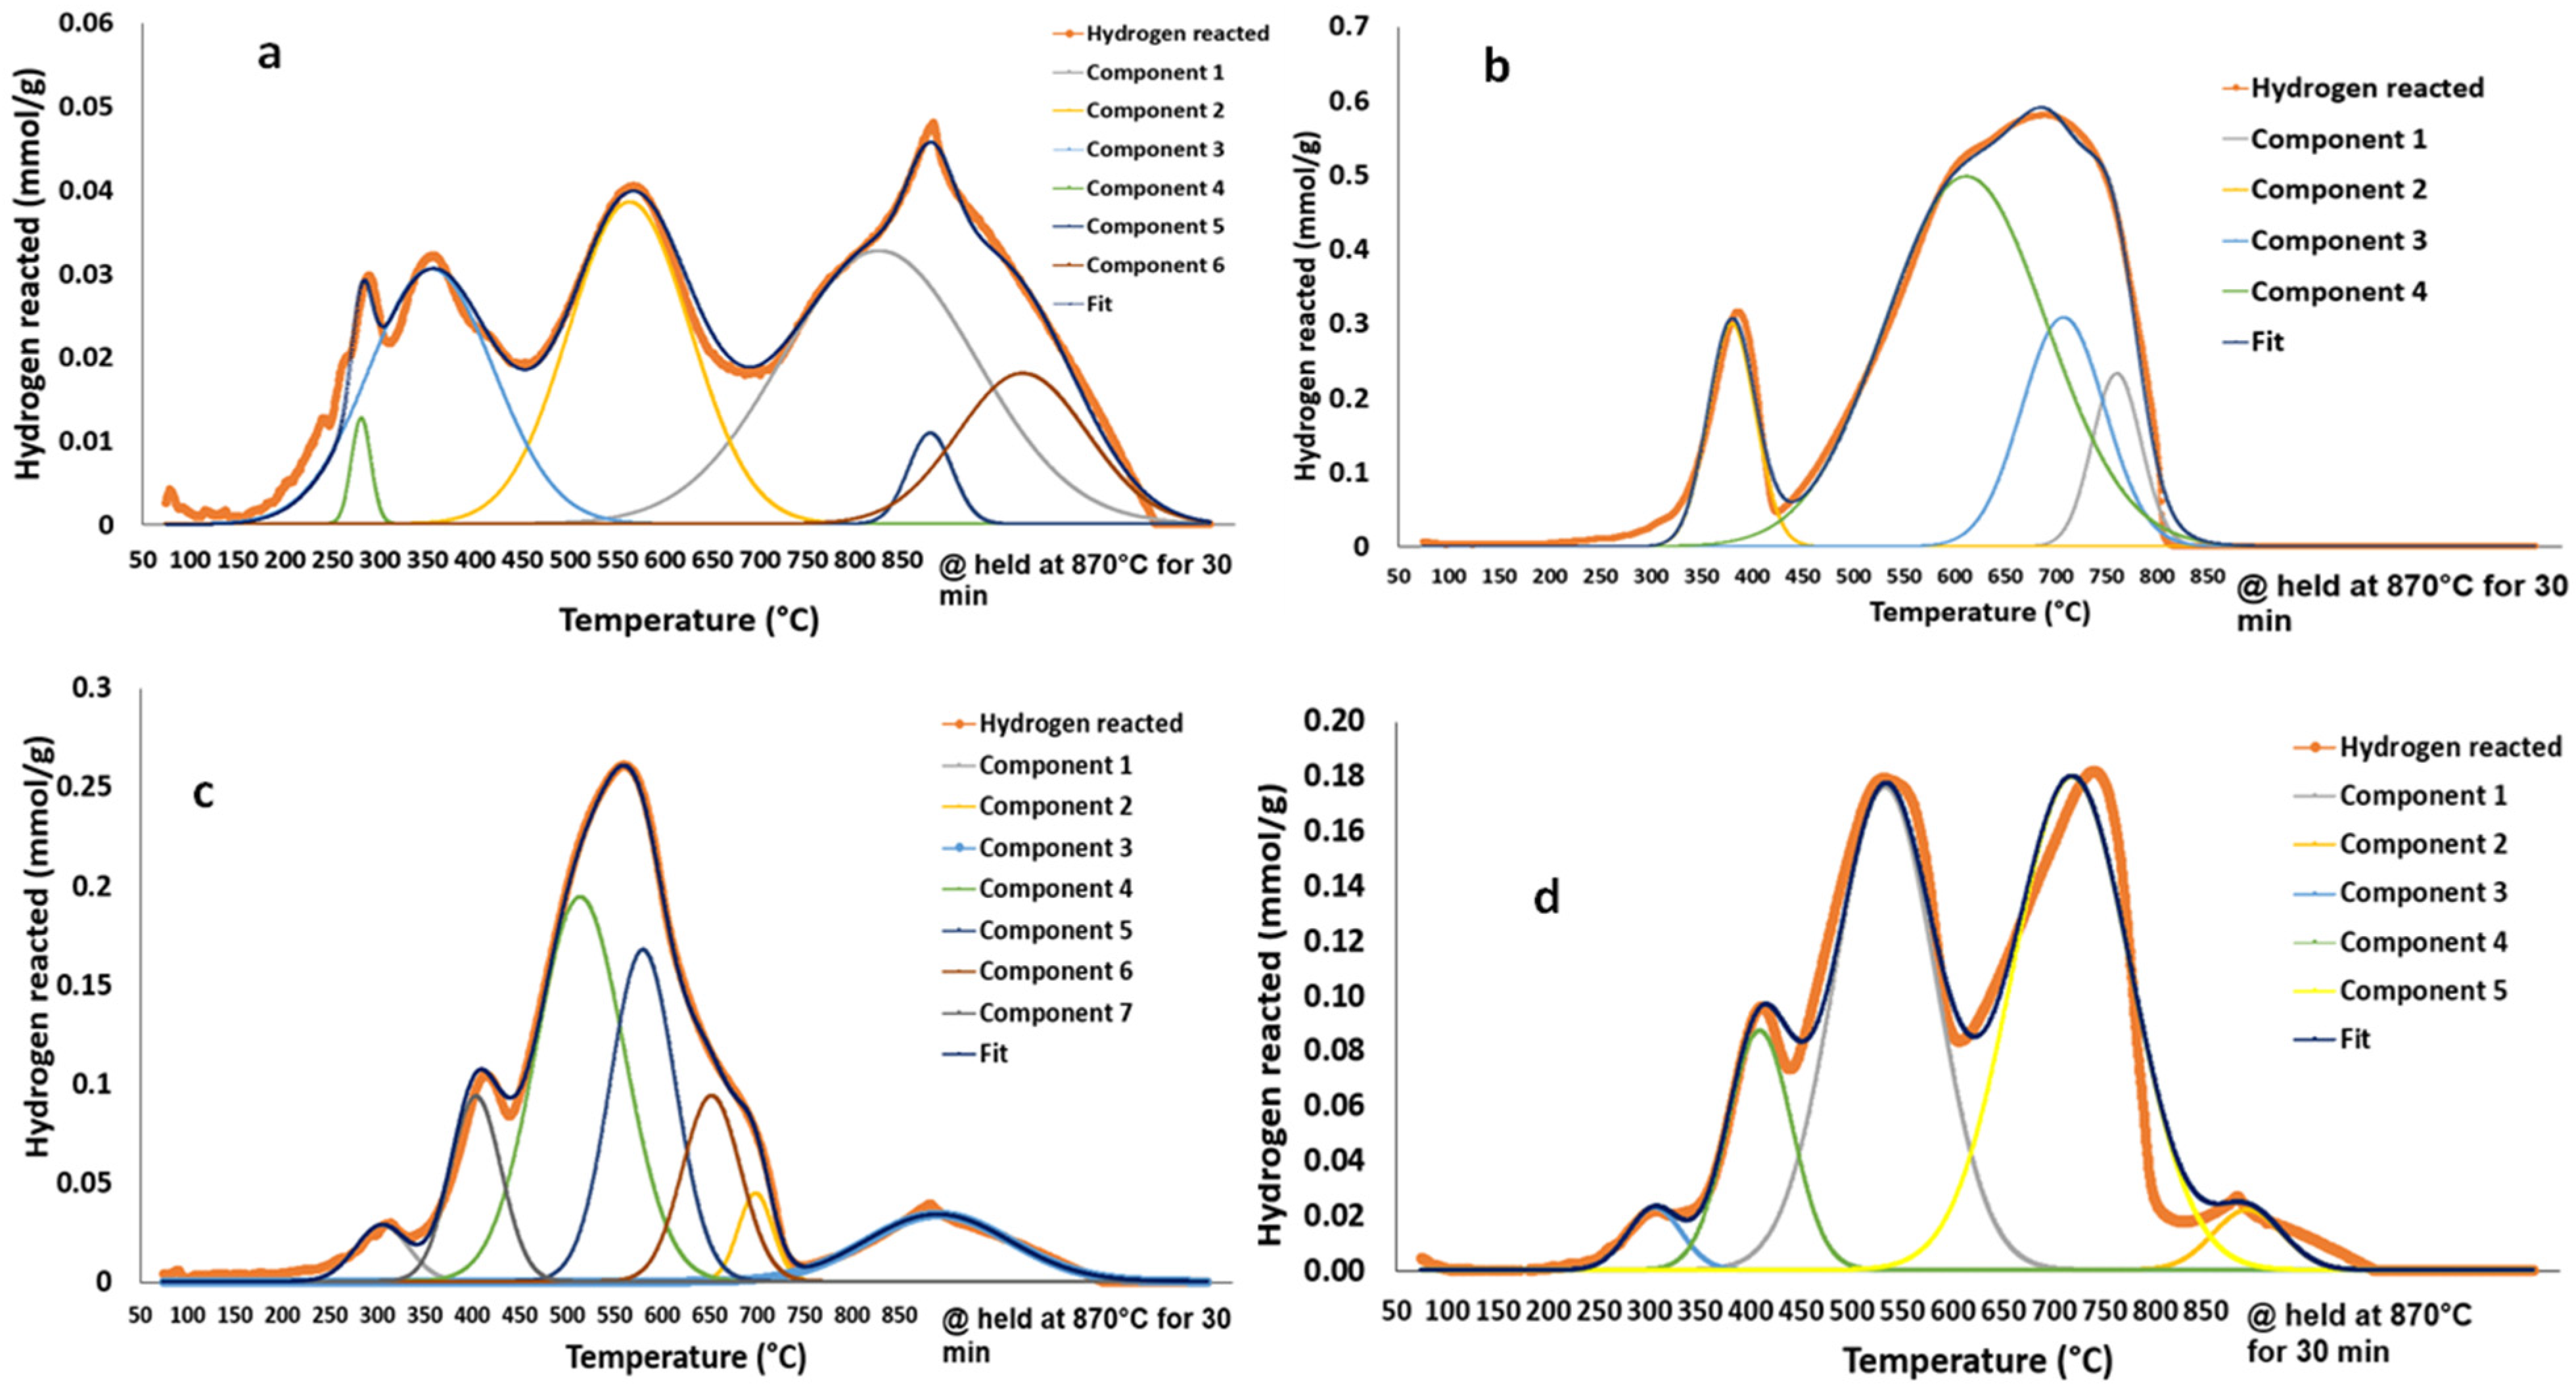
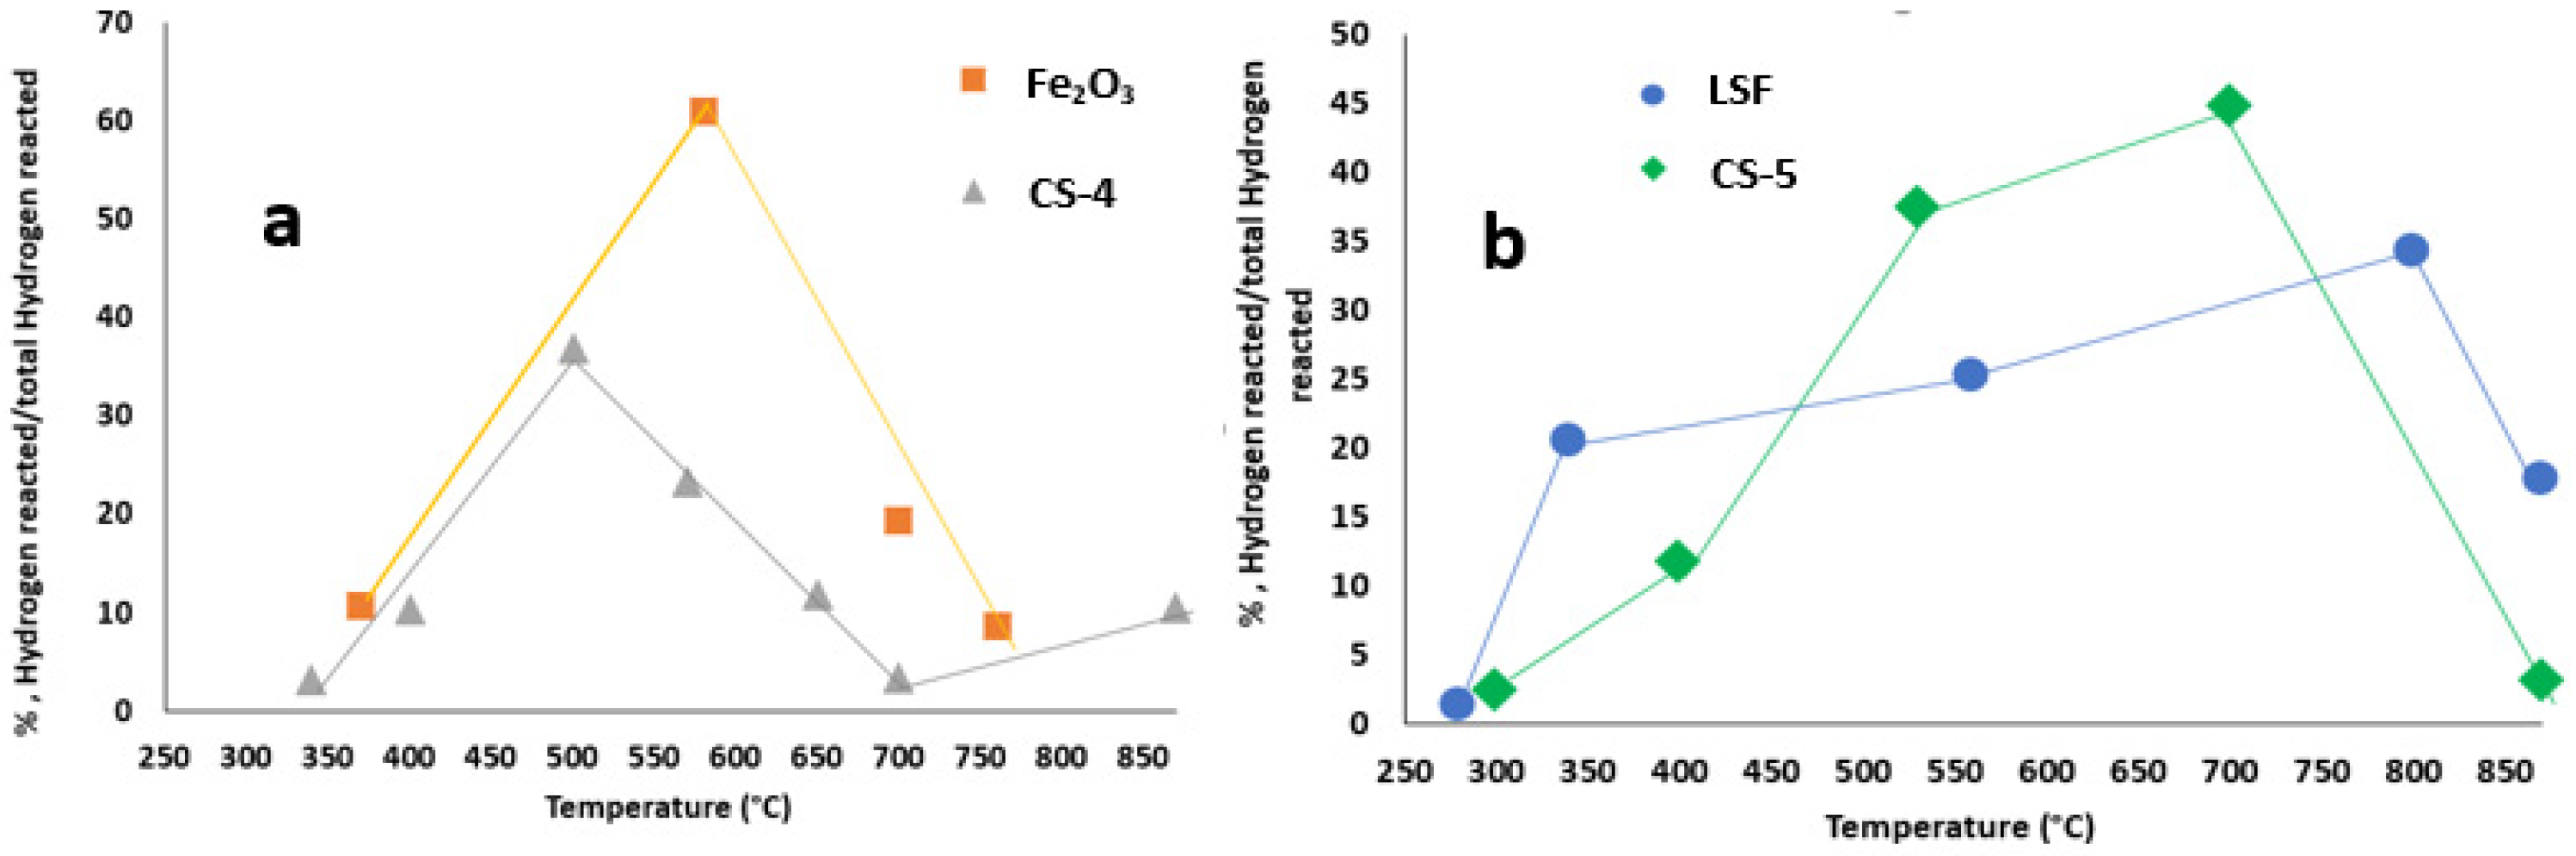
| LSF | 17 | 2.4 | 1.2 | 280,340,560,800,870 |
| Fe2O3 | 8 | 16.3 | 8.1 | 370,580,700,760 |
| CS-4 | 11 | 6.1 | 3.0 | 340,400,500,570,650,700,870 |
| CS-5 | 20 | 6.0 | 3.0 | 300,400,530,700,870 |
| Material | Phase Composition: Phase/wt%. | ||
|---|---|---|---|
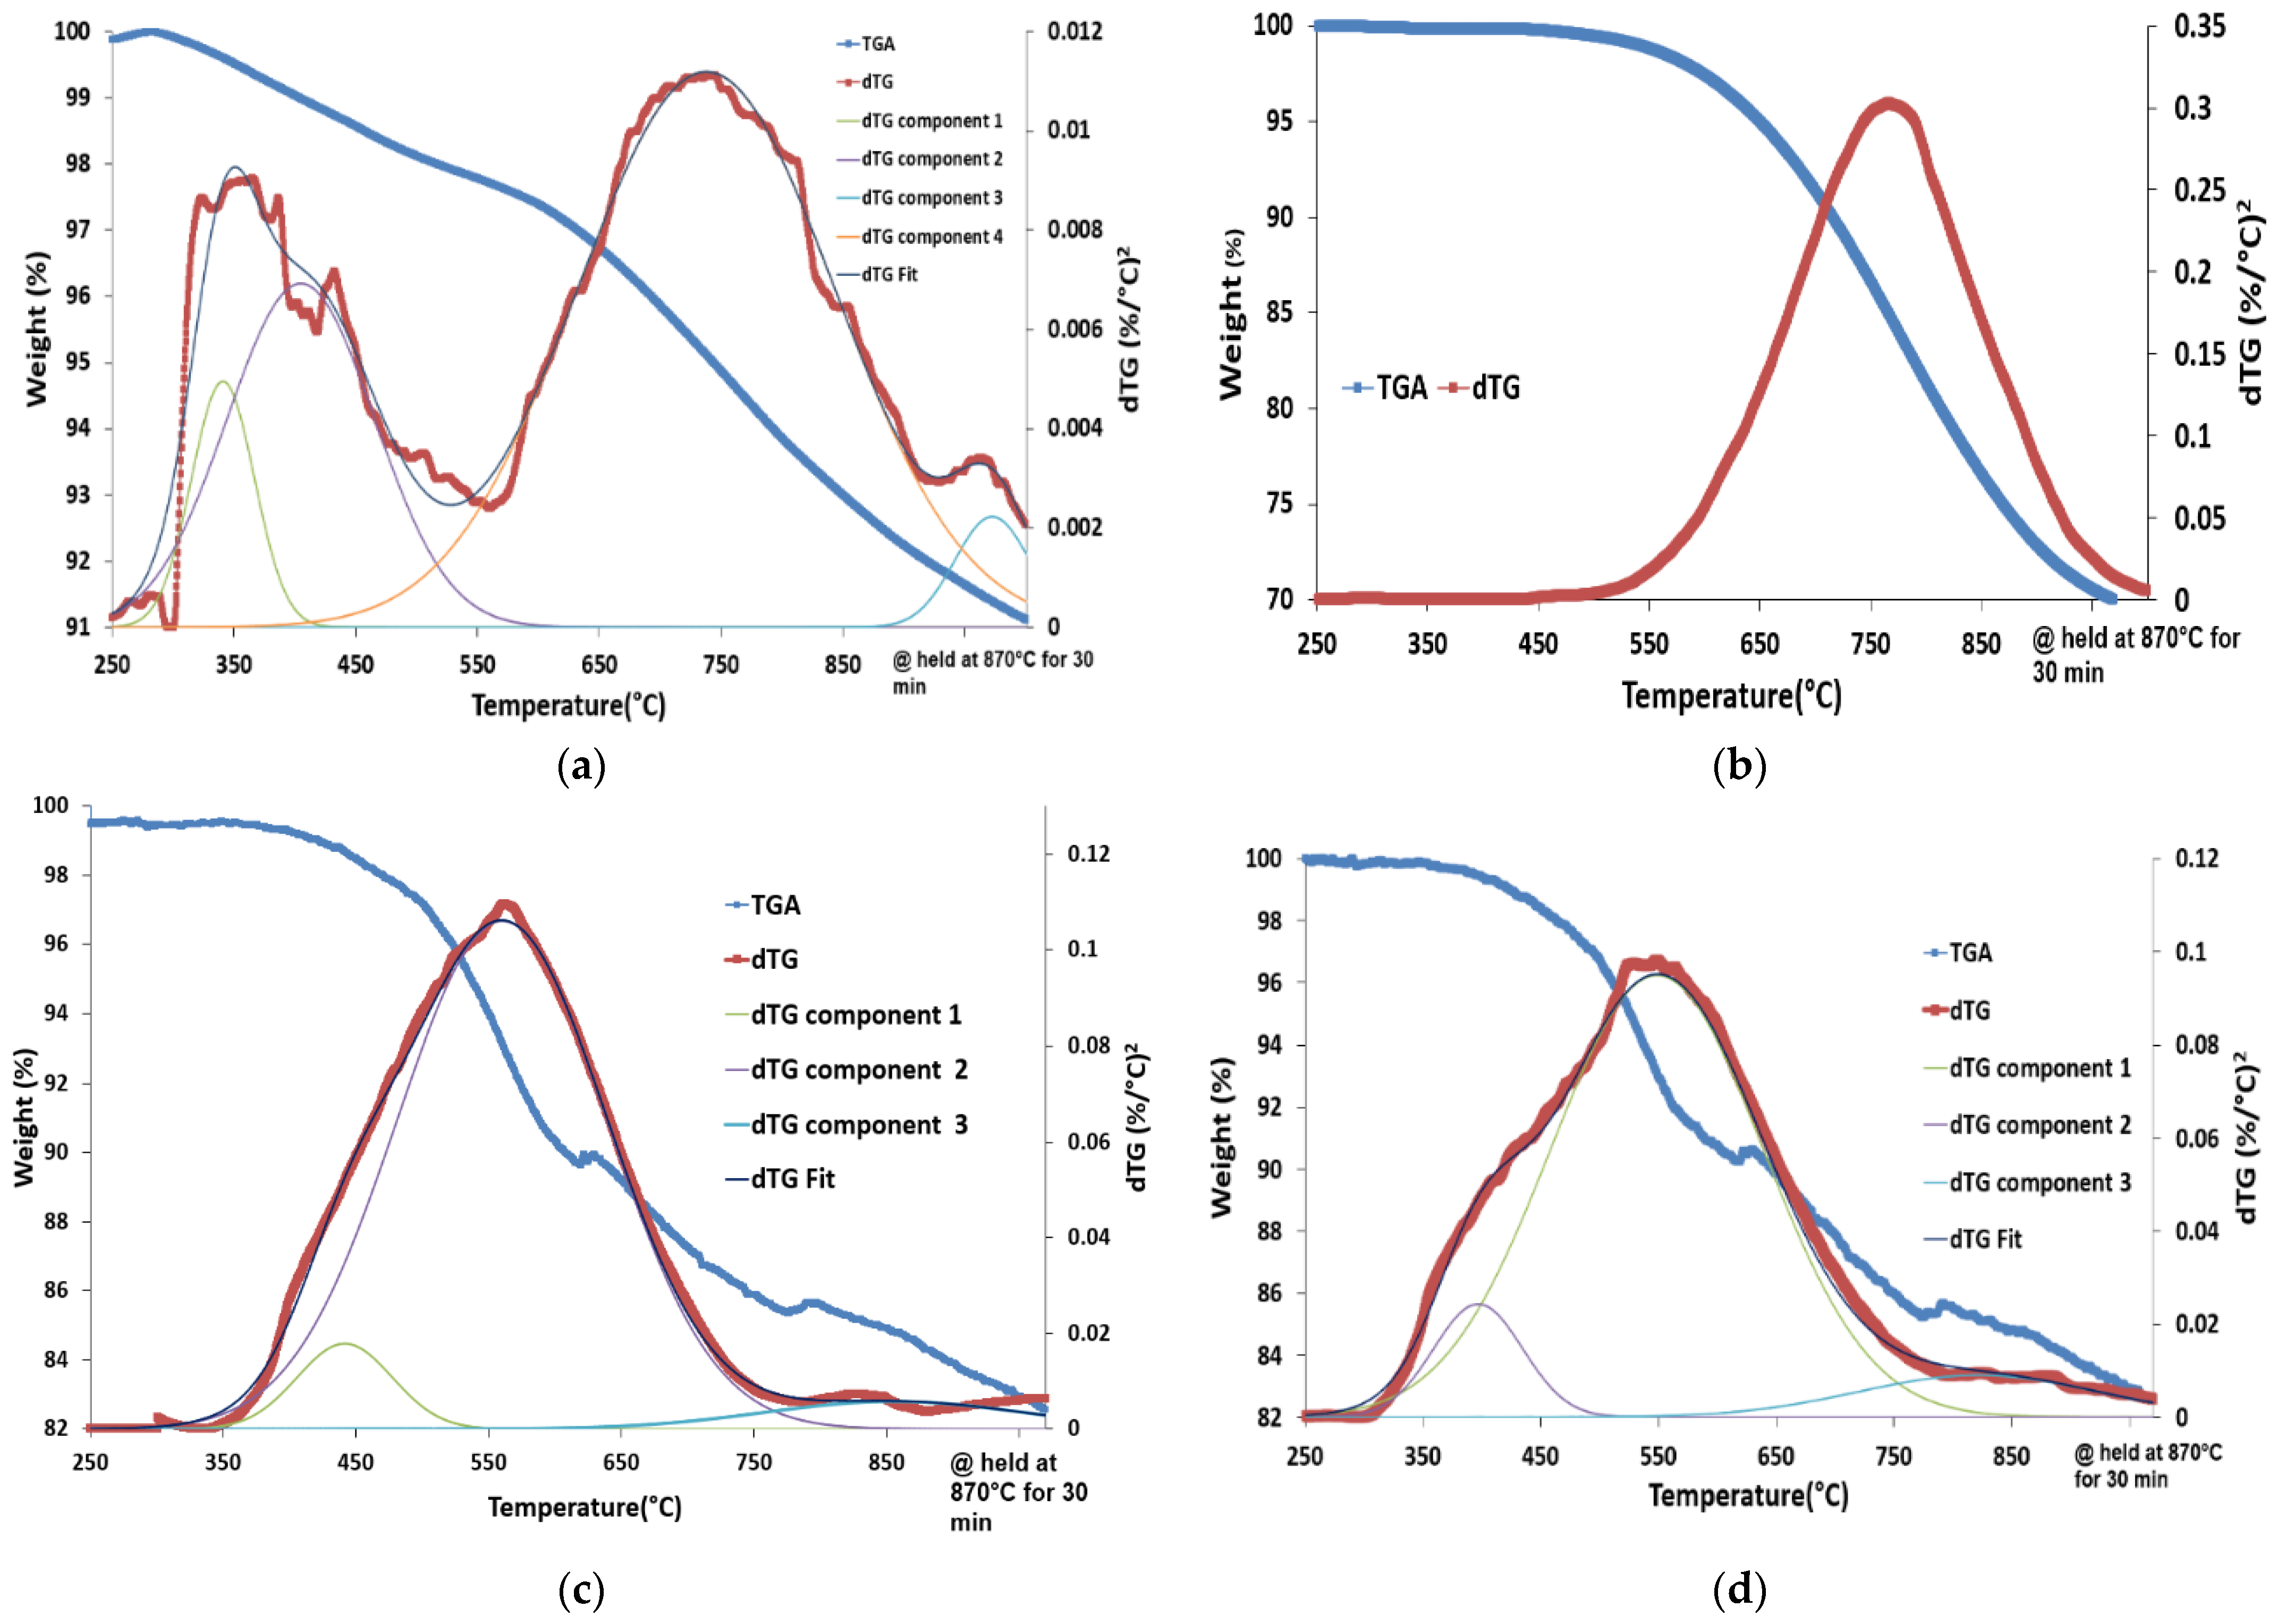
| After H2-TPR Up to 450 °C | After H2-TPR Up to 650 °C | After H2-TPR Up to 870 °C | |
| Fe2O3 | Fe3O4/87 | Fe0/100 | Fe0/100 |
| FeO/19 | |||
| Fe0/4 | |||
| LSF | LSF/93 Fe0/7 | LSF/15 | |
| LSF/97 | Fe0/25 | ||
| Fe0/3 | La(OH)3/27 | ||
| SrLaFeO4/33 | |||
| CS-4 | LSF/72 | LSF/70 Fe0/30 | LSF/10 |
| Fe0/13 | Fe0/46 | ||
| Fe3O4/8 | La(OH)3/24 | ||
| FeO/7 | SrLaFeO4/20 | ||
| CS-5 | LSF/63 | LSF/66 Fe0/26 FeO/8 | LSF/20 |
| FeO/19 | Fe0/44 | ||
| Fe3O4/13 | La(OH)3/18 | ||
| Fe0/5 | SrLaFeO4/18 | ||
| Materials | Lattice Oxygen | Defect-Affected Oxygen | Surface Oxygen | Carbonate and Organics Oxygen | Oxygen in Hydroxyl Groups | |||||
|---|---|---|---|---|---|---|---|---|---|---|
| B.E., eV | % at. | B.E., eV | % at. | B.E., eV | % at. | B.E., eV | % at. | B.E., eV | % at. | |
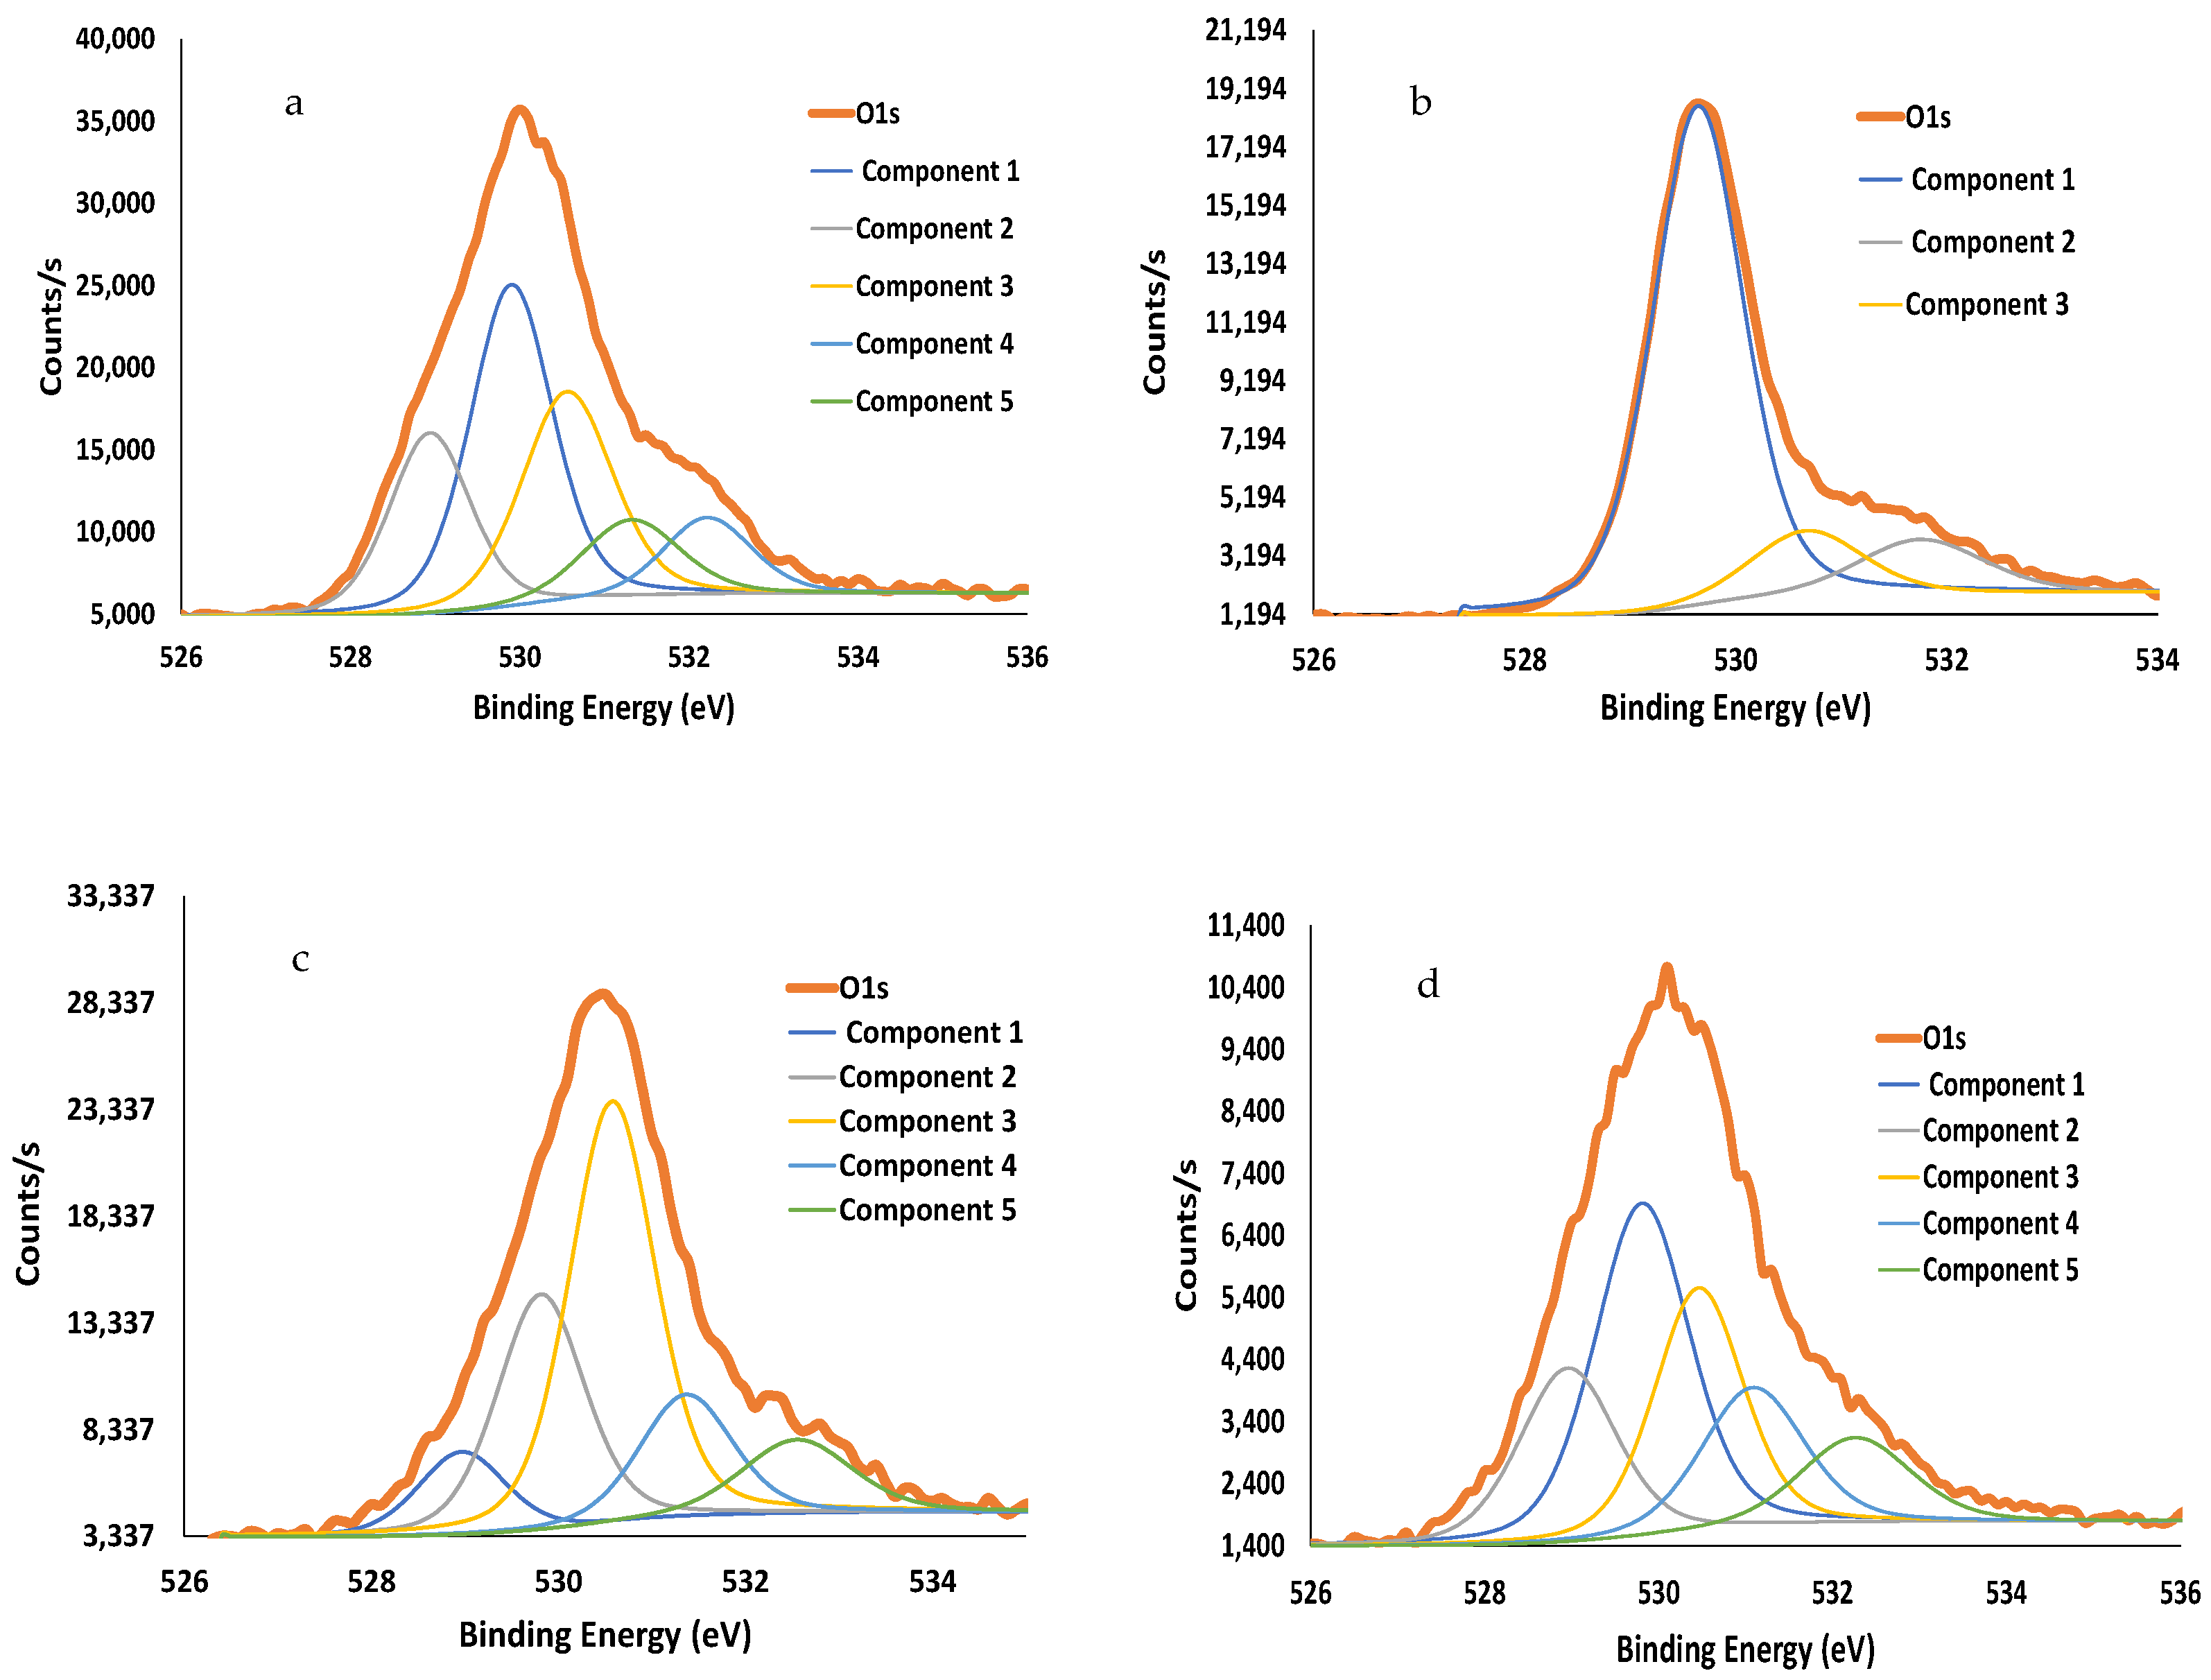
| Fe2O3 | 529.6 | 75.7 | ----- | ----- | 530.7 | 12.5 | ---- | ----- | 532.8 | 11.7 |
| LSF | 528.9 | 19.6 | 529.9 | 35.4 | 530.5 | 25.6 | 531.3 | 10.2 | 532.2 | 9.31 |
| Core-shell CS-4 | 529.0 | 8.6 | 529.8 | 24.8 | 530.6 | 43.3 | 531.4 | 13.6 | 532.6 | 9.7 |
| Core-shell CS-5 | 529.0 | 18.0 | 529.8 | 33.7 | 530.5 | 23.0 | 531.1 | 15.2 | 532.3 | 10.2 |
| Materials | Lattice Oxygen | Defect-Affected Oxygen | Surface Oxygen | Carbonate and Organics Oxygen | Oxygen in Hydroxyl Groups | |||||
|---|---|---|---|---|---|---|---|---|---|---|
| B.E., eV | % at. | B.E., eV | % at. | B.E., eV | % at. | B.E., eV | % at. | B.E., eV | % at. | |
| LSF fresh | 528.9 | 19.6 | 529.9 | 35.4 | 530.5 | 25.6 | 531.3 | 10.2 | 532.2 | 9.31 |
| H2-TPR 450 °C | ----- | ----- | 530.2 | 35.4 | ----- | ----- | 531.9 | 51.8 | 533.7 | 12.8 |
| H2-TPR 650 °C | ----- | ----- | 529.5 | 70.5 | ----- | ----- | 531.7 | 25.6 | 532.7 | 3.93 |
| H2-TPR 870 °C | 528.7 | 29.2 | ----- | ----- | ----- | ----- | 531.1 | 57.3 | 533.4 | 12.8 |
| CS-4 fresh | 529.0 | 8.6 | 529.8 | 24.8 | 530.6 | 43.3 | 531.4 | 13.6 | 532.6 | 9.7 |
| H2-TPR 450 °C | 528.3 | 36.0 | 529.6 | 50.0 | ----- | ------ | 531.0 | 14.0 | ----- | ----- |
| H2-TPR 650 °C | 528.9 | 36.5 | 530.1 | 43.2 | ----- | ----- | 531.6 | 20.3 | ----- | ----- |
| H2-TPR 870 °C | 529.2 | 35.5 | ---- | ---- | ---- | ----- | 531.0 | 40.6 | 532.7 | 23.9 |
| CS-5 fresh | 529.0 | 18.0 | 529.8 | 33.7 | 530.5 | 23.0 | 531.1 | 15.2 | 532.3 | 10.2 |
| H2-TPR 450 °C | ----- | ----- | 529.4 | 48.9 | 530.3 | 38.3 | 531.8 | 12.7 | ----- | ----- |
| H2-TPR 650 °C | ----- | ----- | 529.4 | 87.7 | ----- | ----- | 531.5 | 12.3 | ----- | ----- |
| H2-TPR 870 °C | ----- | ----- | 529.6 | 45.2 | ----- | ----- | 531.4 | 40.1 | 533.0 | 14.6 |
| Fe2O3 fresh | 529.6 | 75.7 | ----- | ----- | 530.7 | 12.5 | ---- | --- | 532.8 | 11.7 |
| H2-TPR 450 °C | ----- | ----- | ----- | ----- | 530.4 | 73.1 | --- | ---- | 532.6 | 26.7 |
| H2-TPR 650 °C | ------ | ------ | ------ | ------ | 530.2 | 68.2 | ------ | ------ | 532.6 | 31.8 |
| H2-TPR 870 °C | ----- | ----- | ----- | ----- | 530.3 | 64.3 | --- | ---- | 532.7 | 35.7 |
Publisher’s Note: MDPI stays neutral with regard to jurisdictional claims in published maps and institutional affiliations. |
© 2021 by the authors. Licensee MDPI, Basel, Switzerland. This article is an open access article distributed under the terms and conditions of the Creative Commons Attribution (CC BY) license (https://creativecommons.org/licenses/by/4.0/).
Share and Cite
Ohayon Dahan, H.; Landau, M.V.; Vidruk Nehemya, R.; Edri, E.; Herskowitz, M.; Ruan, C.; Li, F. Core-Shell Fe2O3@La1−xSrxFeO3−δ Material for Catalytic Oxidations: Coverage of Iron Oxide Core, Oxygen Storage Capacity and Reactivity of Surface Oxygens. Materials 2021, 14, 7355. https://doi.org/10.3390/ma14237355
Ohayon Dahan H, Landau MV, Vidruk Nehemya R, Edri E, Herskowitz M, Ruan C, Li F. Core-Shell Fe2O3@La1−xSrxFeO3−δ Material for Catalytic Oxidations: Coverage of Iron Oxide Core, Oxygen Storage Capacity and Reactivity of Surface Oxygens. Materials. 2021; 14(23):7355. https://doi.org/10.3390/ma14237355
Chicago/Turabian StyleOhayon Dahan, Hen, Miron V. Landau, Roxana Vidruk Nehemya, Eran Edri, Moti Herskowitz, Chongyan Ruan, and Fanxing Li. 2021. "Core-Shell Fe2O3@La1−xSrxFeO3−δ Material for Catalytic Oxidations: Coverage of Iron Oxide Core, Oxygen Storage Capacity and Reactivity of Surface Oxygens" Materials 14, no. 23: 7355. https://doi.org/10.3390/ma14237355
APA StyleOhayon Dahan, H., Landau, M. V., Vidruk Nehemya, R., Edri, E., Herskowitz, M., Ruan, C., & Li, F. (2021). Core-Shell Fe2O3@La1−xSrxFeO3−δ Material for Catalytic Oxidations: Coverage of Iron Oxide Core, Oxygen Storage Capacity and Reactivity of Surface Oxygens. Materials, 14(23), 7355. https://doi.org/10.3390/ma14237355