
Flexural Response and Failure Analysis of Solid and Hollow Core Concrete Beams with Additional Opening at Different Locations


Abstract
:1. Introduction
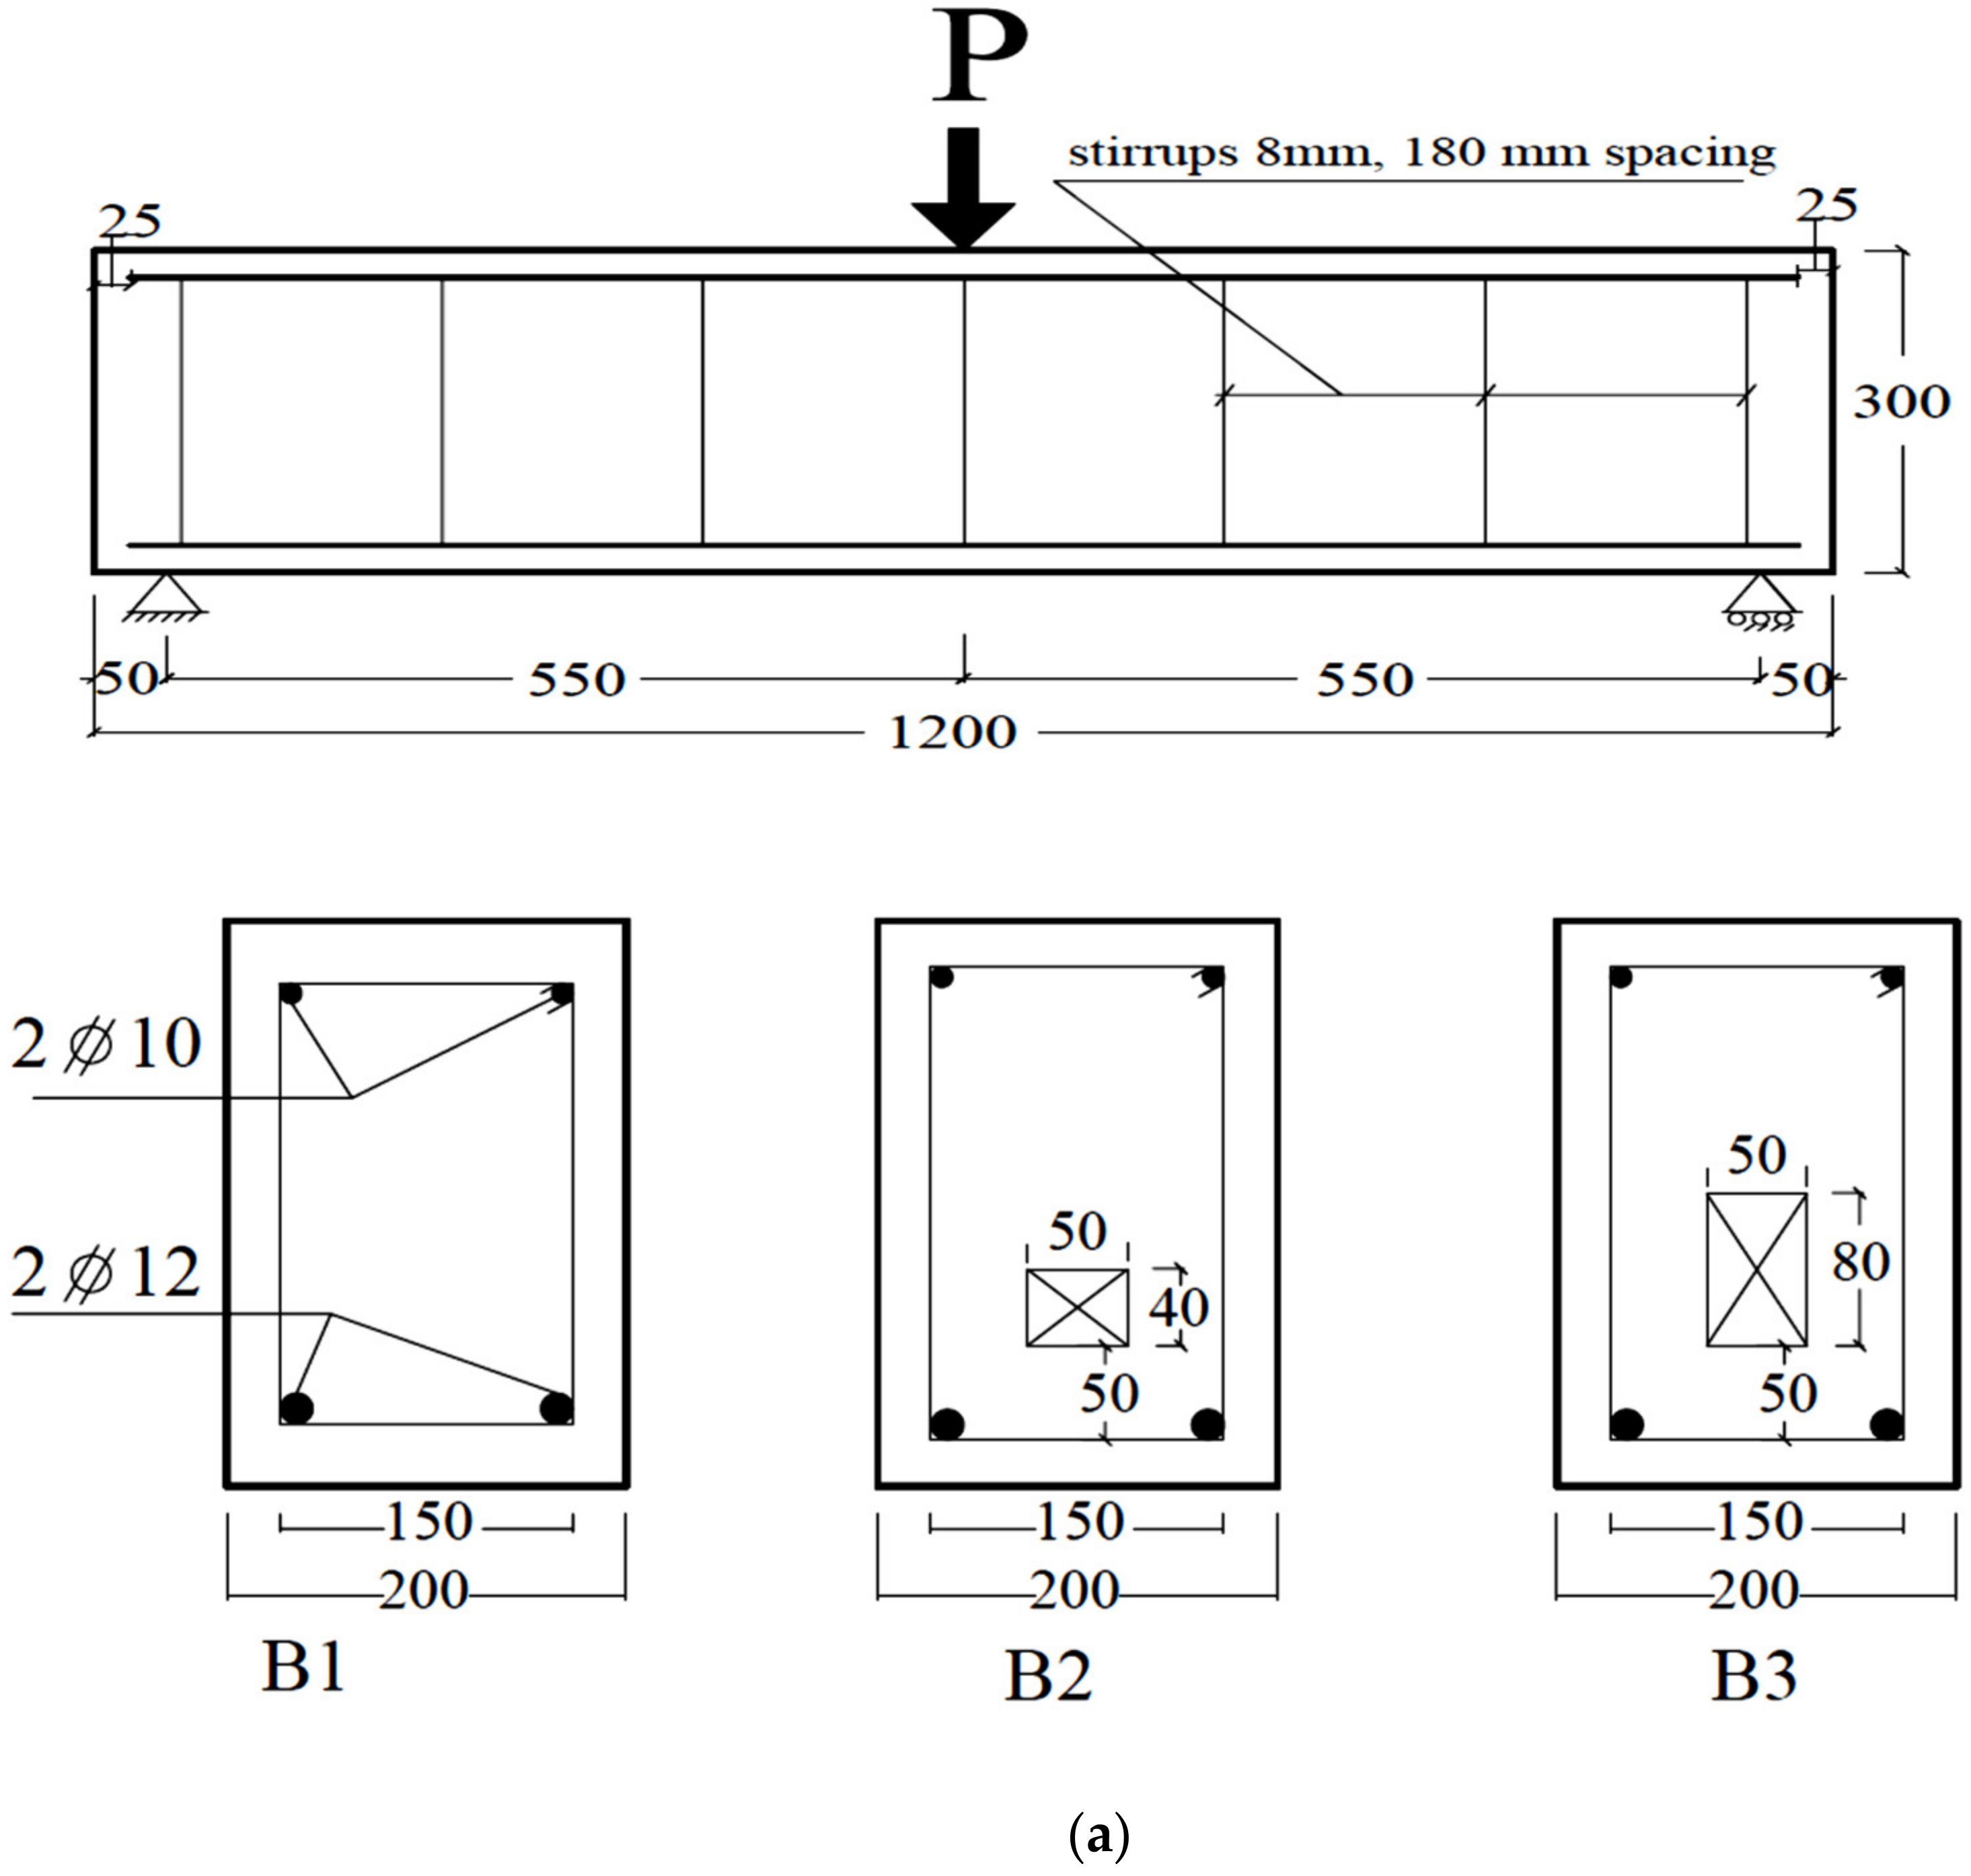
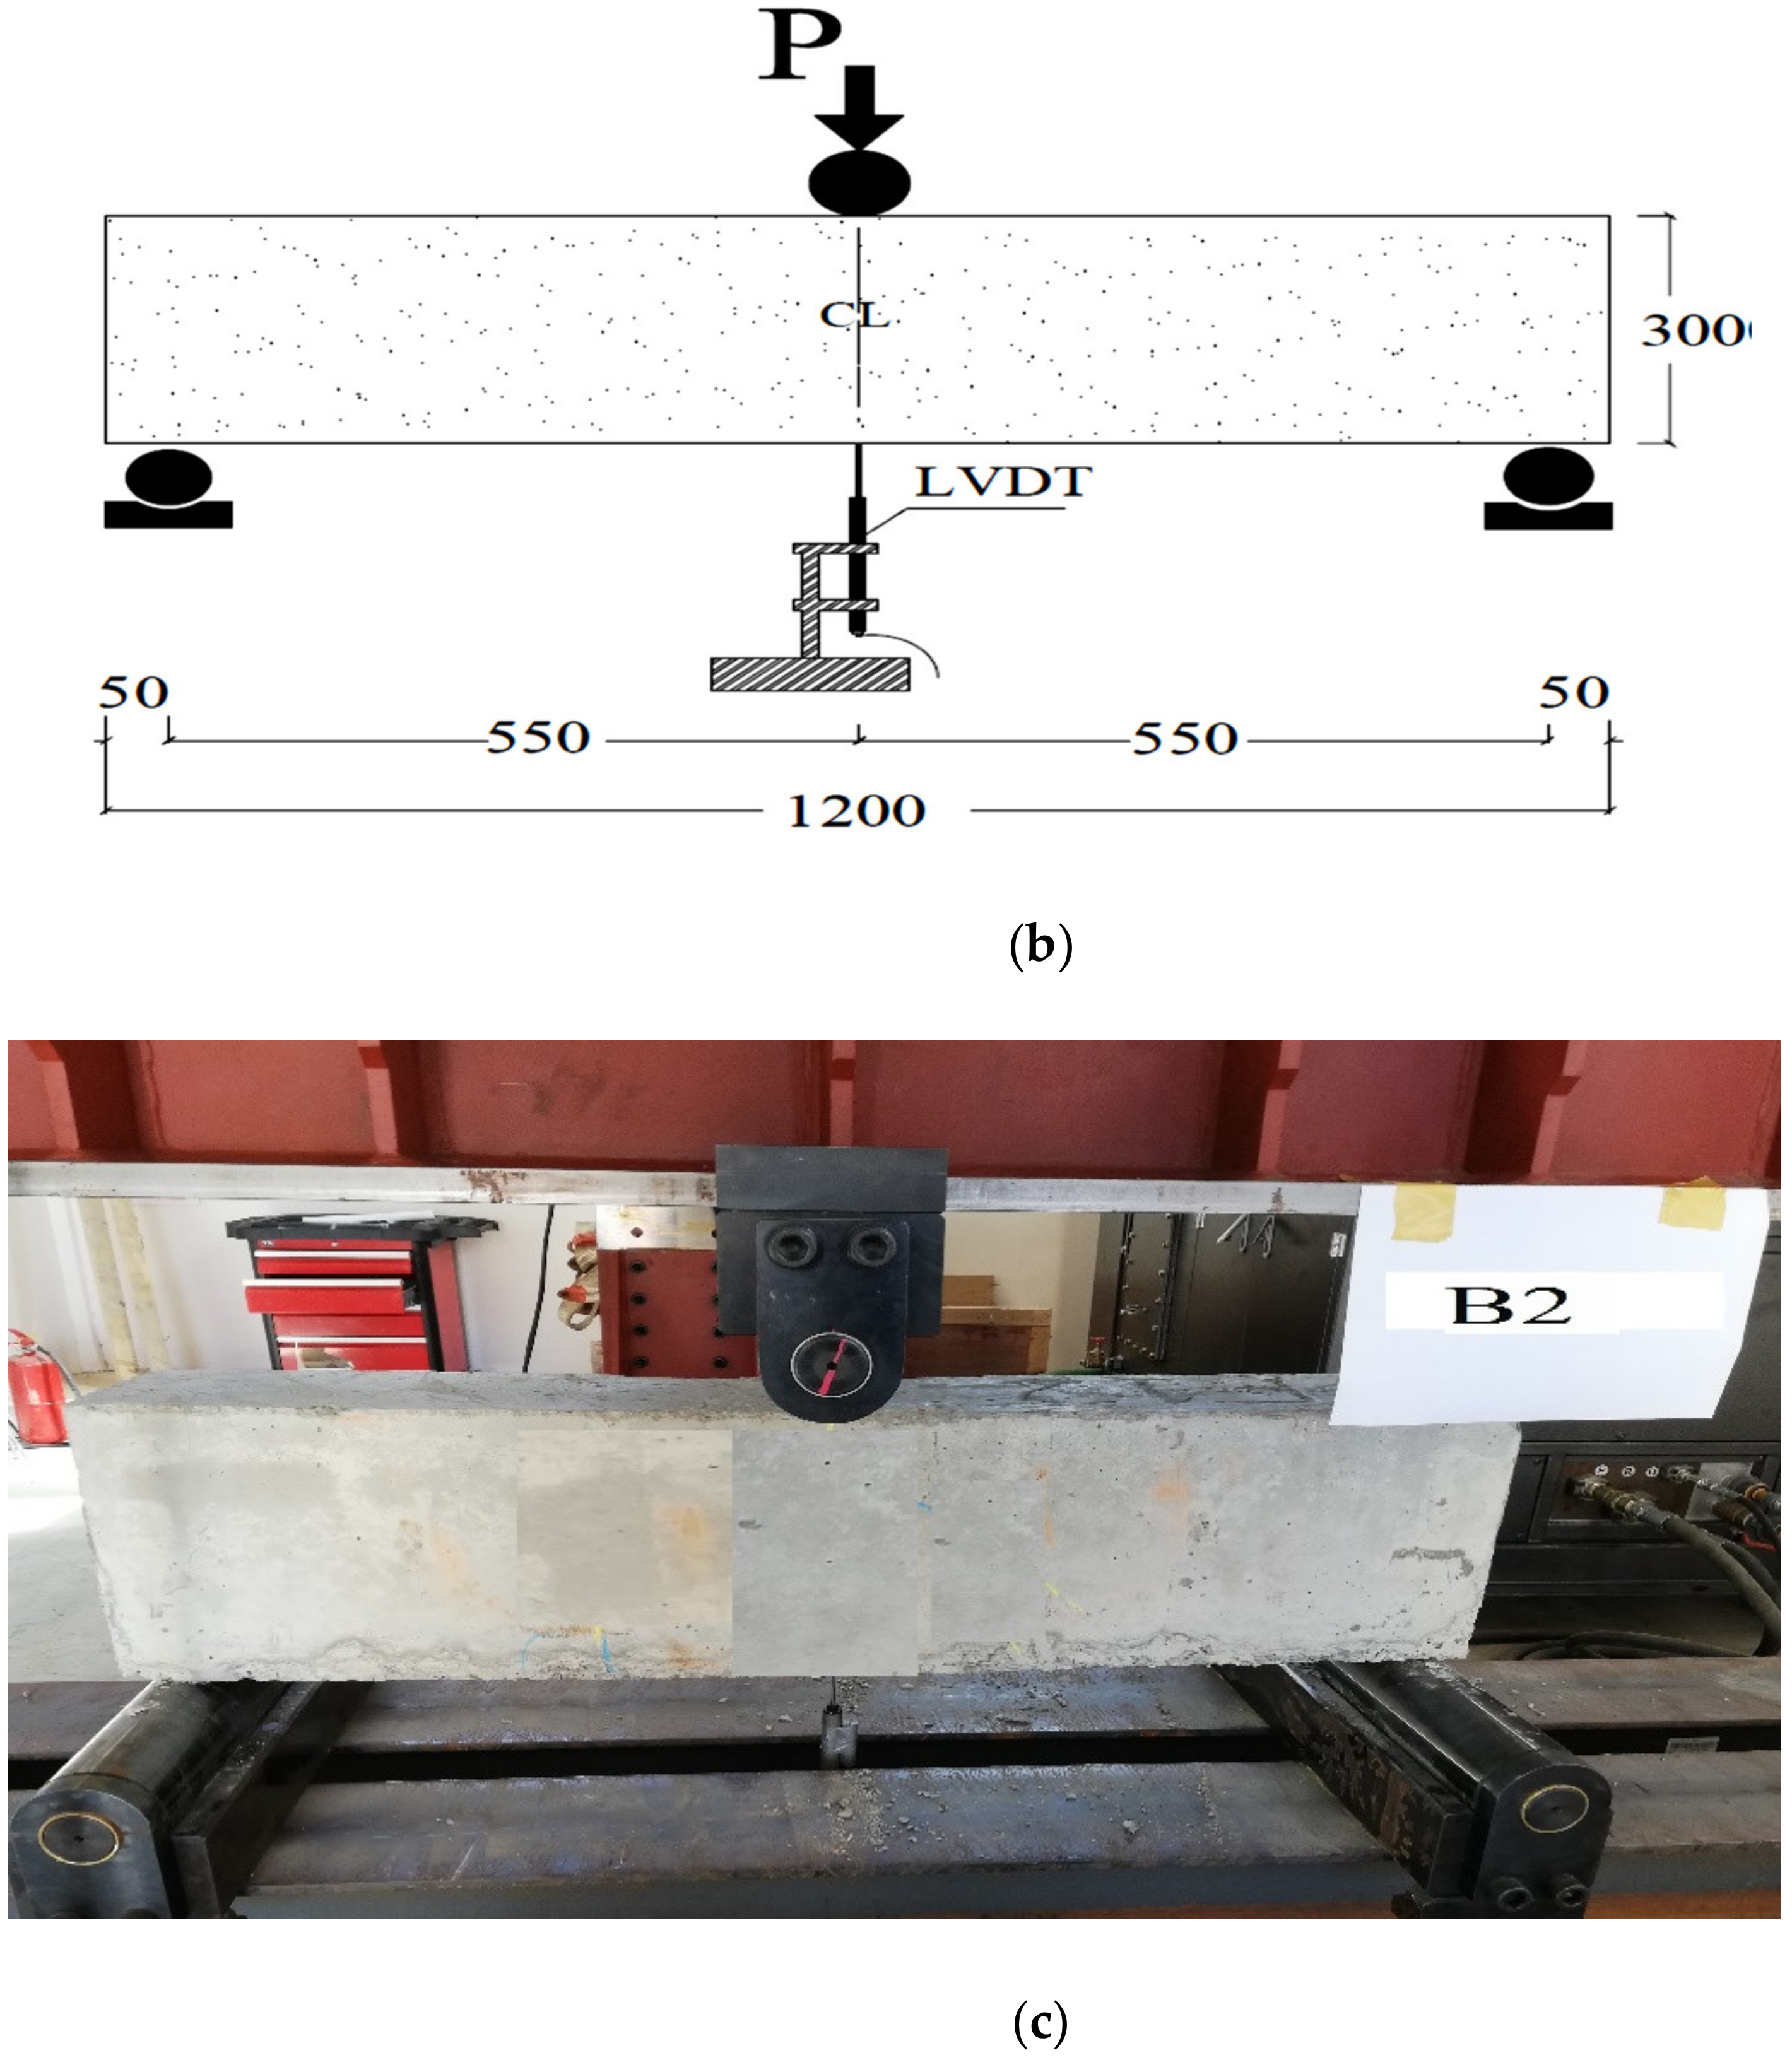
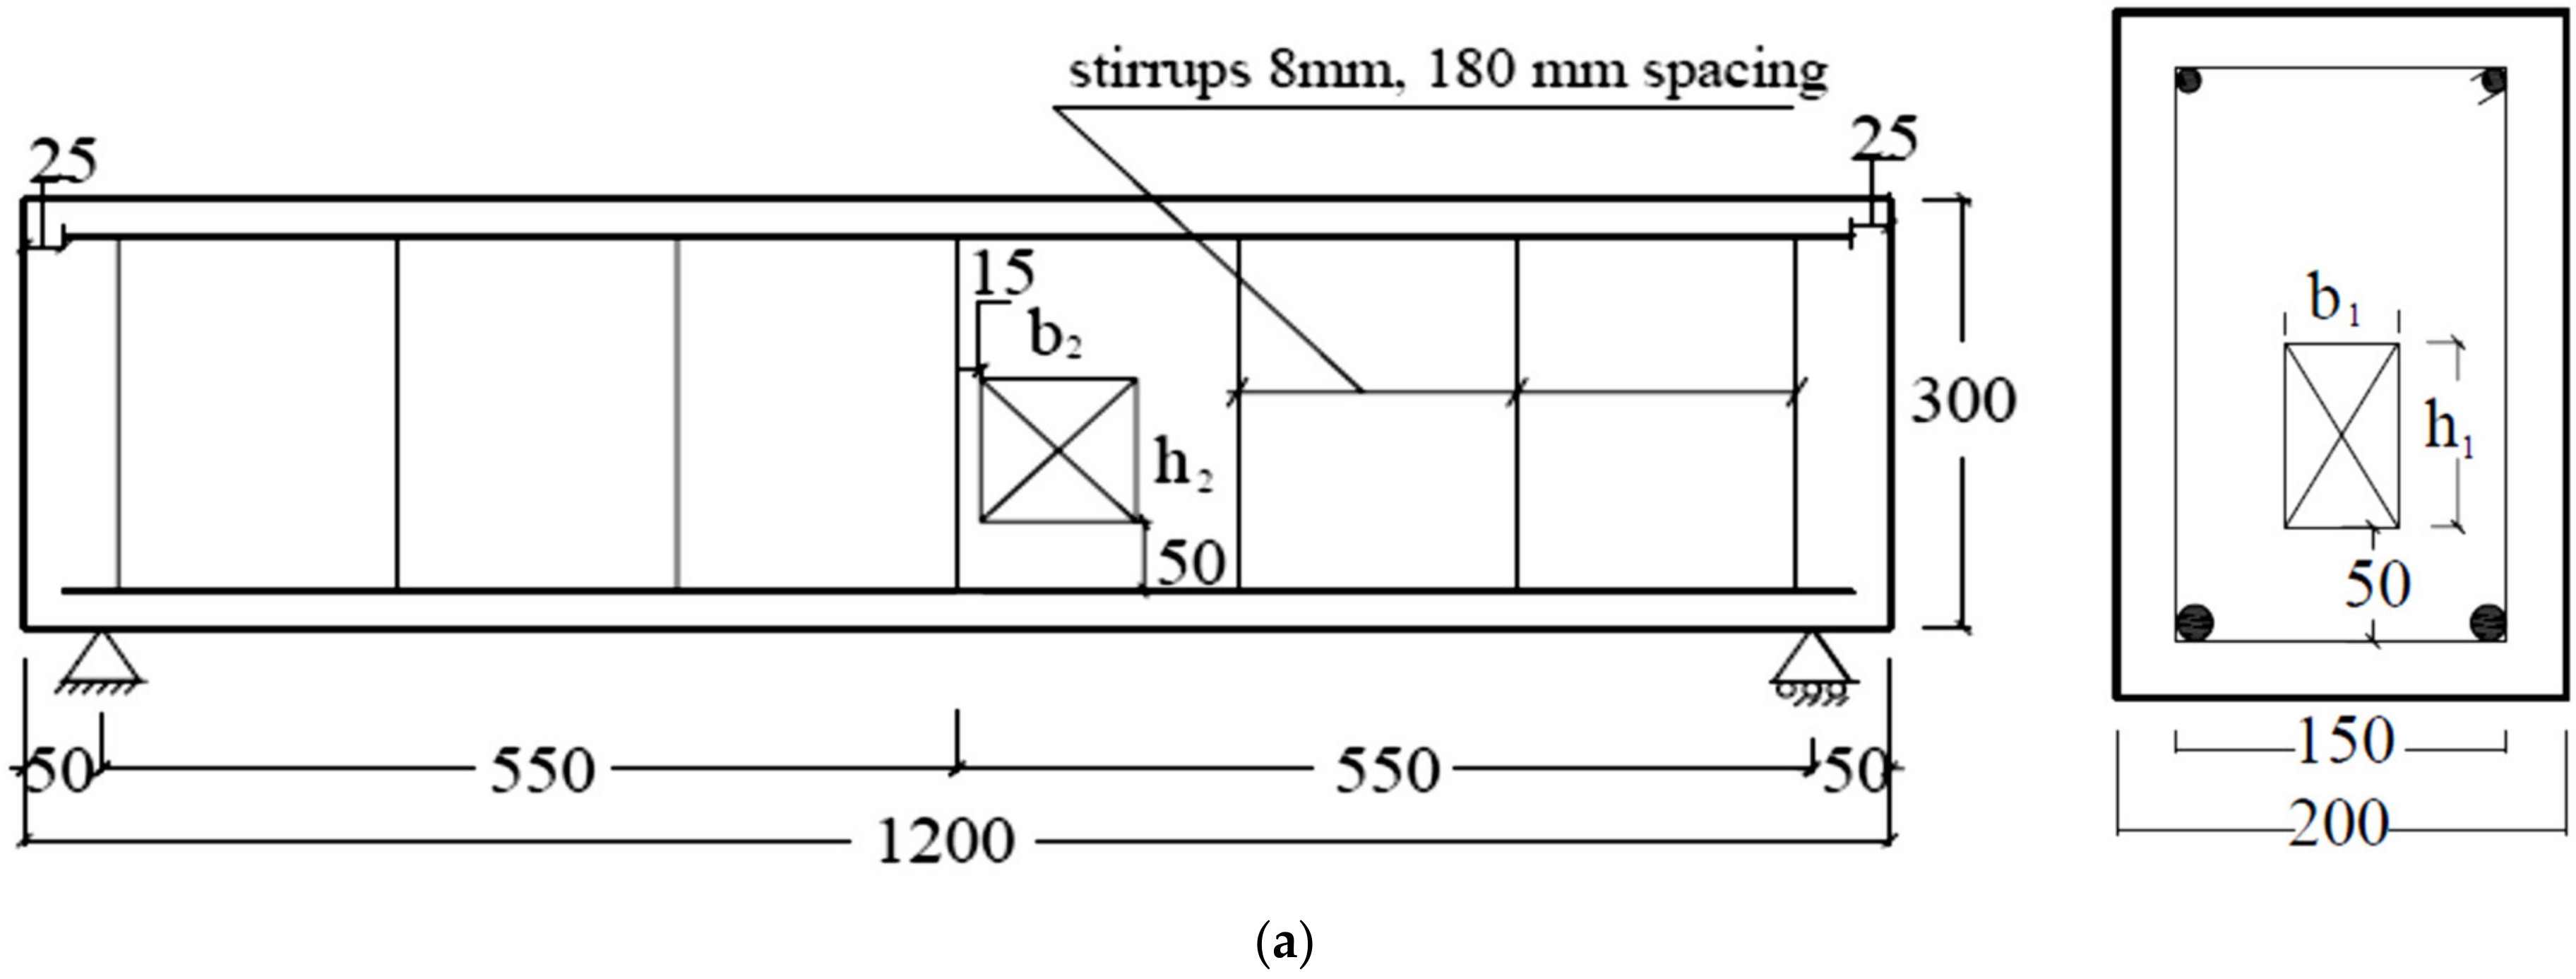
2. Experimental Program
3. Test Results and Discussion
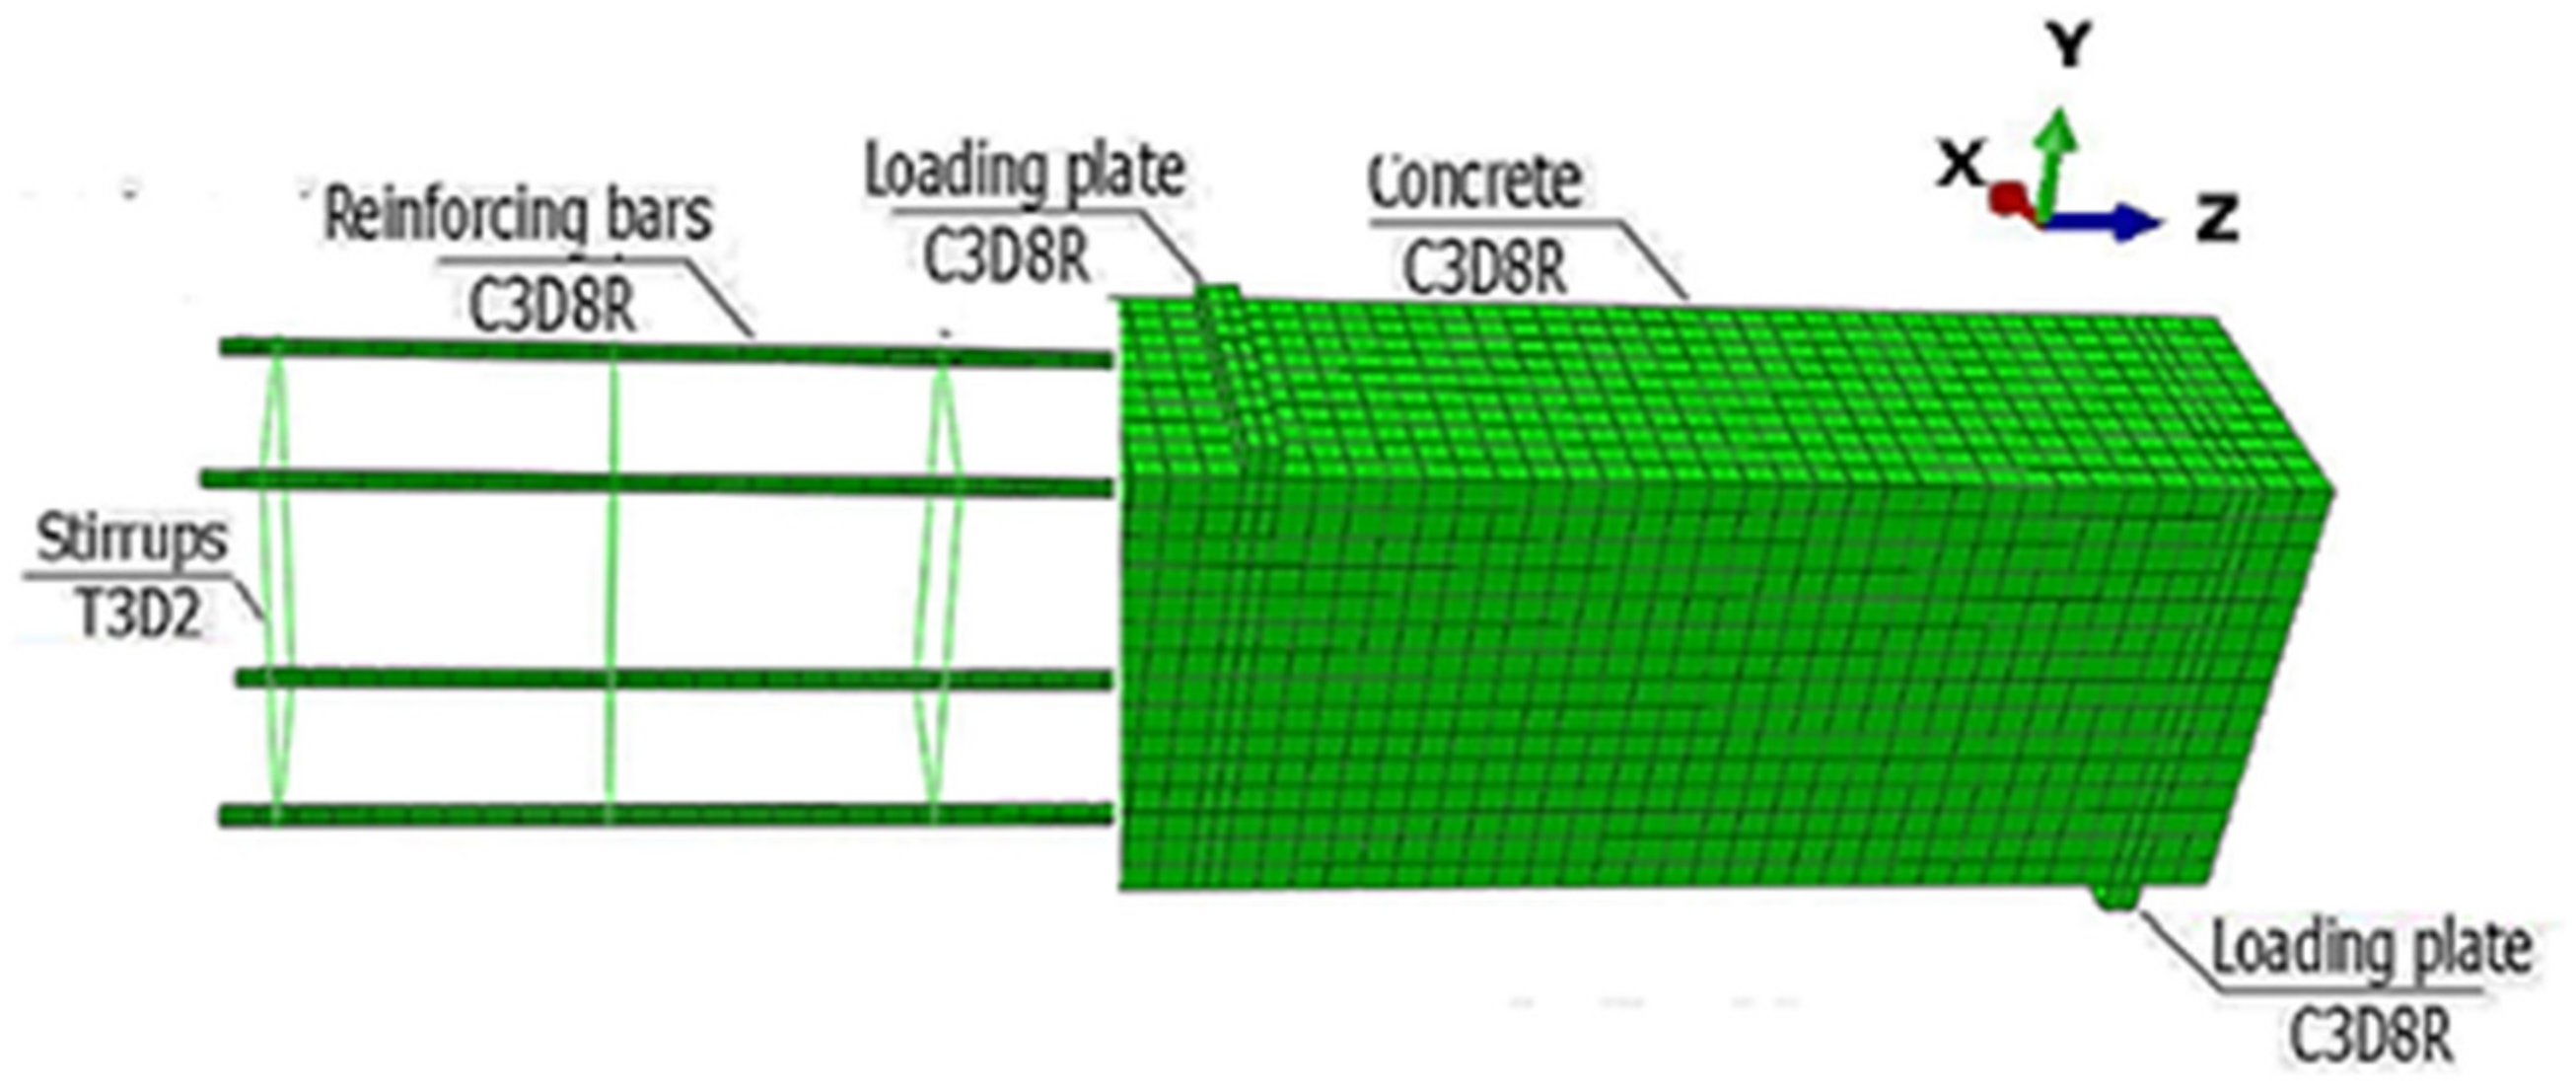
4. Numerical Modelling
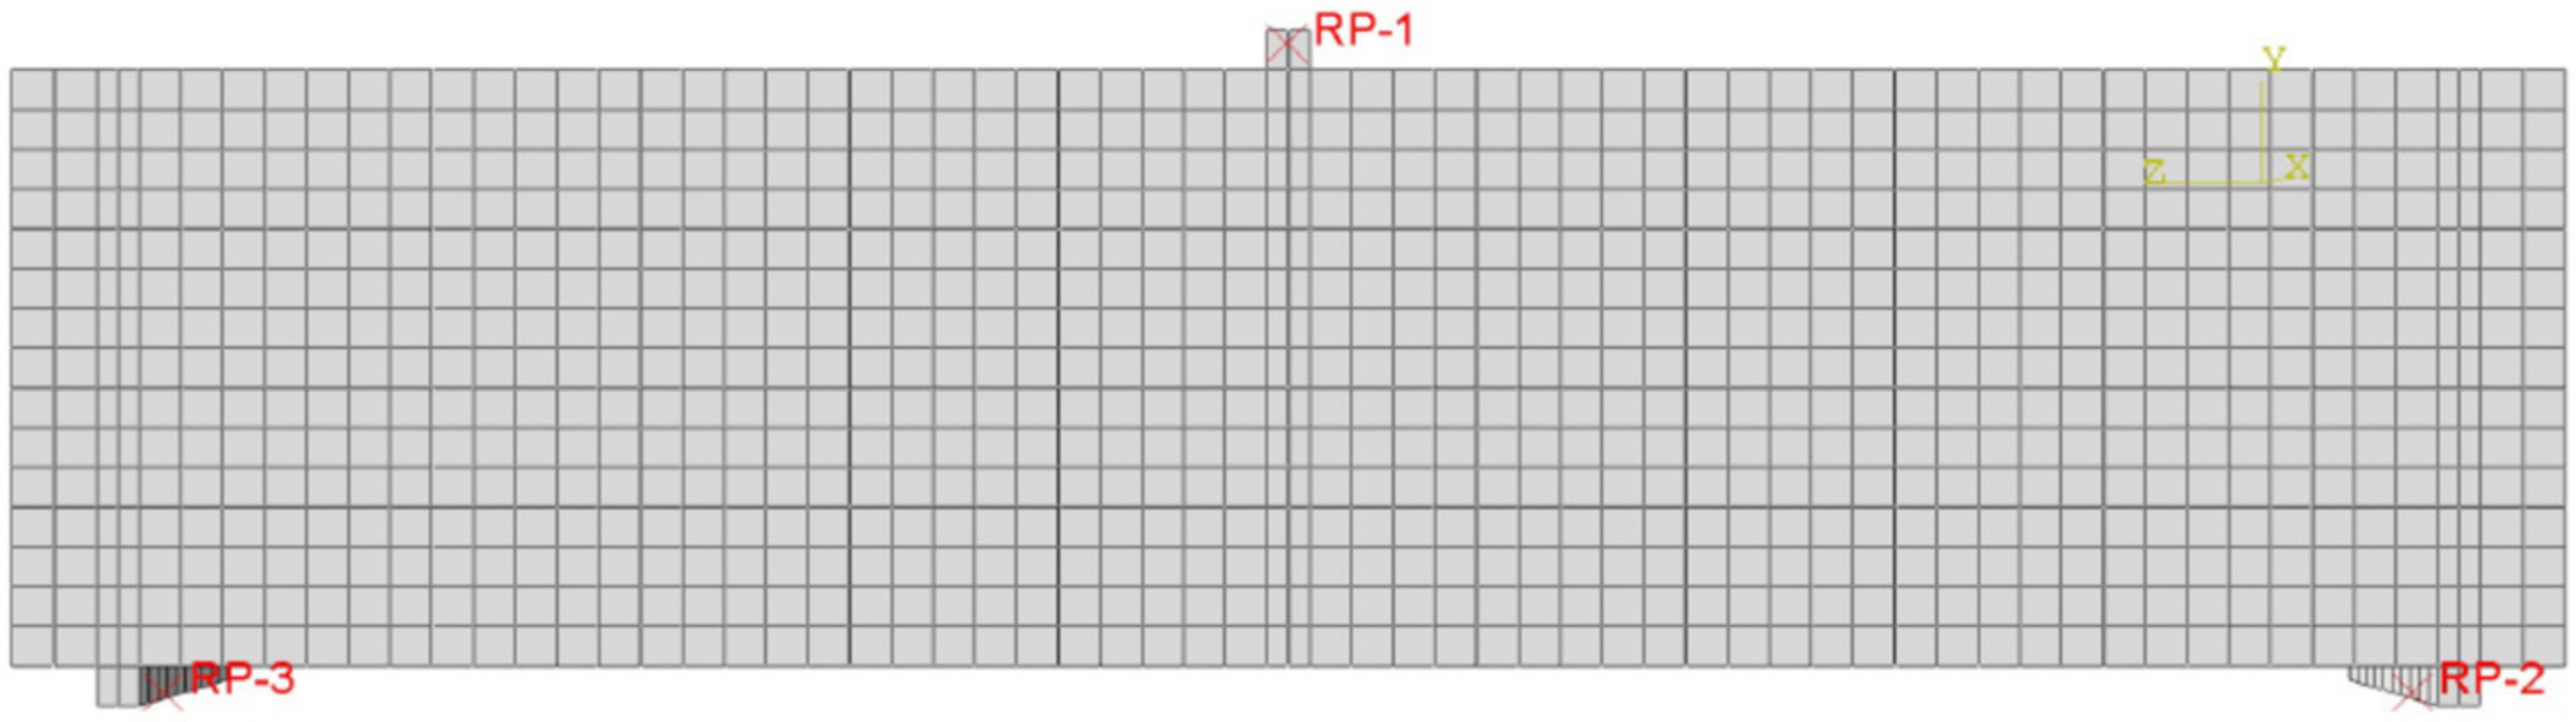
4.1. Finite Element Modelling of RC Beam
4.2. Material Modelling
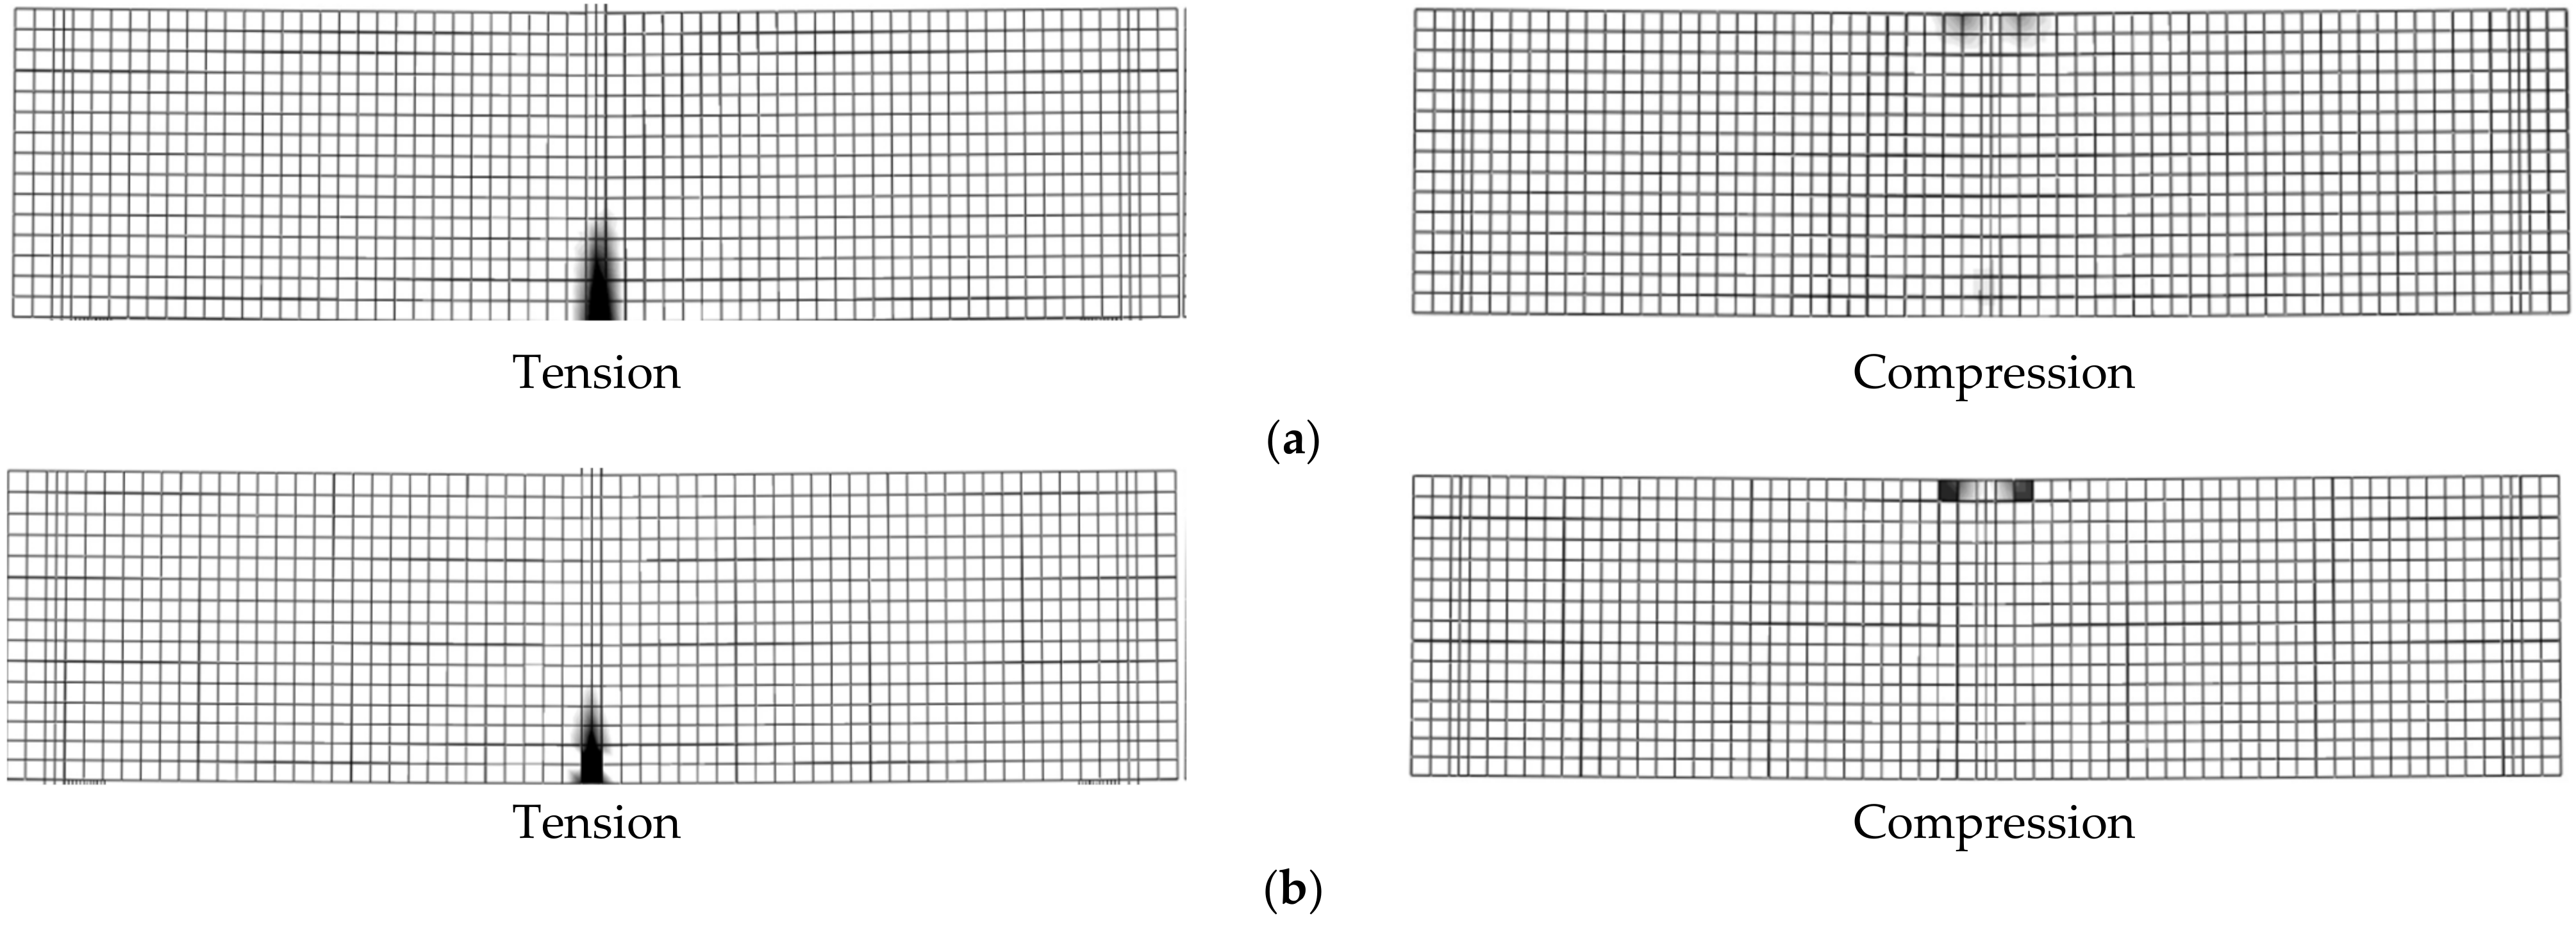
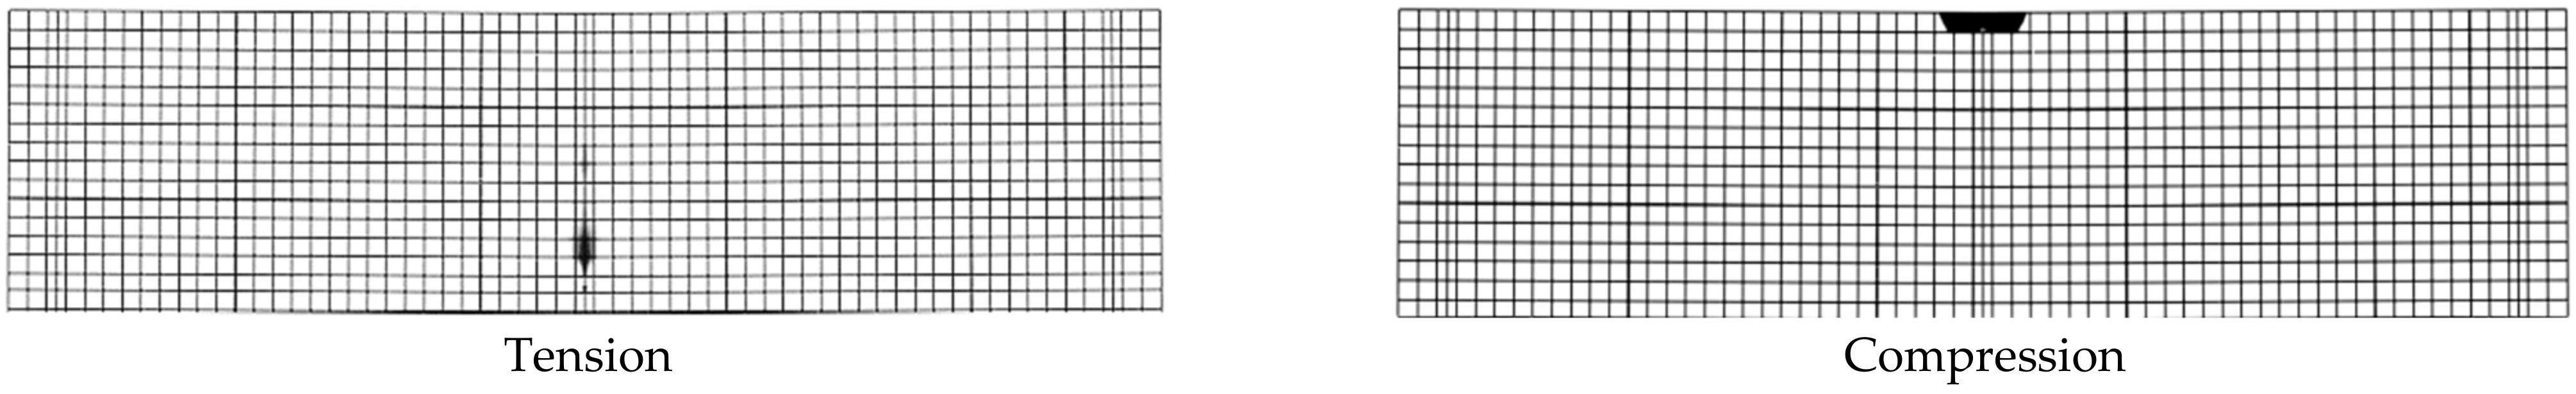
4.3. Validation of the FE Model
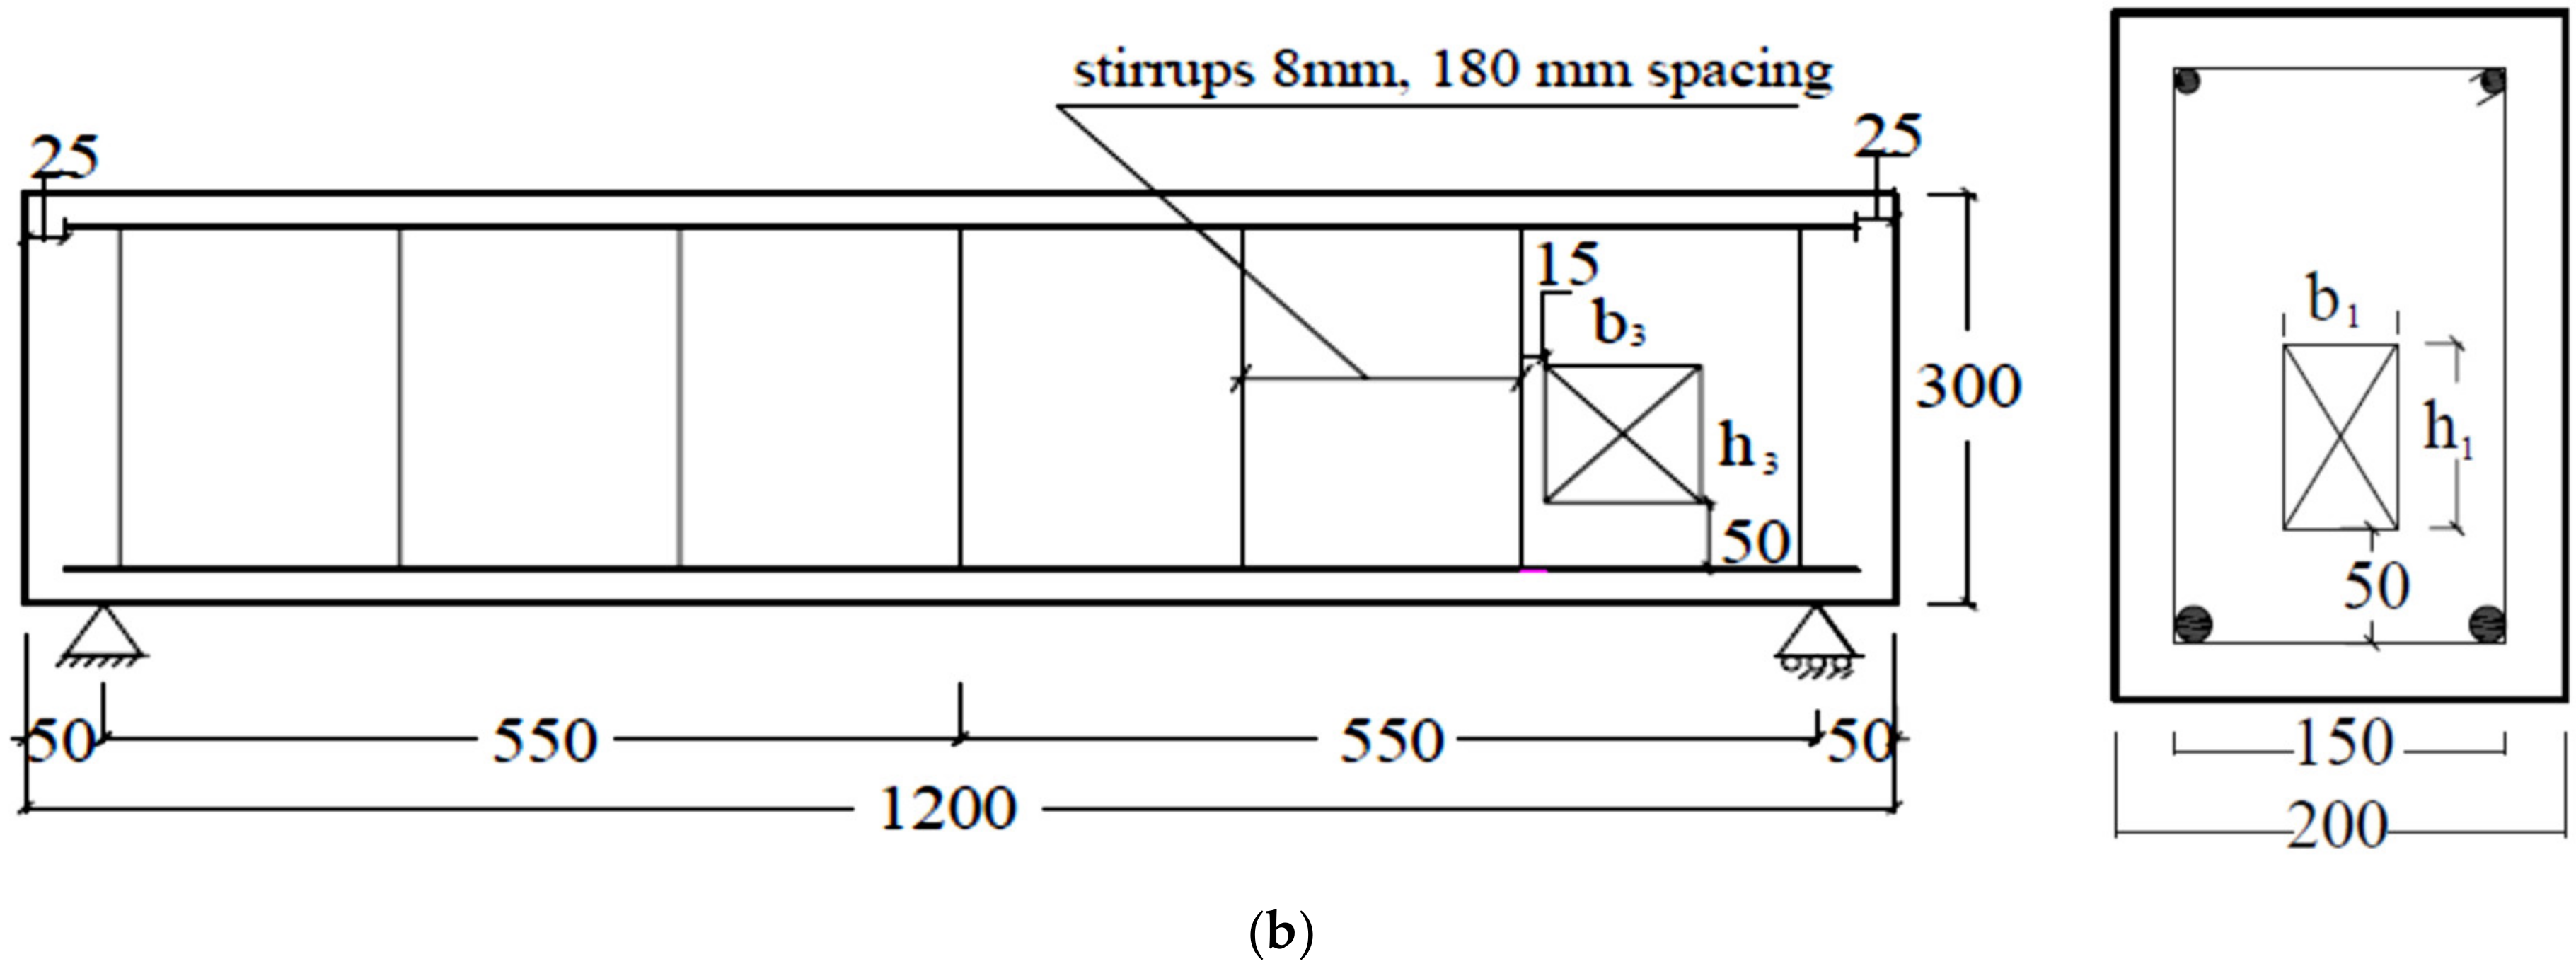
4.4. Parametric Study
5. Results and Discussion of the Parametric Study
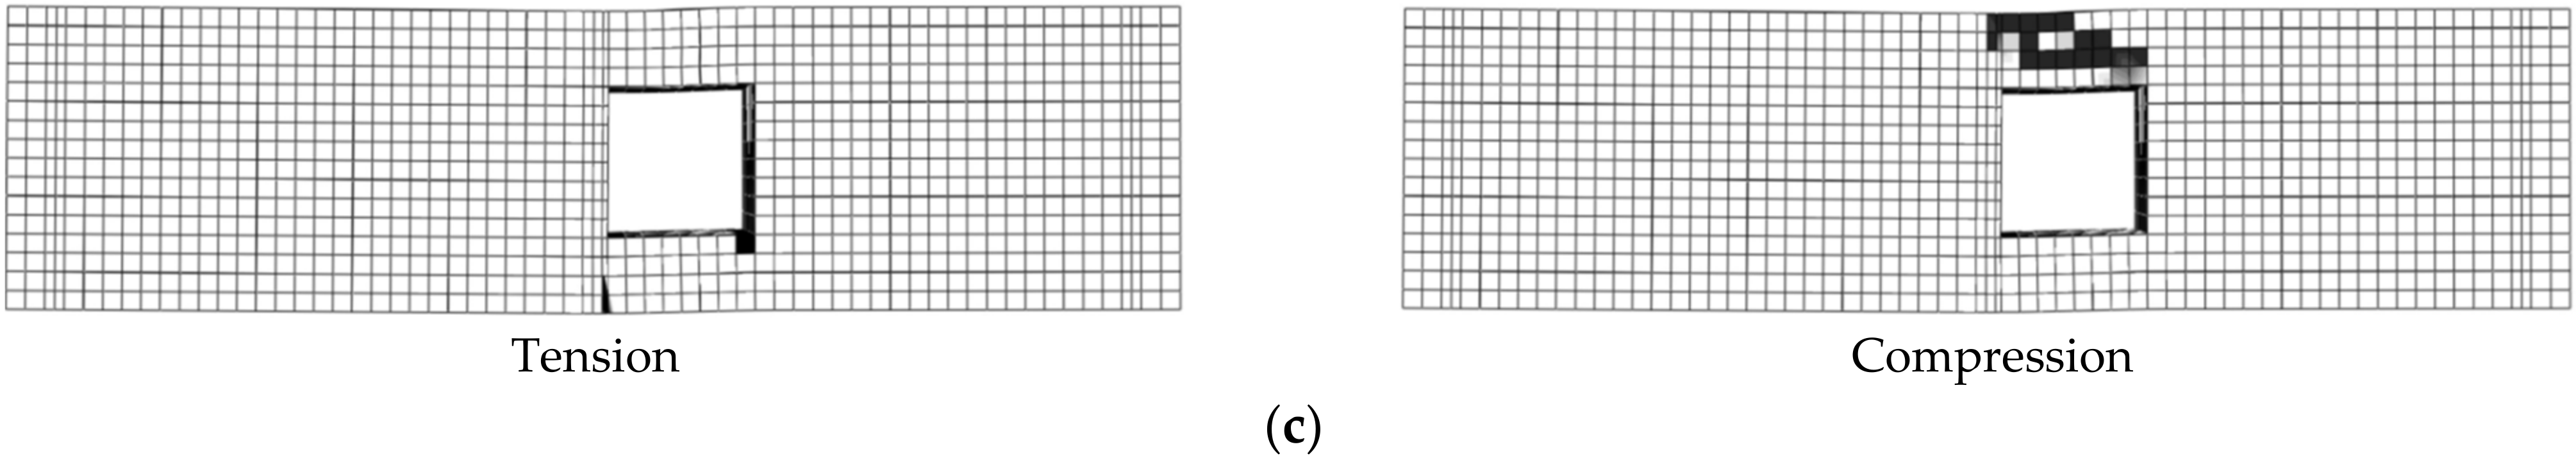
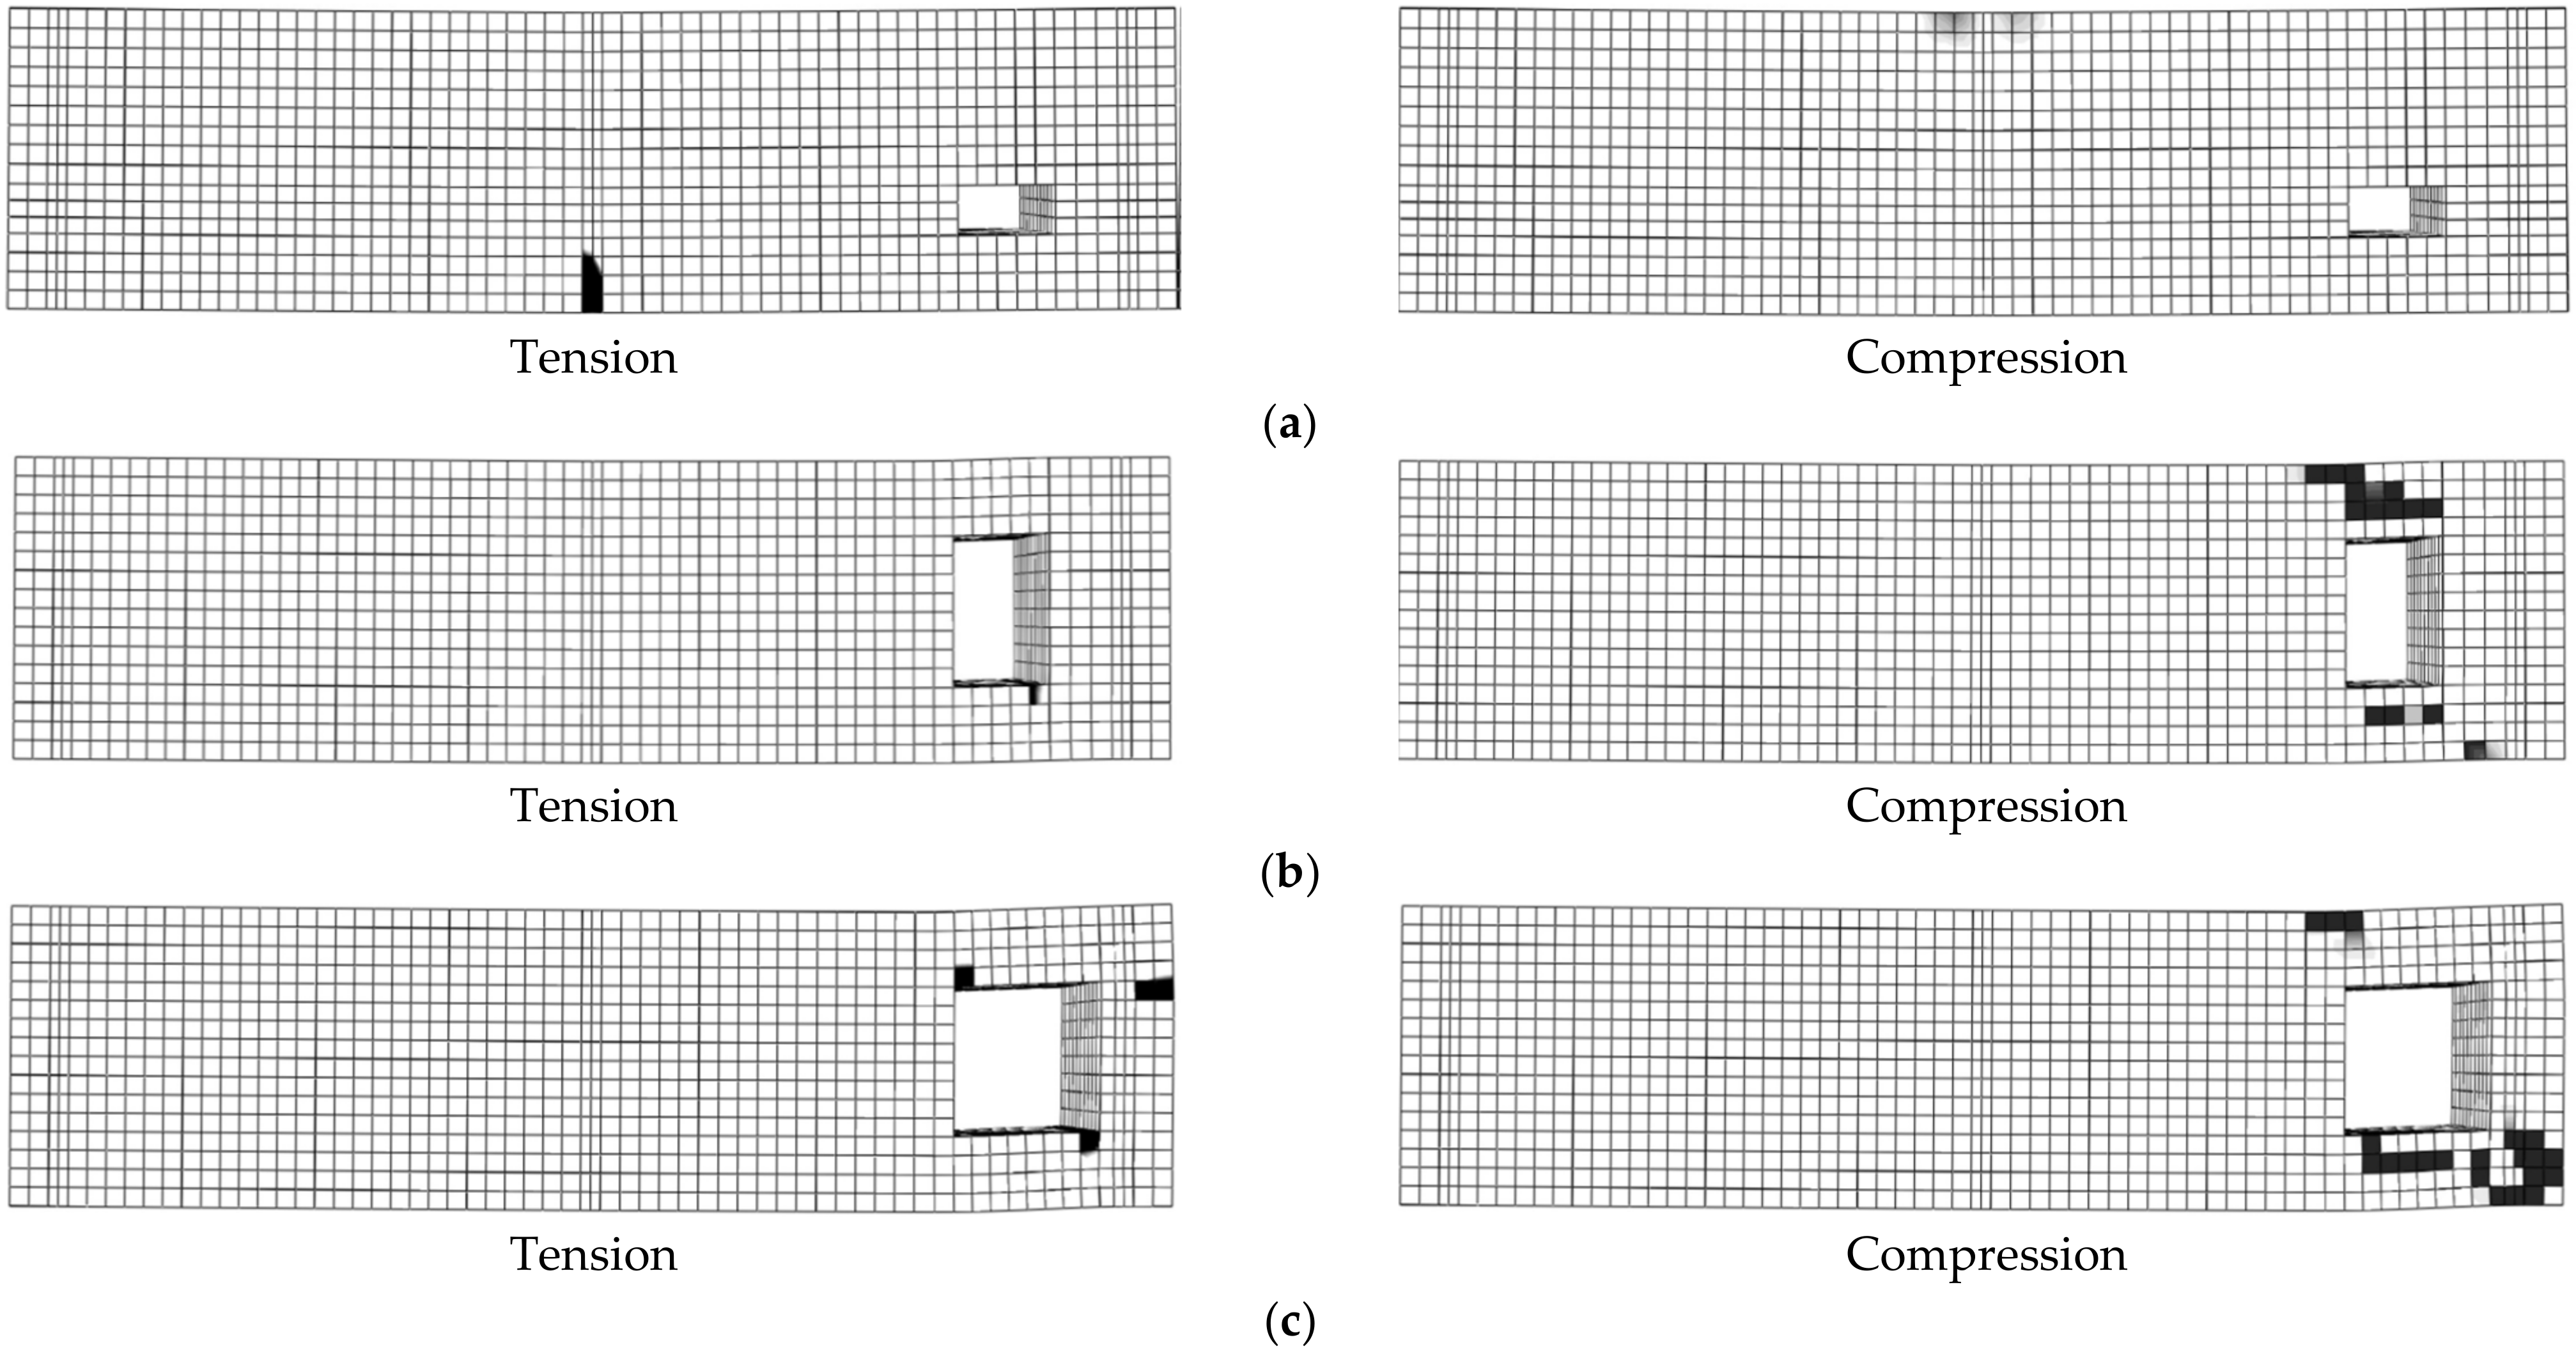
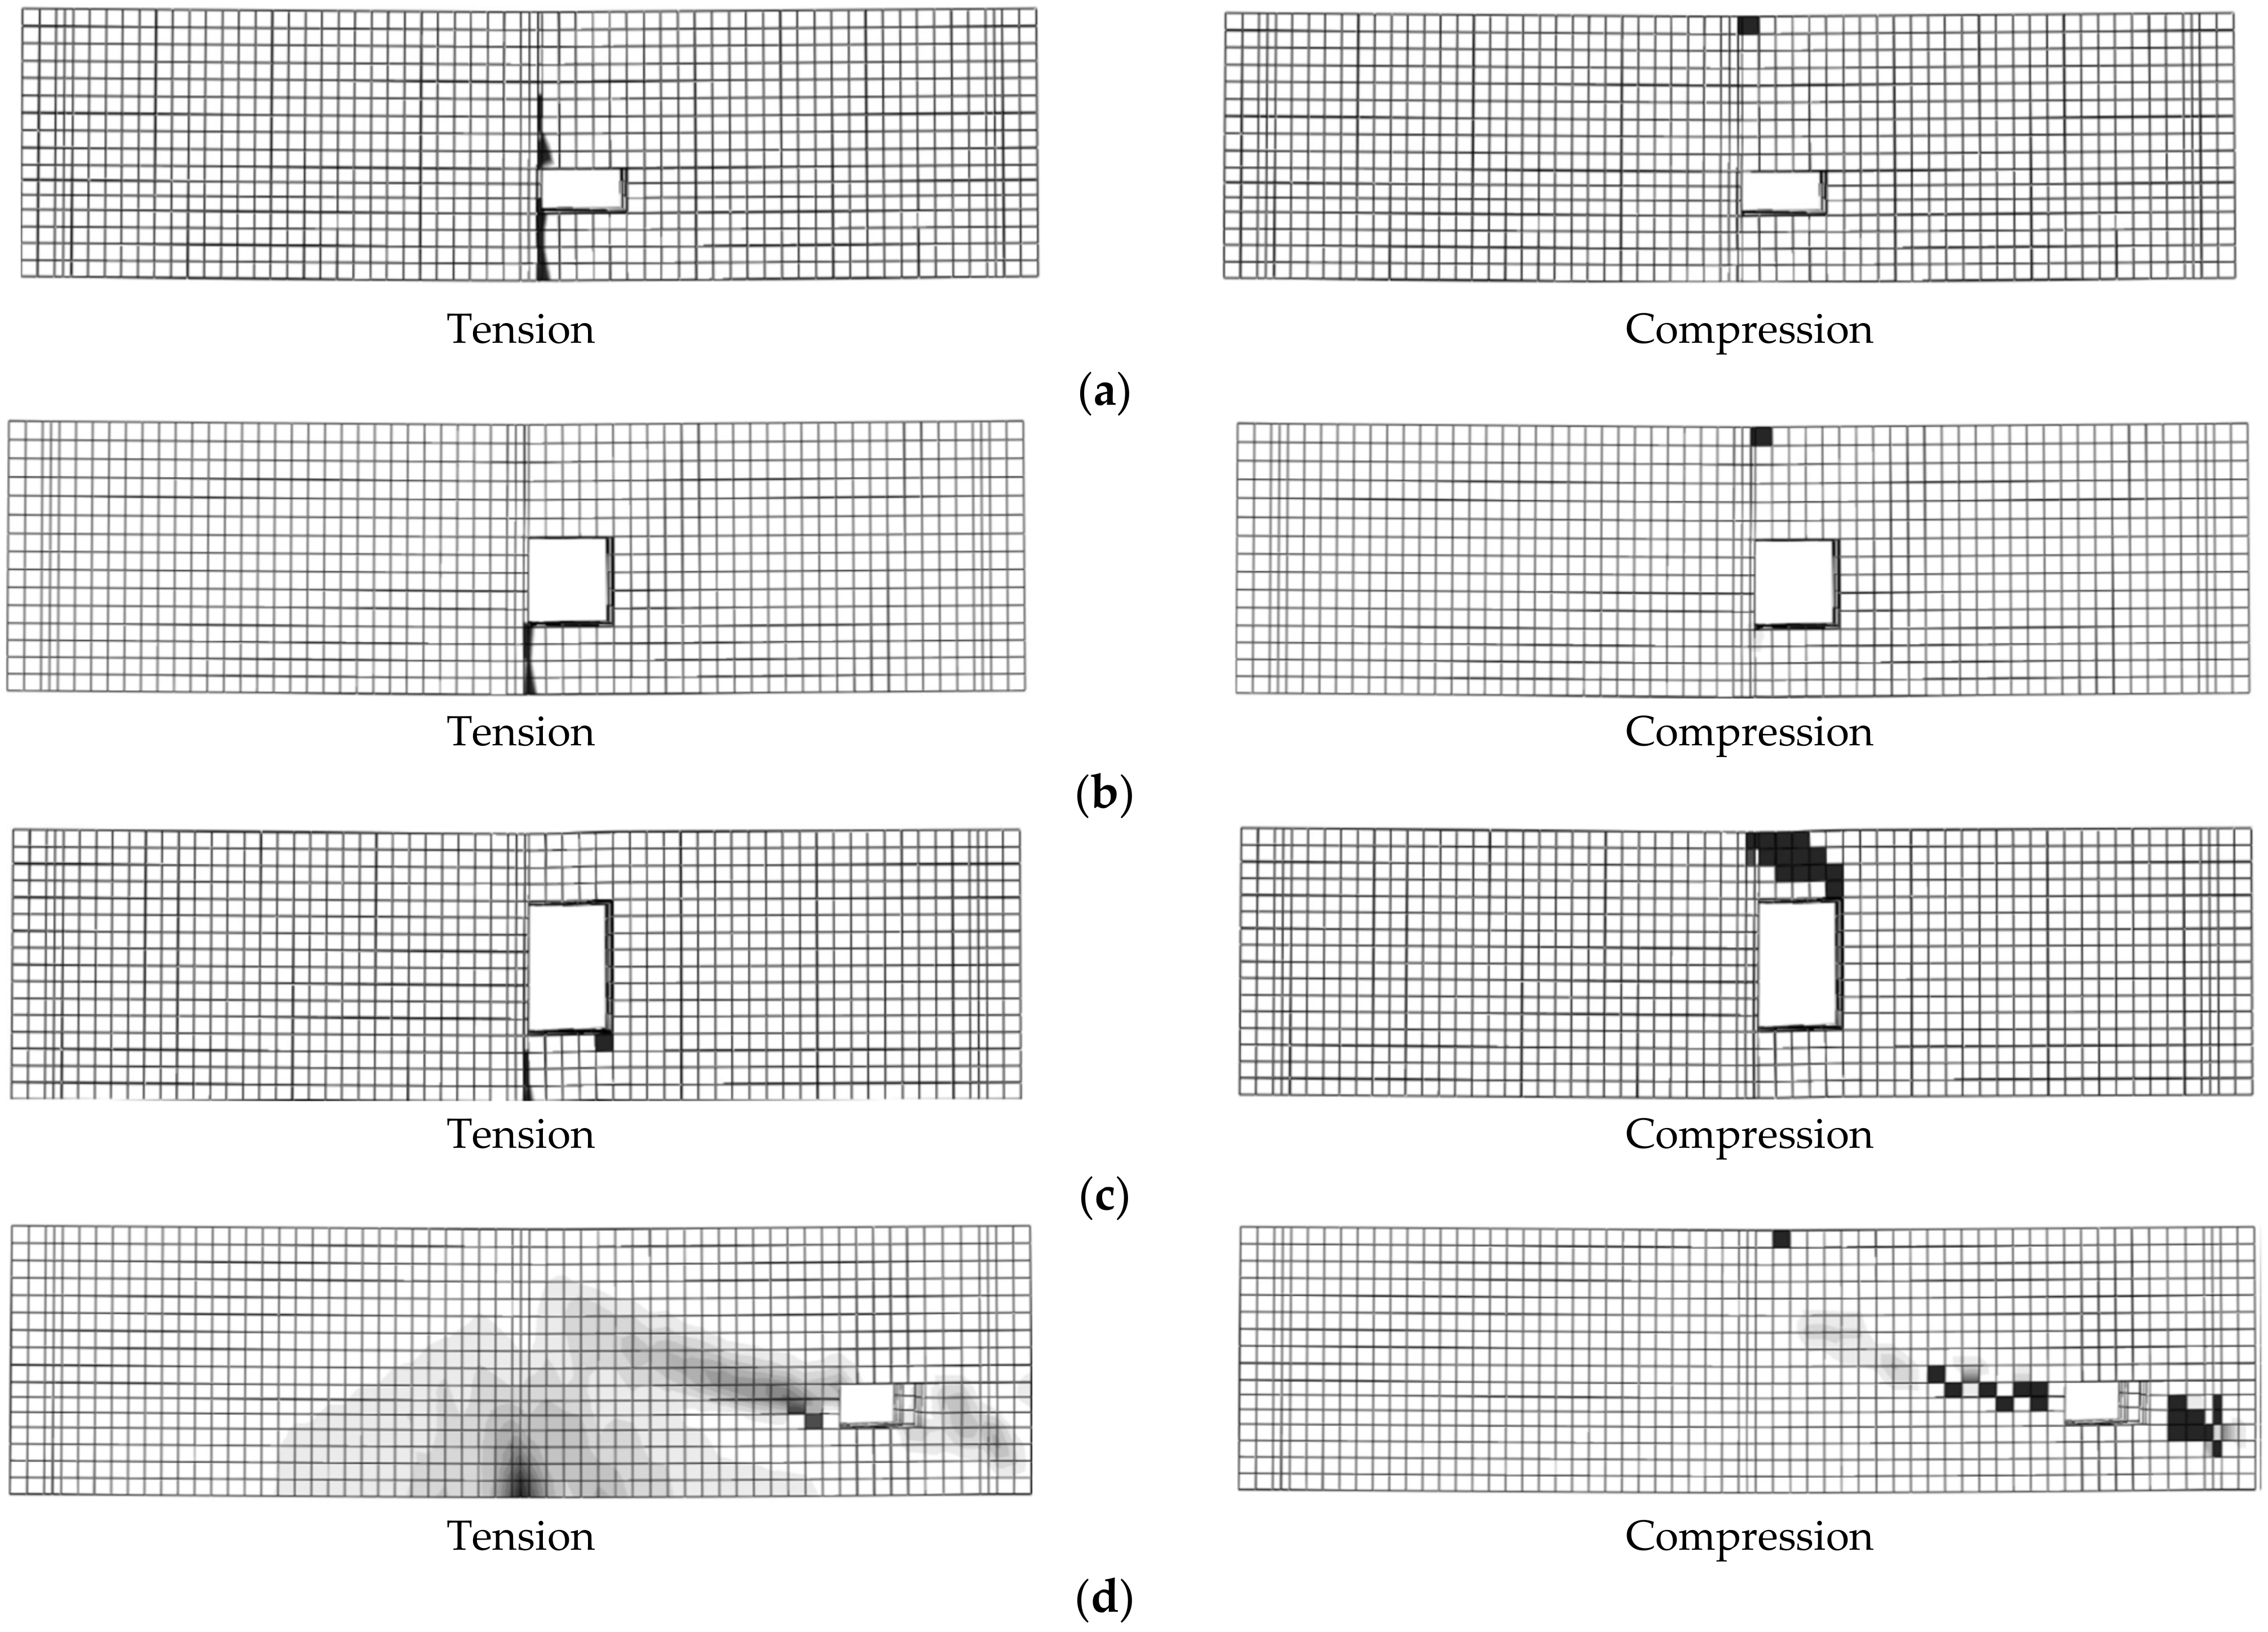
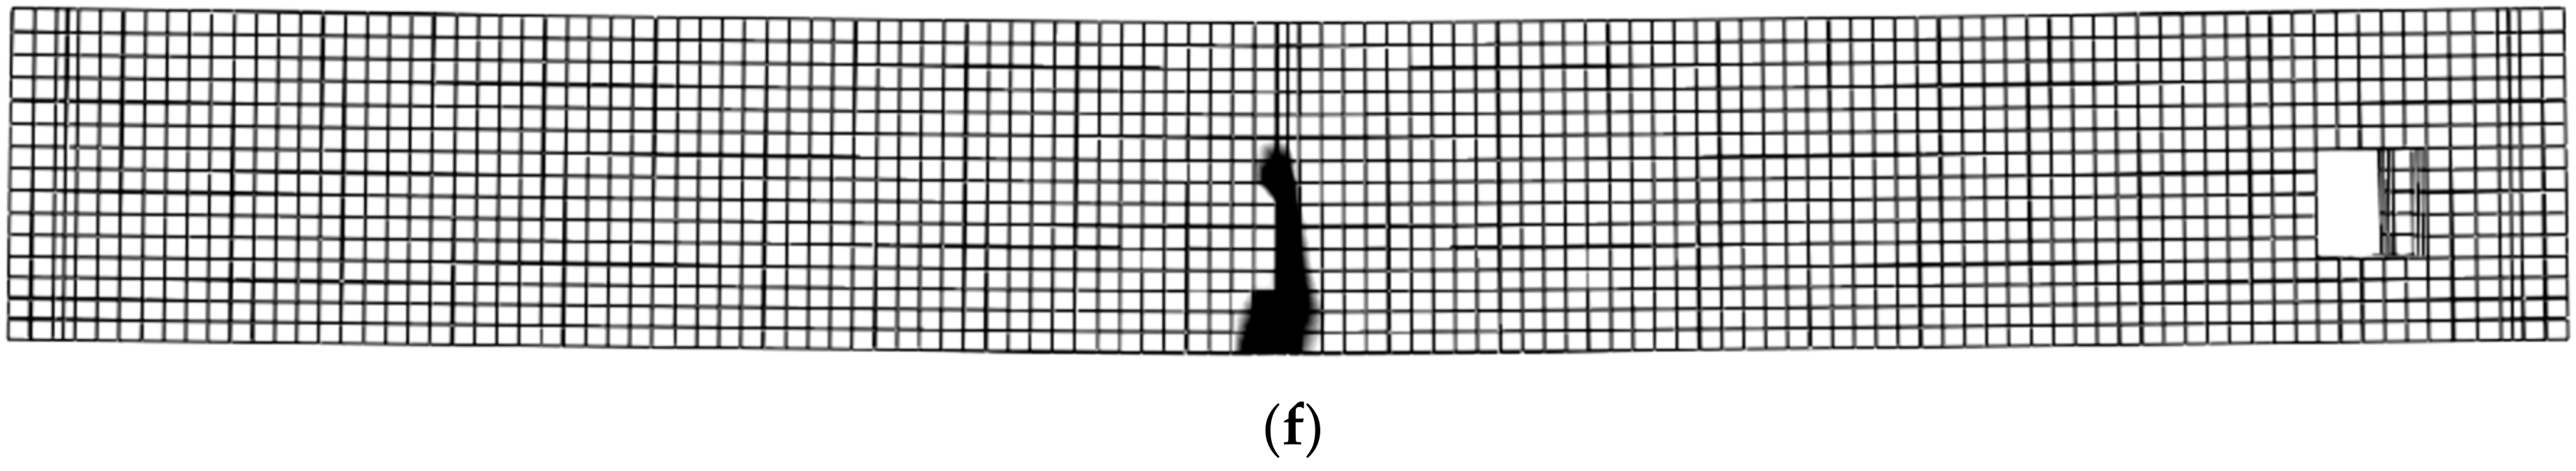
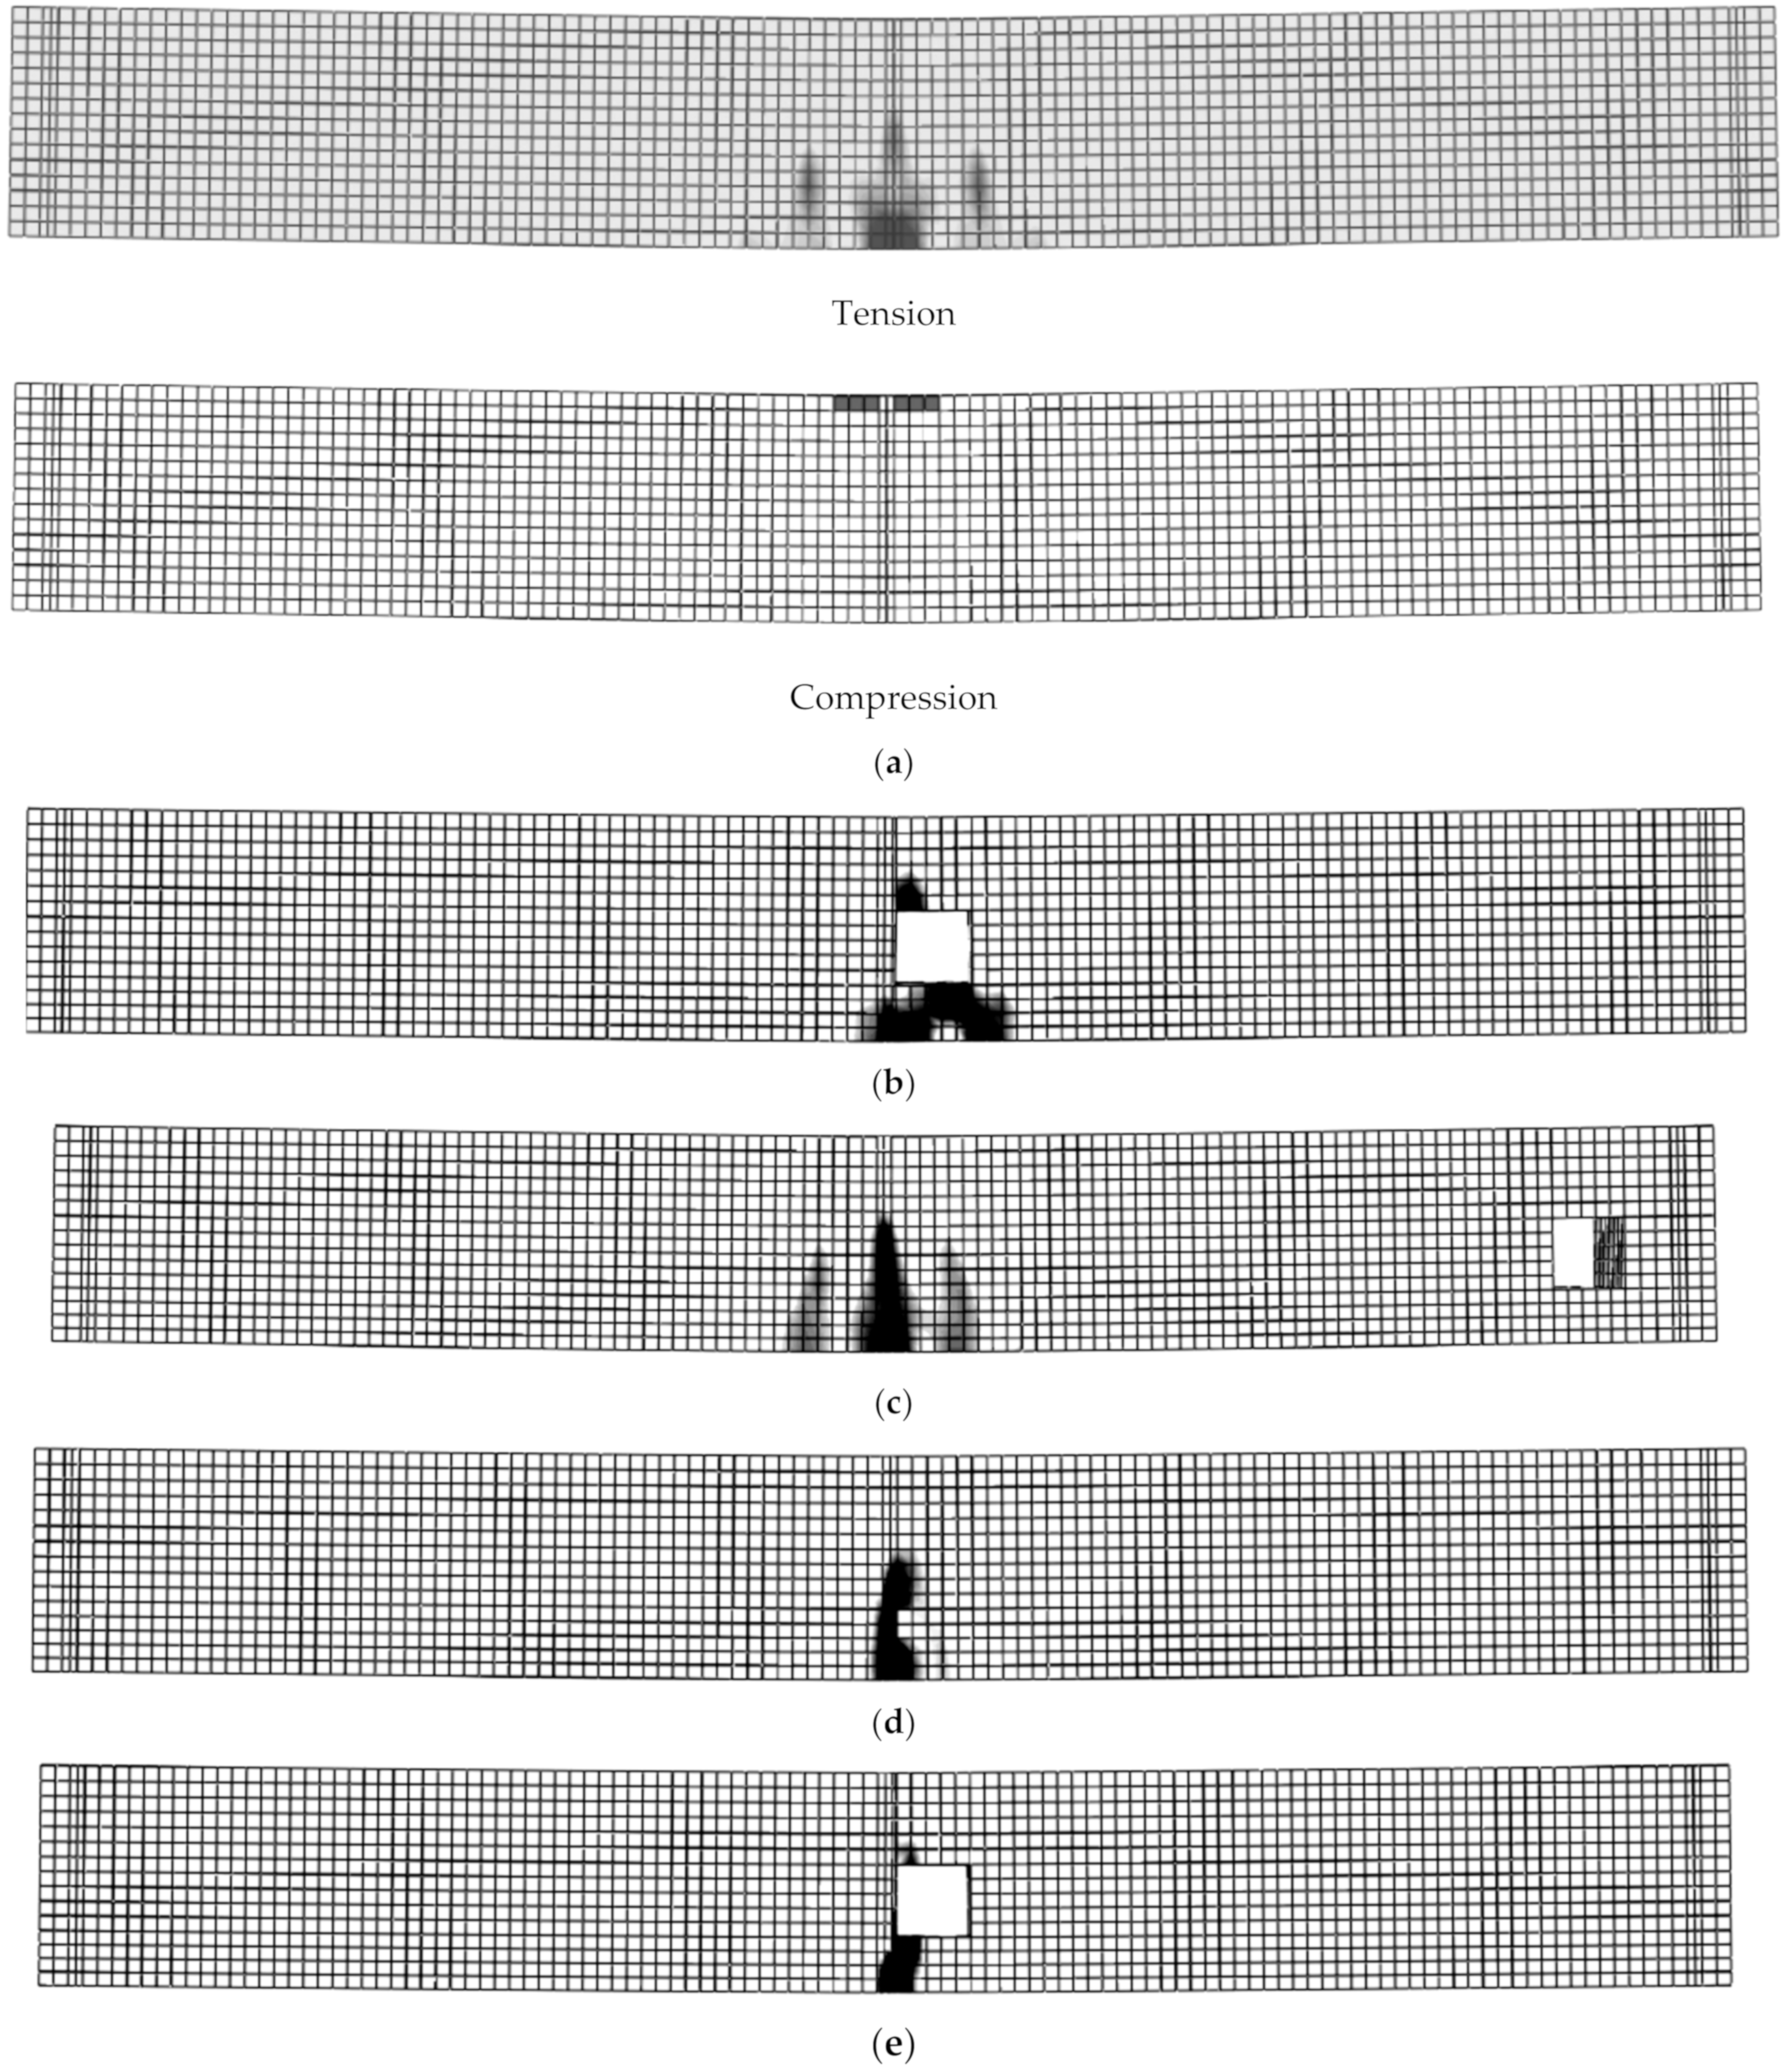
5.1. Failure Modes and Load Capacities
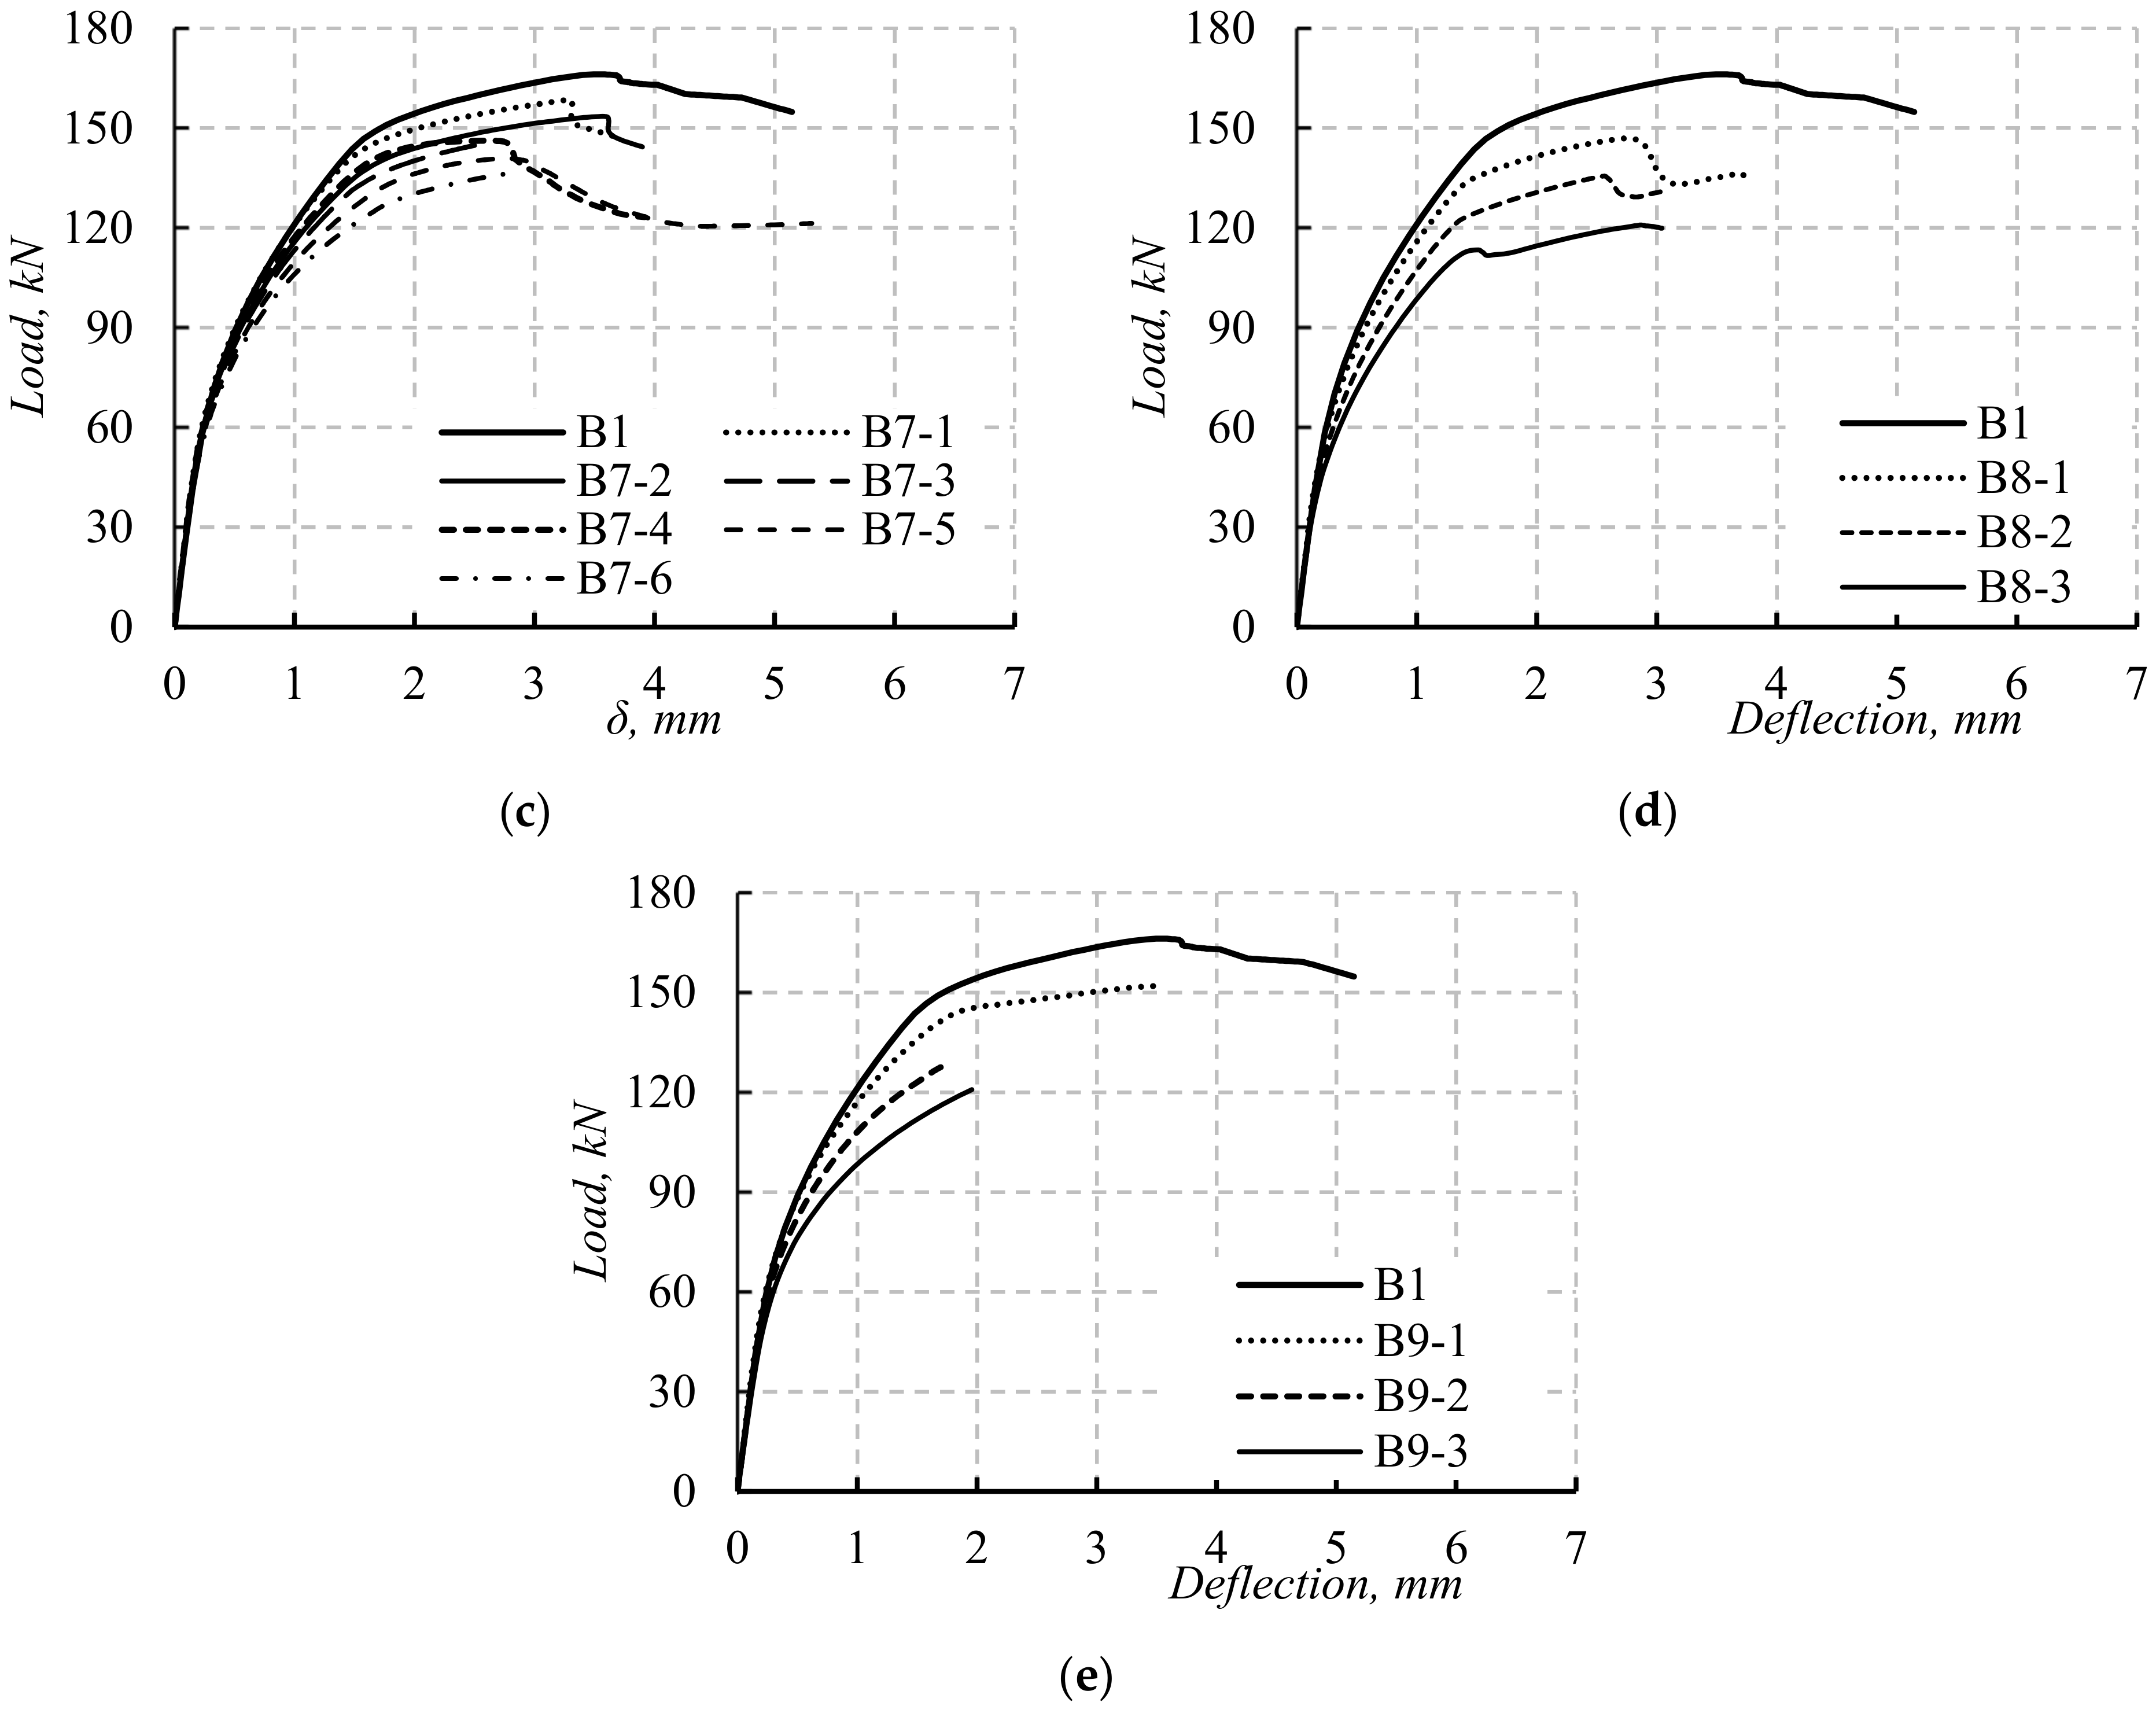
5.2. The Load–Deflection Curves
5.3. Discussion
6. Development of Theoretical Models
6.1. Load–Deflection Relationships
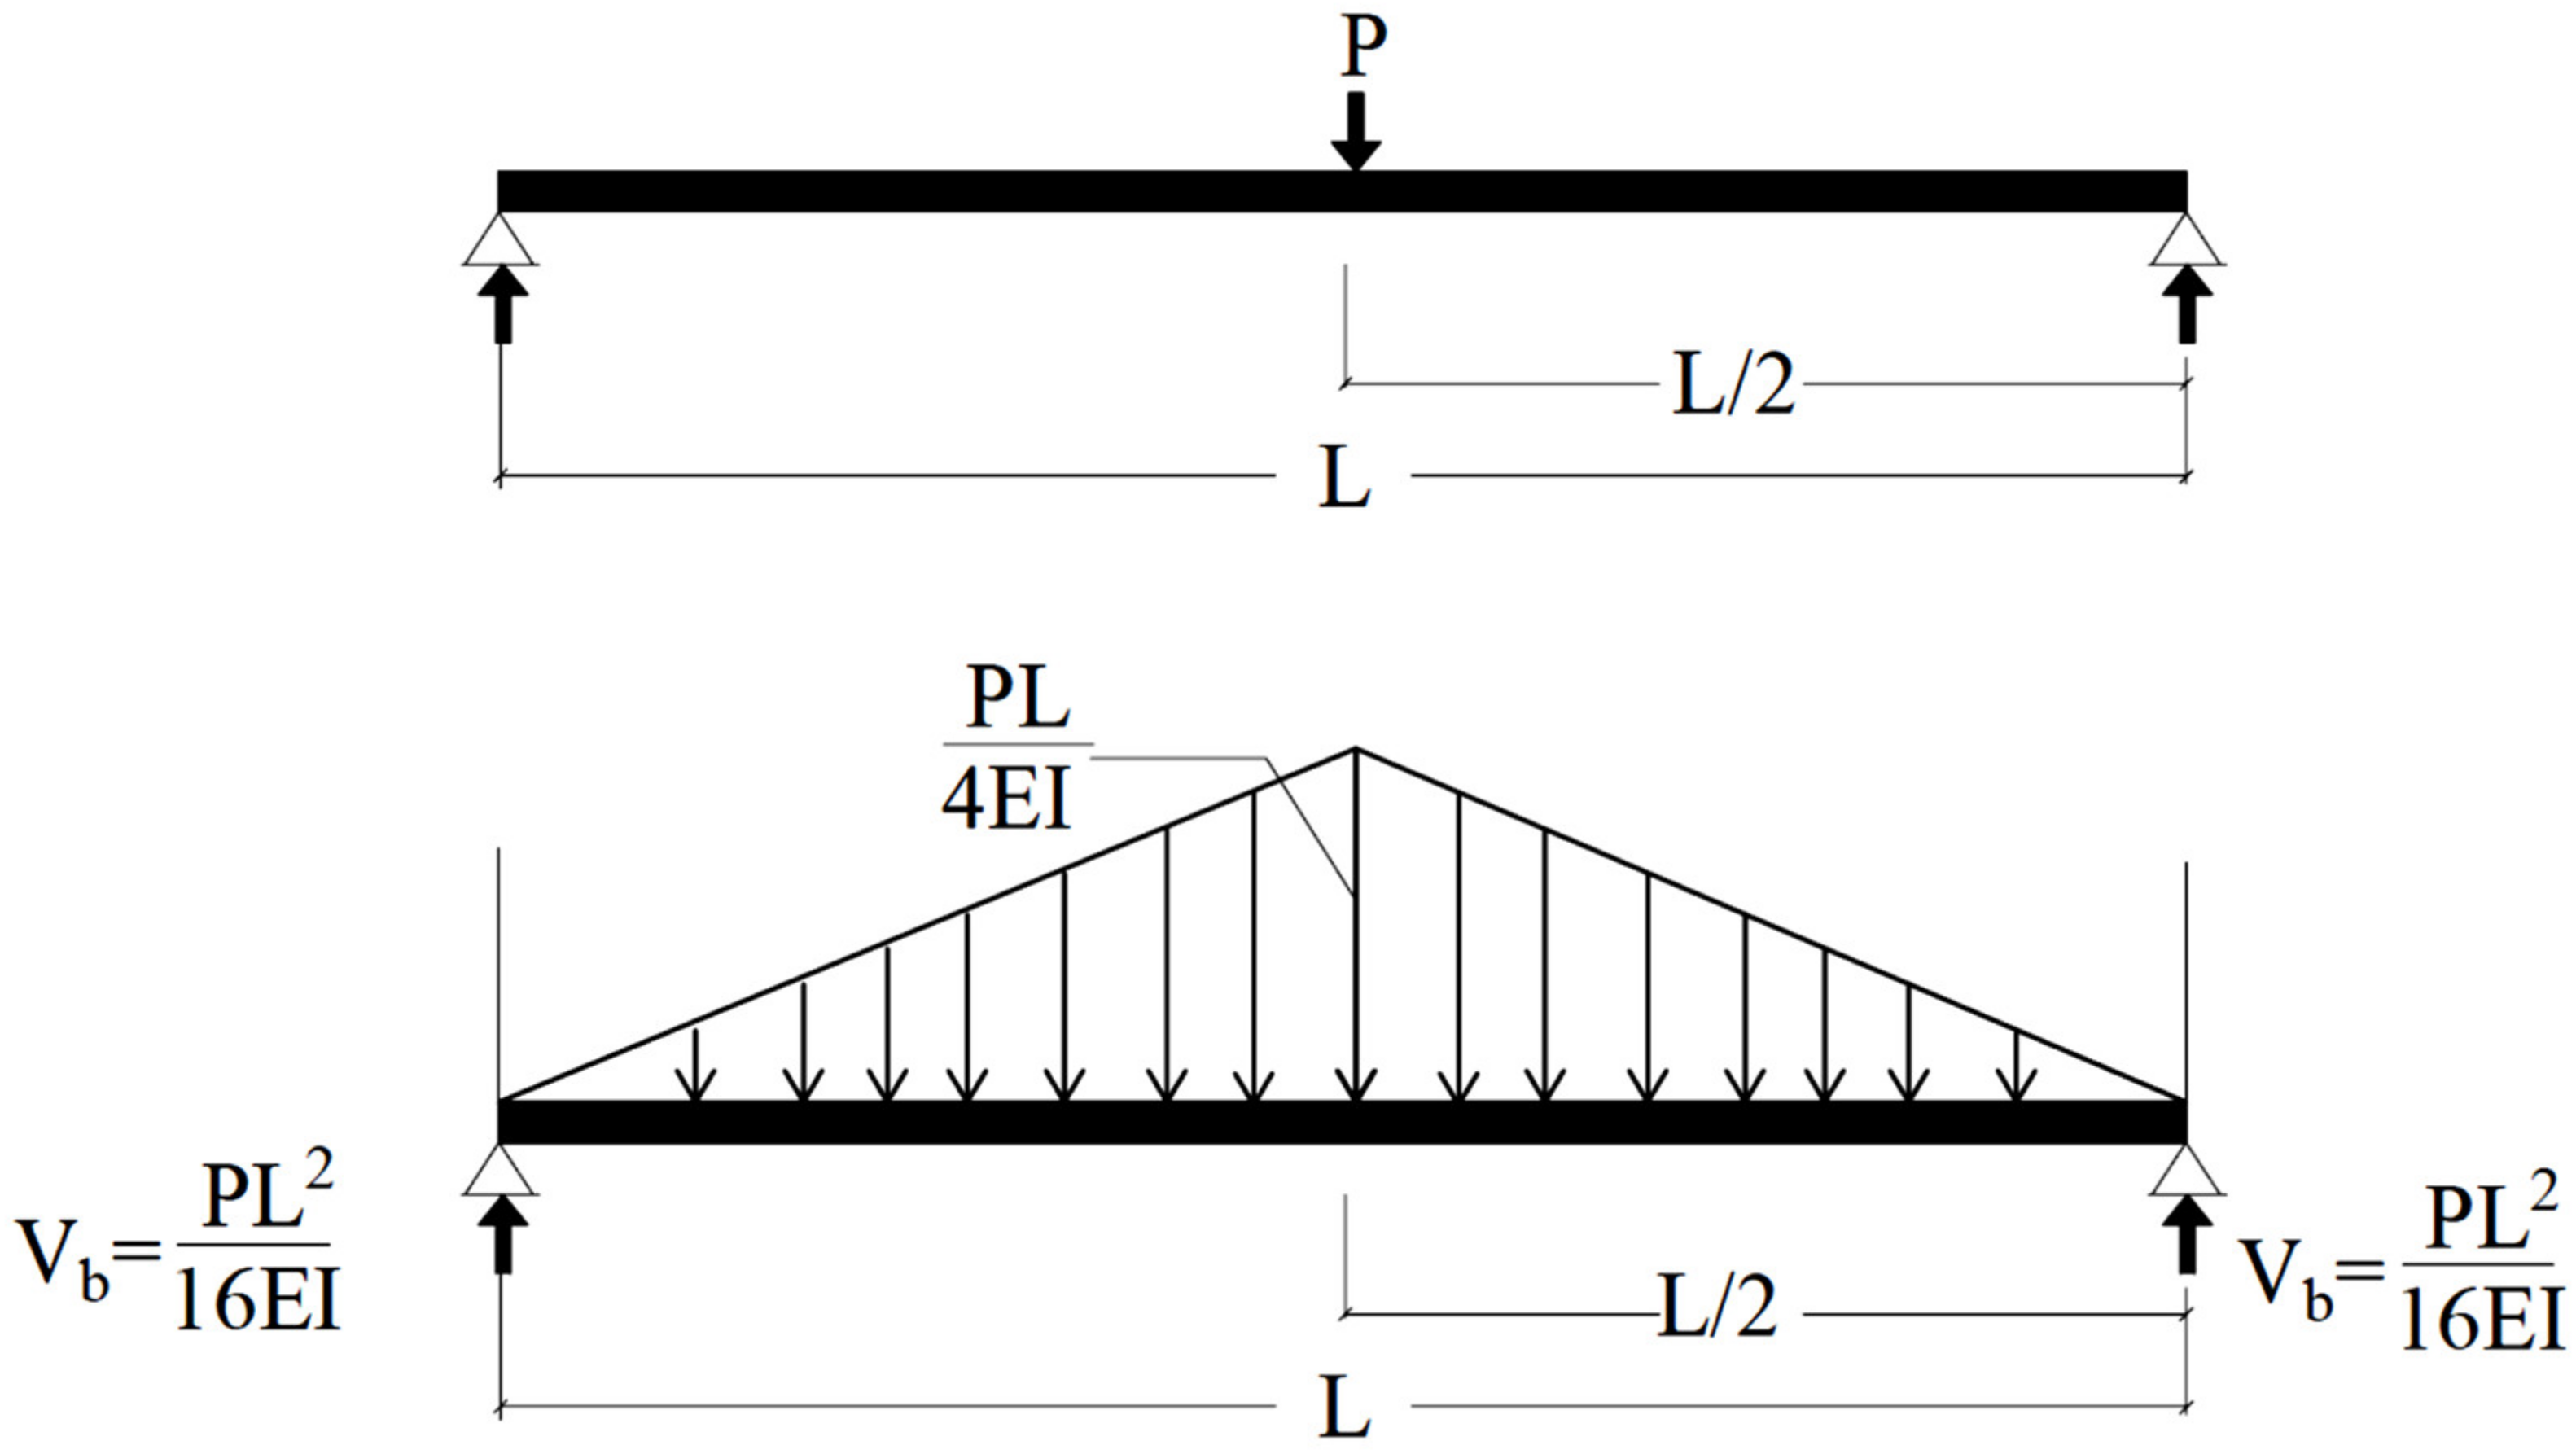
6.2. Pre-Cracking Deflection Determination
6.3. Post-Cracking Deflection Determination
6.4. Proposed Equations to Calculate Yield Load and Post-Cracking Deflection
7. Conclusions
- The initial stiffness of the solid beams and beams with openings at different positions was similar. In contrast, the effects of the opening’s dimensions and position on the beam’s load capacities and failure modes were obvious.
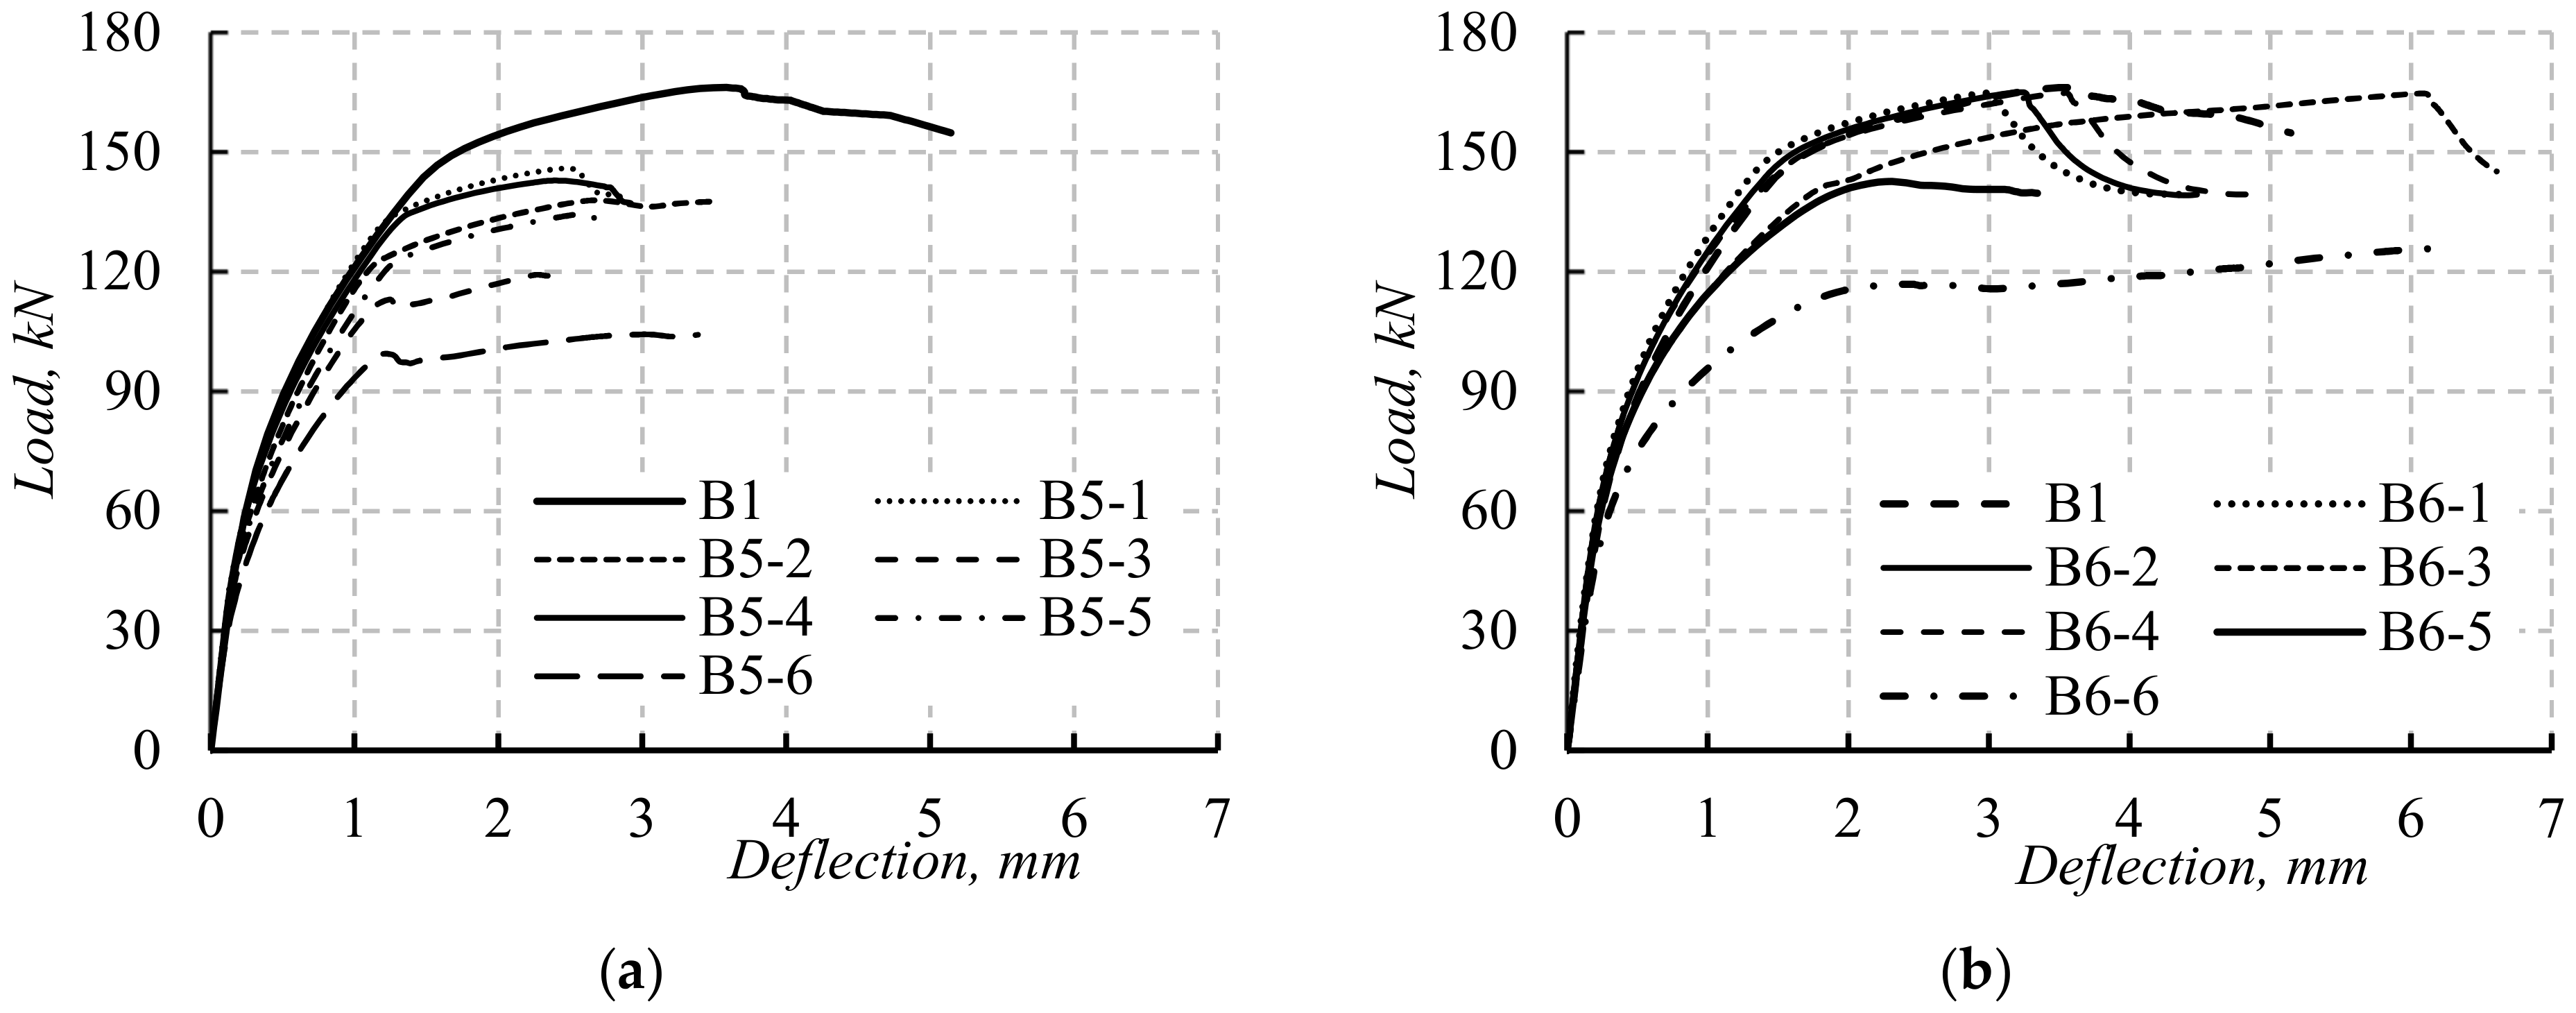
- For simulated beams with TNCH, as the opening height and width increased, the beam loads decreased. The highest value of maximum load reduction was for beam B5-6 with TNCH size = 150 mm × 150 mm (µu = 37.21%). All the beams with TNCH failed due to Ys followed by CC except for B5-6 (failed with CC).
- For simulated beams with TNSH, as the opening width was less than 18.18% of the beam shear span (550 mm), the TNSH opening had trivial effects on the beam’s load capacities (µu = 1.26%). All the simulated beams with TNSH failed due to SH except for beam B6-1 (failed with Ys).
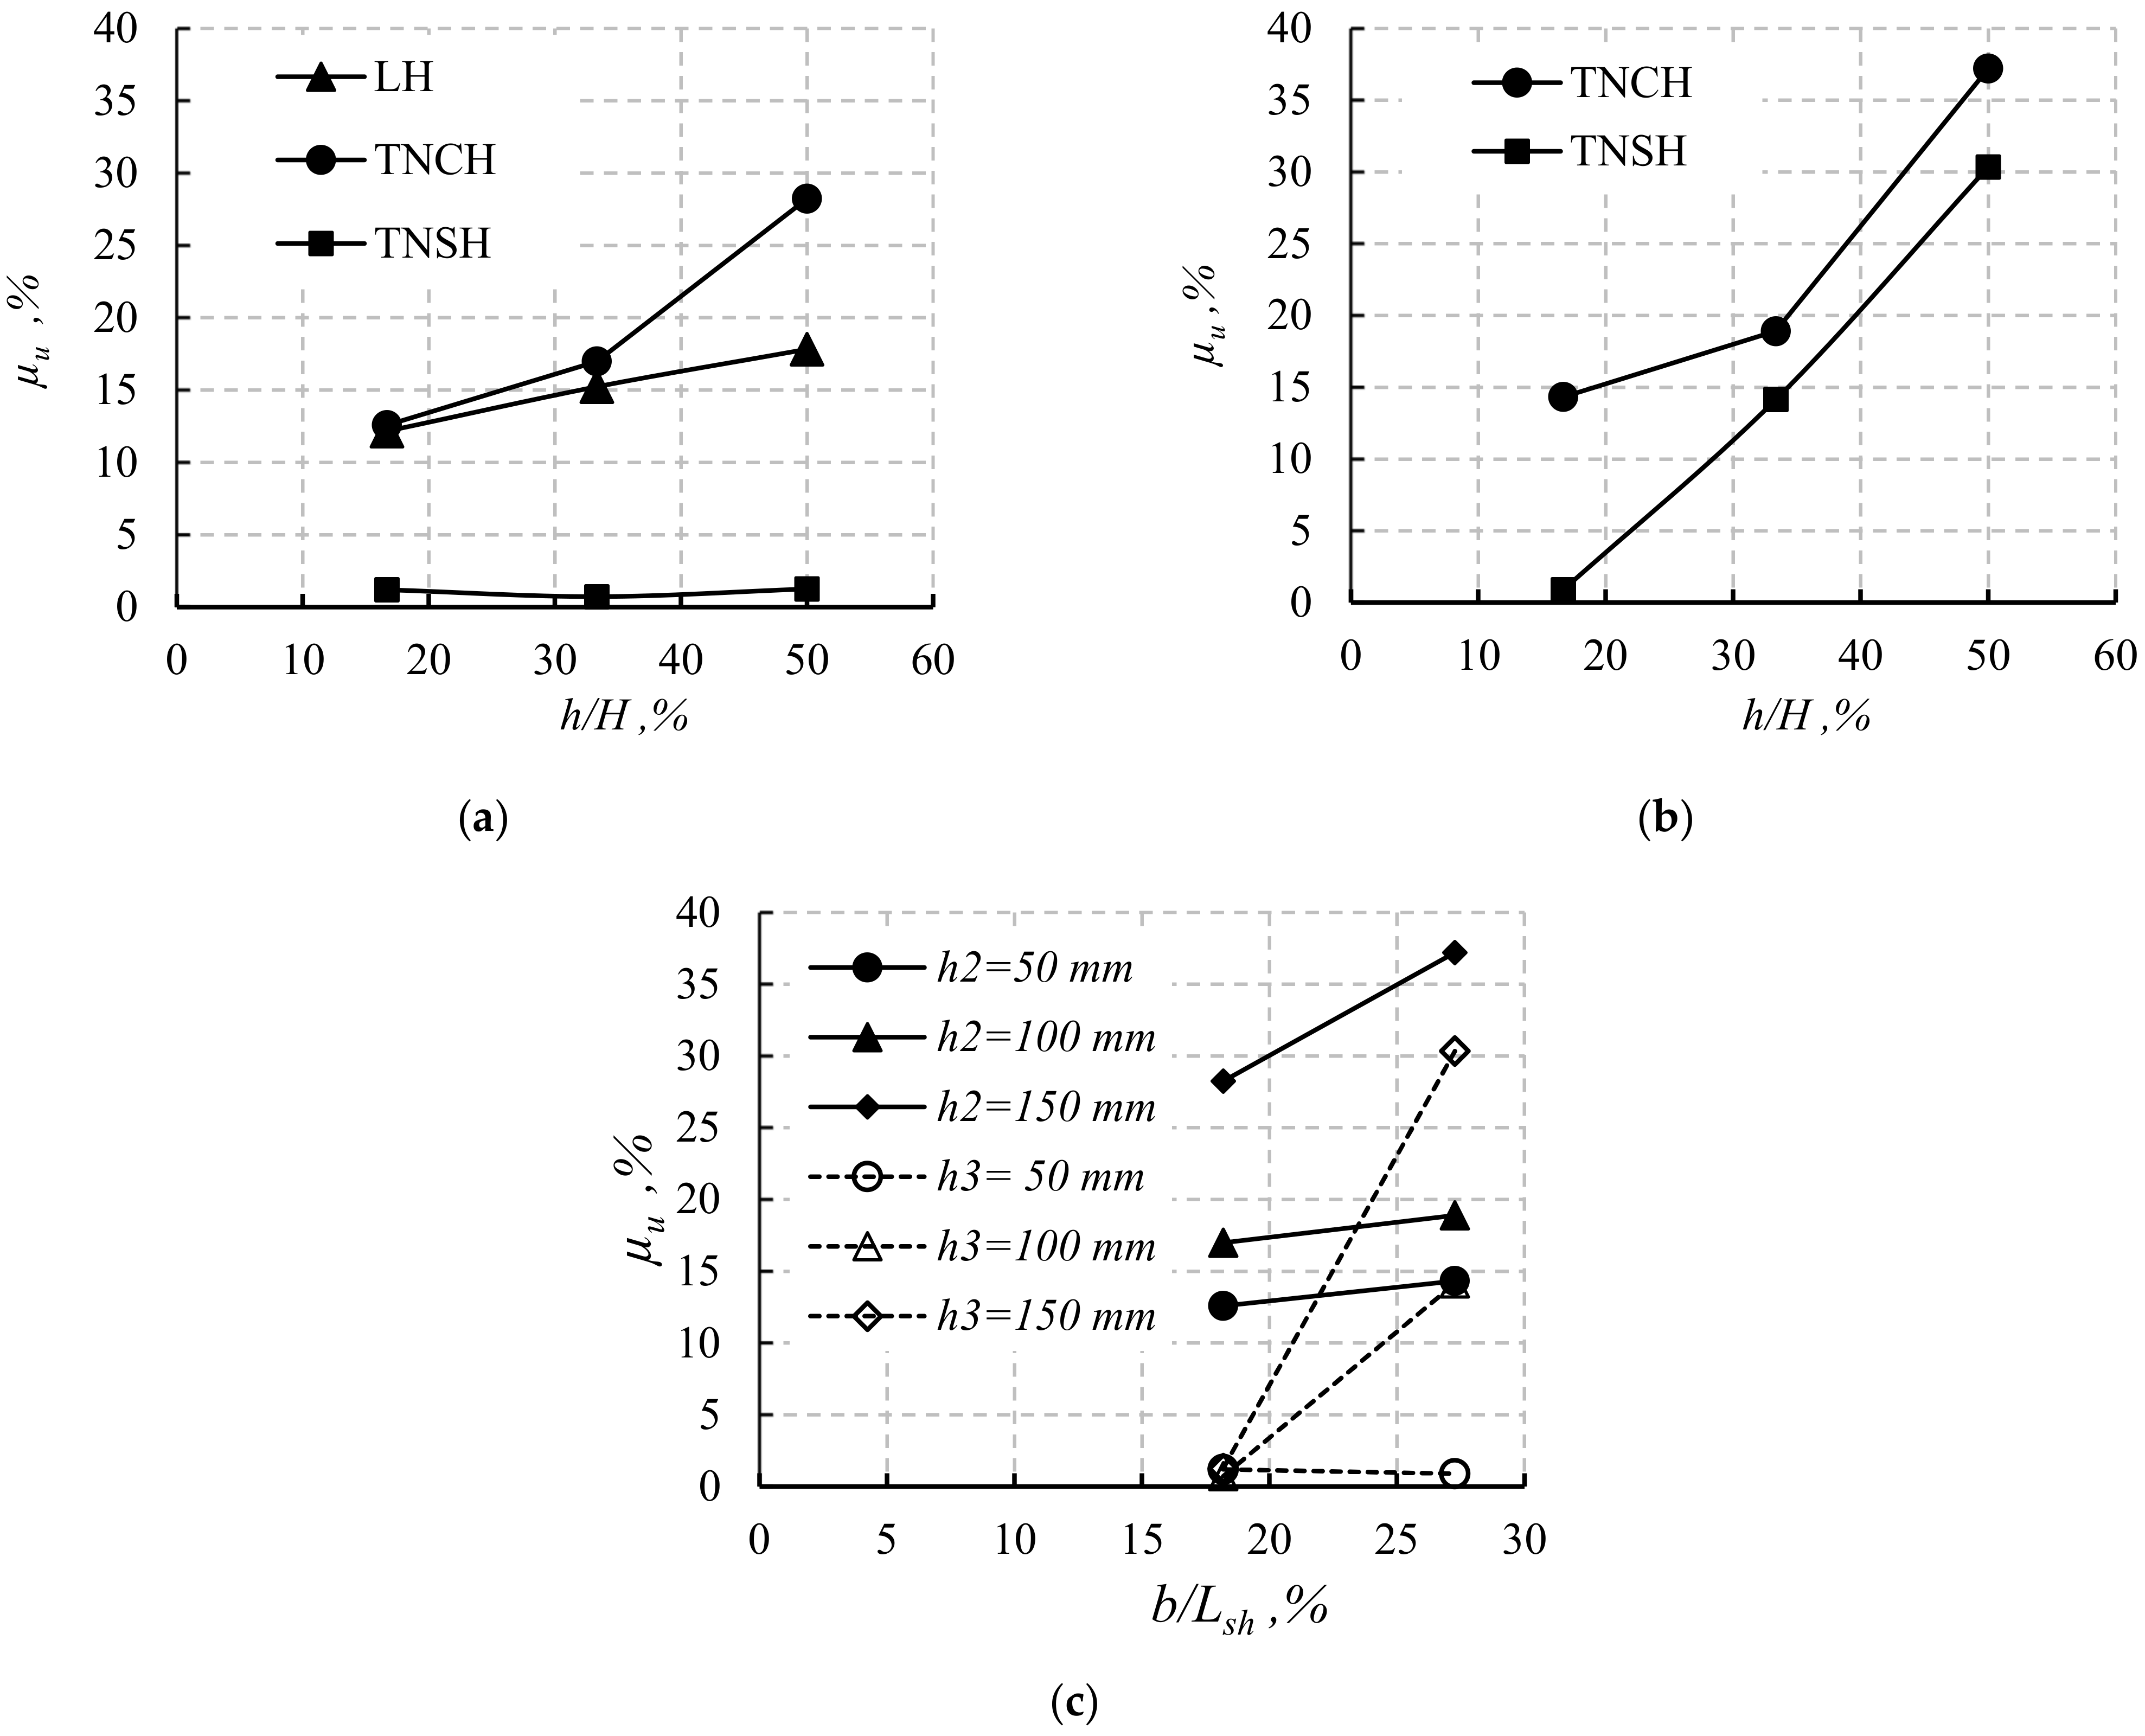
- The simulated beams with LH failed due to Ys followed by CC. The maximum µu% for these beams was 17.82% (opening size = 25% of beam size).
- At b = 100 mm, the beams with TNSH experienced the lowest µu% for all the studied values of h/H%. Conversely, the beams with TNCH experienced the highest values of µu%. These findings assured the higher effect of the TNCH opening on the flexural capacity than the TNSH. The same previous finding was observed for TNSH and TNCH with b = 150 mm. Moreover, the µu% increased as h increased, regardless of the opening position.
- The opening position effects on the µu% values decreased as the b value increased to 150 mm, especially when h/H% ≥ 1/3. At the same value of h, beams with TNCH experienced higher µu% values than beams with TNSH. In contrast, increasing b/Lsh increased µu% for beams with TNSH with higher values than beams with TNCH, especially for b/Lsh = 27.27% and h/H% ≥ 1/3, which assured the high effect of the width of TNSH on the beam shear capacity.
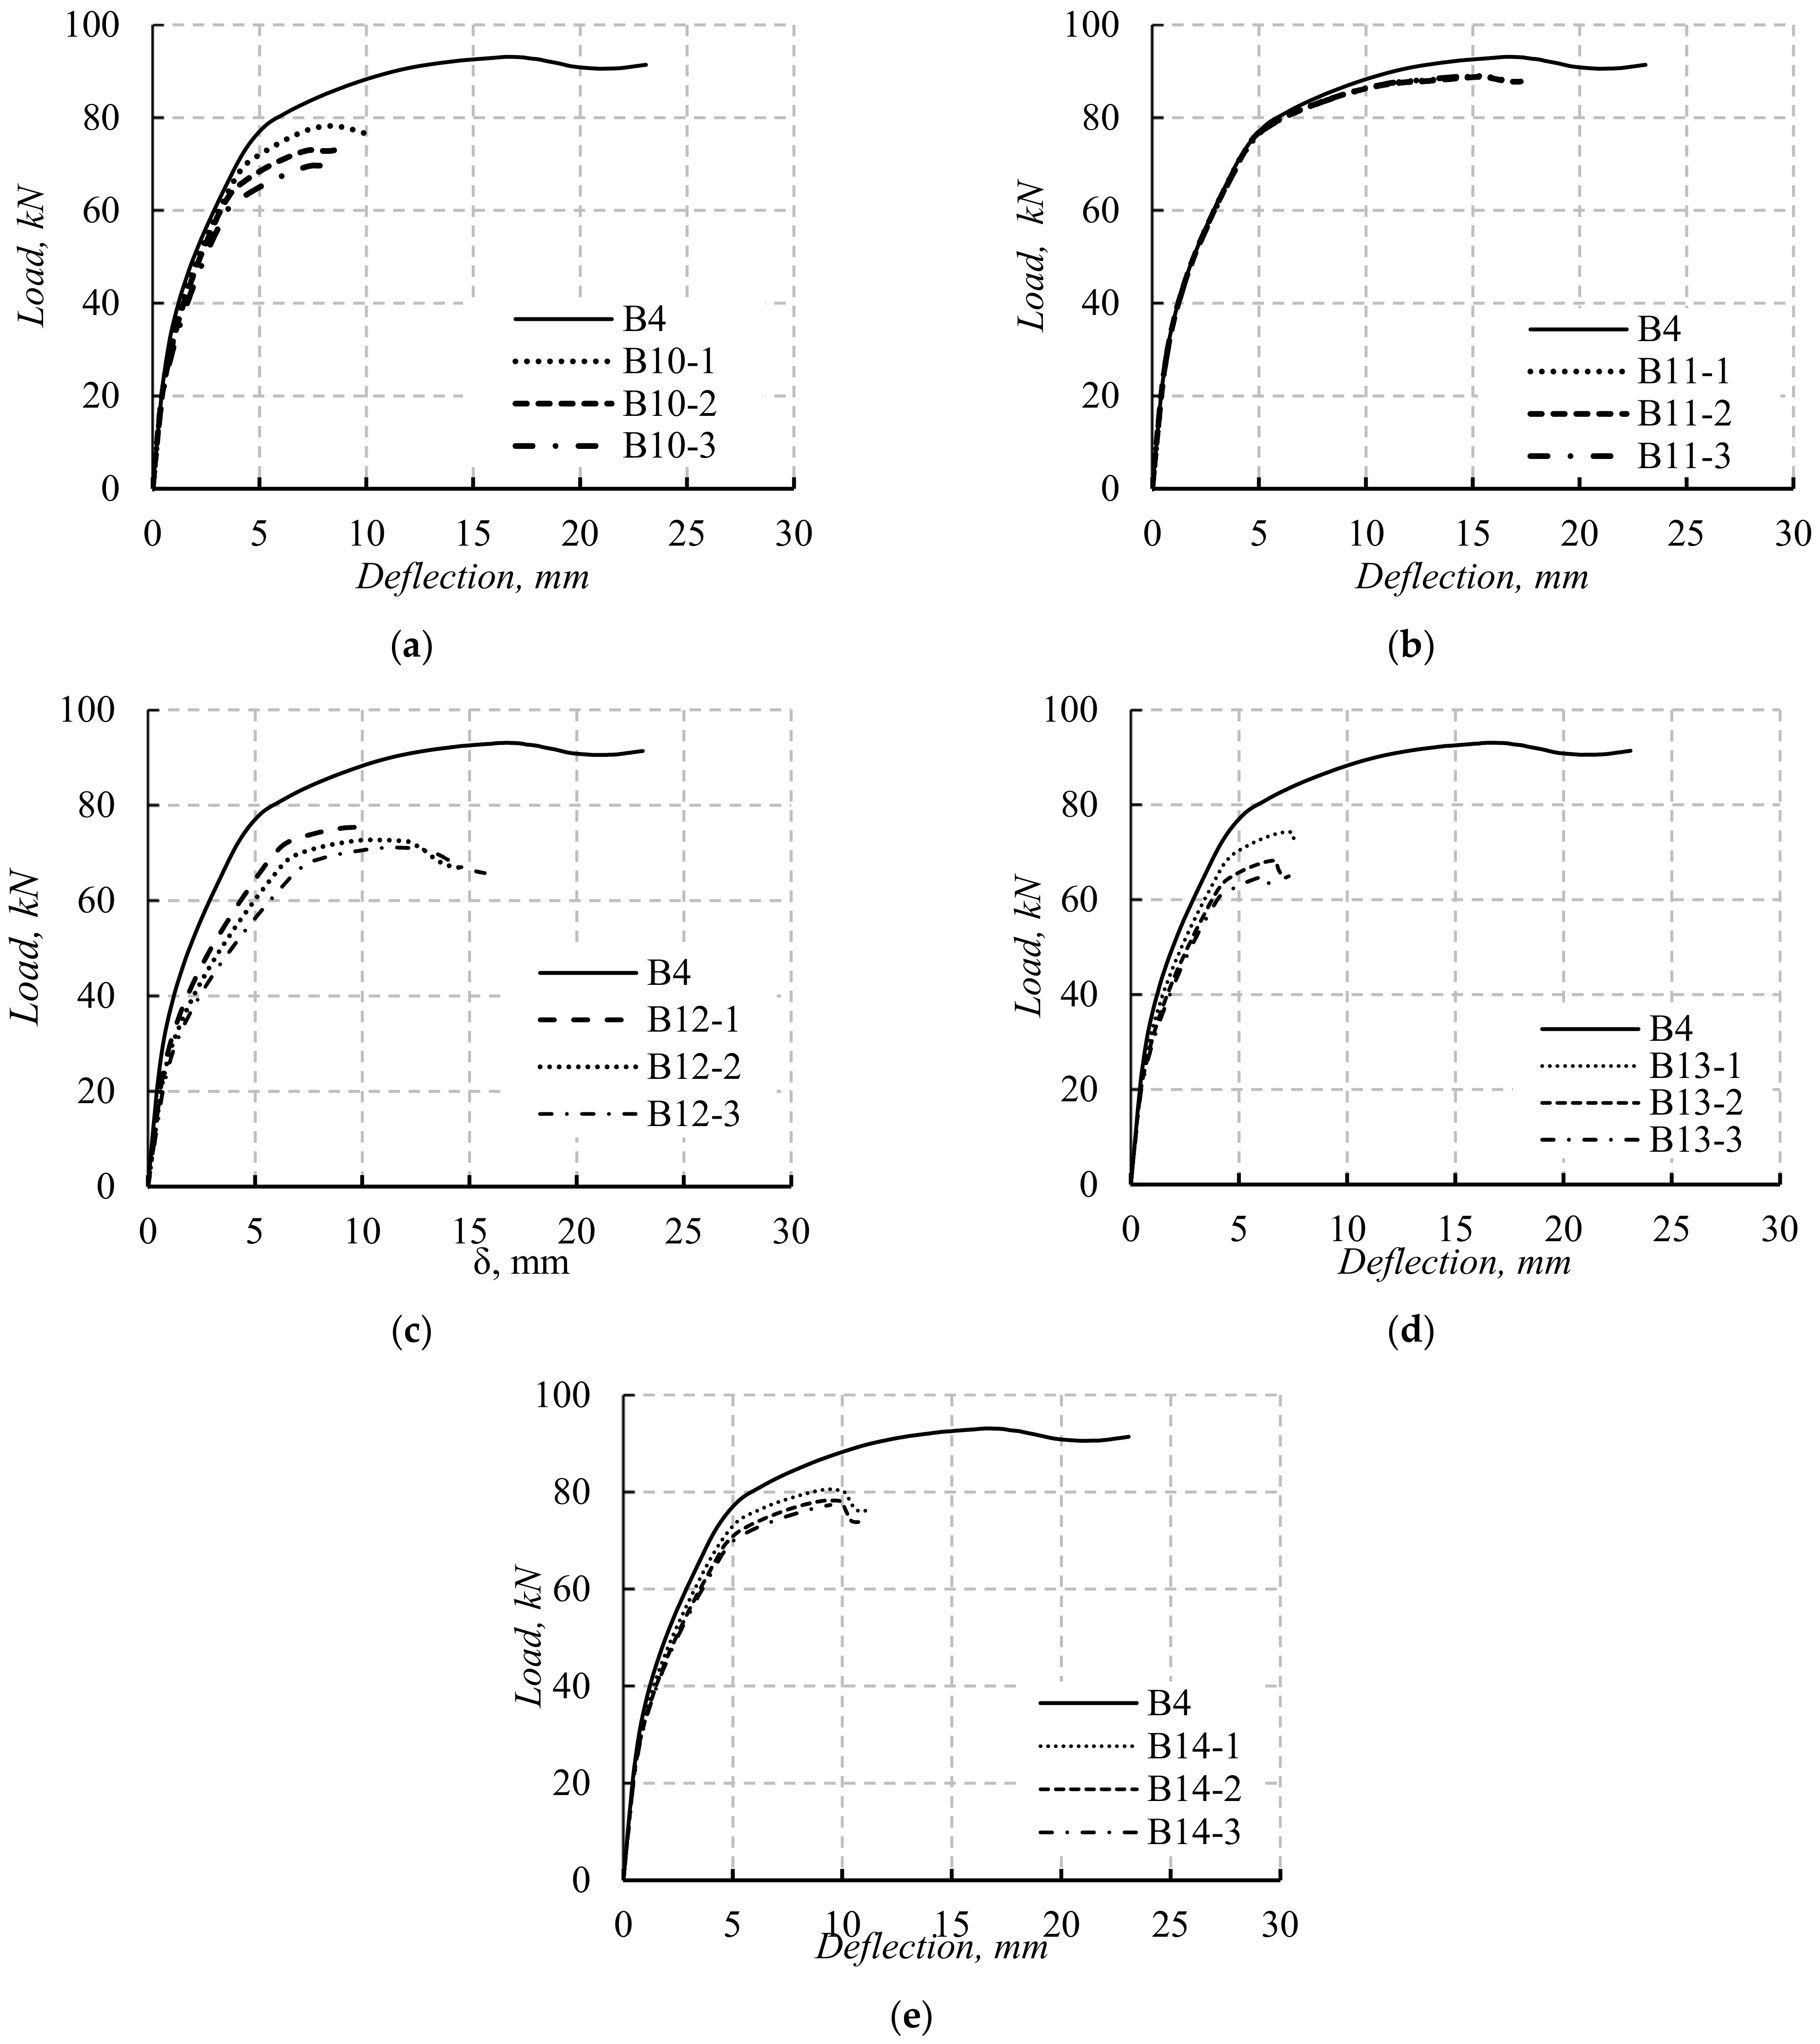
- The TNSH with 100 mm width had slight effects on the load capacities of solid beams with a 2200 mm span length, similar to that with a short length, although their failure modes were different. The LH decreased the load capacities of beams with a 2200 mm span length compared to the corresponding beams with a 1100 mm span length while the mode of failure was similar.
- The proposed equations for calculating the yield load and the post-cracking deflection were dependent on the percentages of opening dimensions to beam cross-section dimensions. The proposed equations calculated the yield load and post-cracking deflection for the concrete beams with longitudinal opening to an acceptable degree of accuracy.
Author Contributions
Funding
Institutional Review Board Statement
Informed Consent Statement
Data Availability Statement
Conflicts of Interest
Nomenclature
| Compression area of hollow section | fsu | Steel ultimate stress | |
| Compression area of beam solid section | fsy | Steel yield stress | |
| Area of opening | H | Beam height | |
| Area of tension steel | h1 | Opening height of longitudinal opening | |
| Area of uncracked transformed section | h2 | Opening height of near the beam center | |
| Net area of hollow section | h3 | Opening height located near the support | |
| Solid section of the beam | Ieff | Effective moment of inertia | |
| B | Beam width | Ig | Gross moment of inertia |
| b1 | Width of longitudinal opening | Iucr | Moment of inertia of uncracked section |
| b2 | Width of near the beam center opening | Solid transformed moment of inertia of the beam section | |
| b3 | Width of near the support opening | L | Beam length |
| c | Height of the compression zone | Cracking bending moment | |
| Distance between opening center and top concrete | m | Modular ratio | |
| Es | Modulus of elasticity value of steel | P | The central applied load |
| fcr | Modulus of rupture value of concrete | Pcr | Beam critical load |
| fsu | Steel ultimate stress | Pu | Beam ultimate load |
| Post-cracking deflection | Py | Yield load of solid section | |
| Central deflection at pre-cracking stage |
References
- Hsu, T.T.C. Torsion of Structural Concrete-Behavior of Reinforced Concrete Rectangular Members; ACI Special Publication; American Concrete Institute: Detroit, MI, USA, 1968; pp. 261–306. [Google Scholar]
- Mitchell, D.; Collins, M.P. Behaviour of Structural Concrete Beams in Pure Torsion; Publication No. 74-06; Department of Civil Engineering, University of Toronto: Toronto, ON, Canada, 1974. [Google Scholar]
- Rahal, K.N.; Collins, M.P. Analysis of Sections Subjected to Combined Shear and Torsion—A Theoretical Model. ACI Struct. J. 1995, 92, 459–469. [Google Scholar] [CrossRef]
- Fouad, E.; Ghoneim, M.; Issa, M.; Shaheen, H. Combined shear and torsion in reinforced normal and high-strength concrete beams (I): Experimental study. J. Eng. Appl. Sci. 2000, 47, 1059–1078. [Google Scholar]
- Lopes, S.M.R.; Bernardo, L.F.A. Twist behavior of high-strength concrete hollow beams-Formation of plastic hinges along the length. Eng. Struct. 2009, 31, 138–149. [Google Scholar] [CrossRef]
- Bhatt, P.; Ebireri, J.O. Direct design of reinforced concrete beams for combined bending and torsion. Stavebnicky Cas. 1989, 37, 249–263. [Google Scholar]
- Alnuaimi, A.S.; Al-Jabri, K.S.; Hago, A. Comparison between solid and hollow reinforced concrete beams. Mater. Struct. Constr. 2008, 41, 269–286. [Google Scholar] [CrossRef]
- Abbass, A.A.; Abid, S.R.; Arna’ot, F.H.; Al-Ameri, R.A.; Özakça, M. Flexural response of hollow high strength concrete beams considering different size reductions. Structures 2020, 23, 69–86. [Google Scholar] [CrossRef]
- Murugesan, A.; Narayanan, A. Deflection of Reinforced Concrete Beams with Longitudinal Circular Hole. Pract. Period. Struct. Des. Constr. 2018, 23, 04017034. [Google Scholar] [CrossRef]
- Murugesan, A.; Narayanan, A. Influence of a Longitudinal Circular Hole on Flexural Strength of Reinforced Concrete Beams. Pract. Period. Struct. Des. Constr. 2017, 22, 04016021. [Google Scholar] [CrossRef]
- Mushatat, H.A.; AbdulKareem, W.S.; Wanas, A.H. Effect of opening on strength characteristics of reinforced concrete dapped ends beams. IOP Conf. Ser. Mater. Sci. Eng. 2020, 870, 870. [Google Scholar] [CrossRef]
- Fouad, E.; Ghoneim, M.; Issa, M.; Shaheen, H.; Thorenfeldt, A.; Tomaszewicz, E.; Jensen, J.; Alnuaimi, A.S.; Al-Jabri, K.S.; Hago, A.; et al. Effect of opening on strength characteristics of reinforced concrete dapped ends beams. Structures 2020, 23, 138–149. [Google Scholar]
- Elamary, A.S.; Sharaky, I.A.; Alqurashi, M. Flexural behaviour of hollow concrete beams under three points loading: Experimental and numerical study. Structures 2021, 32, 1543–1552. [Google Scholar] [CrossRef]
- Simulia 3DS. Abaqus Analysis User’s Manual (Version 6.12); University of Cambridge Faculty of Mathematics: Cambridge, UK, 2015. [Google Scholar]
- Zhao, G.; Li, A. Numerical study of a bonded steel and concrete composite beam. Comput. Struct. 2008, 86, 1830–1838. [Google Scholar] [CrossRef]
- Kachlakev, D.; Niller, T.; Yim, S.; Chansawat, K.; Potisuk, T. Finite Element Modeling of Reinforced Concrete Structures Strengthened with FRP Lamiantes; Final Report SPR-316; Oregon Department of Transportation: Salem, OR, USA, 2001. [Google Scholar]
- Seleem, M.H.; Sharaky, I.A.; Sallam, H.E.M. Flexural behavior of steel beams strengthened by carbon fiber reinforced polymer plates—Three dimensional finite element simulation. Mater. Des. 2010, 31, 1317–1324. [Google Scholar] [CrossRef]
- Sümer, Y.; Aktaş, M. Defining parameters for concrete damage plasticity model. Chall. J. Struct. Mech. 2015, 1, 149–155. [Google Scholar] [CrossRef]
- Kmiecik, P.; Kamiński, M. Modelling of reinforced concrete structures and composite structures with concrete strength degradation taken into consideration. Arch. Civ. Mech. Eng. 2011, 11, 623–636. [Google Scholar] [CrossRef]
- Rezazadeh, M.; Costa, I.; Barros, J. Influence of prestress level on NSM CFRP laminates for the flexural strengthening of RC beams. Compos. Struct. 2014, 116, 489–500. [Google Scholar] [CrossRef] [Green Version]
- CEB-FIP. Model Code for Concrete Structures; Document Competence Center Siegmar Kästl eK: Ostfildern, Germany, 2010. [Google Scholar]
- Vilanova, I.; Torres, L.; Baena, M.; Llorens, M. Numerical simulation of bond-slip interface and tension stiffening in GFRP RC tensile elements. Compos. Struct. 2016, 153, 504–513. [Google Scholar] [CrossRef]
- Debernardi, P.G.; Taliano, M. Shear deformation in reinforced concrete beams with thin web. Mag. Concr. Res. 2006, 58, 157–171. [Google Scholar] [CrossRef]
- Kim, S.W.; Han, D.S.; Kim, K.H. Evaluation of shear effect on deflection of rc beams. Appl. Sci. 2021, 11, 7690. [Google Scholar] [CrossRef]
- Branson, D.E. Instantaneous and Time-Dependent Deflections of Simple and Continuous Reinforced Concrete Beams (HPR Report No. 7, Part 1); Alabama State Highway Department: Montgomery, AL, USA, 1965. [Google Scholar]
- Branson, D.E. Deformation of Concrete Structures; McGraw–Hill: New York, NY, USA, 1977. [Google Scholar]
- ACI Committee 318-11. Building Code Requirements for Structural Concrete and Commentary (ACI 318-11); American Concrete Institute: Farmington Hills, MI, USA, 2011. [Google Scholar]
- CSA (Canadian Standards Association). Design of Concrete Structures; Canadian Standards Association: Toronto, ON, Canada, 2004. [Google Scholar]
- Bischoff, P.H. Reevaluation of deflection prediction for concrete beams reinforced with steel and fiber reinforced polymer bars. J. Struct. Eng. 2005, 131, 752–767. [Google Scholar] [CrossRef]
- Bischoff, P.H. Deflection calculation of FRP reinforced concrete beams based on modifications to the existing Branson equation. J. Compos. Constr. 2007, 11, 4–14. [Google Scholar] [CrossRef]
- Ilker, K. Deflection prediction for reinforced concrete beams through different effective moment of inertia expressions. Int. J. Eng. Res. Dev. 2010, 2, 72–80. [Google Scholar]


| Diameter (mm) | fsy (MPa) | fsu (MPa) | Es (GPa) | Elongation% |
|---|---|---|---|---|
| 8 | 345 | 411 | 198 | 22.1% |
| 10, 12 | 427 | 522 | 209 | 20.5% |
| Beam No. | Beam Dimensions, mm | LH Dimensions, mm | ||
|---|---|---|---|---|
| B | H | b1 | h1 | |
| B1 | 200 | 300 | 0 | 0 |
| B2 | 200 | 300 | 50 | 40 |
| B3 | 200 | 300 | 50 | 80 |
| Beam No. | Pcr, kN | Py, kN | Pu, kN | µu% | wcr, mm | Failure Mode |
|---|---|---|---|---|---|---|
| B1 | 40.6 | 144.4 | 160 | 0 | 2 | Ys |
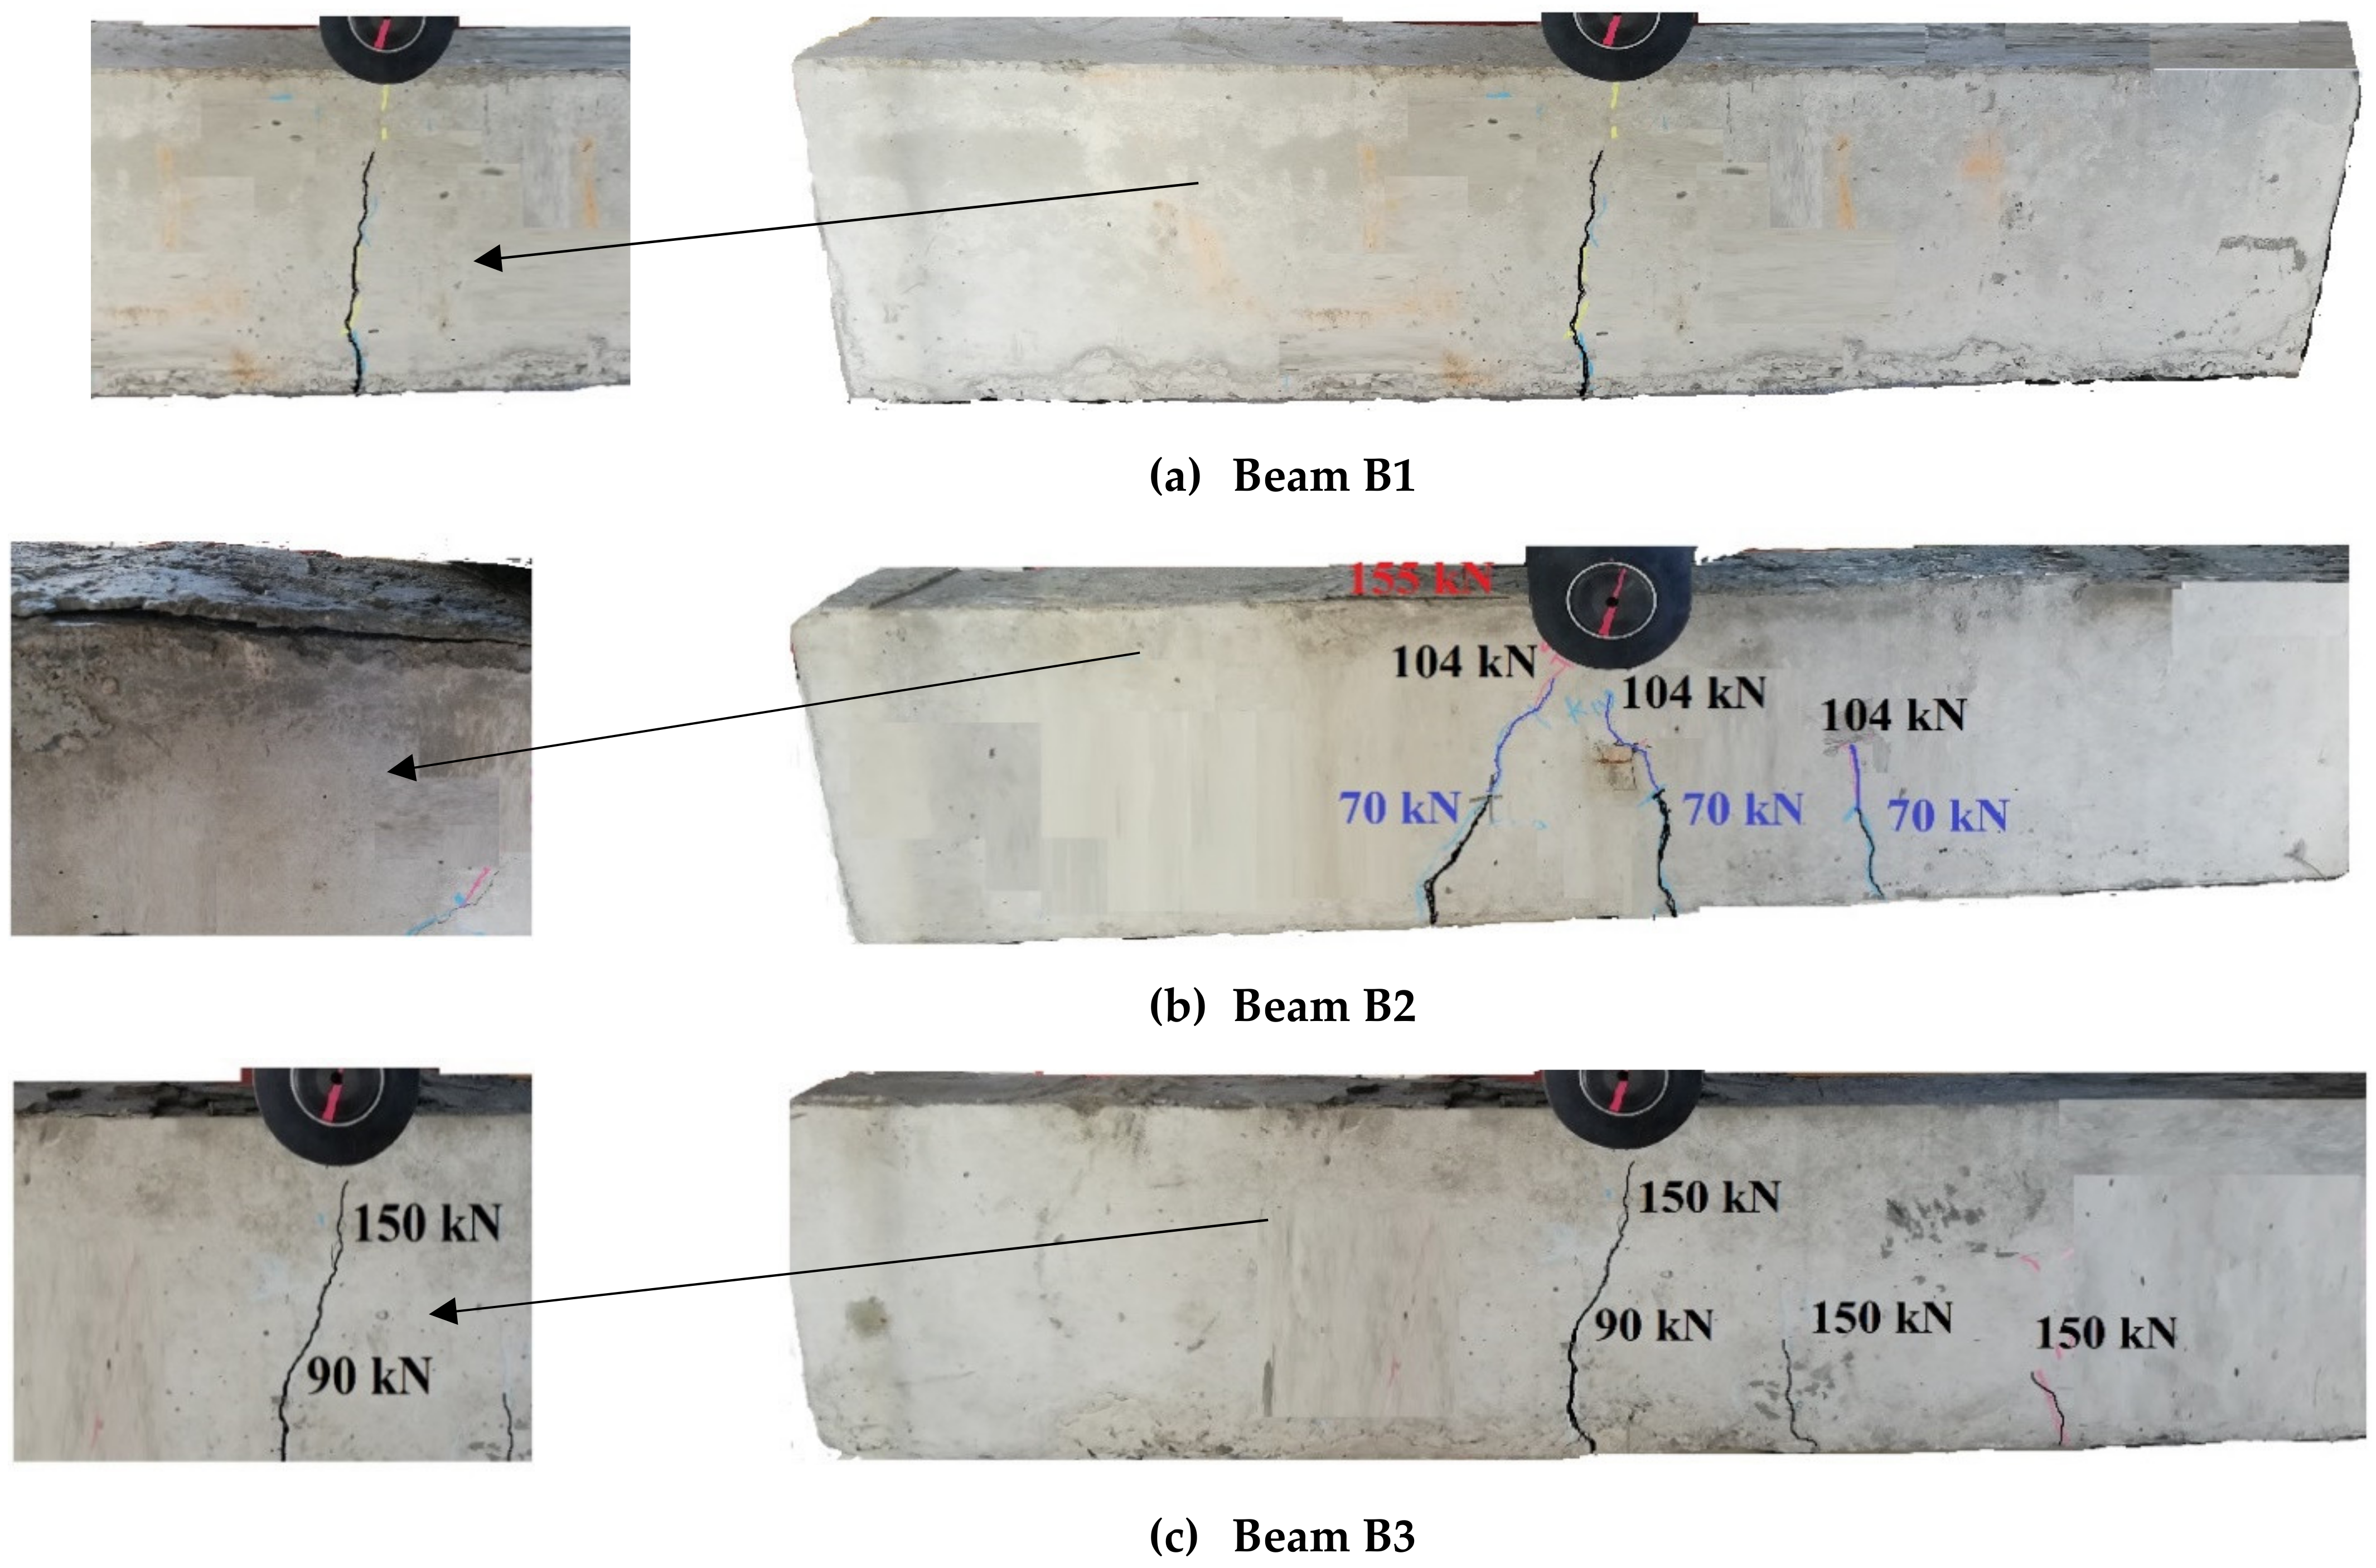
| B2 | 39.2 | 141.7 | 155 | 3.1 | 3.5 | Ys + CC |
| B3 | 38.8 | 137.8 | 154 | 3.1 | 4 | Ys + CC |
| Beam ID | Experimental Results | FEA Results | Comparisons | |||
|---|---|---|---|---|---|---|
| Py,Exp. (kN) | Pu,Exp. (kN) | Py,FEA (kN) | Pu,FEA (kN) | |||
| B1 | 144.4 | 160.9 | 146.7 | 166.1 | 1.6% | 3.2% |
| B2 | 141.7 | 155.0 | 144.3 | 159.7 | 1.8% | 3.0% |
| B3 | 137.8 | 154.0 | 141.2 | 156.7 | 2.5% | 1.1% |
| Group No. | Beam ID | L (mm) | b1 (mm) | h1 (mm) | b2 (mm) | h2 (mm) | b3 (mm) | h3 (mm) | Test Variable |
|---|---|---|---|---|---|---|---|---|---|
| Control-1 | B1 | 1100 | 0 | 0 | 0 | 0 | 0 | 0 | CB |
| Control-2 | B4 | 2200 | 0 | 0 | 0 | 0 | 0 | 0 | Span length (L) |
| Group 1 | B5-1 | 0 | 0 | 100 | 50 | 0 | 0 | Transversal near center opening (TNCH) | |
| B5-2 | 0 | 0 | 100 | 100 | 0 | 0 | |||
| B5-3 | 1100 | 0 | 0 | 100 | 150 | 0 | 0 | ||
| B5-4 | 0 | 0 | 150 | 50 | 0 | 0 | |||
| B5-5 | 0 | 0 | 150 | 100 | 0 | 0 | |||
| B5-6 | 0 | 0 | 150 | 150 | 0 | 0 | |||
| Group 2 | B6-1 | 0 | 0 | 0 | 0 | 100 | 50 | Transversal near support opening (TNSH) | |
| B6-2 | 0 | 0 | 0 | 0 | 100 | 100 | |||
| B6-3 | 0 | 0 | 0 | 0 | 100 | 150 | |||
| B6-4 | 1100 | 0 | 0 | 0 | 0 | 150 | 50 | ||
| B6-5 | 0 | 0 | 0 | 0 | 150 | 100 | |||
| B6-6 | 0 | 0 | 0 | 0 | 150 | 150 | |||
| Group 3 | B7-1 | 80 | 50 | 0 | 0 | 0 | 0 | Longitudinal opening (LH) | |
| B7-2 | 80 | 100 | 0 | 0 | 0 | 0 | |||
| B7-3 | 80 | 150 | 0 | 0 | 0 | 0 | |||
| B7-4 | 1100 | 100 | 50 | 0 | 0 | 0 | 0 | ||
| B7-5 | 100 | 100 | 0 | 0 | 0 | 0 | |||
| B7-6 | 100 | 150 | 0 | 0 | 0 | 0 | |||
| Group 4 | B8-1 | 80 | 50 | 100 | 50 | 0 | 0 | LH and TNCH | |
| B8-2 | 1100 | 80 | 100 | 100 | 100 | 0 | 0 | ||
| B8-3 | 80 | 150 | 100 | 150 | 0 | 0 | |||
| Group 5 | B9-1 | 80 | 50 | 0 | 0 | 100 | 50 | LH and TNSH | |
| B9-2 | 1100 | 80 | 100 | 0 | 0 | 100 | 100 | ||
| B9-3 | 80 | 150 | 0 | 0 | 100 | 150 | |||
| Group 6 | B10-1 | 2200 | 0 | 0 | 100 | 50 | 0 | 0 | TNCH and L |
| B10-2 | 0 | 0 | 100 | 100 | 0 | 0 | |||
| B10-3 | 0 | 0 | 100 | 150 | 0 | 0 | |||
| Group 7 | B11-1 | 0 | 0 | 0 | 0 | 100 | 50 | TNSH and L | |
| B11-2 | 2200 | 0 | 0 | 0 | 0 | 100 | 100 | ||
| B11-3 | 0 | 0 | 0 | 0 | 100 | 150 | |||
| Group 8 | B12-1 | 2200 | 100 | 50 | 0 | 0 | 0 | 0 | LH and L |
| B12-2 | 100 | 100 | 0 | 0 | 0 | 0 | |||
| B12-3 | 100 | 150 | 0 | 0 | 0 | 0 | |||
| Group 9 | B13-1 | 80 | 50 | 100 | 50 | 0 | 0 | LH, TNCH, and L | |
| B13-2 | 2200 | 80 | 100 | 100 | 100 | 0 | 0 | ||
| B13-3 | 80 | 150 | 100 | 150 | 0 | 0 | |||
| B14-1 | 80 | 50 | 0 | 0 | 100 | 50 | |||
| Group 10 | B14-2 | 2200 | 80 | 100 | 0 | 0 | 100 | 100 | LH, TNSH, and L |
| B14-3 | 80 | 150 | 0 | 0 | 100 | 150 |
| Group ID | Beam ID | Pcr (kN) | Py (kN) | Pu (kN) | µcr (%) | µy (%) | µu (%) | Failure Mode |
|---|---|---|---|---|---|---|---|---|
| CB1 | B1 | 41.5 | 144.4 | 160.9 | - | - | - | Ys |
| CB2 | B4 | 36.6 | 78.1 | 93.0 | - | - | - | Ys + CC |
| Group 1 | B5-1 | 39.8 | 134.6 | 145.2 | 4.10 | 8.25 | 12.58 | Ys + CC |
| B5-2 | 25.4 | 122.4 | 137.9 | 38.80 | 16.56 | 16.98 | Ys + CC | |
| B5-3 | 23.9 | 112.6 | 119.2 | 42.41 | 23.24 | 28.24 | Ys + CC | |
| B5-4 | 39.1 | 133.9 | 142.3 | 5.78 | 8.73 | 14.33 | Ys + CC | |
| B5-5 | 24.3 | 121.9 | 134.7 | 41.45 | 16.91 | 18.90 | Ys + CC | |
| B5-6 | 21.5 | 99.2 | 104.3 | 48.19 | 32.38 | 37.21 | CC | |
| Group 2 | B6-1 | 40.5 | 149.1 | 164.1 | 2.41 | 0.41 | 1.20 | Ys |
| B6-2 | 39.14 | 148.8 | 164.9 | 5.69 | 0.61 | 0.72 | SH | |
| B6-3 | 36.9 | 139.9 | 164 | 11.08 | 4.64 | 1.26 | SH | |
| B6-4 | 39.3 | 147.2 | 164.6 | 5.30 | 0.34 | 0.90 | SH | |
| B6-5 | 36.8 | - | 142.6 | 11.33 | - | 14.15 | SH | |
| B6-6 | 32.7 | - | 115.7 | 21.20 | - | 30.34 | SH | |
| Group 3 | B7-1 | 38.8 | 139.2 | 158.5 | 6.51 | 5.11 | 4.58 | Ys + CC |
| B7-2 | 37.6 | 134.5 | 153.2 | 9.40 | 8.32 | 7.77 | Ys + CC | |
| B7-3 | 36.2 | 130.5 | 145.2 | 12.77 | 11.04 | 12.58 | Ys + CC | |
| B7-4 | 38.2 | 137.5 | 145.9 | 7.95 | 6.27 | 12.16 | Ys + CC | |
| B7-5 | 36.0 | 131.5 | 140.8 | 13.25 | 10.36 | 15.23 | Ys + CC | |
| B7-6 | 34.1 | 125.7 | 136.5 | 17.83 | 14.31 | 17.82 | Ys + CC | |
| Group 4 | B8-1 | 24.5 | 134.2 | 146.9 | 40.96 | 8.52 | 11.56 | Ys + CC |
| B8-2 | 23.1 | 123.7 | 135.6 | 44.34 | 15.68 | 18.36 | Ys + CC | |
| B8-3 | 20.9 | 113.3 | 120.6 | 49.64 | 22.77 | 27.39 | Ys + CC | |
| Group 5 | B9-1 | 37.6 | 142.6 | 152 | 9.40 | 2.79 | 8.49 | Ys + SH |
| B9-2 | 35.1 | - | 127 | 15.42 | - | 23.54 | SH | |
| B9-3 | 31.5 | - | 120.8 | 24.10 | - | 27.27 | SH | |
| Group 6 | B10-1 | 31.0 | 60.2 | 78.9 | 15.3 | 22.9 | 15.2 | Ys + CC |
| B10-2 | 30.5 | 64.2 | 77.1 | 16.7 | 17.8 | 17.1 | Ys + CC | |
| B10-3 | 30.0 | 69.1 | 74.2 | 18.0 | 11.5 | 20.2 | Ys + CC | |
| Group 7 | B11-1 | 36.0 | 78.1 | 88.9 | 1.1 | 0.0 | 4.4 | Ys + CC |
| B11-2 | 36.0 | 78.1 | 88.9 | 1.1 | 0.0 | 4.4 | Ys + CC | |
| B11-3 | 36.0 | 78.1 | 88.9 | 1.1 | 0.0 | 4.4 | Ys + CC | |
| Group 8 | B12-1 | 32.7 | 73.0 | 75.5 | 10.7 | 6.5 | 18.8 | Ys + CC |
| B12-2 | 32.0 | 69.75 | 72.7 | 12.6 | 10.7 | 21.8 | Ys + CC | |
| B12-3 | 31.6 | 66.90 | 71.1 | 13.7 | 14.3 | 23.5 | Ys + CC | |
| Group 9 | B13-1 | 27.4 | 69.3 | 74.3 | 25.1 | 11.3 | 20.1 | Ys + CC |
| B13-2 | 27.0 | 63.8 | 69.4 | 26.2 | 18.3 | 25.4 | Ys + CC | |
| B13-3 | 26.8 | 60.4 | 64.9 | 26.8 | 22.7 | 30.2 | Ys + CC | |
| Group 10 | B14-1 | 33.2 | 73.7 | 80.6 | 9.3 | 5.6 | 13.3 | Ys + CC |
| B14-2 | 32.6 | 71.1 | 78.4 | 10.9 | 9.0 | 15.7 | Ys + CC | |
| B14-3 | 32.1 | 69.0 | 77.3 | 12.3 | 11.7 | 16.9 | Ys + CC |
| Beam ID | (1) | (2) | (3) | (4) | (5) | (6) |
|---|---|---|---|---|---|---|
| FE | Theoretical | (%) of Error | FE | Theoretical | (%) of Error | |
| Py | Py | δ y | δ y | |||
| kN | kN | mm | mm | |||
| B1 | 146.7 | 146.68 | 0.01% | 1.577 | 1.58 | 0.19% |
| B2 | 144.3 | 143.598 | 0.49% | 1.604 | 1.65 | 2.87% |
| B3 | 141.2 | 141.01 | 0.13% | 1.685 | 1.71 | 1.48% |
| B7-1 | 139.2 | 139.04 | 0.11% | 1.48 | 1.49 | 0.68% |
| B7-2 | 134.5 | 134.296 | 0.15% | 1.5 | 1.51 | 0.67% |
| B7-3 | 130.5 | 129.59 | 0.70% | 1.52 | 1.53 | 0.66% |
| B7-4 | 137.5 | 137.08 | 0.31% | 1.54 | 1.56 | 1.30% |
| B7-5 | 131.5 | 131.15 | 0.27% | 1.67 | 1.7 | 1.80% |
| B7-6 | 125.7 | 125.54 | 0.13% | 1.695 | 1.71 | 0.88% |
| B4 | 78.1 | 78.09 | 0.01% | 6.75 | 6.77 | 0.30% |
| B12-1 | 73 | 72.98 | 0.03% | 6.95 | 7.03 | 1.15% |
| B12-2 | 69.75 | 69.82 | 0.10% | 7.25 | 7.3 | 0.69% |
| B12-3 | 66.9 | 66.83 | 0.10% | 7.32 | 7.38 | 0.82% |
Publisher’s Note: MDPI stays neutral with regard to jurisdictional claims in published maps and institutional affiliations. |
© 2021 by the authors. Licensee MDPI, Basel, Switzerland. This article is an open access article distributed under the terms and conditions of the Creative Commons Attribution (CC BY) license (https://creativecommons.org/licenses/by/4.0/).
Share and Cite
Sharaky, I.A.; Elamary, A.S.; Alharthi, Y.M. Flexural Response and Failure Analysis of Solid and Hollow Core Concrete Beams with Additional Opening at Different Locations. Materials 2021, 14, 7203. https://doi.org/10.3390/ma14237203
Sharaky IA, Elamary AS, Alharthi YM. Flexural Response and Failure Analysis of Solid and Hollow Core Concrete Beams with Additional Opening at Different Locations. Materials. 2021; 14(23):7203. https://doi.org/10.3390/ma14237203
Chicago/Turabian StyleSharaky, Ibrahim A., Ahmed S. Elamary, and Yasir M. Alharthi. 2021. "Flexural Response and Failure Analysis of Solid and Hollow Core Concrete Beams with Additional Opening at Different Locations" Materials 14, no. 23: 7203. https://doi.org/10.3390/ma14237203
APA StyleSharaky, I. A., Elamary, A. S., & Alharthi, Y. M. (2021). Flexural Response and Failure Analysis of Solid and Hollow Core Concrete Beams with Additional Opening at Different Locations. Materials, 14(23), 7203. https://doi.org/10.3390/ma14237203