
Study of the Filtration Performance of Multilayer and Multiscale Fibrous Structures

 ,
, 

Abstract
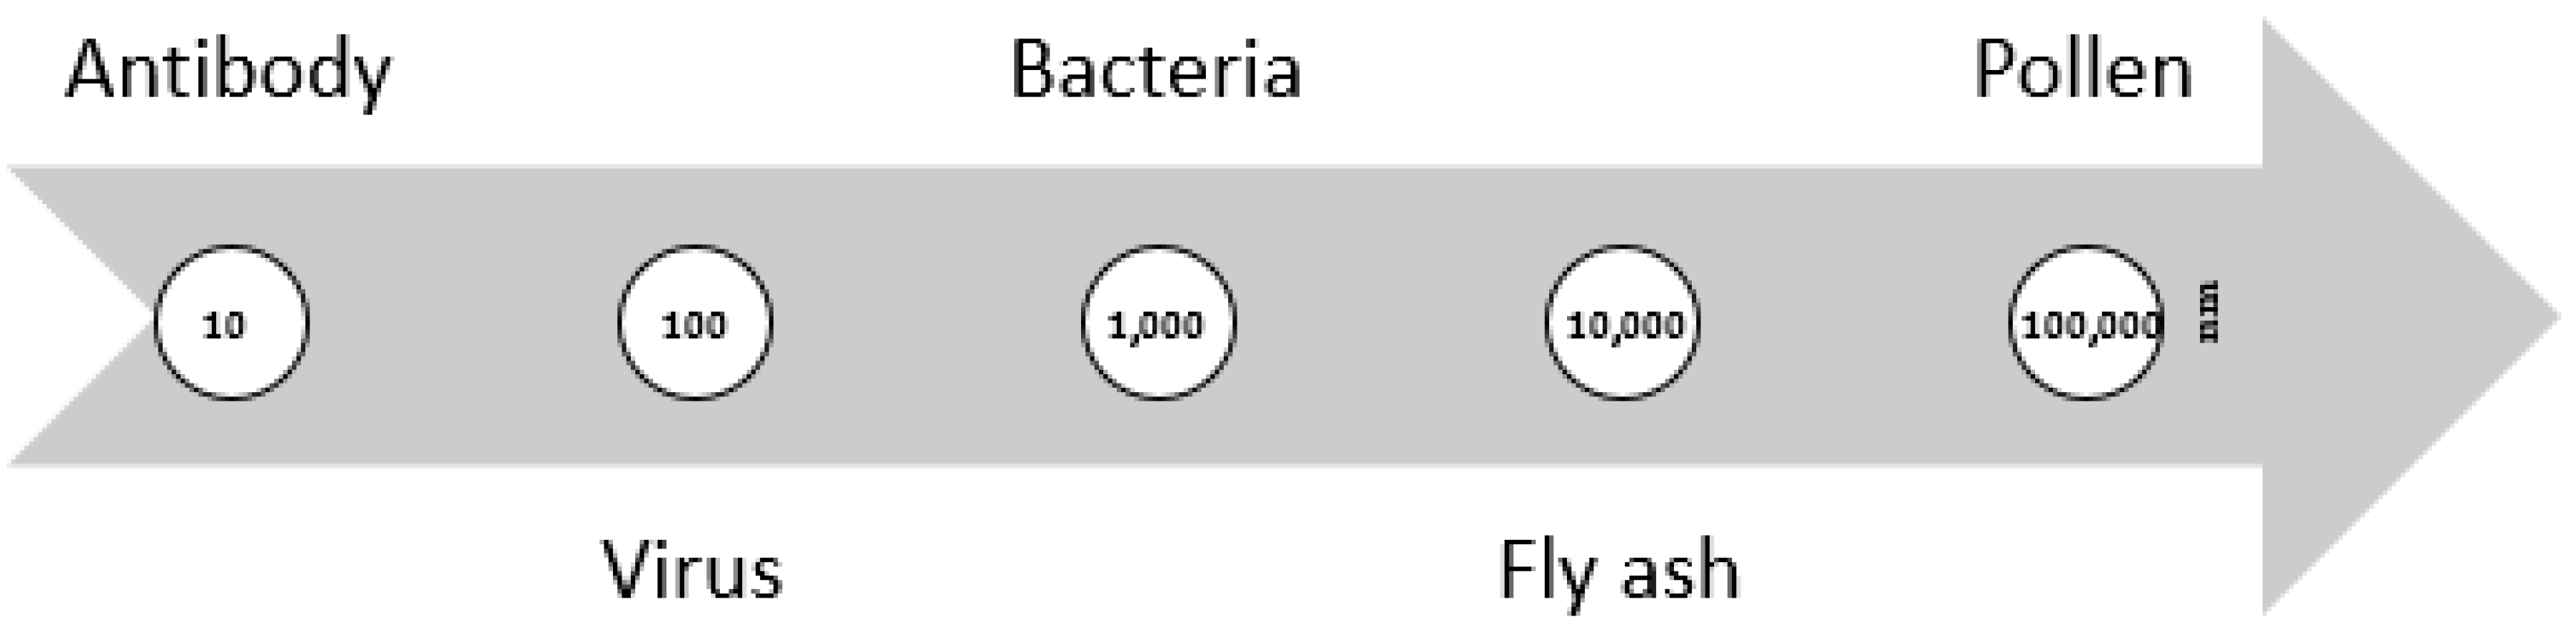
:1. Introduction
2. Materials and Methods
2.1. Materials
2.2. Production of Electrospun PA Membranes
2.3. Electrospun PA Membranes Characterization
2.4. Electrospun PA + Nonwoven Fabrics Characterization
3. Results
3.1. Electrospun Fibre Characterization
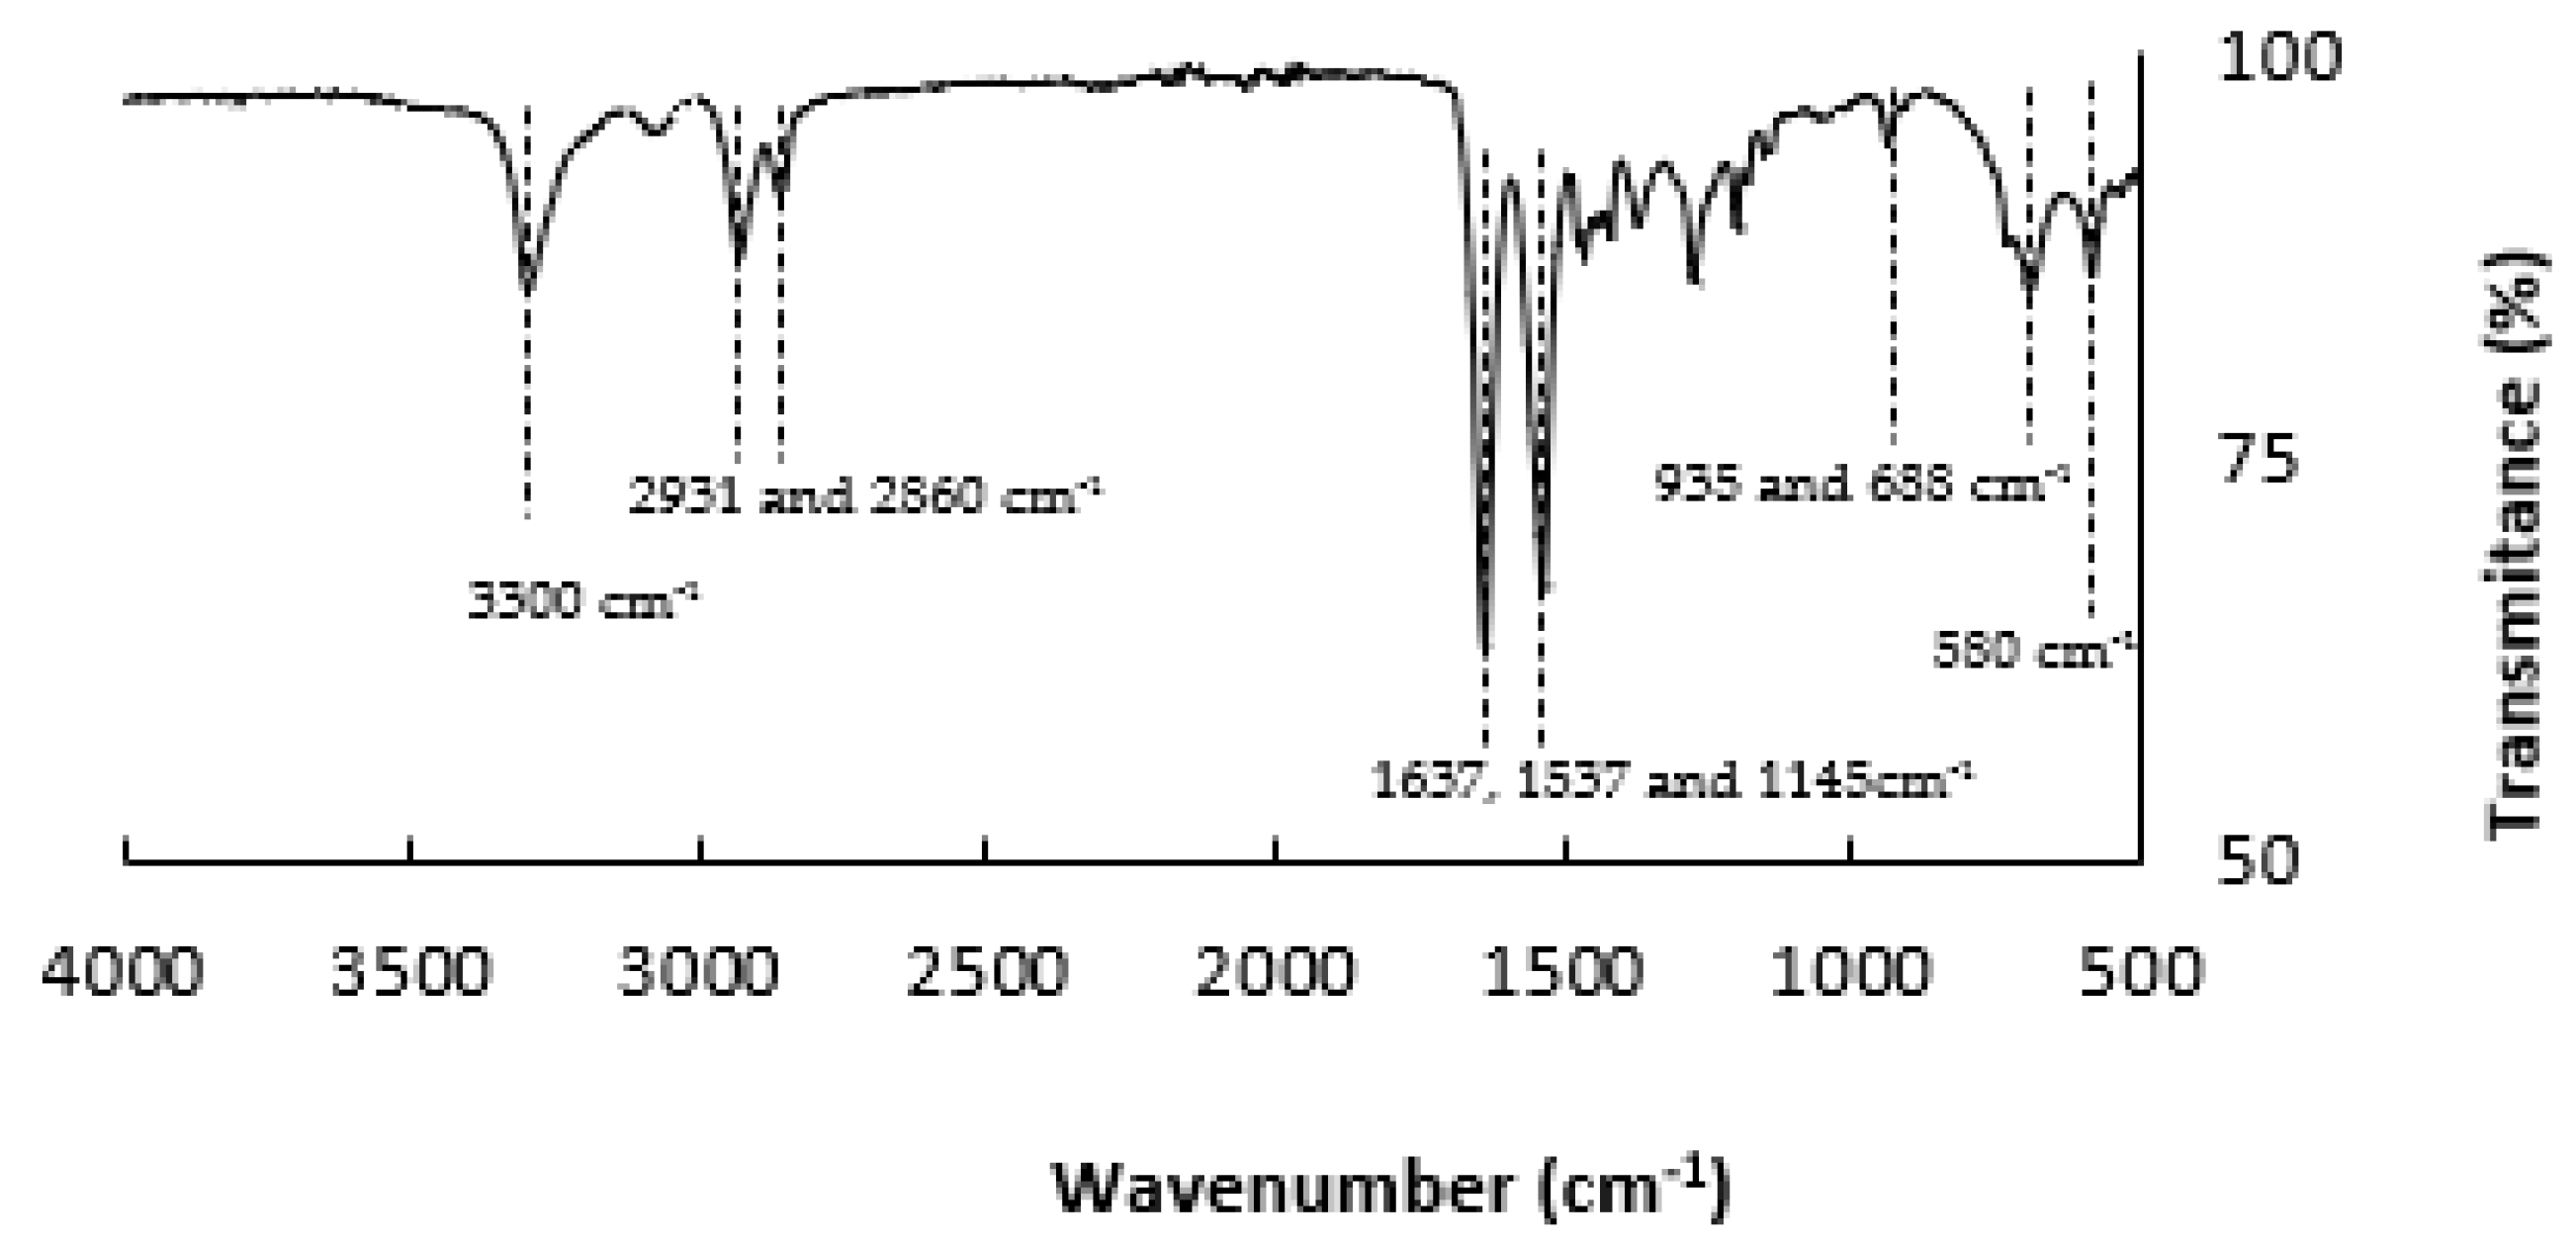
3.1.1. Fourier Transform Infrared Spectroscopy and Thermogravimetric Analysis
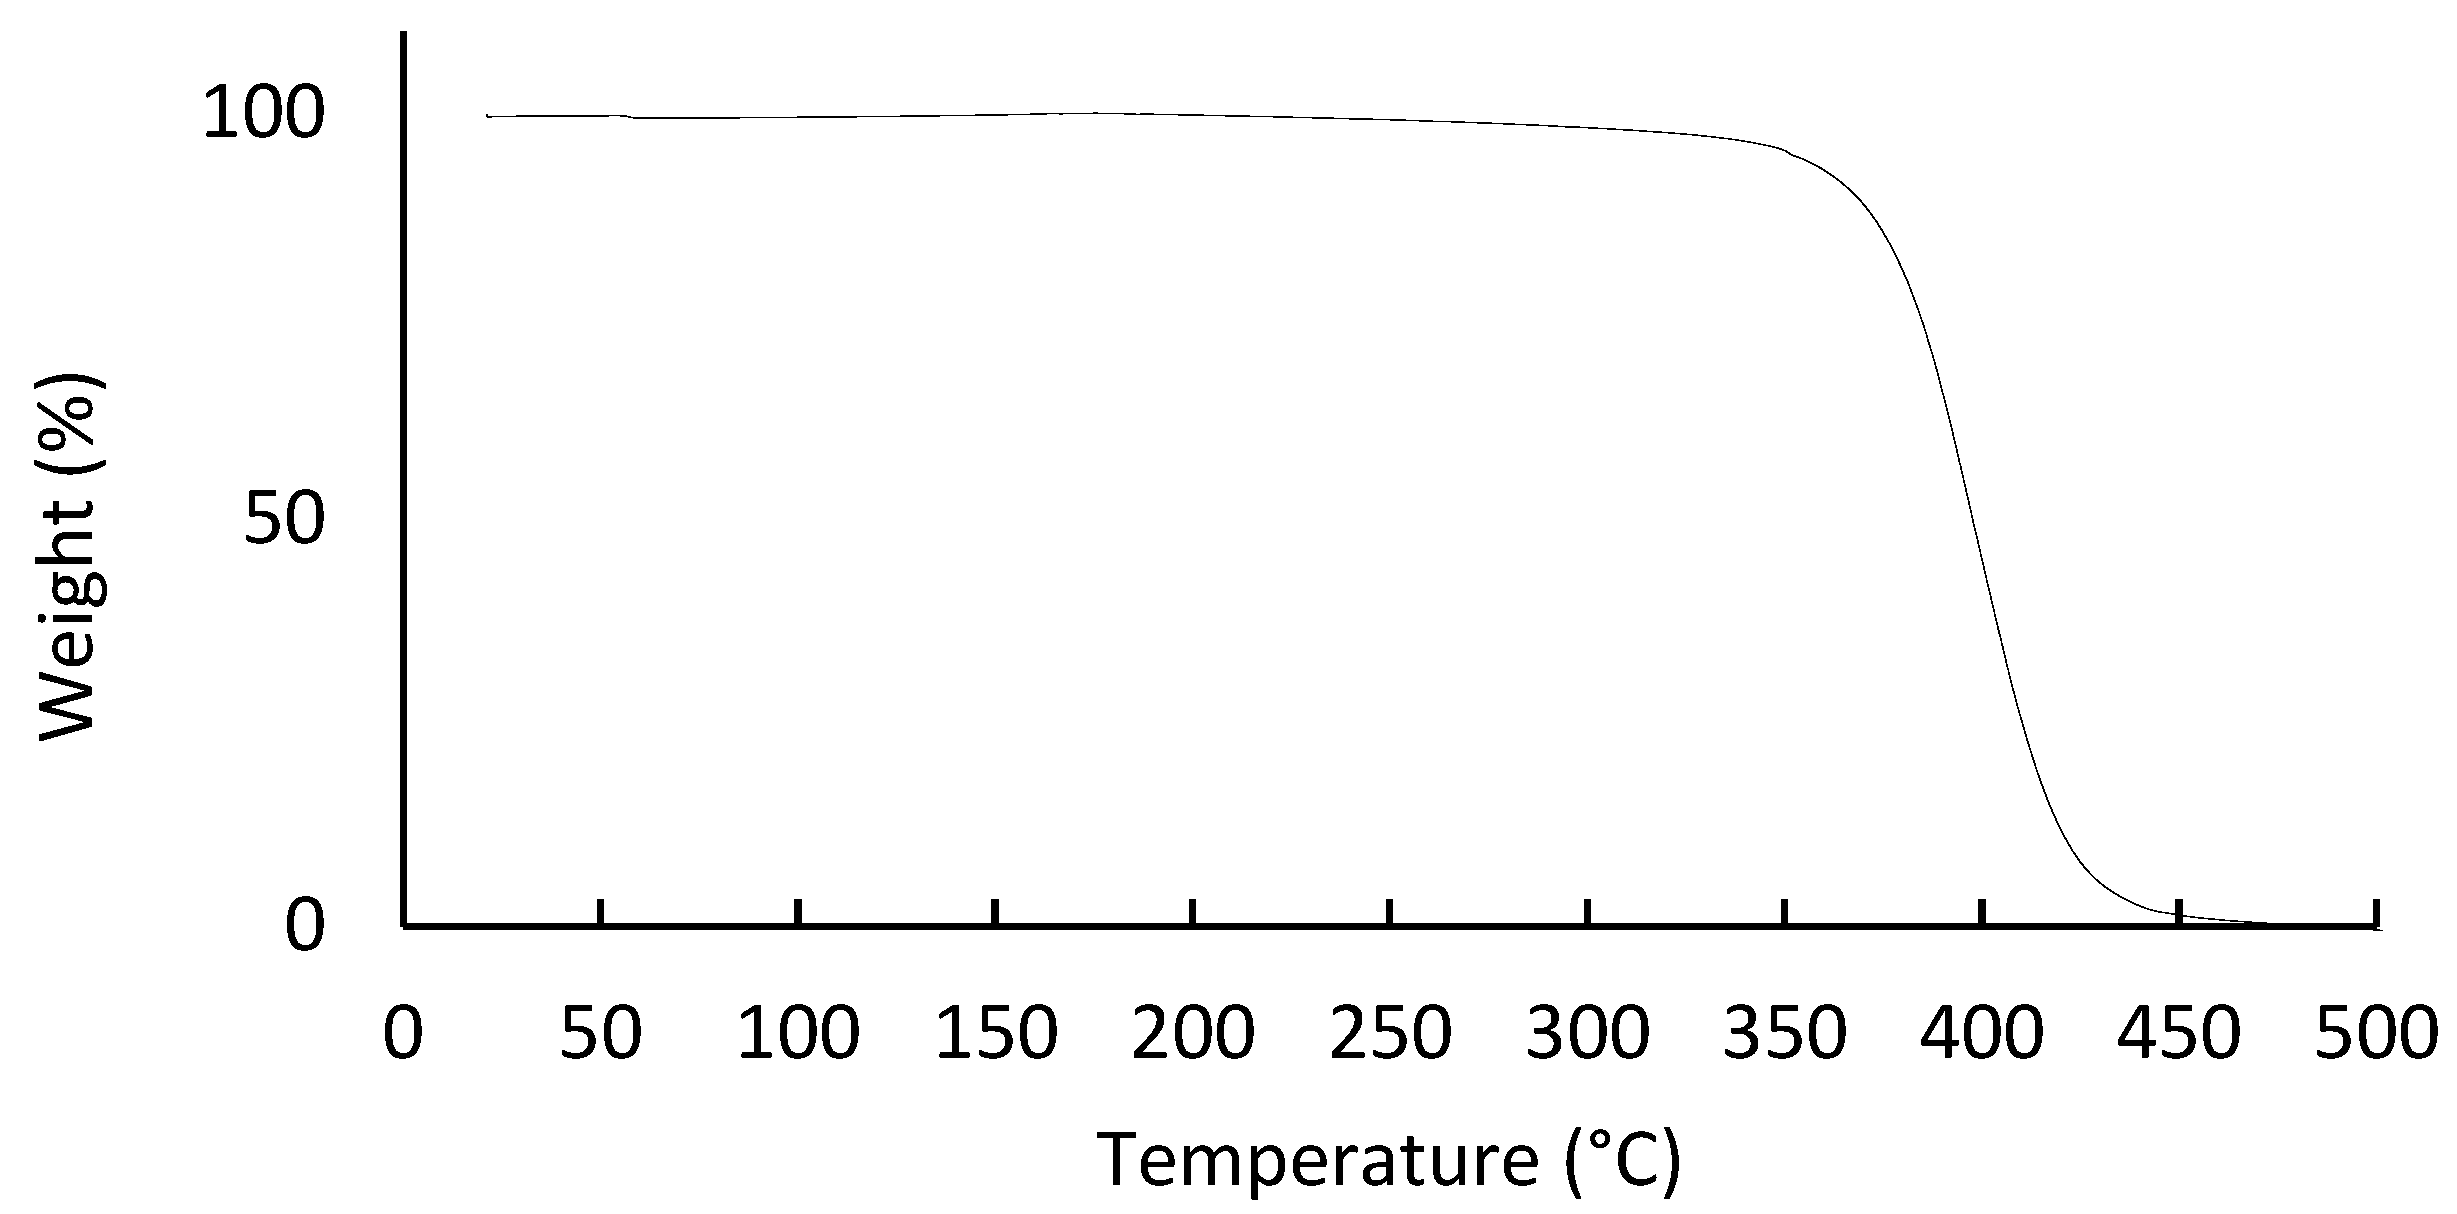
3.1.2. Thermogravimetric Analysis
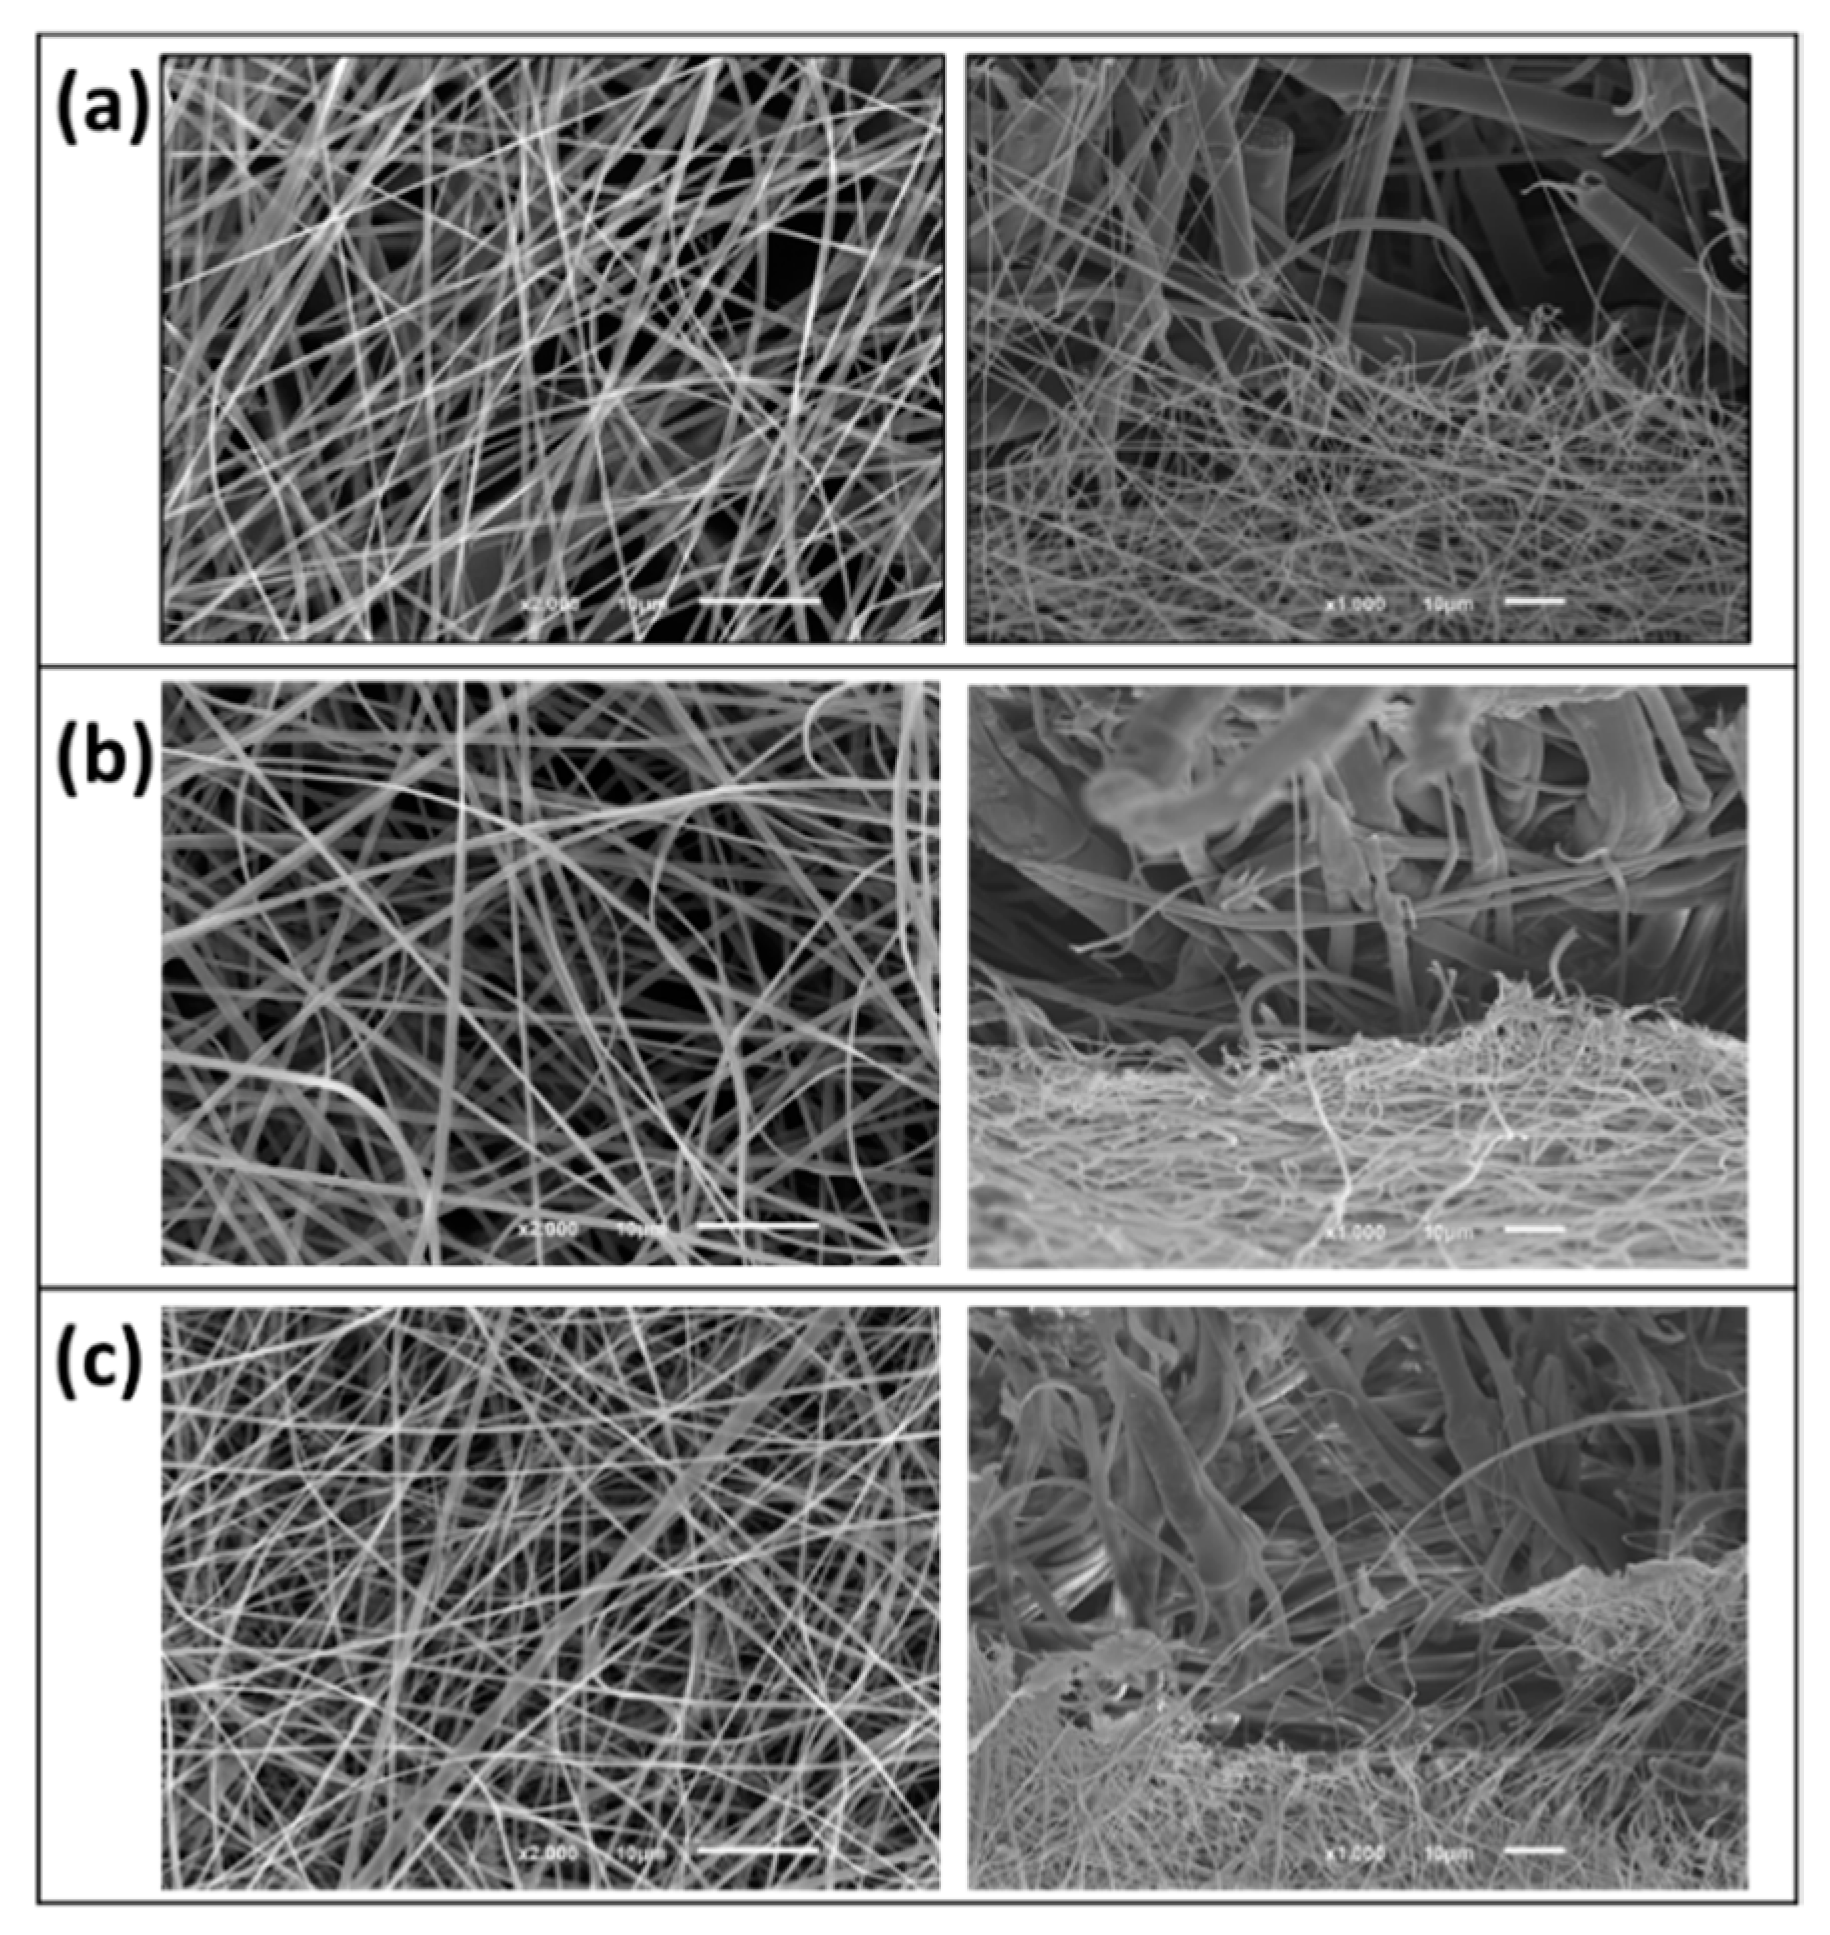
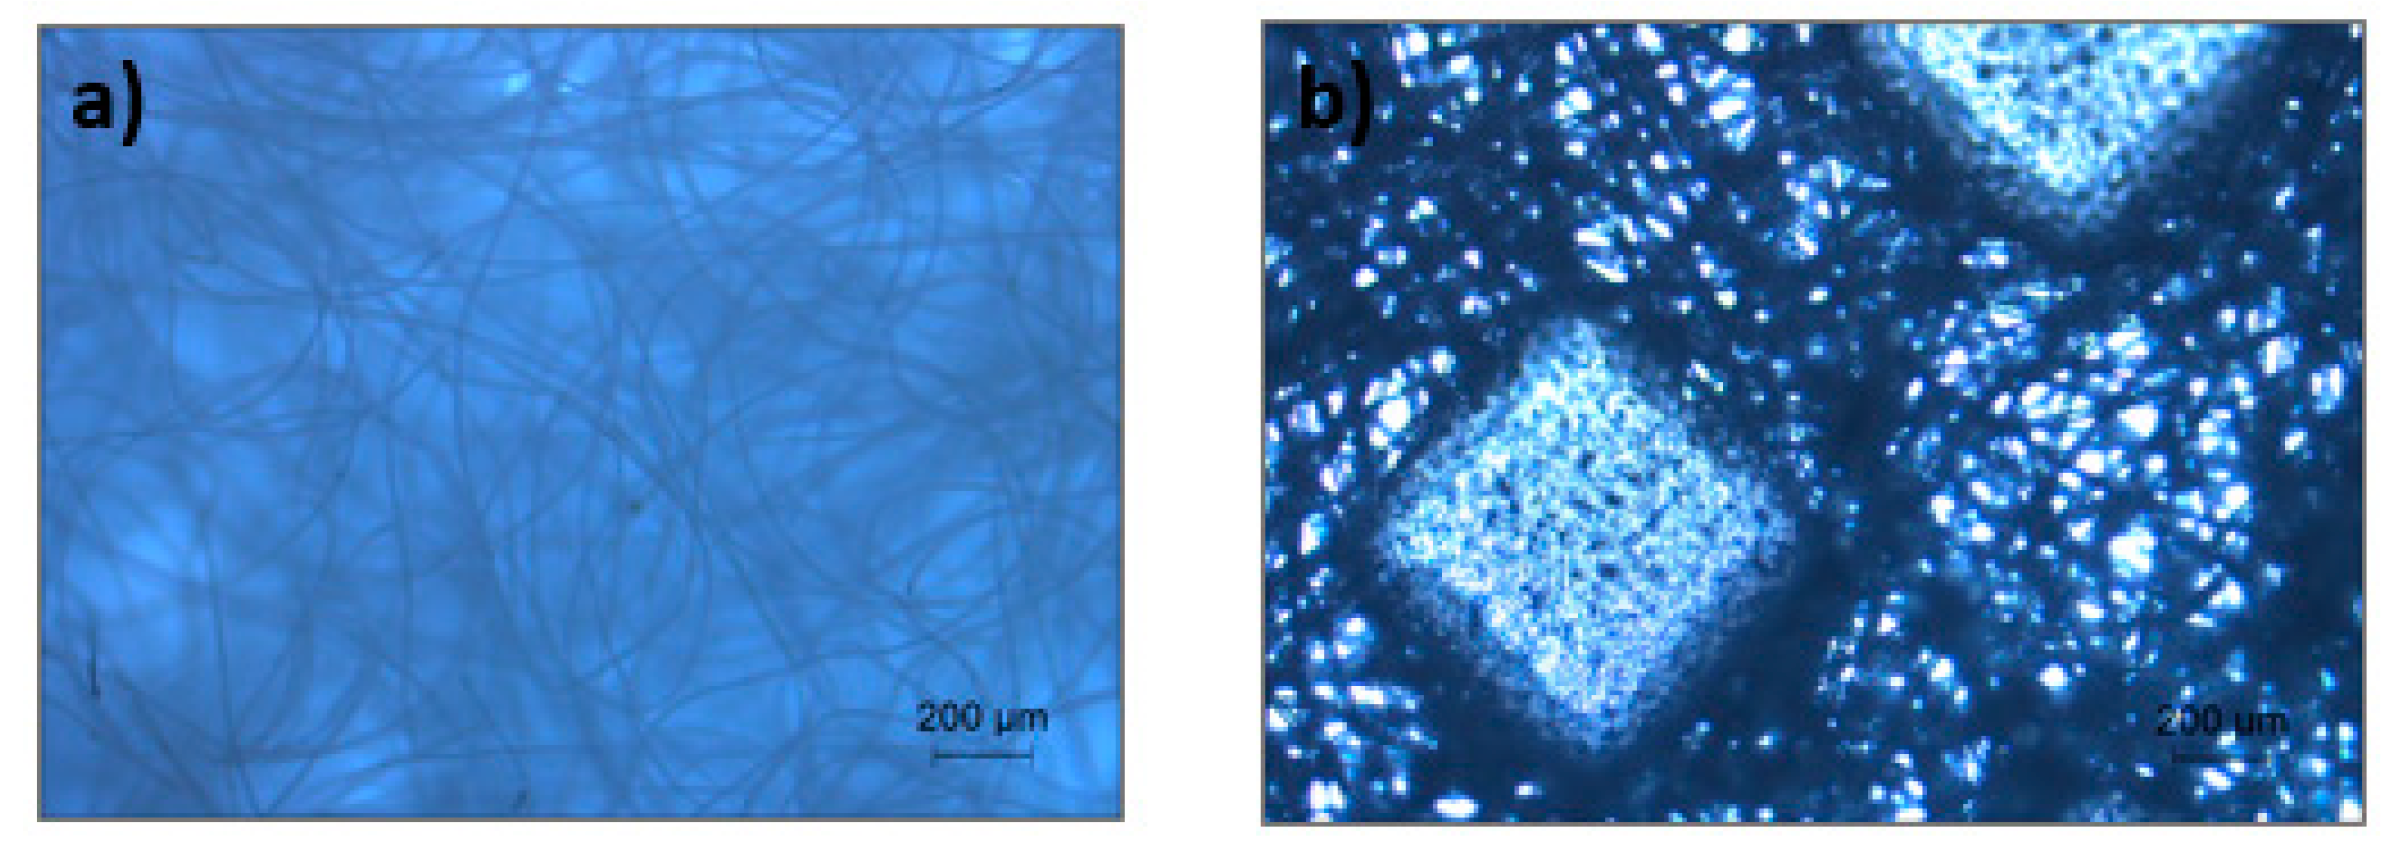
3.1.3. Morphological Analysis
3.2. Electrospun PA + Non-Woven Fabrics Characterization
4. Conclusions
Author Contributions
Funding
Institutional Review Board Statement
Informed Consent Statement
Data Availability Statement
Conflicts of Interest
References
- Harrison, R.M.; Yin, J. Particulate matter in the atmosphere: Which particle properties are important for its effects on health? Sci. Total Environ. 2000, 249, 85–101. [Google Scholar] [CrossRef]
- Li, H.; Wang, Z.; Zhang, H.; Pan, Z. Nanoporous PLA/(Chitosan Nanoparticle) Composite Fibrous Membranes with Excellent Air Filtration and Antibacterial Performance. Polymers 2018, 10, 1085. [Google Scholar] [CrossRef] [PubMed] [Green Version]
- Park, K.; Kang, S.; Park, J.-W.; Hwang, J. Fabrication of silver nanowire coated fibrous air filter medium via a two-step process of electrospinning and electrospray for anti-bioaerosol treatment. J. Hazard. Mater. 2021, 411, 125043. [Google Scholar] [CrossRef] [PubMed]
- Gorji, M.; Bagherzadeh, R.; Fashandi, H. Electrospun nanofibers in protective clothing. In Electrospun Nanofibers; Elsevier Ltd.: Amsterdam, The Netherlands, 2017; pp. 571–598. [Google Scholar]
- Tebyetekerwa, M.; Xu, Z.; Yang, S.; Ramakrishna, S. Electrospun Nanofibers-Based Face Masks. Adv. Fiber Mater. 2020, 2, 161–166. [Google Scholar] [CrossRef]
- Selvam, A.K.; Nallathambi, G. Polyacrylonitrile/silver nanoparticle electrospun nanocomposite matrix for bacterial filtration. Fibers Polym. 2015, 16, 1327–1335. [Google Scholar] [CrossRef]
- Tcharkhtchi, A.; Abbasnezhad, N.; Seydani, M.Z.; Zirak, N.; Farzaneh, S.; Shirinbayan, M. An overview of filtration efficiency through the masks: Mechanisms of the aerosols penetration. Bioact. Mater. 2020, 6, 106–122. [Google Scholar] [CrossRef] [PubMed]
- Adanur, S.; Jayswal, A. Filtration mechanisms and manufacturing methods of face masks: An overview. J. Ind. Text. 2020, 1–35. [Google Scholar] [CrossRef]
- Srikrishnarka, P.; Kumar, V.; Ahuja, T.; Subramanian, V.; Selvam, A.K.; Bose, P.; Jenifer, S.K.; Mahendranath, A.; Ganayee, M.A.; Nagarajan, R.; et al. Enhanced Capture of Particulate Matter by Molecularly Charged Electrospun Nanofibers. ACS Sustain. Chem. Eng. 2020, 8, 7762–7773. [Google Scholar] [CrossRef]
- Barhate, R.S.; Ramakrishna, S. Nanofibrous filtering media: Filtration problems and solutions from tiny materials. J. Membr. Sci. 2007, 296, 1–8. [Google Scholar] [CrossRef]
- Bazgir, M.; Zhang, W.; Zhang, X.; Elies, J.; Saeinasab, M.; Coates, P.; Youseffi, M.; Sefat, F. Fabrication and Characterization of PCL/PLGA Coaxial and Bilayer Fibrous Scaffolds for Tissue Engineering. Materials 2021, 14, 6295. [Google Scholar] [CrossRef] [PubMed]
- Khandaker, M.; Progri, H.; Arasu, D.; Nikfarjam, S.; Shamim, N. Use of Polycaprolactone Electrospun Nanofiber Mesh in a Face Mask. Materials 2021, 14, 4272. [Google Scholar] [CrossRef] [PubMed]
- Qin, X.; Subianto, S. Electrospun Nanofibers for Filtration Applications; Elsevier Ltd.: Amsterdam, The Netherlands, 2017; pp. 449–466. [Google Scholar] [CrossRef]
- Xue, J.; Wu, T.; Dai, Y.; Xia, Y. Electrospinning and electrospun nanofibers: Methods, materials, and applications. Chem. Rev. 2019, 119, 5298–5415. [Google Scholar] [CrossRef] [PubMed]
- Yang, Y.; Li, B.; Chen, Z.; Sui, N.; Chen, Z.; Xu, T.; Li, Y.; Fu, R.; Jing, Y. Sound insulation of multi-layer glass-fiber felts: Role of morphology. Text. Res. J. 2016, 87, 261–269. [Google Scholar] [CrossRef]
- Wu, S.; Wang, B.; Zheng, G.; Liu, S.; Dai, K.; Liu, C.; Shen, C. Preparation and characterization of macroscopically electrospun polyamide 66 nanofiber bundles. Mater. Lett. 2014, 124, 77–80. [Google Scholar] [CrossRef]
- Heikkilä, P.; Taipale, A.; Lehtimäki, M.; Harlin, A. Electrospinning of polyamides with different chain compositions for filtration application. Polym. Eng. Sci. 2008, 48, 1168–1176. [Google Scholar] [CrossRef]
- Matulevicius, J.; Kliucininkas, L.; Martuzevicius, D.; Krugly, E.; Tichonovas, M.; Baltrusaitis, J. Design and Characterization of Electrospun Polyamide Nanofiber Media for Air Filtration Applications. J. Nanomater. 2014, 2014, 859656. [Google Scholar] [CrossRef] [Green Version]
- Yun, K.M.; Hogan, C.J.; Matsubayashi, Y.; Kawabe, M.; Iskandar, F.; Okuyama, K. Nanoparticle filtration by electrospun polymer fibers. Chem. Eng. Sci. 2007, 62, 4751–4759. [Google Scholar] [CrossRef]
- Pais, V.; Navarro, M.; Guise, C.; Martins, R.; Fangueiro, R. Hydrophobic performance of electrospun fibers functionalized with TiO2 nanoparticles. Text. Res. J. 2021. [Google Scholar] [CrossRef]
- Francavilla, P.; Ferreira, D.P.; Araújo, J.C.; Fangueiro, R. Smart Fibrous Structures Produced by Electrospinning Using the Combined Effect of PCL/Graphene Nanoplatelets. Appl. Sci. 2021, 11, 1124. [Google Scholar] [CrossRef]
- Zarshenas, K.; Raisi, A.; Aroujalian, A. Surface modification of polyamide composite membranes by corona air plasma for gas separation applications. RSC Adv. 2015, 5, 19760–19772. [Google Scholar] [CrossRef]
- Charles, J.; Ramkumaar, G.R.; Azhagiri, S.; Gunasekaran, S. FTIR and Thermal Studies on Nylon-66 and 30% Glass Fibre Reinforced Nylon-66. E-J. Chem. 2009, 6, 23–33. [Google Scholar] [CrossRef] [Green Version]
- Kang, E.; Kim, M.; Oh, J.S.; Park, D.W.; Shim, S.E. Electrospun BMIMPF6/nylon 6,6 nanofiber chemiresistors as organic vapour sensors. Macromol. Res. 2012, 20, 372–378. [Google Scholar] [CrossRef]
- Díaz-Alejo, L.A.; Menchaca-Campos, C.; Chavarín, J.U.; Sosa-Fonseca, R.; García-Sánchez, M.A. Effects of the Addition of Ortho- and Para-NH2 Substituted Tetraphenylporphyrins on the Structure of Nylon 66. Int. J. Polym. Sci. 2013, 2013, 323854. [Google Scholar] [CrossRef] [Green Version]
- Biglari, M.J.; Rahbar, R.S.; Shabanian, M.; Khonakdar, H.A. Novel composite nanofibers based on polyamide 66/graphene oxide- grafted aliphatic- aromatic polyamide: Preparation and characterization. Polym. Technol. Mater. 2018, 58, 879–888. [Google Scholar] [CrossRef]
- Nguyen, T.N.M.; Moon, J.; Kim, J.J. Microstructure and mechanical properties of hardened cement paste including Nylon 66 nanofibers. Constr. Build. Mater. 2020, 232, 117134. [Google Scholar] [CrossRef]
- Xiao, L.; Xu, L.; Yang, Y.; Zhang, S.; Huang, Y.; Bielawski, C.W.; Geng, J. Core–Shell Structured Polyamide 66 Nanofibers with Enhanced Flame Retardancy. ACS Omega 2017, 2, 2665–2671. [Google Scholar] [CrossRef] [PubMed] [Green Version]
- De Vrieze, S.; Westbroek, P.; Van Camp, T.; van Langenhove, L. Electrospinning of chitosan nanofibrous structures: Feasibility study. J. Mater. Sci. 2007, 42, 8029–8034. [Google Scholar] [CrossRef]
- C.R.E. 2020/403. Co-Ordination of Notified Bodies PPE Regulation 2016/425. 2020. Available online: https://eur-lex.europa.eu/legal-content/EN/TXT/?uri=CELEX:32016R0425 (accessed on 18 November 2021).


| Mechanisms of Filtration | Size of Particles |
|---|---|
| Gravity sedimentation | Between 1 and 10 µm |
| Inertial impaction | Above 0.6 µm |
| Interception | Below 0.6 µm |
| Diffusion | Below 0.2 µm |
| Electrostatic attraction | Charged particles |
| Sample | Solution Parameters | Electrospinning Parameters | ||||
|---|---|---|---|---|---|---|
| Concentration (% (w/v)) | Solvent | Voltage (kV) | Collector-Needle Distance (mm) | Flow Rate (mL/h) | Needle-Diameter (mm) | |
| A | 20 | 100% FA | 28 | 100 | 0.4 | 0.33 |
| B | 0.8 | |||||
| C | 1 | |||||
| D | 0.4 | 0.41 | ||||
| E | 0.8 | |||||
| F | 1 | |||||
| G | 1 | 0.61 | ||||
| H | 2 | |||||
| I | 25 | 0.4 | 0.41 | |||
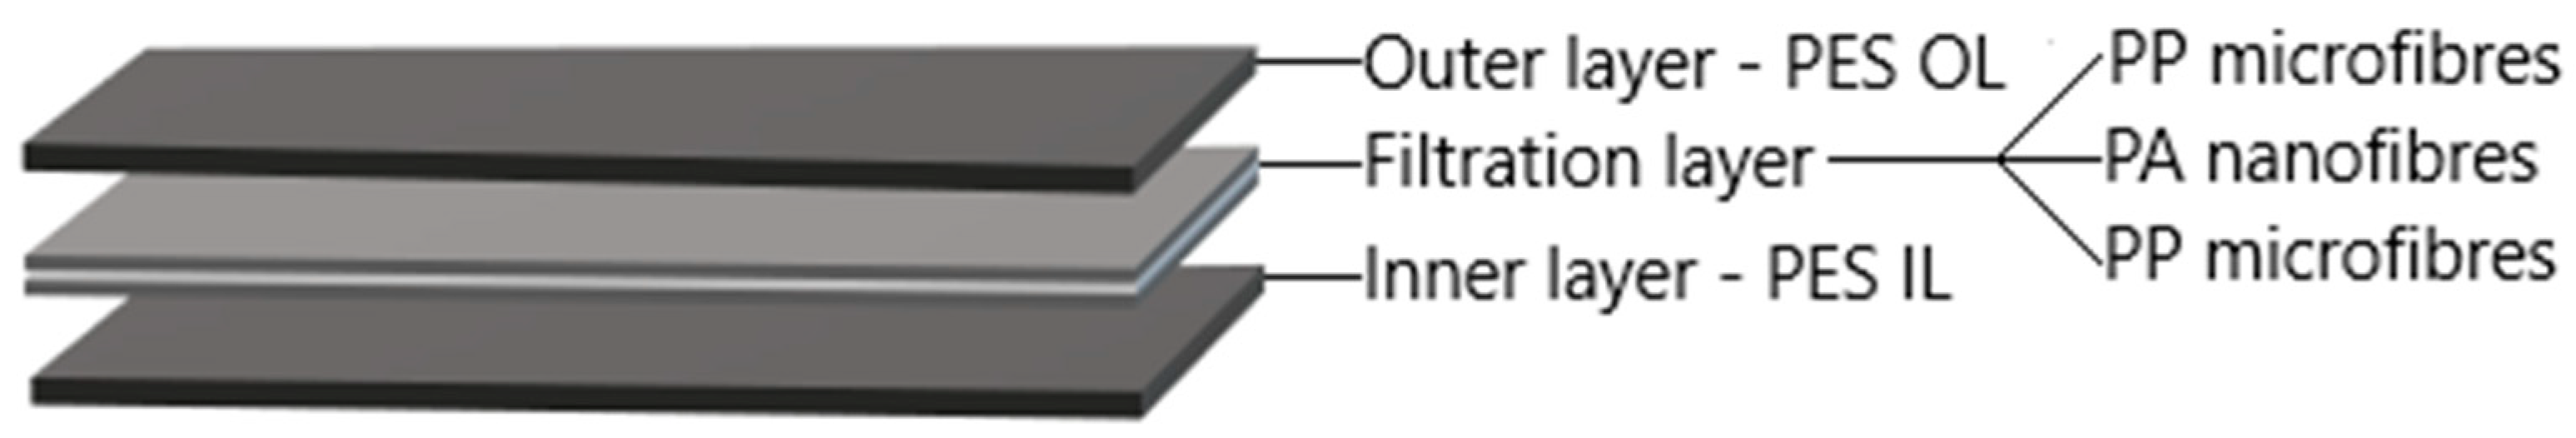
| Reference | Inner Layer | Filtration Layer | Outer Layer | PA Deposition Time |
|---|---|---|---|---|
| Multilayer_0 min | PES IL | PP microfibres/PP microfibres (Note: without PA nanofibres) | PES OL | 0 min |
| Multilayer _10 min | PP microfibres/PA (10 min)/PP microfibres | 10 min | ||
| Multilayer _20 min | PP microfibres/PA nanofibres (20 min)/PP microfibres | 20 min | ||
| Multilayer _30 min | PP microfibres/PA nanofibres (30 min)/PP microfibres | 30 min |
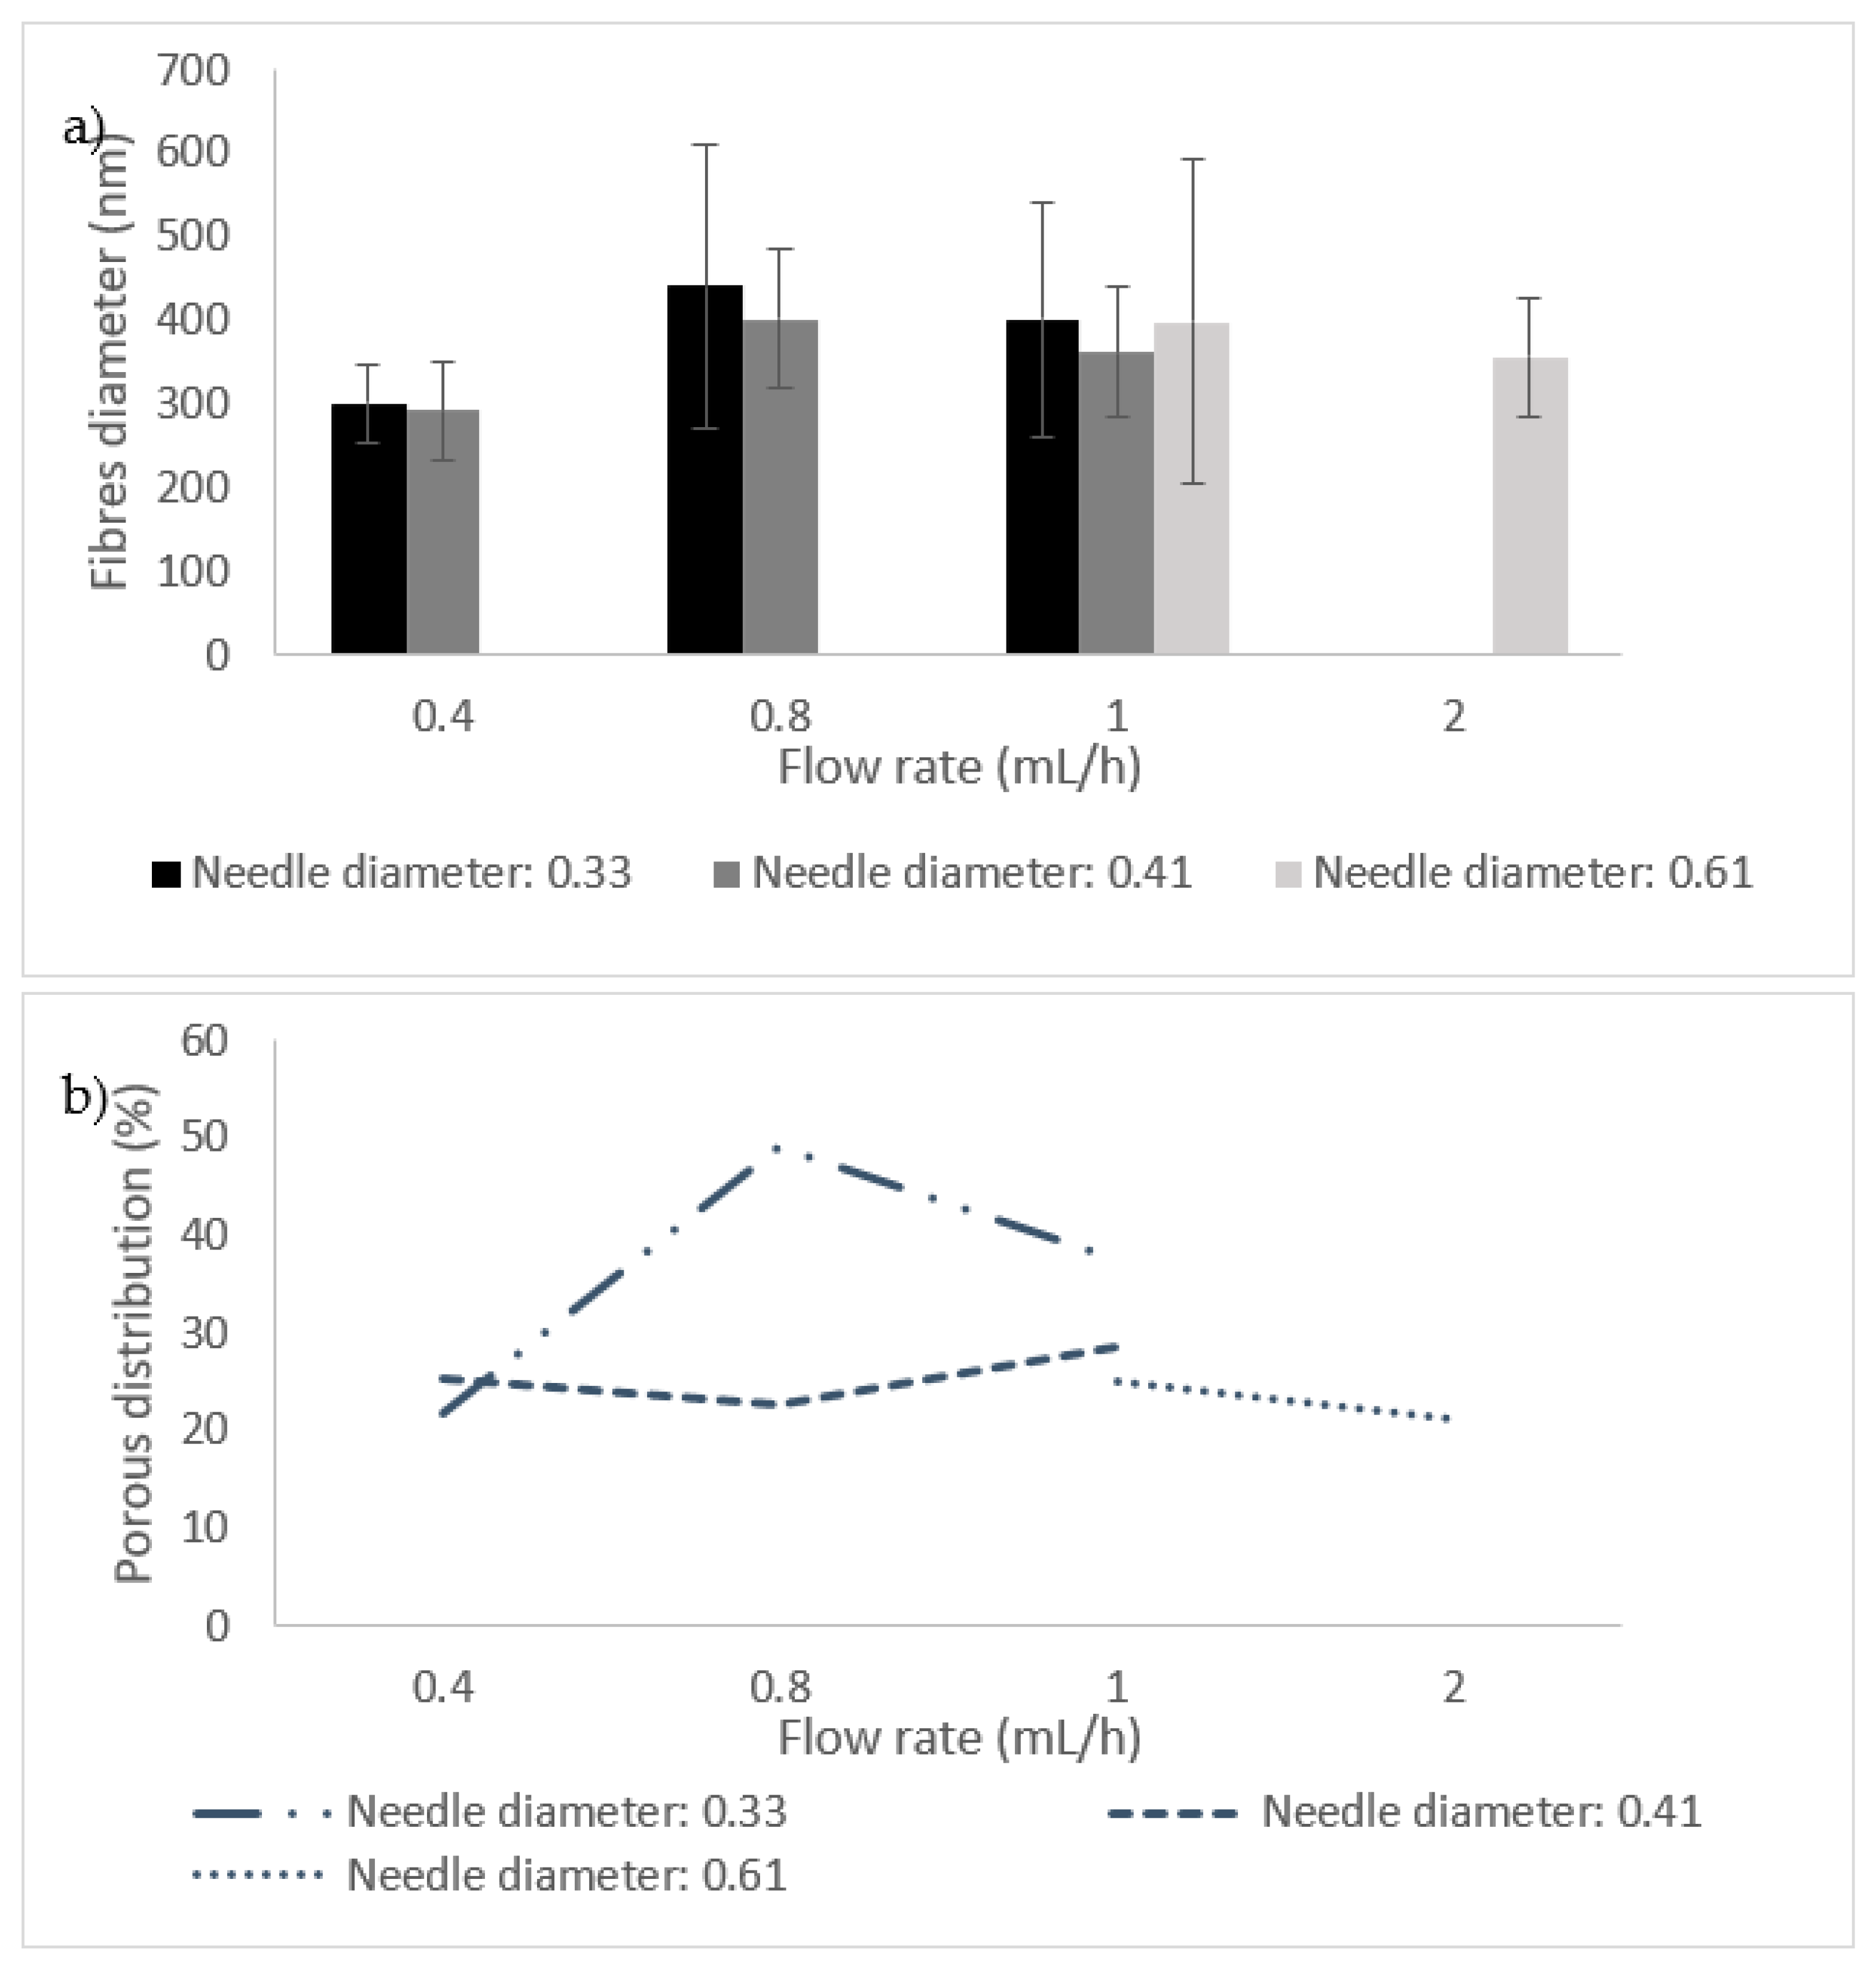
| Sample and Production Parameters | SEM Images (×1000) | SEM Images (×5000) | Fiber Diameter ± STDEV (nm) | Porous Distribution (%) |
|---|---|---|---|---|
| A Flow rate = 0.4 mL/h Needle-diameter = 0.33 mm | 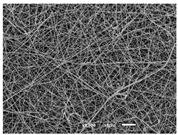 | 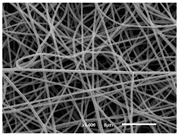 | 302 ± 46 | 21.66 |
| B Flow rate = 0.8 mL/h Needle-diameter = 0.33 mm | 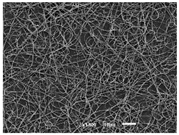 |  | 442 ± 170 | 48.97 |
| C Flow rate = 1 mL/h Needle-diameter = 0.33 mm | 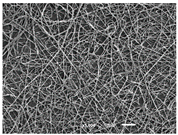 | 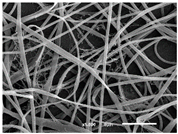 | 402 ± 141 | 37.50 |
| D Flow rate = 0.4 mL/h Needle-diameter = 0.41 mm | 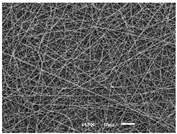 | 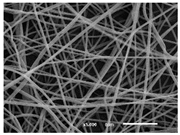 | 293 ± 60 | 25.27 |
| E Flow rate = 0.8 mL/h Needle-diameter = 0.41 mm | 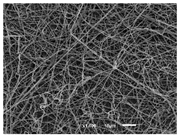 | 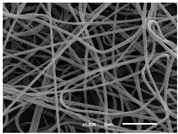 | 402 ± 84 | 22.71 |
| F Flow rate = 1 mL/h Needle-diameter = 0.41 mm |  | 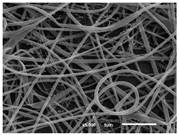 | 363 ± 80 | 28.57 |
| G Flow rate = 1 mL/h Needle-diameter = 0.61 mm | 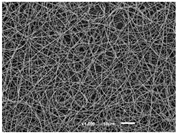 | 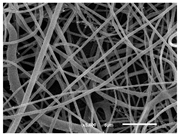 | 399 ± 193 | 25.09 |
| H Flow rate = 2 mL/h Needle-diameter = 0.61 mm |  |  | 356 ± 70 | 21.11 |
| I Flow rate = 0.4 mL/h Needle-diameter = 0.41 mm 25% (w/v) PA |  |  | 755 ± 711 | 56.05 |
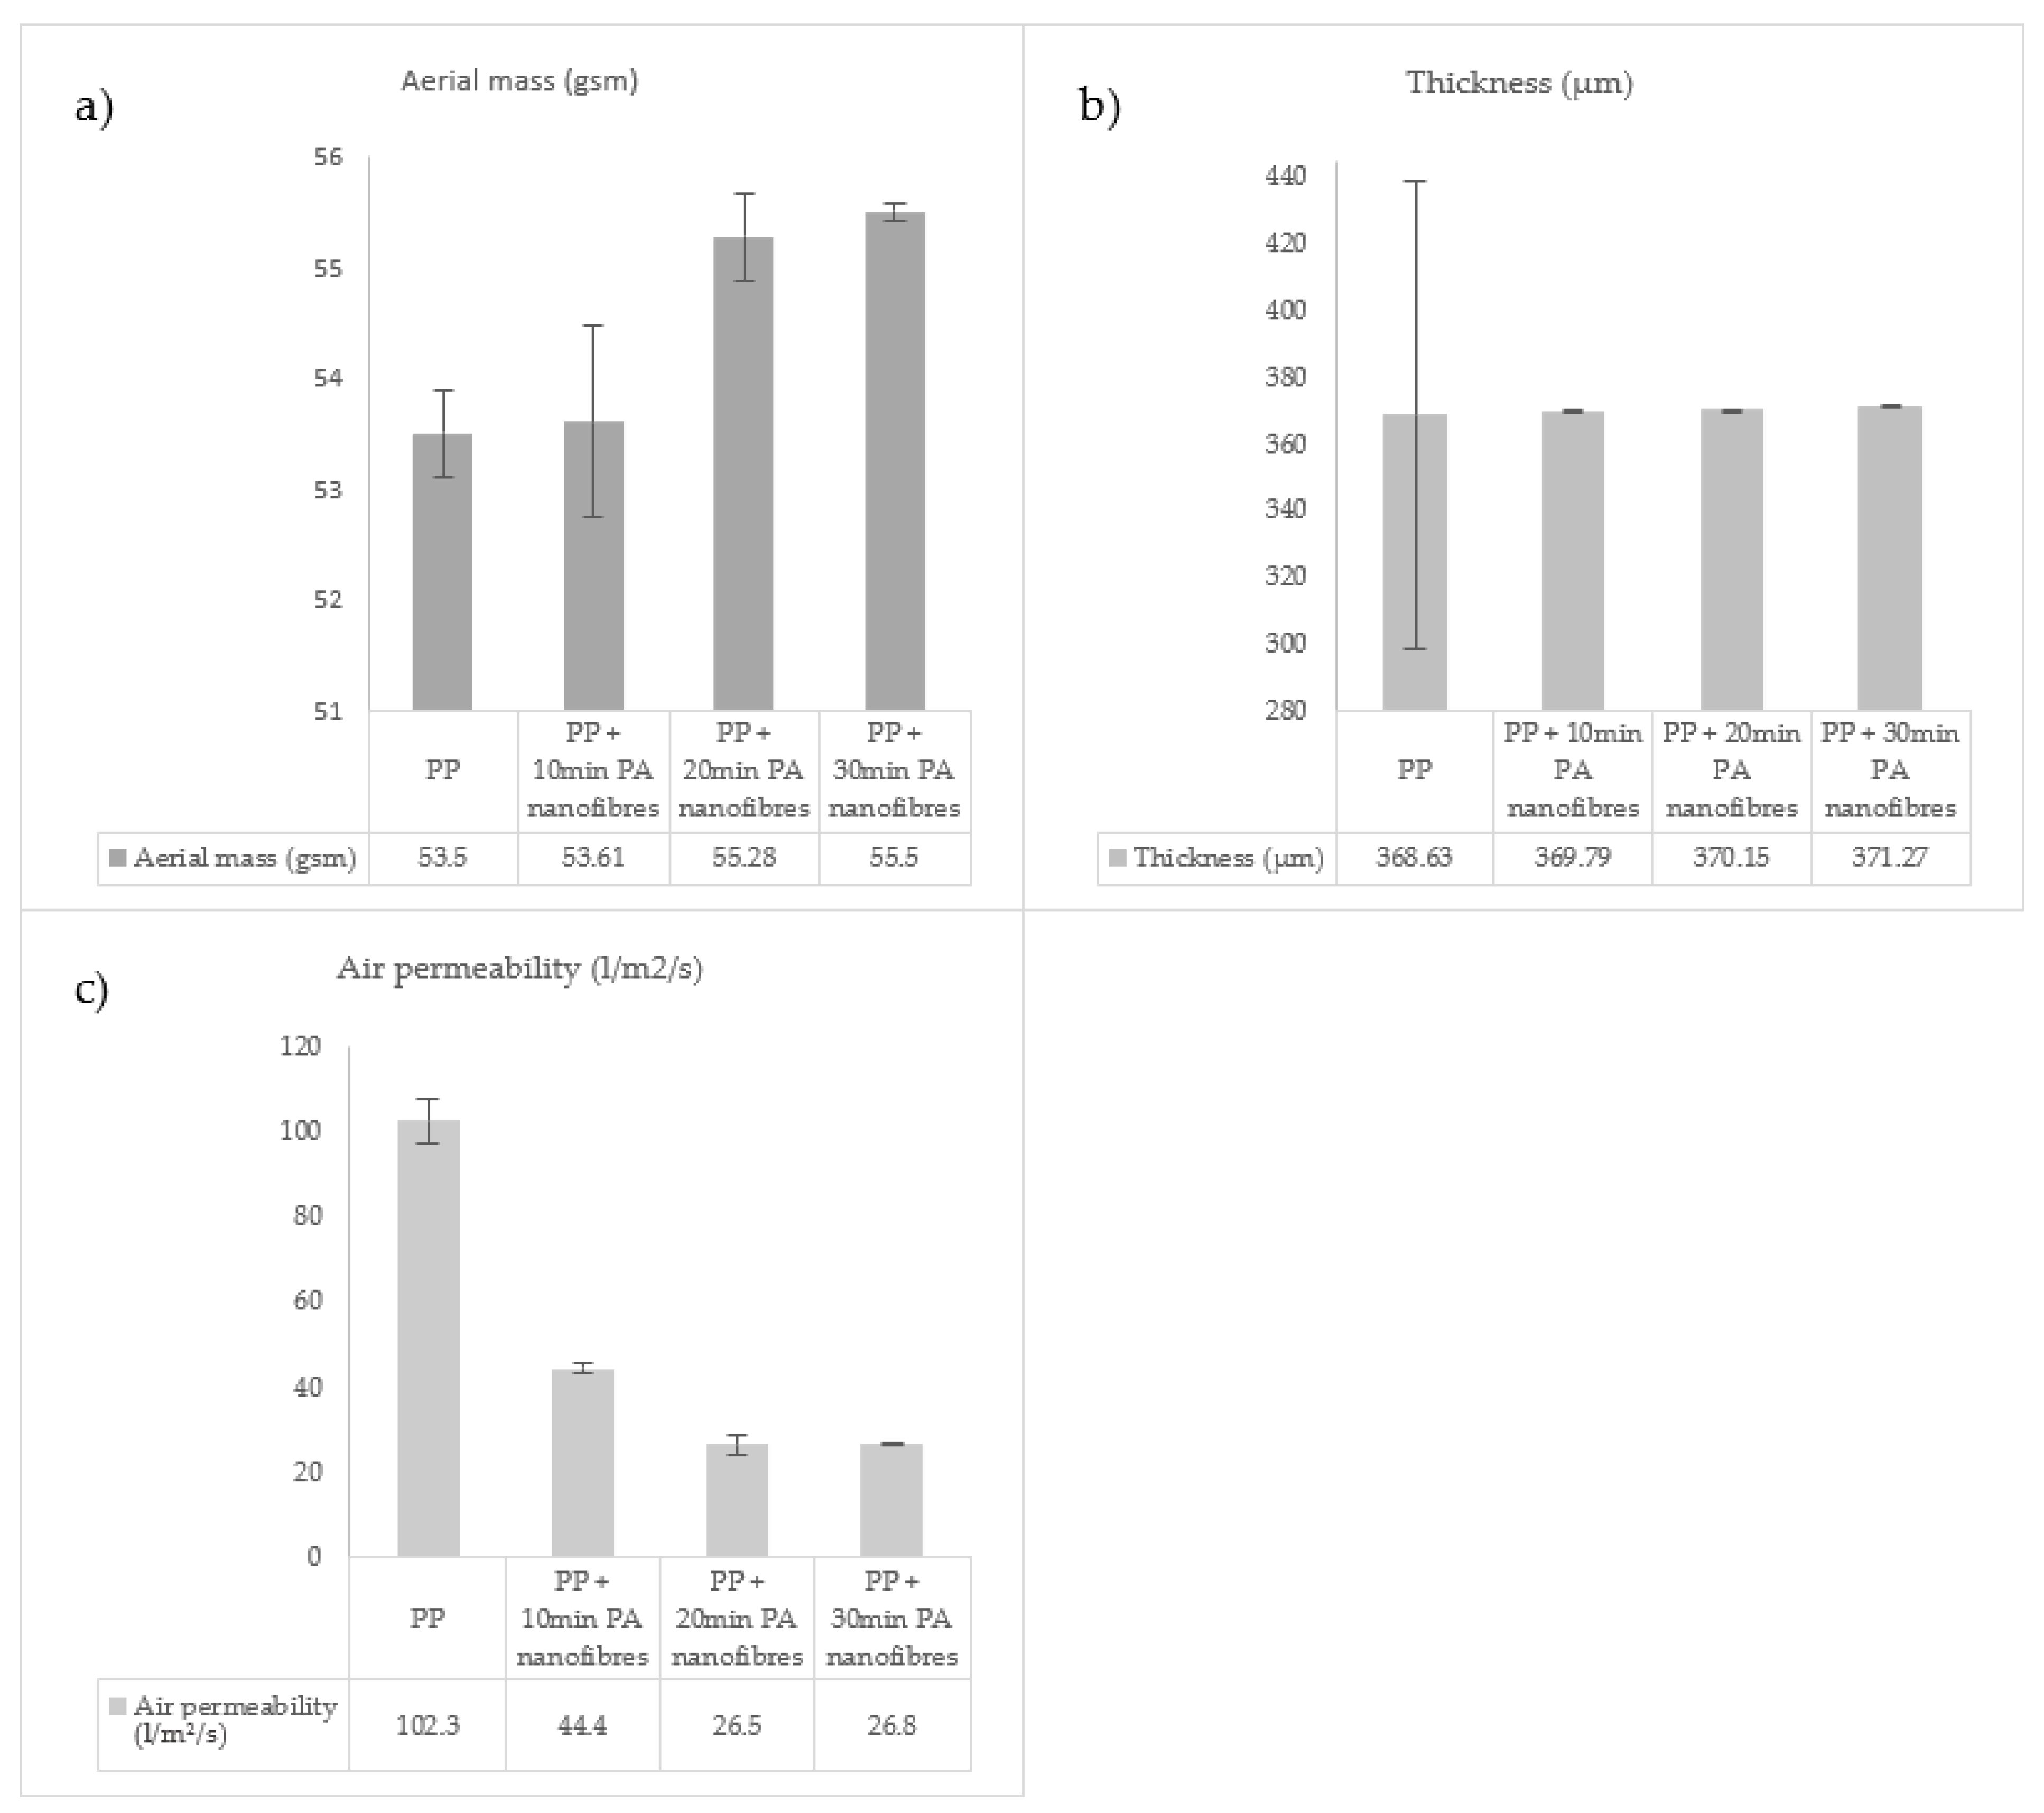
| Polymer | Average Fibres Diameter ± STDEV (µm) | Thickness (µm) | Air Permeability (L/m2/s) | Aerial Mass (gsm) |
|---|---|---|---|---|
| PP | 3.7 ± 1.5 | 368.3 | 102.3 | 53.5 |
| Sample: | Multilayer _0 min | Multilayer _10 min | Multilayer _20 min | Multilayer _30 min |
|---|---|---|---|---|
| Test | Result | |||
| Penetration of the filter material with sodium chloride after 3.5 min of exposure (%) | 15.39 | 7.83 | 5.90 | 7.11 |
| Respiratory resistance (mbar): Inhalation at 30 L/min | 0.37 | 0.66 | 0.65 | 0.66 |
| Respiratory resistance (mbar): Inhalation at 95 L/min | 1.53 | 2.23 | 2.33 | 2.34 |
| Respiratory resistance (mbar): Exhalation at 160 L/min | 2.36 | 3.73 | 3.62 | 4.09 |
Publisher’s Note: MDPI stays neutral with regard to jurisdictional claims in published maps and institutional affiliations. |
© 2021 by the authors. Licensee MDPI, Basel, Switzerland. This article is an open access article distributed under the terms and conditions of the Creative Commons Attribution (CC BY) license (https://creativecommons.org/licenses/by/4.0/).
Share and Cite
Pais, V.; Mota, C.; Bessa, J.; Dias, J.G.; Cunha, F.; Fangueiro, R. Study of the Filtration Performance of Multilayer and Multiscale Fibrous Structures. Materials 2021, 14, 7147. https://doi.org/10.3390/ma14237147
Pais V, Mota C, Bessa J, Dias JG, Cunha F, Fangueiro R. Study of the Filtration Performance of Multilayer and Multiscale Fibrous Structures. Materials. 2021; 14(23):7147. https://doi.org/10.3390/ma14237147
Chicago/Turabian StylePais, Vânia, Carlos Mota, João Bessa, José Guilherme Dias, Fernando Cunha, and Raul Fangueiro. 2021. "Study of the Filtration Performance of Multilayer and Multiscale Fibrous Structures" Materials 14, no. 23: 7147. https://doi.org/10.3390/ma14237147
APA StylePais, V., Mota, C., Bessa, J., Dias, J. G., Cunha, F., & Fangueiro, R. (2021). Study of the Filtration Performance of Multilayer and Multiscale Fibrous Structures. Materials, 14(23), 7147. https://doi.org/10.3390/ma14237147