
Remarkable Temperature Sensitivity of Partially Carbonized Carbon Fibers with Different Microstructures and Compositions


Abstract
:
1. Introduction
2. Materials and Methods
2.1. Carbonization of the Pre-Oxidized Fibers
2.2. Temperature Resistivity Measurements
2.3. Characterization
3. Result and Discussion
3.1. Temperature Sensitivity of the Fibers
3.2. The Effect of the Graphite-like Structure on the Temperature Sensitivity
3.3. The Effect of the Graphitization Degree on the Temperature Sensitivity
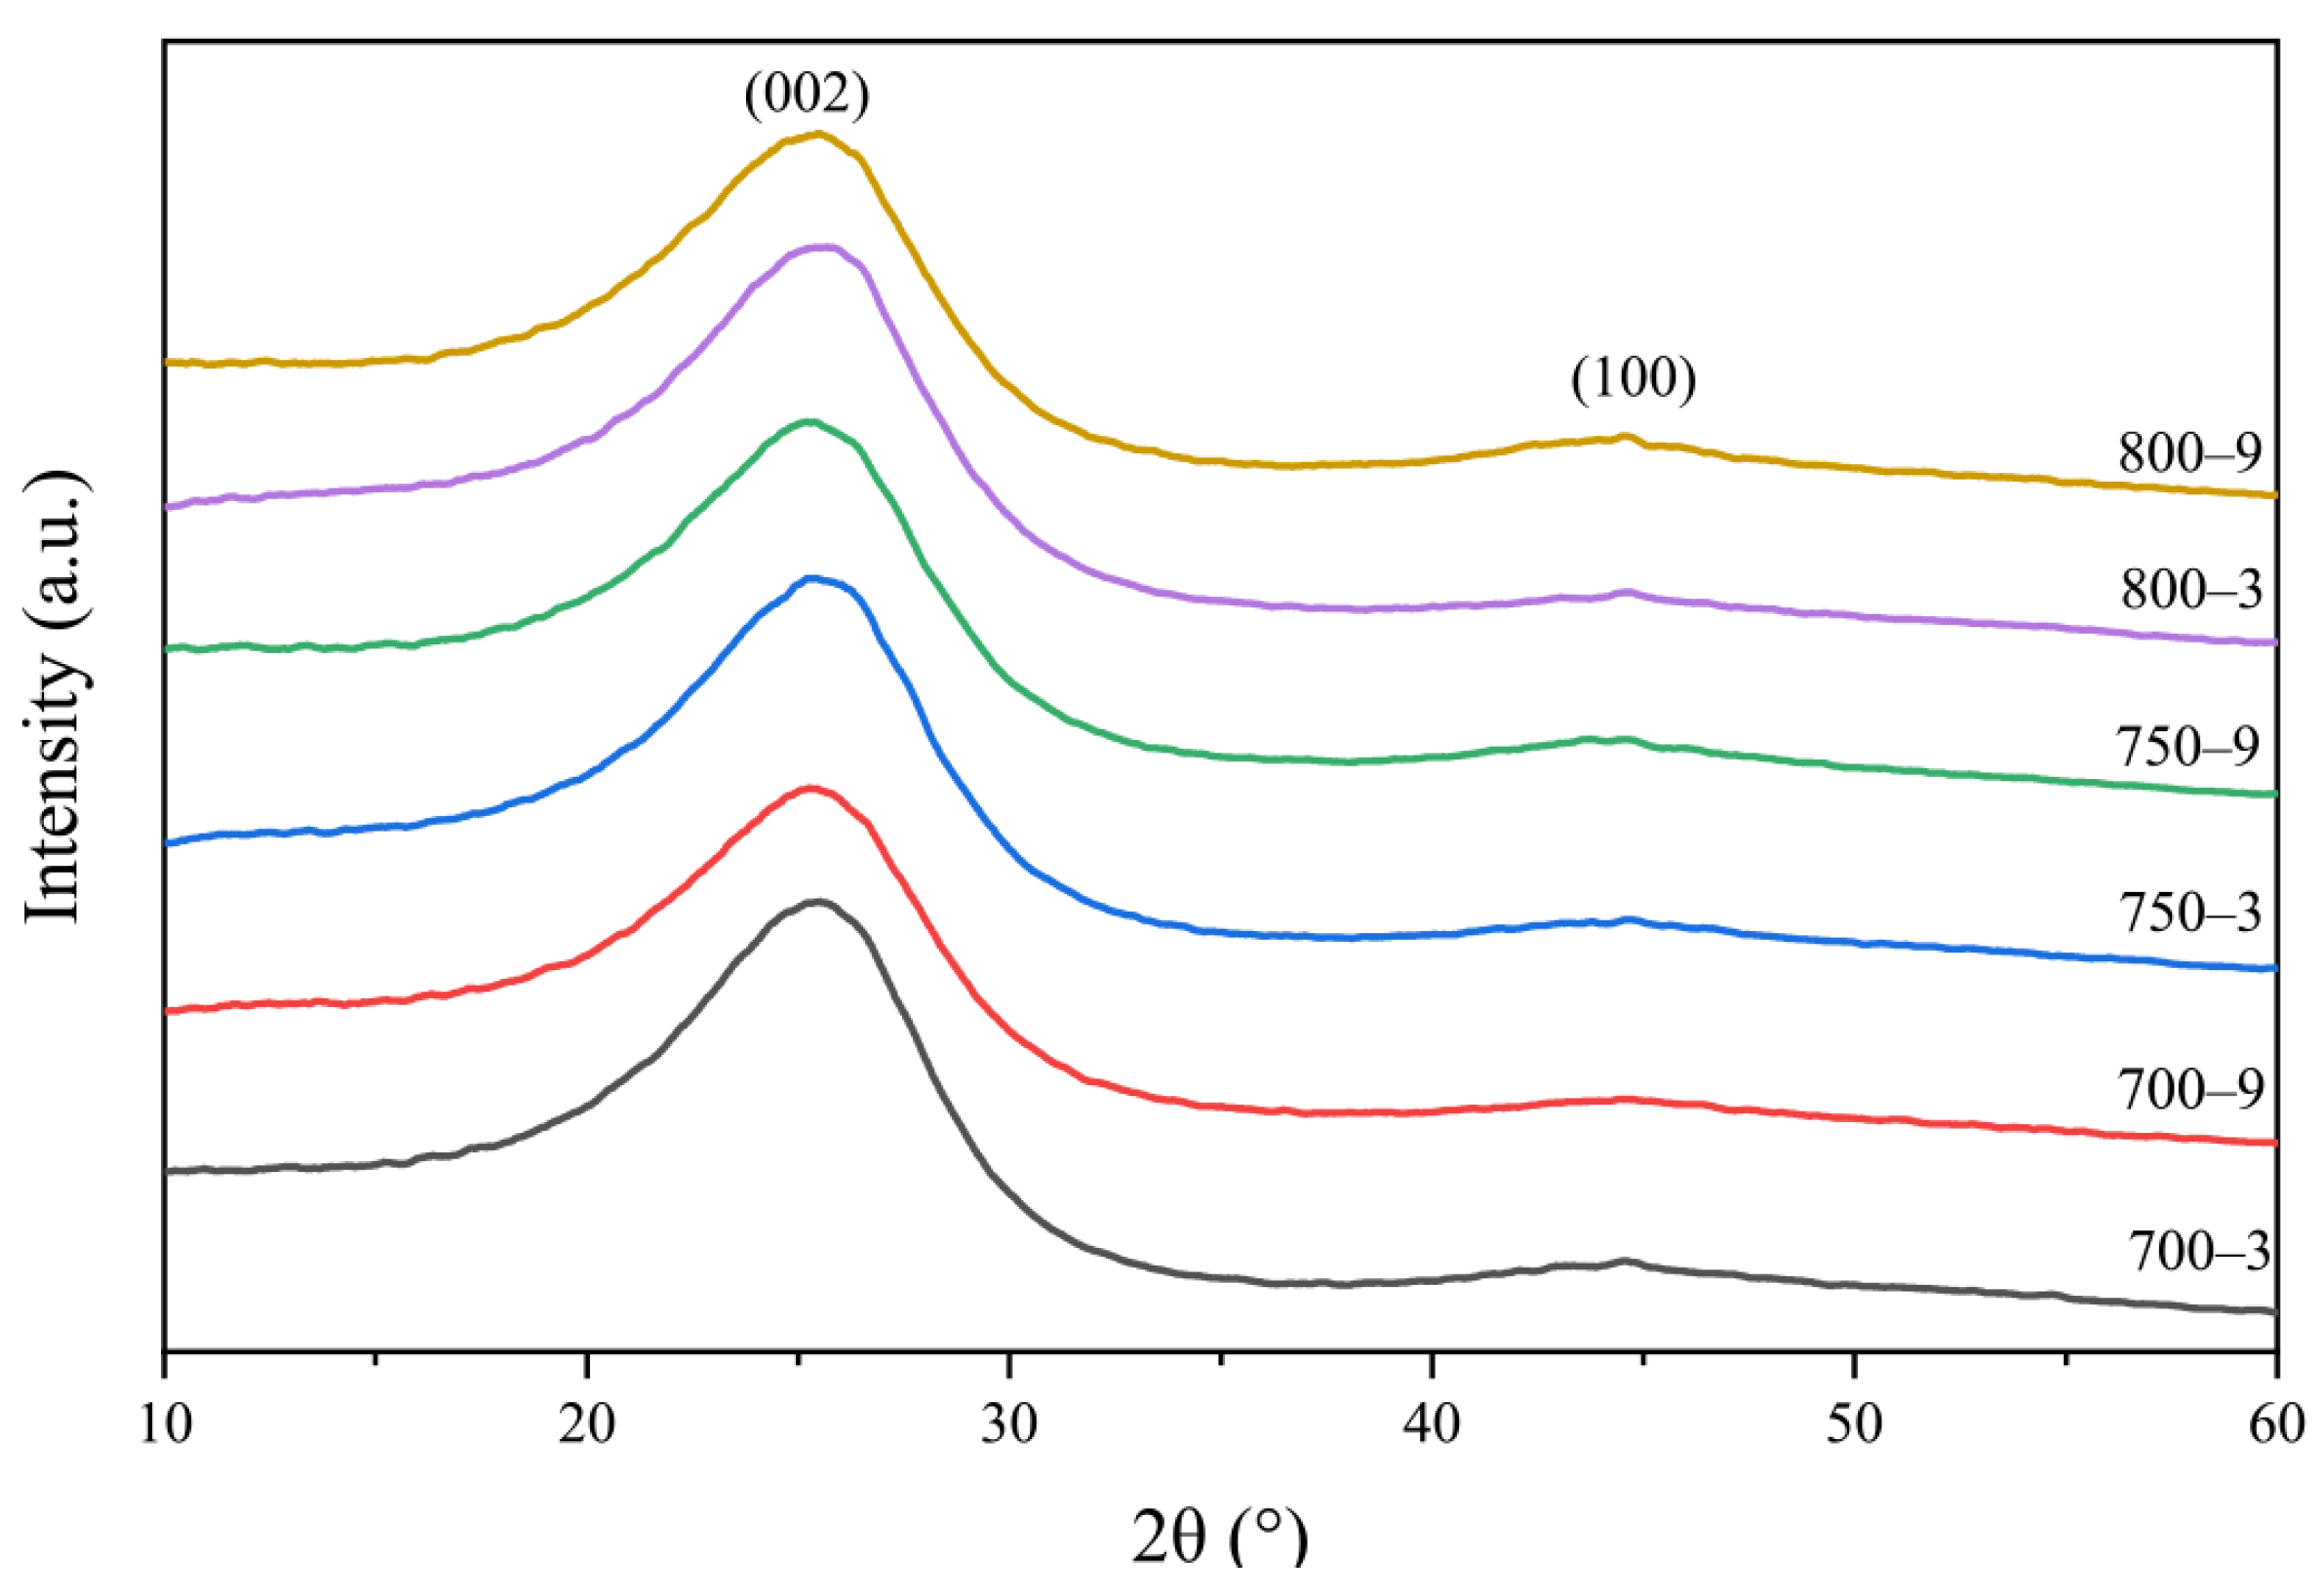
3.4. The Effect of the Graphite-like Crystallite Size on the Temperature Sensitivity
3.5. Structure–Temperature Sensitivity Relationships
4. Conclusions
Author Contributions
Funding
Institutional Review Board Statement
Informed Consent Statement
Data Availability Statement
Conflicts of Interest
References
- Newcomb, B.A. Processing, structure, and properties of carbon fibers. Compos. Part A Appl. Sci. Manuf. 2016, 91, 262–282. [Google Scholar] [CrossRef]
- Pradere, C.; Batsale, J.; Goyhénèche, J.; Pailler, R.; Dilhaire, S. Thermal properties of carbon fibers at very high temperature. Carbon 2009, 47, 737–743. [Google Scholar] [CrossRef]
- Frank, E.; Steudle, D.-C.L.M.; Ingildeev, D.; Spörl, D.-C.J.M.; Buchmeiser, M.R. Carbon Fibers: Precursor Systems, Processing, Structure, and Properties. Angew. Chem. Int. Ed. 2014, 53, 5262–5298. [Google Scholar] [CrossRef] [PubMed]
- Park, G.; Cudney, H.H.; Inman, D.J. An Integrated Health Monitoring Technique Using Structural Impedance Sensors. J. Intell. Mater. Syst. Struct. 2000, 11, 448–455. [Google Scholar] [CrossRef]
- Eddib, A.A.; Chung, D. Electric permittivity of carbon fiber. Carbon 2019, 143, 475–480. [Google Scholar] [CrossRef]
- Kim, I.H.; Im, T.H.; Lee, H.E.; Jang, J.; Wang, H.S.; Lee, G.Y.; Kim, I.; Lee, K.J.; Kim, S.O. Janus Graphene Liquid Crystalline Fiber with Tunable Properties Enabled by Ultrafast Flash Reduction. Small 2019, 15, 1901529. [Google Scholar] [CrossRef] [PubMed]
- Vomero, M.; Gueli, C.; Zucchini, E.; Fadiga, L.; Erhardt, J.B.; Sharma, S.; Stieglitz, T. Flexible Bioelectronic Devices Based on Micropatterned Monolithic Carbon Fiber Mats. Adv. Mater. Technol. 2019, 5, 1900713. [Google Scholar] [CrossRef] [Green Version]
- Simonenko, E.P.; Nikolaev, V.A.; Papynov, E.; Shichalin, O.O.; Gridasova, E.A.; Maiorov, V.Y.; Grishin, A.V.; Sevastyanov, V.G.; Kuznetsov, N.T. Sol–Gel Synthesis of Functionally Graded SiC–TiC Ceramic Material. Russ. J. Inorg. Chem. 2019, 64, 1456–1463. [Google Scholar] [CrossRef]
- Zavjalov, A.P.; Nikiforov, P.A.; Kosyanov, D.Y.; Zakharenko, A.M.; Trukhin, V.O.; Talskikh, K.Y.; Shichalin, O.O.; Papynov, E.K. Phase Formation and Densification Peculiarities of Hf–C–N Solid Solution Ceramics during Reactive Spark Plasma Sintering. Adv. Eng. Mater. 2020, 22, 2000482. [Google Scholar] [CrossRef]
- Papynov, E.K.; Shichalin, O.O.; Apanasevich, V.I.; Afonin, I.S.; Evdokimov, I.O.; Mayorov, V.; Portnyagin, A.S.; Agafonova, I.G.; Skurikhina, Y.; Medkov, M.A. Synthetic CaSiO3 sol-gel powder and SPS ceramic derivatives: “In vivo” toxicity assessment. Prog. Nat. Sci. 2019, 29, 569–575. [Google Scholar] [CrossRef]
- Buravlev, I.; Shichalin, O.; Papynov, E.; Golub, A.; Gridasova, E.; Buravleva, A.; Yagofarov, V.; Dvornik, M.; Fedorets, A.; Reva, V.; et al. WC-5TiC-10Co hard metal alloy fabrication via mechanochemical and SPS techniques. Int. J. Refract. Met. Hard Mater. 2021, 94, 105385. [Google Scholar] [CrossRef]
- Simonenko, E.P.; Simonenko, N.P.; Simonenko, T.; Grishin, A.V.; Tal’Skikh, K.Y.; Gridasova, E.A.; Papynov, E.K.; Shichalin, O.O.; Sevastyanov, V.G.; Kuznetsov, N.T. Sol-gel synthesis of SiC@Y3Al5O12 composite nanopowder and preparation of porous SiC-ceramics derived from it. Mater. Chem. Phys. 2019, 235, 121734. [Google Scholar] [CrossRef]
- Shapkin, N.P.; Papynov, E.K.; Shichalin, O.O.; Buravlev, I.Y.; Simonenko, E.P.; Zavjalov, A.P.; Belov, A.A.; Portnyagin, A.S.; Gerasimenko, A.V.; Drankov, A.N. Spark Plasma Sintering-Reactive Synthesis of SiC and SiC–HfB2 Ceramics Based on Natural Renewable Raw Materials. Russ. J. Inorg. Chem. 2021, 66, 629–637. [Google Scholar] [CrossRef]
- Johnson, D.J. Structural Studies of PAN-Based Carbon Fibers. In Chemistry and Physics of Carbon; CRC Press: Boca Raton, FL, USA, 2021; pp. 1–58. [Google Scholar]
- Jang, D.; Lee, M.E.; Choi, J.; Cho, S.Y.; Lee, S. Strategies for the production of PAN-Based carbon fibers with high tensile strength. Carbon 2021, 186, 644–677. [Google Scholar] [CrossRef]
- Wang, M.-L.; Bian, W.-F. The relationship between the mechanical properties and microstructures of carbon fibers. New Carbon Mater. 2020, 35, 42–49. [Google Scholar] [CrossRef]
- Samuel, J.J.J.; Ramadoss, R.; Gunasekaran, K.; Logesh, K.; Gnanaraj, S.J.P.; Munaf, A.A. Studies on mechanical properties and characterization of carbon fiber reinforced hybrid composite for aerospace application. Mater. Today Proc. 2021, 47, 4438–4443. [Google Scholar] [CrossRef]
- Qureshi, Y.; Tarfaoui, M.; Lafdi, K. Electro-thermal–mechanical performance of a sensor based on PAN carbon fibers and real-time detection of change under thermal and mechanical stimuli. Mater. Sci. Eng. B 2021, 263, 114806. [Google Scholar] [CrossRef]
- Xiao, P.; Gong, Y.; Li, D.; Li, Z. In-situ SAXS study on pore structure change of PAN-based carbon fiber during graphitization. Microporous Mesoporous Mater. 2021, 323, 111201. [Google Scholar] [CrossRef]
- Zhou, X.; Belianinov, A.; Naskar, A.K. Analyzing carbon fiber structures observed by helium ion microscopy and their mechanical properties. Carbon Trends 2021, 4, 100055. [Google Scholar] [CrossRef]
- Zhang, Y.; Tajaddod, N.; Song, K.; Minus, M.L. Low temperature graphitization of interphase polyacrylonitrile (PAN). Carbon 2015, 91, 479–493. [Google Scholar] [CrossRef] [Green Version]
- Ko, T.-H.; Day, T.-C.; Lin, M.-F. The effect of precarbonization on mechanical properties of final polyacrylonitrile-based carbon fibres. J. Mater. Sci. Lett. 1993, 12, 343–345. [Google Scholar] [CrossRef]
- Wangxi, Z.; Jie, L.; Gang, W. Evolution of structure and properties of PAN precursors during their conversion to carbon fibers. Carbon 2003, 41, 2805–2812. [Google Scholar] [CrossRef]
- Sazanov, Y.; Fedorova, G.N.; Gubanova, G.N.; Sukhanova, T.E. Low-temperature carbonization of polyacrylonitrile and its copolymers. Mendeleev Commun. 2014, 24, 239–241. [Google Scholar] [CrossRef]
- Ma, Q.-S.; Gao, A.-J.; Tong, Y.-J.; Zhang, Z.-G. The densification mechanism of polyacrylonitrile carbon fibers during carbonization. New Carbon Mater. 2016, 31, 550–554. [Google Scholar] [CrossRef]
- Tyumentsev, V.A.; Fazlitdinova, A.; Podkopaev, S.A. Relationship between the thermomechanical treatment regimes and heterogeneous structure of carbon fiber. Mater. Today Proc. 2018, 5, 25921–25927. [Google Scholar] [CrossRef]
- Ruan, R.-Y.; Ye, L.-W.; Feng, H.; Xu, L.-H.; Wang, Y. High temperature evolution of the microstructure in the radial direction of PAN-based carbon fibers and its relationship to mechanical properties. New Carbon Mater. 2020, 35, 295–306. [Google Scholar] [CrossRef]
- Goodhew, P.; Clarke, A.; Bailey, J. A review of the fabrication and properties of carbon fibres. Mater. Sci. Eng. 1975, 17, 3–30. [Google Scholar] [CrossRef]
- Zhu, J.; Gao, Z.; Kowalik, M.; Joshi, K.; Ashraf, C.M.; Arefev, M.I.; Schwab, Y.; Bumgardner, C.; Brown, K.; Burden, D.E.; et al. Unveiling Carbon Ring Structure Formation Mechanisms in Polyacrylonitrile-Derived Carbon Fibers. ACS Appl. Mater. Interfaces 2019, 11, 42288–42297. [Google Scholar] [CrossRef]
- Forintos, N.; Czigany, T. Reinforcing carbon fibers as sensors: The effect of temperature and humidity. Compos. Part A Appl. Sci. Manuf. 2020, 131, 105819. [Google Scholar] [CrossRef]
- Park, S.-J.; Kim, B.-J. Carbon Fibers and Their Composites, Carbon Fibers; Springer: Dordrecht, The Netherlands, 2015; pp. 275–317. ISBN 978-94-017-9478-7. [Google Scholar]
- Pan, G.; Muto, N.; Miyayama, M.; Yanagida, H. Preparation of semiconducting carbon fibre by pyrolysis of polyacrylonitrile precursor. J. Mater. Sci. 1992, 27, 3497–3501. [Google Scholar] [CrossRef]
- Jana, P.B.; Chaudhuri, S.; Pal, A.K.; De, S.K. Electrical conductivity of short carbon fiber-reinforced polychloroprene rubber and mechanism of conduction. Polym. Eng. Sci. 1992, 32, 448–456. [Google Scholar] [CrossRef]
- David, L.; Ismail, A. Influence of the thermastabilization process and soak time during pyrolysis process on the polyacrylonitrile carbon membranes for O2/N2 separation. J. Membr. Sci. 2003, 213, 285–291. [Google Scholar] [CrossRef]
- Melanitis, N.; Tetlow, P.L.; Galiotis, C. Characterization of PAN-based carbon fibres with laser Raman spectroscopy. J. Mater. Sci. 1996, 31, 851–860. [Google Scholar] [CrossRef]
- Rennhofer, H.; Loidl, D.; Puchegger, S.; Peterlik, H. Structural development of PAN-based carbon fibers studied by in situ X-ray scattering at high temperatures under load. Carbon 2010, 48, 964–971. [Google Scholar] [CrossRef]
- Bennett, S.; Johnson, D. Electron-microscope studies of structural heterogeneity in pan-based carbon fibres. Carbon 1979, 17, 25–39. [Google Scholar] [CrossRef]
- Robson, D.; Assabghy, F.Y.I.; Ingram, D.J.E. Some electronic properties of polyacrylonitrile-based carbon fibres. J. Phys. D Appl. Phys. 1972, 5, 169–179. [Google Scholar] [CrossRef]
- Lerner, N.R. Electrical conductivity and electron-spin resonance in oxidatively stabilized polyacrylonitrile subjected to elevated temperature. J. Appl. Phys. 1981, 52, 6757–6762. [Google Scholar] [CrossRef]
- Spain, I.; Volin, K.; Goldberg, H.; Kalnin, I. Unusual electrical resistivity behavior of carbon fibers. Solid State Commun. 1983, 45, 817–819. [Google Scholar] [CrossRef]
- Gillespie, D.; Ehrlich, A. Electrical conduction in partially carbonized PAN-based fibers. J. Non-Cryst. Solids 1992, 144, 231–239. [Google Scholar] [CrossRef]


| Sample ID | Heat Treatment Temperature (°C) | Heat Treatment Time (min) |
|---|---|---|
| 700-3 | 700 | 3 |
| 700-9 | 700 | 9 |
| 750-3 | 750 | 3 |
| 750-9 | 750 | 9 |
| 800-3 | 800 | 3 |
| 800-9 | 800 | 9 |
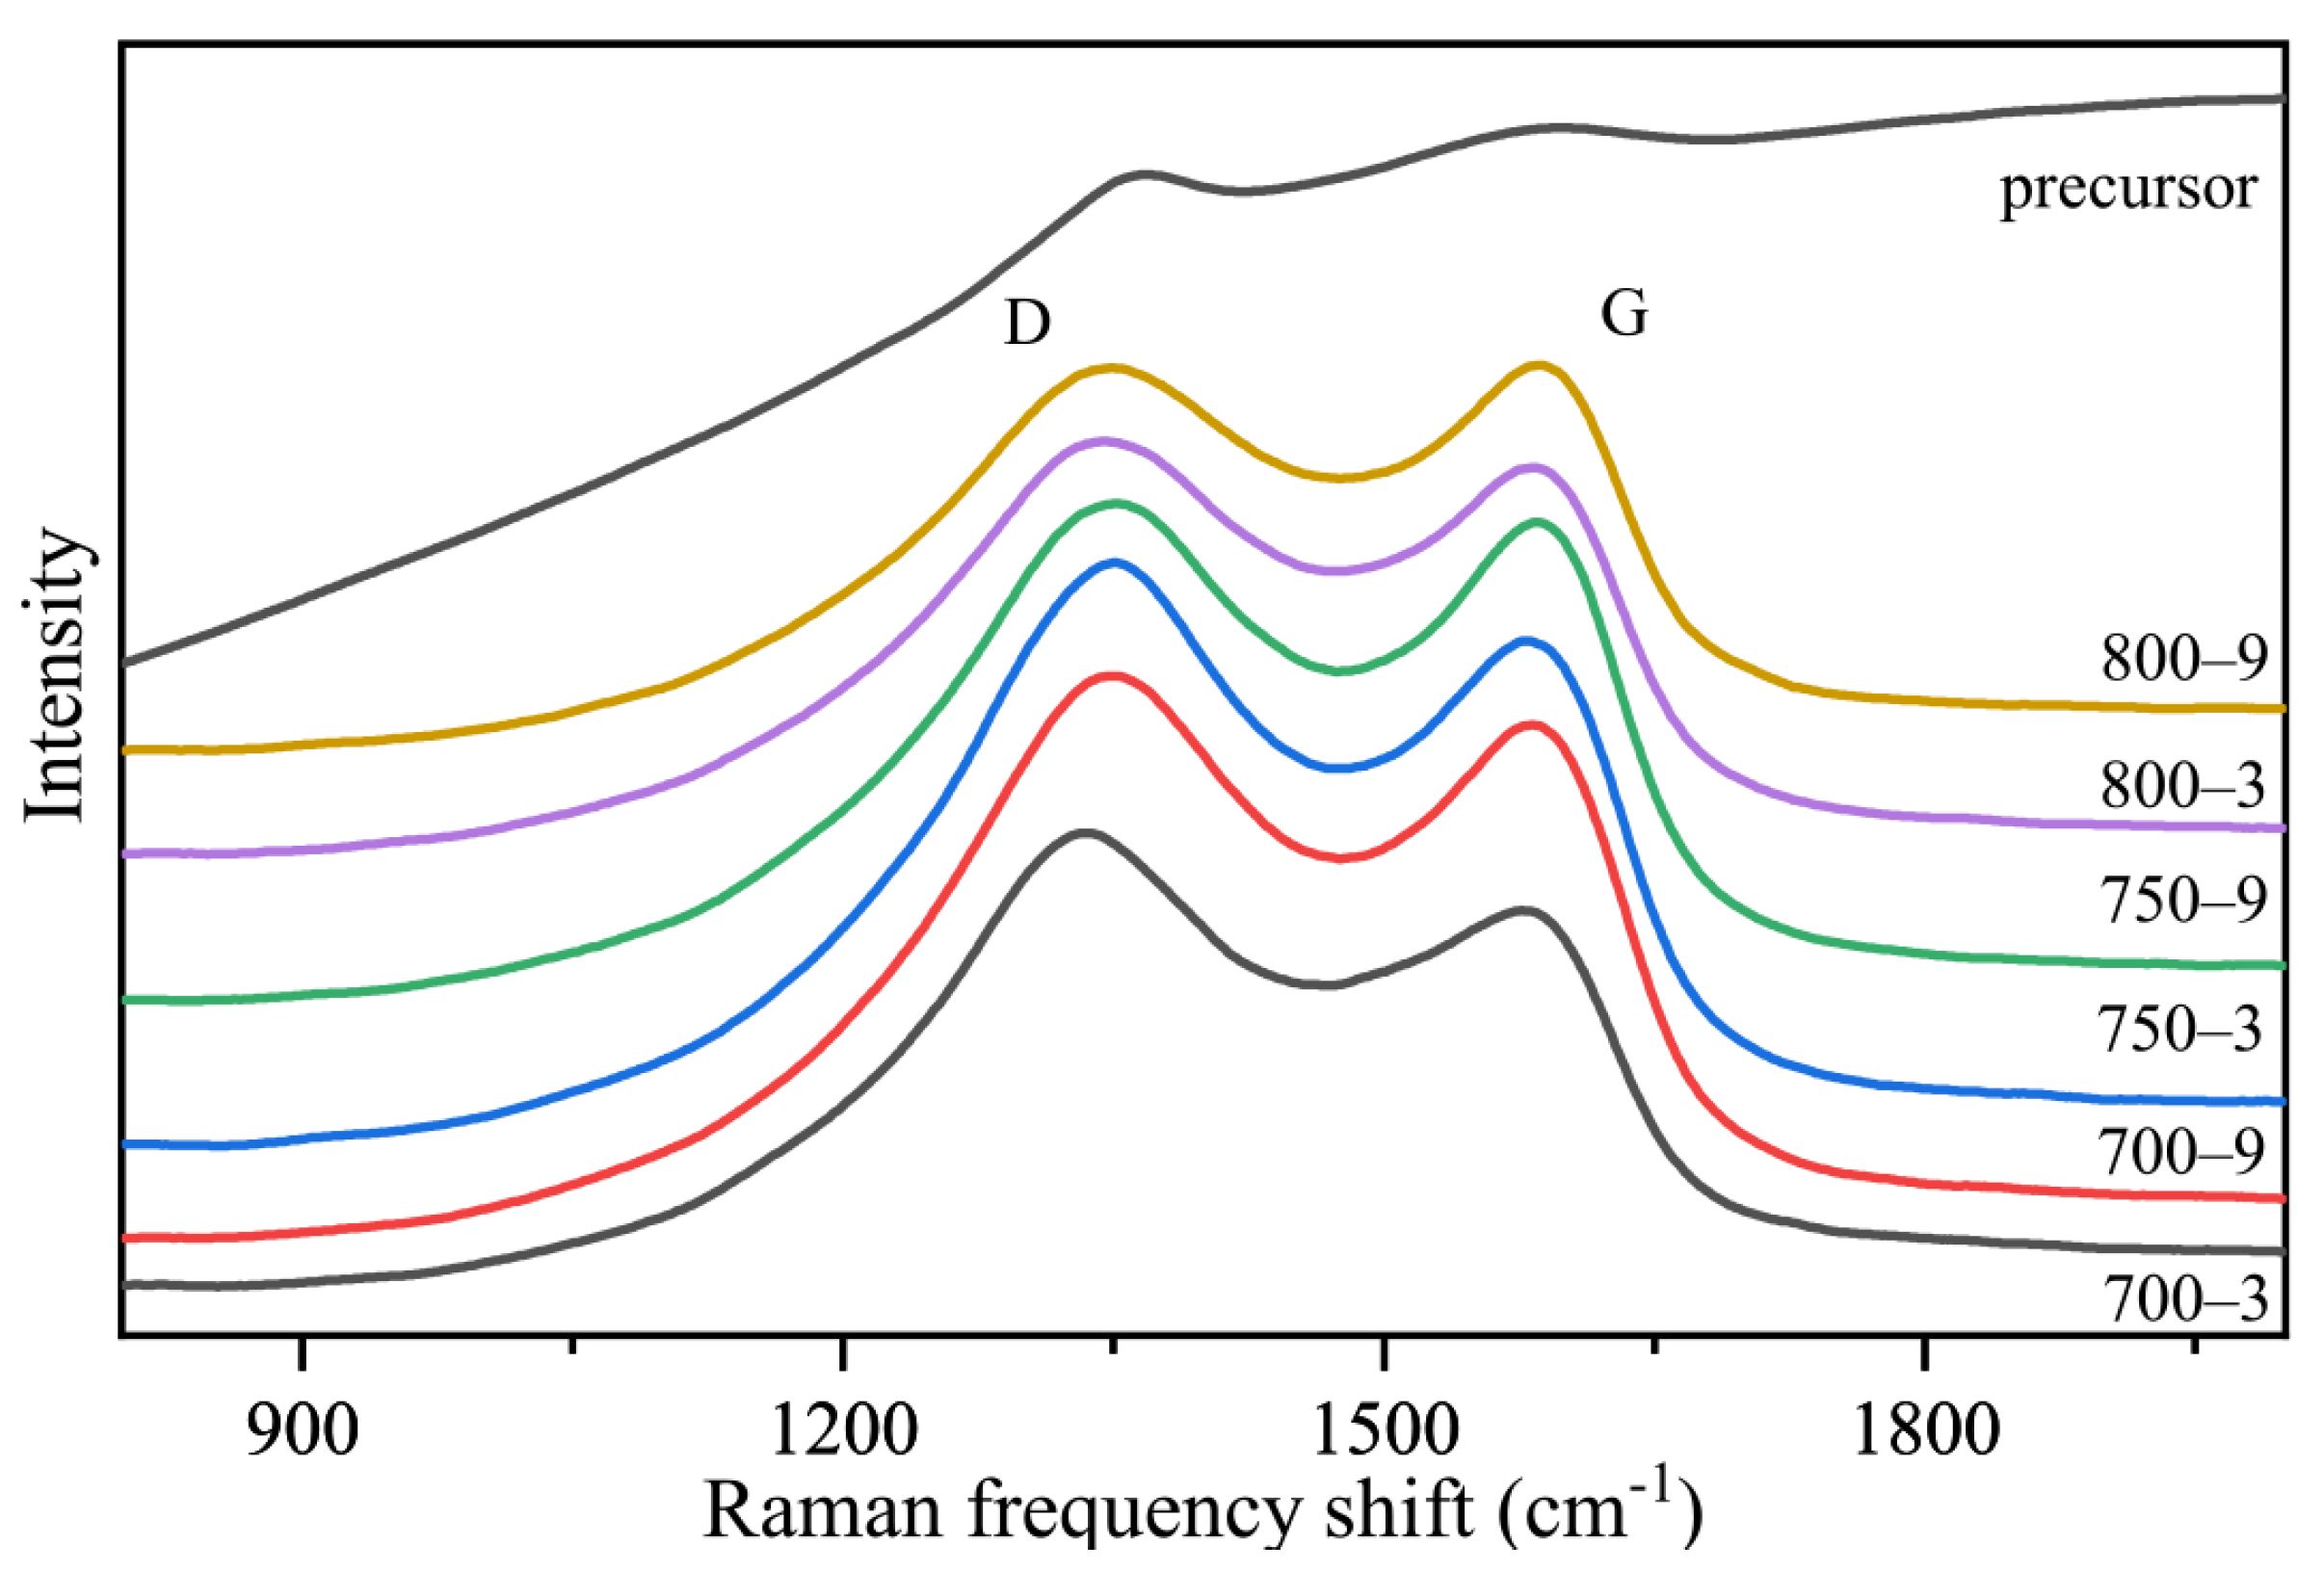
| Sample | FWHM (D) (cm−1) | FWHM (G) (cm−1) | R (ID/IG) |
|---|---|---|---|
| 700-3 | 282 | 375 | 1.16 |
| 700-9 | 271 | 344 | 1.08 |
| 750-3 | 277 | 359 | 1.12 |
| 750-9 | 270 | 309 | 1.03 |
| 800-3 | 273 | 348 | 1.05 |
| 800-9 | 265 | 299 | 0.99 |
| Sample ID | d002(nm) | Lc (002)(nm) | La//(100)(nm) | La⊥(100)(nm) |
|---|---|---|---|---|
| 700-3 | 0.355 | 1.70 | 1.00 | 1.84 |
| 700-9 | 0.354 | 1.71 | 1.01 | 1.86 |
| 750-3 | 0.353 | 1.77 | 1.08 | 1.99 |
| 750-9 | 0.353 | 1.78 | 1.10 | 2.03 |
| 800-3 | 0.352 | 1.79 | 1.22 | 2.25 |
| 800-9 | 0.3251 | 1.81 | 1.24 | 2.28 |
Publisher’s Note: MDPI stays neutral with regard to jurisdictional claims in published maps and institutional affiliations. |
© 2021 by the authors. Licensee MDPI, Basel, Switzerland. This article is an open access article distributed under the terms and conditions of the Creative Commons Attribution (CC BY) license (https://creativecommons.org/licenses/by/4.0/).
Share and Cite
Liu, Z.; Wang, J.; Li, C.; Zheng, C.; Zhang, B. Remarkable Temperature Sensitivity of Partially Carbonized Carbon Fibers with Different Microstructures and Compositions. Materials 2021, 14, 7085. https://doi.org/10.3390/ma14227085
Liu Z, Wang J, Li C, Zheng C, Zhang B. Remarkable Temperature Sensitivity of Partially Carbonized Carbon Fibers with Different Microstructures and Compositions. Materials. 2021; 14(22):7085. https://doi.org/10.3390/ma14227085
Chicago/Turabian StyleLiu, Zijin, Jun Wang, Chang Li, Cheng Zheng, and Bin Zhang. 2021. "Remarkable Temperature Sensitivity of Partially Carbonized Carbon Fibers with Different Microstructures and Compositions" Materials 14, no. 22: 7085. https://doi.org/10.3390/ma14227085
APA StyleLiu, Z., Wang, J., Li, C., Zheng, C., & Zhang, B. (2021). Remarkable Temperature Sensitivity of Partially Carbonized Carbon Fibers with Different Microstructures and Compositions. Materials, 14(22), 7085. https://doi.org/10.3390/ma14227085