Article

In Situ Remediation of Phosphogypsum with Water-Washing Pre-Treatment Using Cemented Paste Backfill: Rheology Behavior and Damage Evolution

1
Department of Geosciences, University of Padova, 35131 Padova, Italy
2
Sinosteel Maanshan General Institute of Mining Research Co., Ltd., Maanshan 243000, China
3
School of Resources and Safety Engineering, Central South University, Changsha 410083, China
4
Yinshan Mining Co., Ltd., Jiangxi Copper Group, Dexing 334200, China
*
Author to whom correspondence should be addressed.
Materials 2021, 14(22), 6993; https://doi.org/10.3390/ma14226993
Submission received: 30 September 2021 / Revised: 3 November 2021 / Accepted: 8 November 2021 / Published: 18 November 2021

Abstract

:
The accumulation of original phosphogypsum (OPG) has occupied considerable land resources, which have induced significant environmental problems worldwide. The OPG-based cemented paste backfill (OCPB) has been introduced as a promising solution. In this study, a water-washing pre-treatment was used to purify OPG, aiming to optimize the transport performance and mechanical properties of backfills. The overall results proved that in treated phosphogypsum-based cemented paste backfill (TCPB), the altered particle size distribution can alleviate the shear-thinning characteristic. The mechanical properties were significantly optimized, of which a maximum increase of 183% of stress value was observed. With more pronounced AE signals, the TCPB samples demonstrated better residual structures after the ultimate strength values but with more unstable cracks with high amplitude generated during loading. Principal component analysis confirmed the adverse effects of fluorine and phosphorus on the damage fractal dimensions. The most voluminous hydration products observed were amorphous CSH and ettringite. The interlocked stellate clusters may be associated with the residual structure and the after-peak AE events evident in TCPB, indicate that more significant stress should be applied to break the closely interlocked stitches. Ultimately, the essential findings in this experimental work can provide a scientific reference for efficient OPG recycling.

Graphical Abstract

1. Introduction

Phosphate plays an indispensable role in modern agriculture, owing to the rapidly growing demand for phosphorus fertilizer [1,2,3]. However, the antiquated phosphate rock excavation and beneficiation technology can result in prolific problems, for instance, the forming of goaf [4,5,6], the consumption of land resources [7,8], and the leaching of hazardous substances [9,10]. What is more, as a typical by-product generated from the phosphate fertilizer production procedures, the industrial recycling of original phosphogypsum (OPG) has been strongly constrained by its physical properties and chemical composition [11]. Accordingly, the stockpiles of OPG pose a significant threat to natural aquifers and soil, especially for groundwater, which can be used as drinking water [11,12]. According to previous statistics, the annual storage of OPG is predicted to exceed 200 million tonnes in the next decade [13]. Since these hazards have increasingly raised serious concerns, scientific developments regarding efficient and eco-friendly solutions have been continually progressing, for instance, circular agricultural production [14,15], rare earth element recovery [16], and building material manufacture [17,18,19,20,21]. However, the successful commercialization of recycling OPG is far from an apparent breakthrough [22].
Cemented paste backfill (CPB), as a relatively safe and reliable approach to broaden the mining solid waste and benefit by-product recycling [23,24,25], has been introduced into the recovery of OPG [22,26]. According to current studies, OPG lacks sufficient mechanical property and durability to be used independently [27,28,29]. Besides, the impurities (mainly phosphorus and fluoride) reported can deteriorate the workability and mechanical properties of OPG based CPB (OCPB) [1,11,30]. The application of various OPG pre-treatments could improve the properties of OPG-binder systems, for instance, calcination [31], water washing [32], and membrane technology [33]. However, it has to be mentioned that using complicated pre-treatment systems in engineering applications can further squeeze the unprofitable margins. As a widely used purification method [34,35], a water-washing was found that can effectively optimize the particle size distribution (PSD) and reduce the soluble phosphorus and fluoride content of OPG [32,36]. Although many works have already identified the mechanical performance and environmental feasibility of OCPB, researchers have seldom investigated the rheology characteristics and acoustic emission (AE) signals which are also essential factors for converting OCPB from lab scale to industrial application. The precise knowledge of rheological behavior, which reflects the cohesion and frictional resistance of the pastes, is of great importance to advance the backfill procedures and enhance production efficiency. Meanwhile, as a widely recognized failure detection method, acoustic emission (AE) testing technology is commonly used in investigating and monitoring rock damage assessment [37], fracture classification [37,38,39,40], and landslide warning [41]. Although a positive correlation between the AE signals and the strain–stress curve was found, the role of different phases in CPB in AE testing has not always been evident and apparent [42,43].
For this reason, the main objective of this study has been to analyze the influence of water-washing pre-treatment on the rheological behavior and AE parameters of OCPB and TPCB samples, emphasizing the monitoring of the complex fracture behavior after hardening. The TPG was prepared through deionized water (DW) washing, and OCPB and TCPB samples with two mix proportions were accordingly prepared for rheology behavior, mechanical properties, AE characteristics, mineralogical characterization, and microstructures examination. This study aims to provide a laboratory basis for early alarm mechanical failures when applying OPG to underground structures. A flow chart is plotted in Figure 1.

2. Sample Preparation and Test Methods

2.1. Materials

The OPC used in this study was CEM I 42.5R, with a specific surface area of 1.69 m2/g. OPG was sampled from a phosphoric acid production plant in Hubei province, China. The TPG was obtained by previous water-washing pre-treatment [32]. Before the mixture manufacture and characterization experiments, OPG and TPG were both dried at 45 ± 5 °C until constant weight [32,44,45].

2.2. Mix Proportions

The OCPB and TCPB were prepared according to Table 1. After being stirred homogeneously, the mixtures were cast into plastic, cylindrical molds (Ø50 × 100 mm) and hydrated for 24 h. Subsequently, the OCPB and TCPB samples were transferred into the chamber with a controlled temperature of 25 ± 2 °C and humidity of 90 ± 5% [46]. After being cured for different periods, the hardened samples were extracted from the plastic molds and then subjected to the following test procedures. Taking into account the field conditions, all the samples were not sealed. As mixing water strongly affects CPB’s hydration mechanisms [1], deionized water (Solar-bio Co. Ltd., Beijing, China) was provided in this study.

2.3. Test Methods

2.3.1. Characterization Experiments

The chemical compositions and particle size distribution of the OPG and TPG samples were determined by X-ray fluorescence (XRF, Bruker S4 Pioneer XRF analyzer, Karlsruhe, German) and a laser particle analyzer (Master Sizer 2000, Worcester, UK). The OCPB and TCPB used for the following analysis were collected at the surface of the main fractures in each loaded sample, then dried at 50 ± 5 °C for 24 h and powered in an agate mortar. XRD analysis of the collected pieces was performed using an X-ray diffractometer (D8 Advance, Bruker, Karlsruhe, Germany) employed with Cu Kα line radiation. The XRD patterns were appraised using the references in the PDF-2 database (PDF-2 International Centre for Diffraction Data, Newtown Square, PA, USA). SEM/EDX observation was employed for the microstructure of backfills on the JSM-6490LV scanning electron microscope (JEOL Ltd., Tokyo, Japan). Before being subjected to the SEM/EDX tests, the powder samples were gilded to confirm good conductivity.

2.3.2. Experiments of Rheological Characteristics

Rheological measurements were carried out using a controlled stress rheometer equipped with a coaxial rotating cylinder (Viscotester 550 Rotational Viscometer, Haake Technik GmbH, Vreden, Germany). The prepared OCPB and TCPB samples were first mixed for 2 min to guarantee the homogeneity of the mortars. Then, before being poured into the rheometer, the mortars were kept at rest for 3 min. During the equilibrium test, the shear rate was ramped up from 0 to 45 s−1 in 180 s. All rheological measurements were performed at a relatively steady ambient temperature of 20 ± 1 °C.

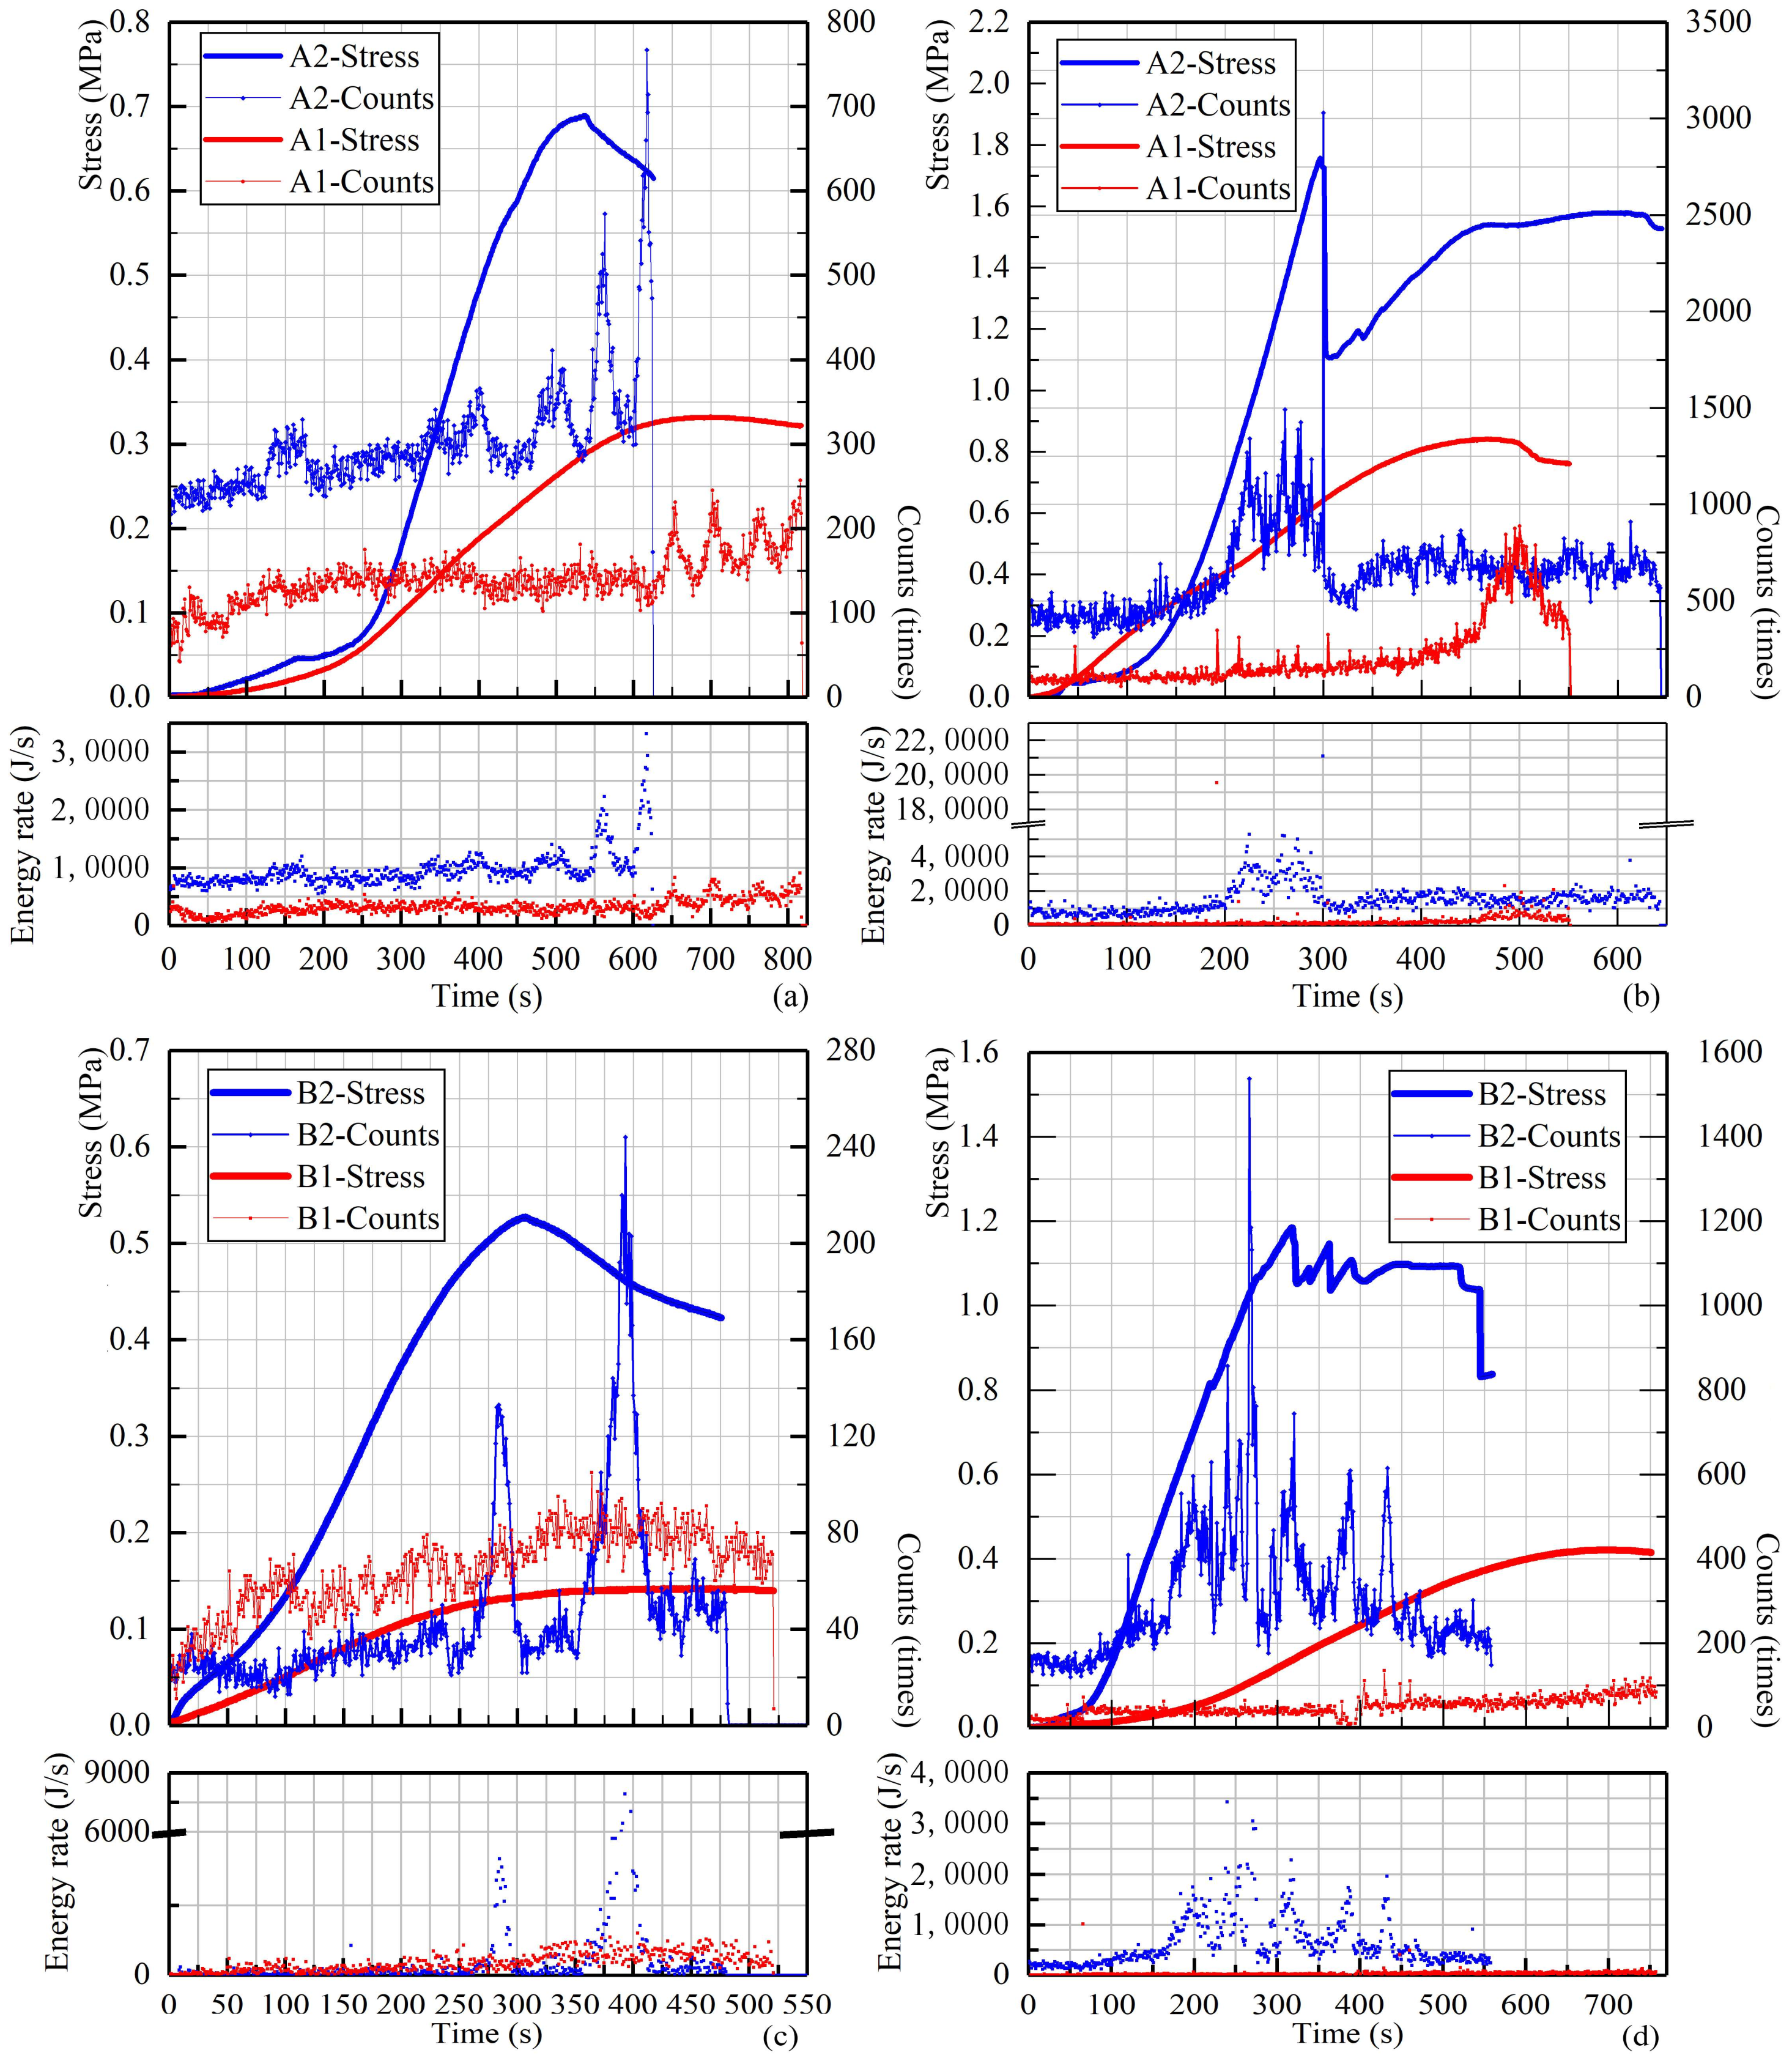
2.3.3. Experiments of Mechanical Properties and AE

Considering the poor mechanical performance of 7 day cured OCPB samples, the specimens were subjected to a biomechanical testing machine (23 MTS Insight, produced by MTS Systems Co., Ltd., Eden Prairie, MN, USA, with controlled loading speed: 0.1 mm/min, loading capability: 30 kN) [47] adopted with the PCI-2 AE testing system (Physical Acoustic Corporation, United States, preamplification: 40 dB, threshold value: 40 dB, probe resonance frequency: 20–100 kHz). The schematic diagram of UCS and AE tests is shown in Figure S1. Besides, Vaseline and adhesive tape were used to couple the contact surface of the AE probe and OCPB to ensure signal reception [48]. To simplify the data set processing, UCS and AE measurement systems must be kept synchronized to record interchangeable time parameters.

3. Results and Discussion

3.1. Raw Materials Characterization

Table 2 shows that CaO, SO3, SiO2, and Al2O3 were the main oxides both in OPG and TPG, despite the relative content of silica and calcium being raised after water-washings. Phosphate and fluoride, which can negatively affect the mechanical strength and hydration process of CPB samples [11,12,20], both decreased extensively from 1.45% to 0.57% and from 0.93% to 0.42%. The particle size distributions (PSD) of OPG and TPG are plotted in Figure 2. The < 20 μm and < 200 μm particles account for 18.39% and 97.01% of OPG, which are 15.14% and 98.78% for TPG. The microstructures of OPG and TPG were as demonstrated in Figure 3a1,b1. Although the crystal grains of TPG remain rhombic plates, many adsorbed impurities were removed (Figure 3b2,b3).

3.2. Rheological Characterization of OCPB and TCPB

Recorded shear stress and viscosity performing as functions of shear rate are shown in Figure 4. Similar to reference CPB, all the investigated specimens show obvious shear-thinning behaviors and pseudoplastic characters [46,49]. However, with the increase of shear rate, TCPB show more pronounced shear stress. To quantitatively describe the optimization, four rheological models were used as shown in Table S1. The two-parameter Bingham model is commonly used to represent cementitious materials [50]. A second-order term constant c is applied in the modified Bingham model to reduce the error at both low and high shear rate conditions [51]. Considering mono-linear models that cannot satisfactorily account for the shear-thinning characteristics of non-Newtonian fluids, the Herschel–Bulkley model and Casson model are also presented [52,53]. The statistical parameter error was calculated as Equation (1) [54]. The Cross model was introduced to characterize the asymptotic viscosities at zero and infinite shear rates. The results determined from the abovementioned models are illustrated in Figure 4 and Table S1.
S D = [ i = 1 N D P ( X m X f ) 2 N D P - 2 ] 1 2
where SD is the statistical parameter error, Xm is the measured value, Xf is the calculated value from each model, and NDP is the number of data points.
If only considering the R square figures, all the given models show adequate fit responses. However, in terms of the SD value, the Herschel–Bulkley model performs a more significant fitting result to the tested pastes. Besides, the τ0 values calculated from the models all demonstrate the optimization of water-washing pre-treatment to yield stress, regardless of the mix proportion. Especially in the Herschel–Bulkley model, τ0 values of mix proportions A and B are increased by 13.0% and 15.6%. Although n values of the tested pastes are all below one, the values of OCPB pastes are smaller than that of TCPB, indicating a more pronounced non-Newtonian characteristic. From the Cross model, the presented η results indicate that the infinite shear viscosity was relatively constant. However, the η0 values found could be predominant with the OPC concentration and the water-washings. That is to say, although all the flocculant network structures of the tested mortars are all destroyed rapidly after mixing, the microscopic structure of TCPB mortar is more stable than OCPB. In general, the shear-thinning behavior of CPB might be attributed to attractive and repulsive forces, such as Brownian forces and steric hindrance forces [55,56]. After water-washings, the finer-grained TCPB particles can effectively reduce the average distance between particles, and thus particle interaction and shear stress are improved by this micro-filling effect [51,57]. Simultaneously, the improvement might be due to the removal of soluble fluoride and phosphorus, which can significantly retard the early hydration of CPB [11,22]. After experiencing continuous shear mixing, more clusters were generated in TCPB samples where the water was entrapped into the assemblages. However, this could not be confirmed in this experiment but is to consider in further studies.

3.3. Mechanical Performance of OCPB and TCPB

The results present in Figure 5 are the stress curves (left y-axis), AE scatterplots (right y-axis), and energy rates of OCPB and TCPB specimens. In general, with the water-washing pre-treatment, the unconfined compressive stress values of TCPB samples were significantly enhanced, especially the value (1.19 MPa) of the 28 days cured B2 sample (Figure 5d), which was increased approximately three times higher than the B1 sample (0.42 MPa) although the failure characteristics of the samples are similar. All the counts and energy rate scatters show a positive relation to the loading stress, roughly similar to typical brittle-rigid rocks, which can be classified into four distinctive stages [40]. However, both in the OCPB and TCPB systems, only three stages can be found, quiet compaction, the rapid propagation period, and the macro-fracture initiation period. The beginning period could be related to microcrack contact and slip and pore closure [43]. Then, rapid propagation and macro-fracture initiation appeared, with the AE counts and energy rates gradually increasing and reaching a peak. Besides, it could be found that the AE energy rate and counts increase with the curing ages and OPC content, which means that the generation of hydration products would increase the energy-storing of OCPB and TCPB.
Furthermore, it is evident that the related AE counts of 7 day OCPB samples were more active at the initial period of the UCS test compared with the 28 day samples, if only considering the percentage increase between the initial stage and the peak. This could be related to the pores, mainly consisting of liquid or gas phases, which are presented massively in 7 day OCPB samples. As a result, these pores were rapidly compacted during the initial compression stage, accompanied by large quantities of AE events [58,59]. With the increase of curing time, the pores in the specimen were filled with hydration products [60], and more energy was stored. Therefore, the AE events of 28 day OCPB samples in the initial period are less fluctuant.
Besides, the A2-7D and B2-7D samples showed obvious increase of AE counts after the maximum stress value point. In contrast, the counts–time curves of OCPB perform unimodal distributions. This dislocation of maximum AE counts is usually performed in the compression tests equipped with softer loading platens, for instance, platens with a Teflon thin layer [61]. During the compression tests, friction between loading platens and the specimen was prone to produce material fragmentation near the bases [62]. When using the soft loading platens, outward-directed shear forces would generate at the interface and then the associated lateral deformation entailed the failure from crushing to splitting. Whereas, as presented in previous studies [62,63], platen restriction also shows side effects on AE events before the maximum stress is accompanied by more apparent AE signals in the post-peak period. Previous studies supported that the dislocation of maximum AE counts could presumably be affected by the cementation effect [64]. Thus, accompanied by the platen restriction and the OPC content, water-washings can also activate AE events in the post-peak period.

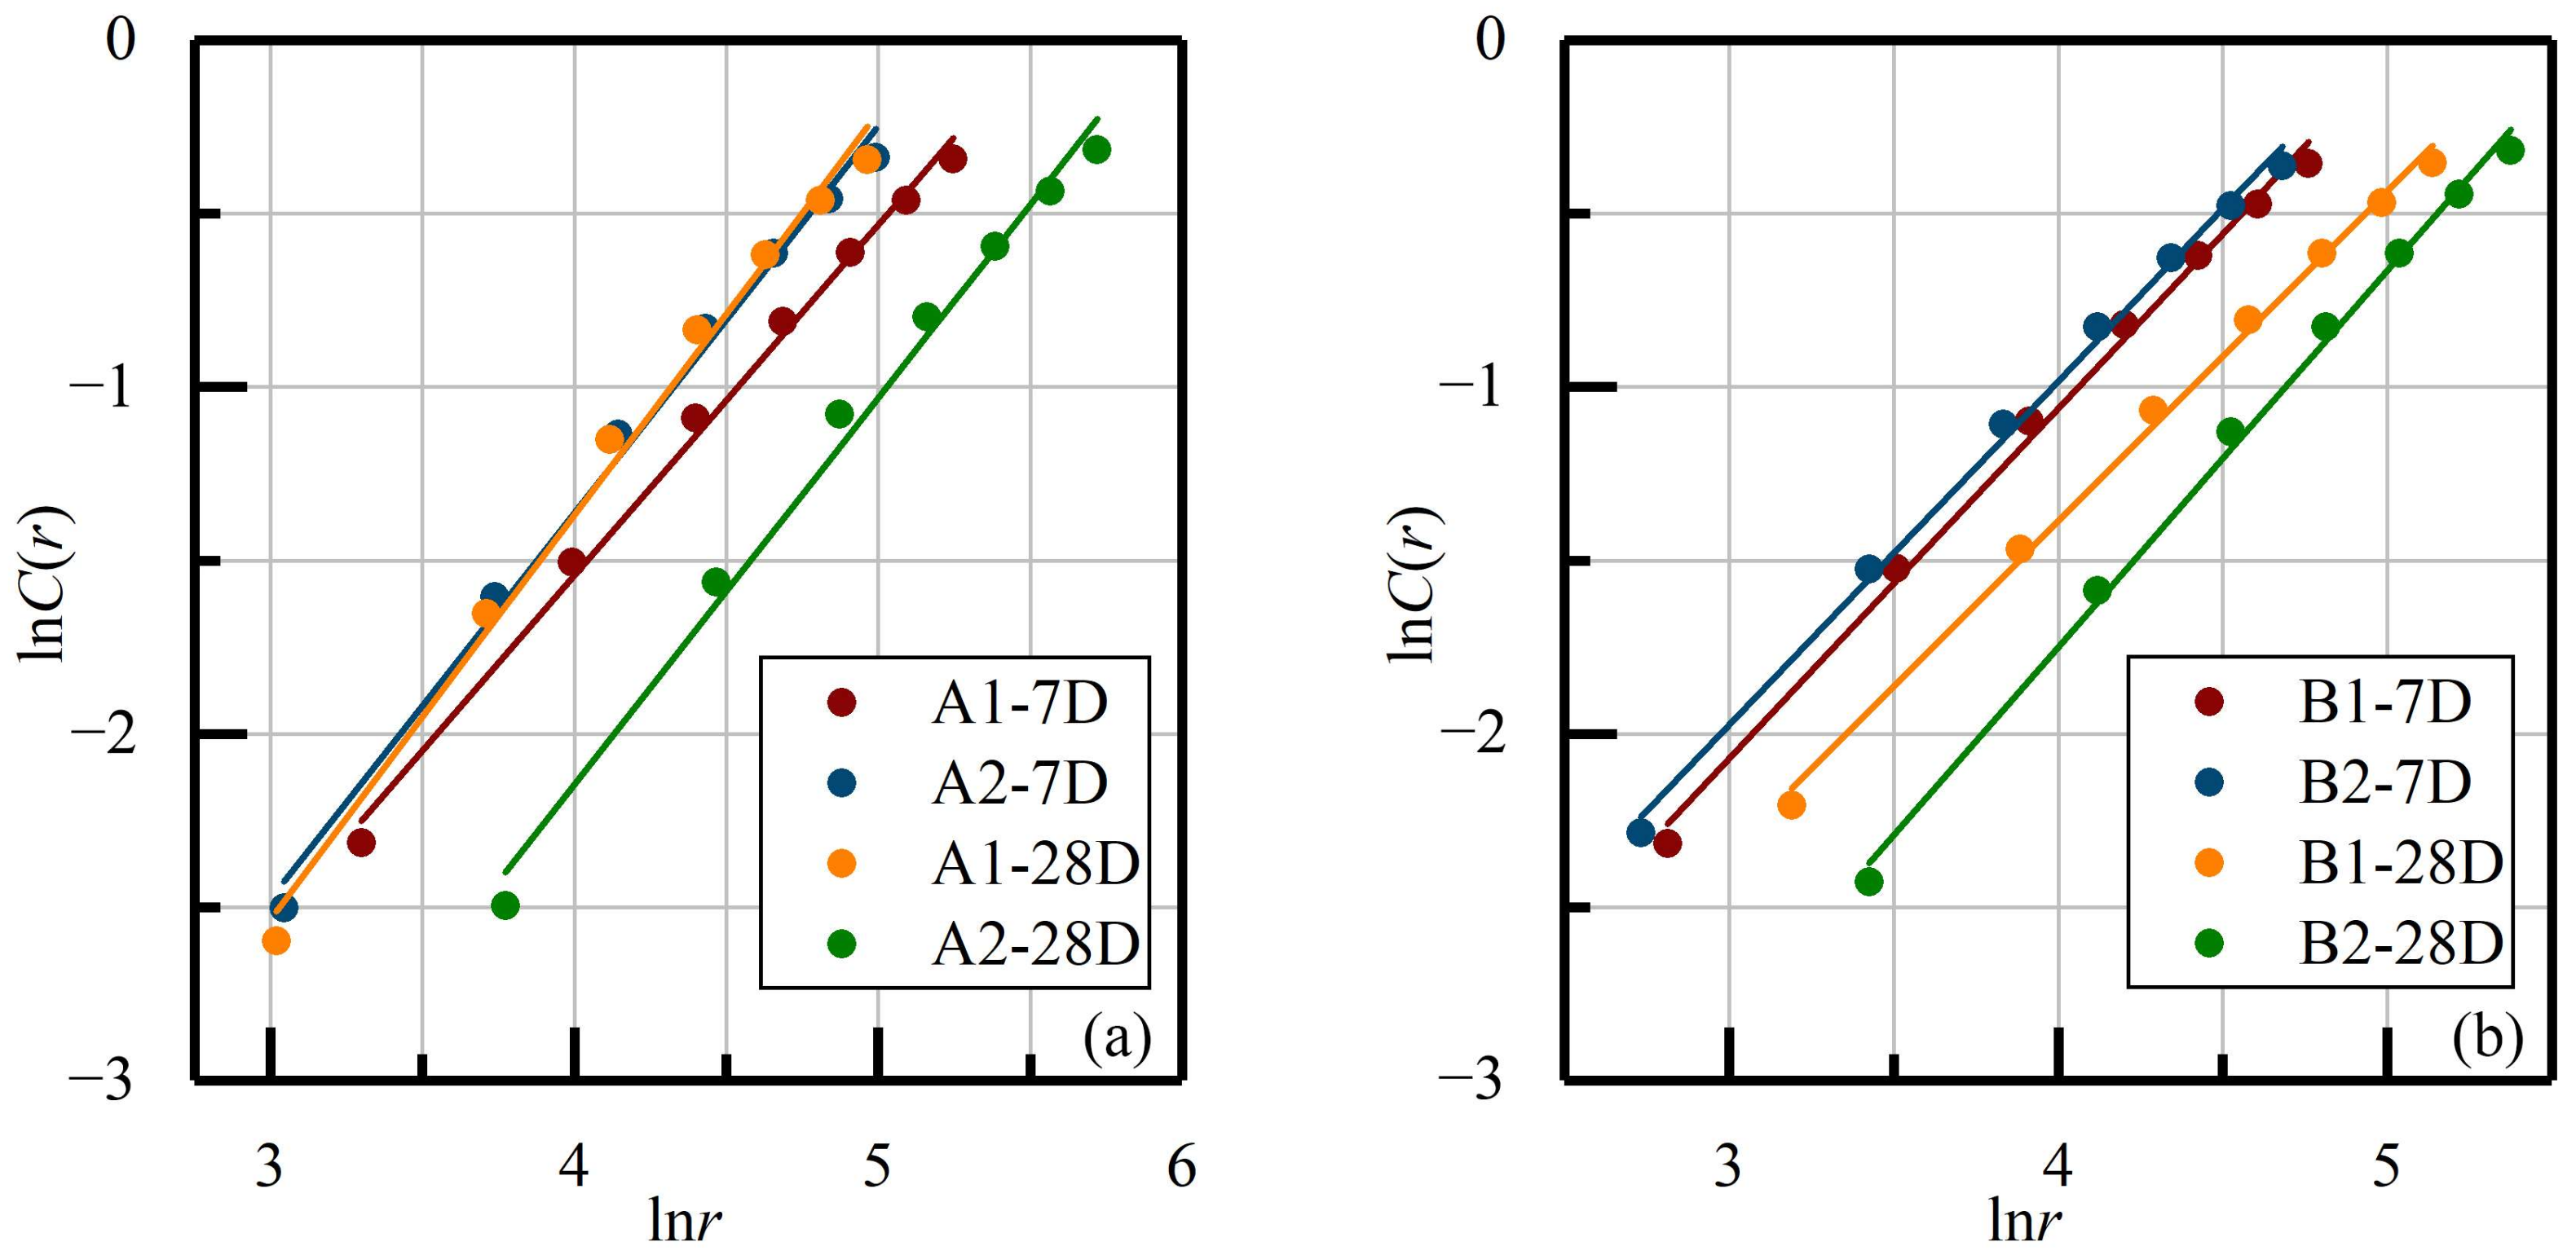
3.3.1. Internal Damage Fractal Dimension (D) Characteristics

The fractal dimension D is any dimension measurement that allows non-integer values, and the fractal is the set of D [42,59]. As a widely used method for estimating fractal dimensions of experimental data sets, the complexity of the internal damage evolution of the specimen can be expressed by D values. Meanwhile, the Grassberger–Procaccia (G–P) algorithm [65] is widely used to estimate D values of data sets that include a time sequence. Once the set of points (ln r, ln C(r)) demonstrates a linear correlation relationship in a log–log coordinate, it can be concluded that the fitted set has fractal characteristics at a given scale. Hence, the fractal dimension D can be estimated as the slope of the straight-line portion
ln C(r) = D*ln r + d
where d is the coefficient constant representing the material characteristic. Thus C(r) is approximately given by Equation (3)
C ( r ) 1 N 2 i = 1 N j = 1 N H ( r - | x i - x j | )
where N = nm + 1, n is the dimension of the original constructed phases space, after m (m < n) isolated sets of points have been removed from the constructed space, N vectors can be obtained from reconstructed phases space, and |xixj| is the distance between any pair of points. The Heaviside function [66] is defined by Equation (4)
H s = 1 ,   if   s     0 0 ,   if   s   <   0
The value of r can be calculated by Equation (5)
r = s × 1 N 2 i = 1 N j = 1 N | x i x j |
where s is the scale factor, to acquire a prominent fractal characteristic, the s values are given as 0.2, 0.4, 0.6, 0.8, 1.0, 1.2, and 1.4. While using the G–P algorithm, a previous study [66] demonstrated that an appropriate reconstructed phase space needs to be determined to promote the accuracy of the fractal analysis. Therefore, a new parameter of Dm was defined as the ratio of ln C(r) to ln r. Then, the m value was selected in the period when the Dm values gradually kept stabilizing. Figure S2 plots the change of Dm with m values ranging from 2 to 30.
It was shown clearly that, apart from the A2-7D and B2-28D samples, the computed m-Dm curves’ general trend all remain steady, especially the Dm values of OCPB specimens which stabilize from 0.90 to 0.95. After a short period of increase, the Dm values of A2-7D and B2-28D samples re-stabilizes at m values at 11 and 20. Therefore, the figure for the phase space dimension m was chosen as 20 for the AE fractal analysis for the further step. In addition, the values of TCPB were concentrated at ranges from 0.98 to 1.05 and from 1.15 to 1.80, respectively, which are far higher than OCPB, indicating that besides the contribution of OPC content and the curing age, water-washing pre-treatments also greatly enhance the fitted Dm values. Subsequently, with the determined m values, the ln C(r) and ln r values were plotted as in Figure 6, and the parameters of the fitted straight lines introduced as in Table 3.
From the calculated R2 figures, it can be seen that all the ln C(r) and ln r values demonstrate obvious linear correlation, proving that the tested specimens all have fractal characteristics. For the A1 and A2 samples, the D values slightly increased with the curing age, which is not observed in ratio B. Besides, although different proportions were prepared, the D values remain approximately constant. The possible factors which correlate to this behavior, with the D values fluctuating around 1, could be ascribed to the inherent character of weak strength and residual stress after loading.
In order to limit the variables in the experimentation and obtain a correlation between the previous dependent and independent variables, the PCA results of the D-values, curing ages, and UCS values are collated in Figure 7 [67,68]. From the scree plot in Figure 7a, the first three eigenvalues represent approximately 94% of the total variabilities indicating that the PCA results are reasonable. In Figure 7b,c, the PCA bi-plots of two principal components reflect the relationship among the variable bulk chemical data, curing ages, and mechanical performance. In the axis of principal component 2, the impact of fluorine and phosphorus were preceded only by calcium and sulfate, which are the primary ions in OPG and TPG. According to Figure 7c, the contribution of curing ages was shown by diagonally classifying the studied specimens into two groups.

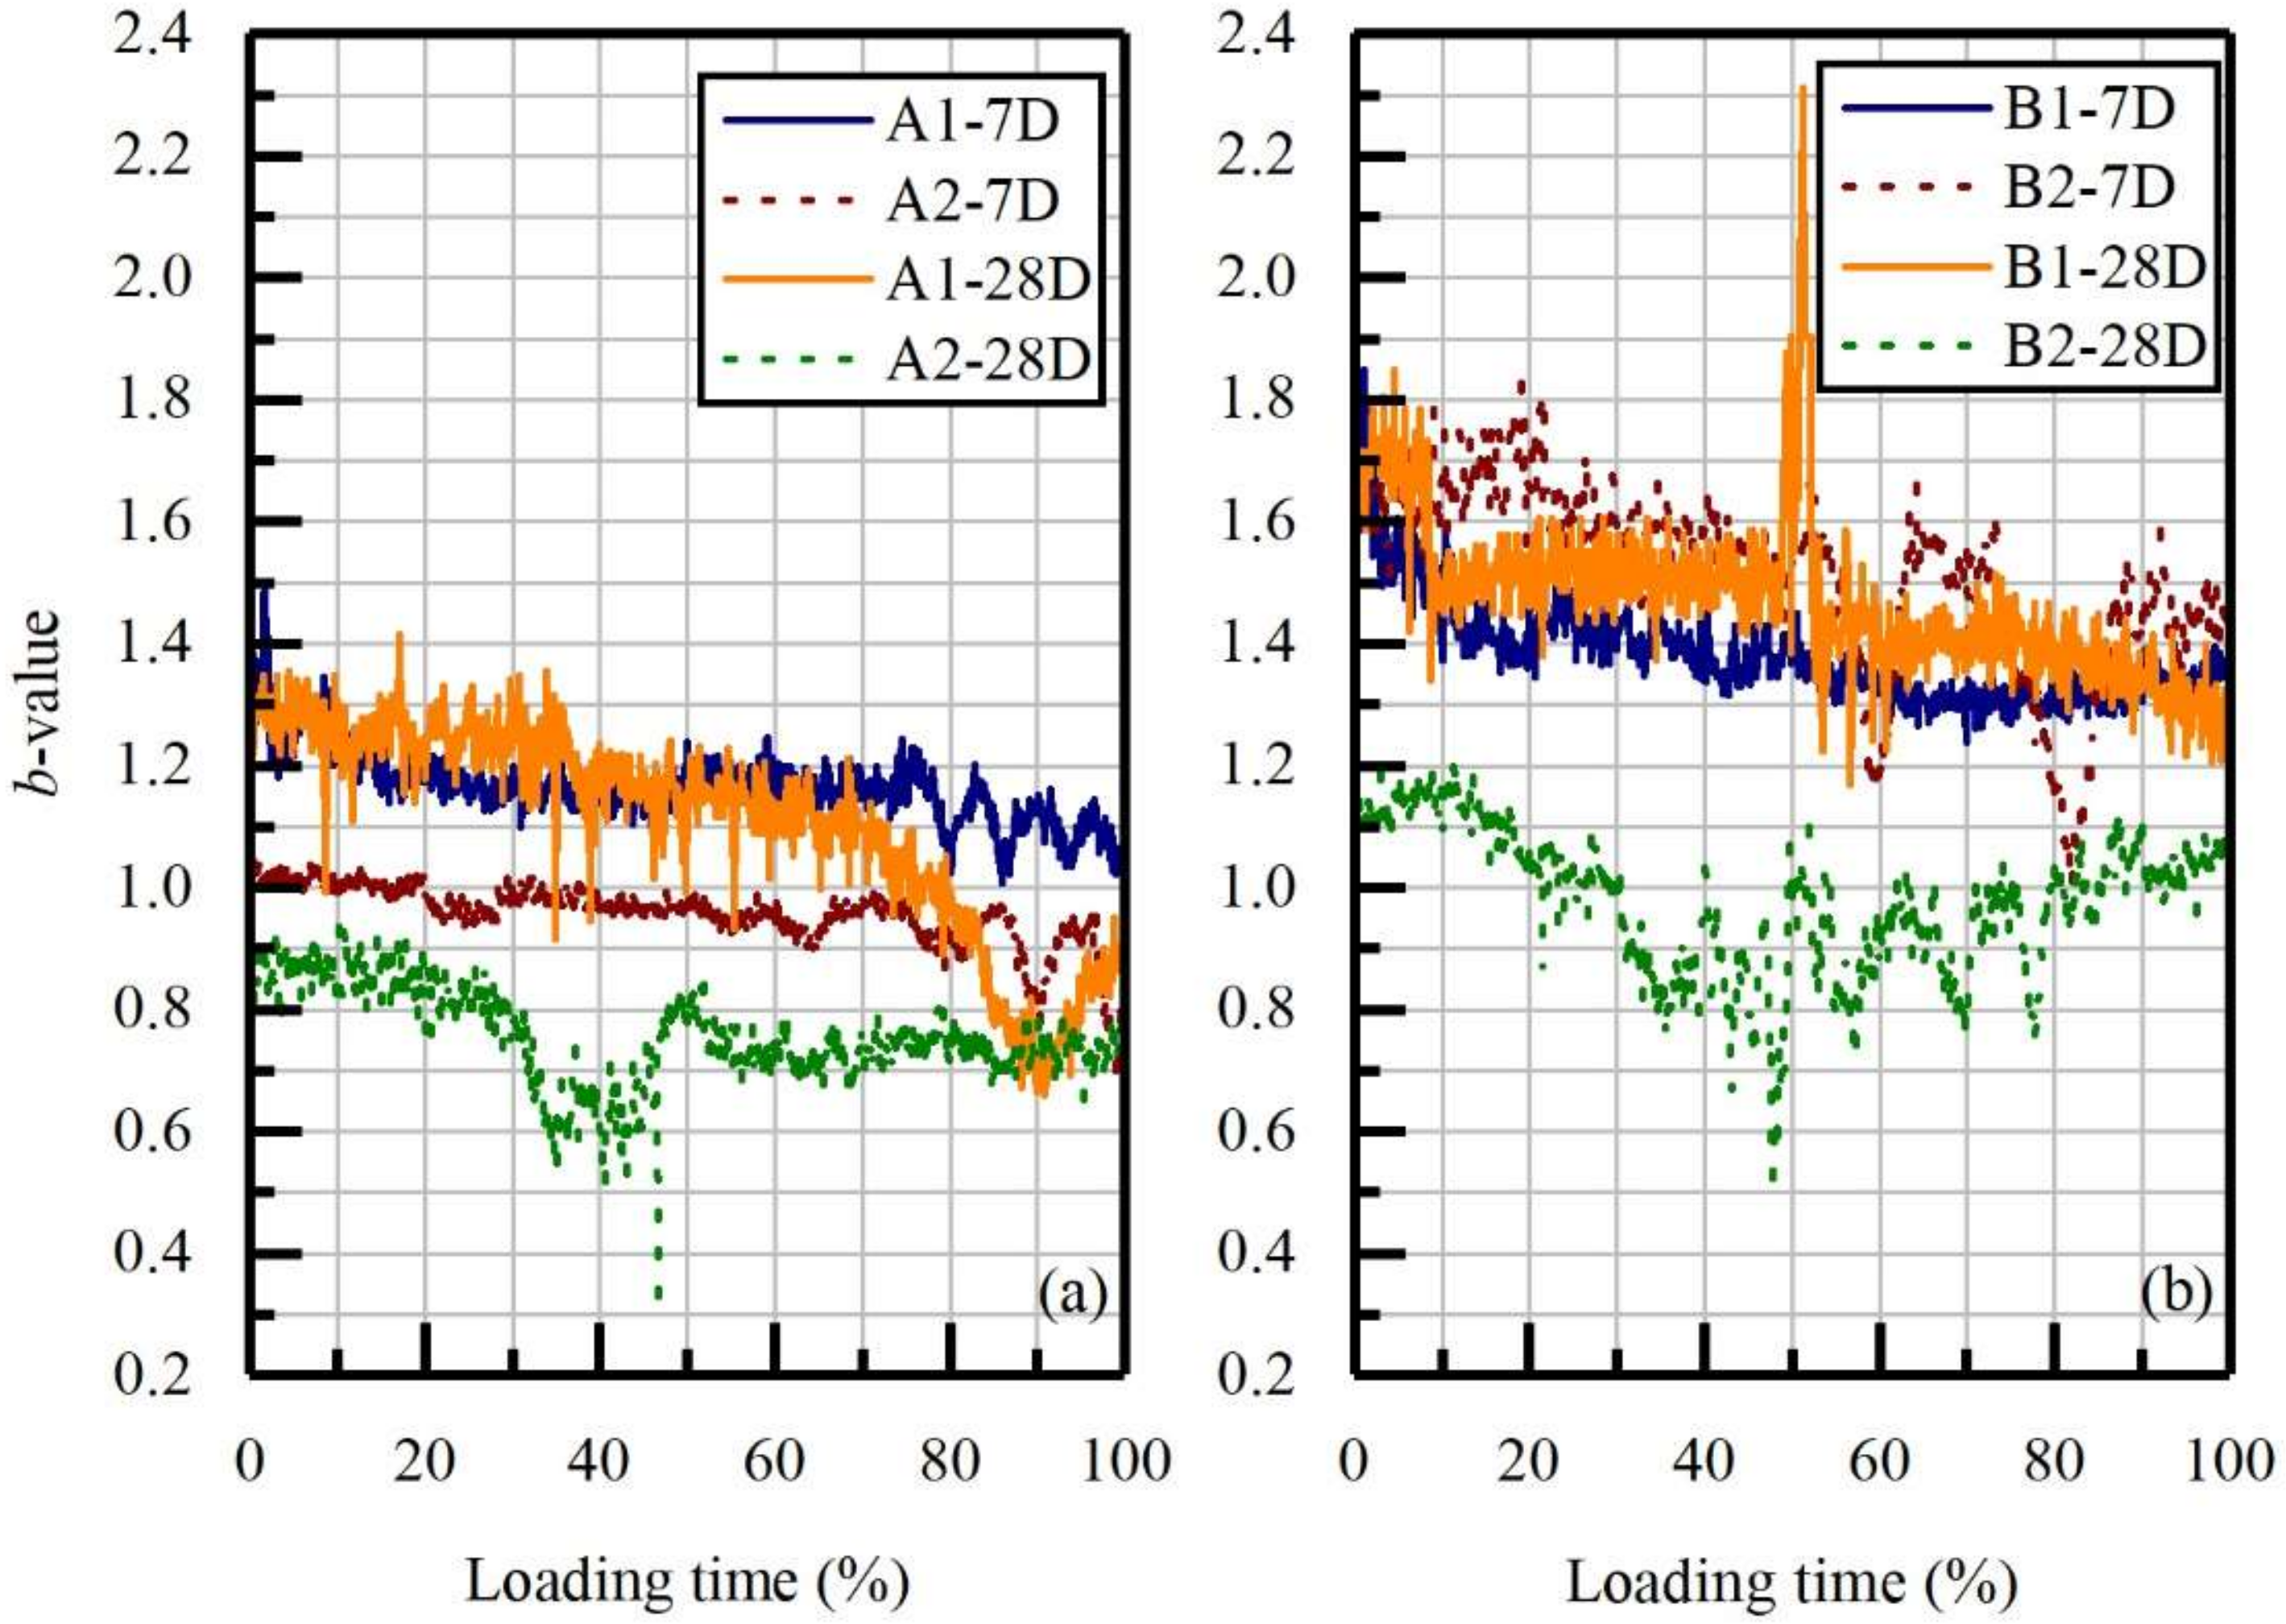
3.3.2. Loading Time Sequence Investigation: DN-Values and b-Values Analyses

Since the opting for N values is based on the time used for a completed compression process, DN is assumed to identify the energy released per second of modalities in each structural element. The calculated DN values are summarized in Figure 8. Besides, being a significant parameter for monitoring and forewarning impending failure in engineering materials, the b-value is derived from the seismic magnitude–frequency equation (Equation (6)) [59]. It represents the scaling of magnitude distribution of AE signals, showing temporal fluctuations as the impending failure approaches in the material. Usually, a high b-value reflects an overwhelming number of small AE events generated, representing new crack formation and slow crack growth. In contrast, a low b-value indicates faster and unstable crack growth accompanied by relatively high amplitude AE events in large numbers.
log H = ab × log A
where H is the number of hits having amplitudes larger than A, A is the signal amplitude (dB), a is an empirically derived constant, 2.5 is used in this study.
By defining DN values as the function of loading time, more delicate information was captured. At the initial stage of uniaxial loading, all DN values exhibited a linear upward trend corresponding to the coalescence of pre-existing voids and the rubbing of cracks [69]. Because of the different bearing capacities of the anisotropic samples, the fractal dimension successively increased to the maximum values. Then, as the microcracks gradually converged to specific major crack zones with the AE events showing more order distribution, they then respectively decreased to minimums, ranging from 0.8 to 1.1. However, at the end of loading, the A2-28D and B2-28D samples showed a rebound trend which could be explained by the squeezing and collision of the residual structures. The b-value results (Figure 9) show that all the tested samples decreased gradually during the initial stage, which corroborated the investigations of DN values in the initial stage. Besides, samples with higher OPC content and water-washing pre-treatment showed more substantial fluctuations representing the release of stored energy. The downward trend was demonstrated in the final loading stage for the 7 day cured samples with A1 and A2 proportions (Figure 9a). However, in B1-7D and B2-7D, an intertwined trend was revealed instead of downward, which could be related to the low OPC ratio. Besides, curing can bring a downward trend to the b-values, especially in the water-washing treated samples. To progressively understand the relevance between AE signals and hydration systems, the mineralogical composition and morphology were studied.

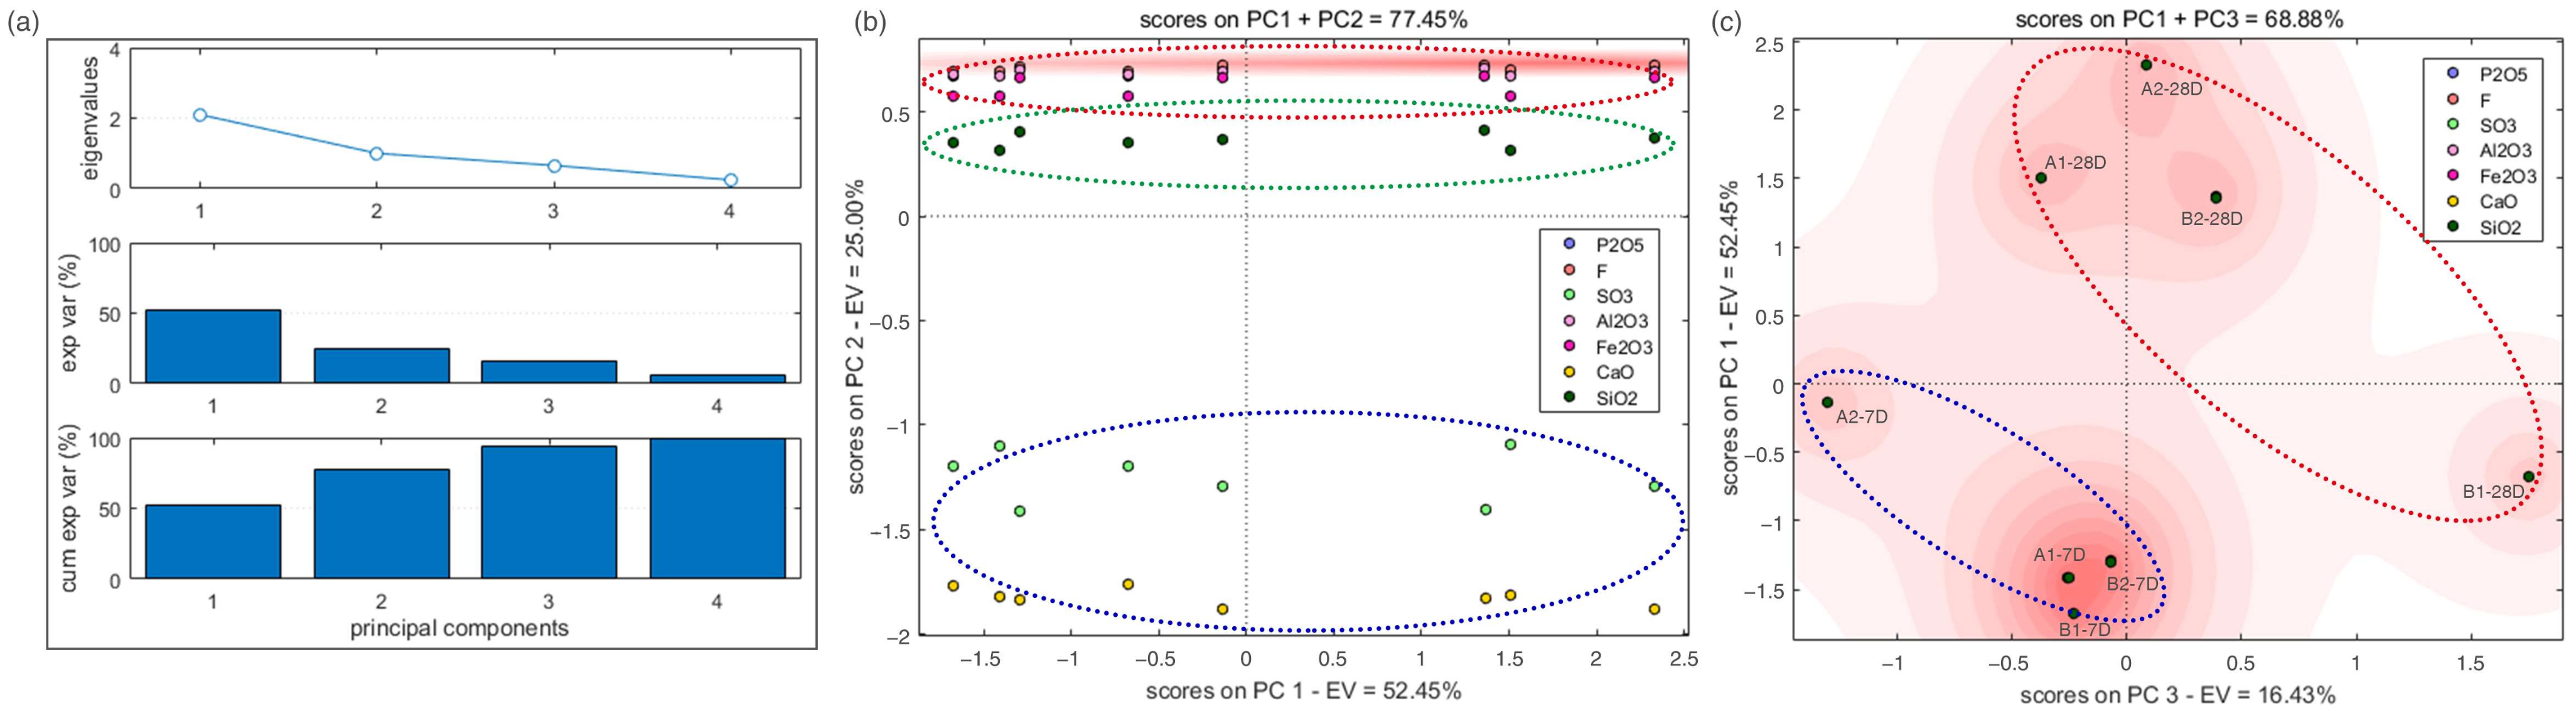
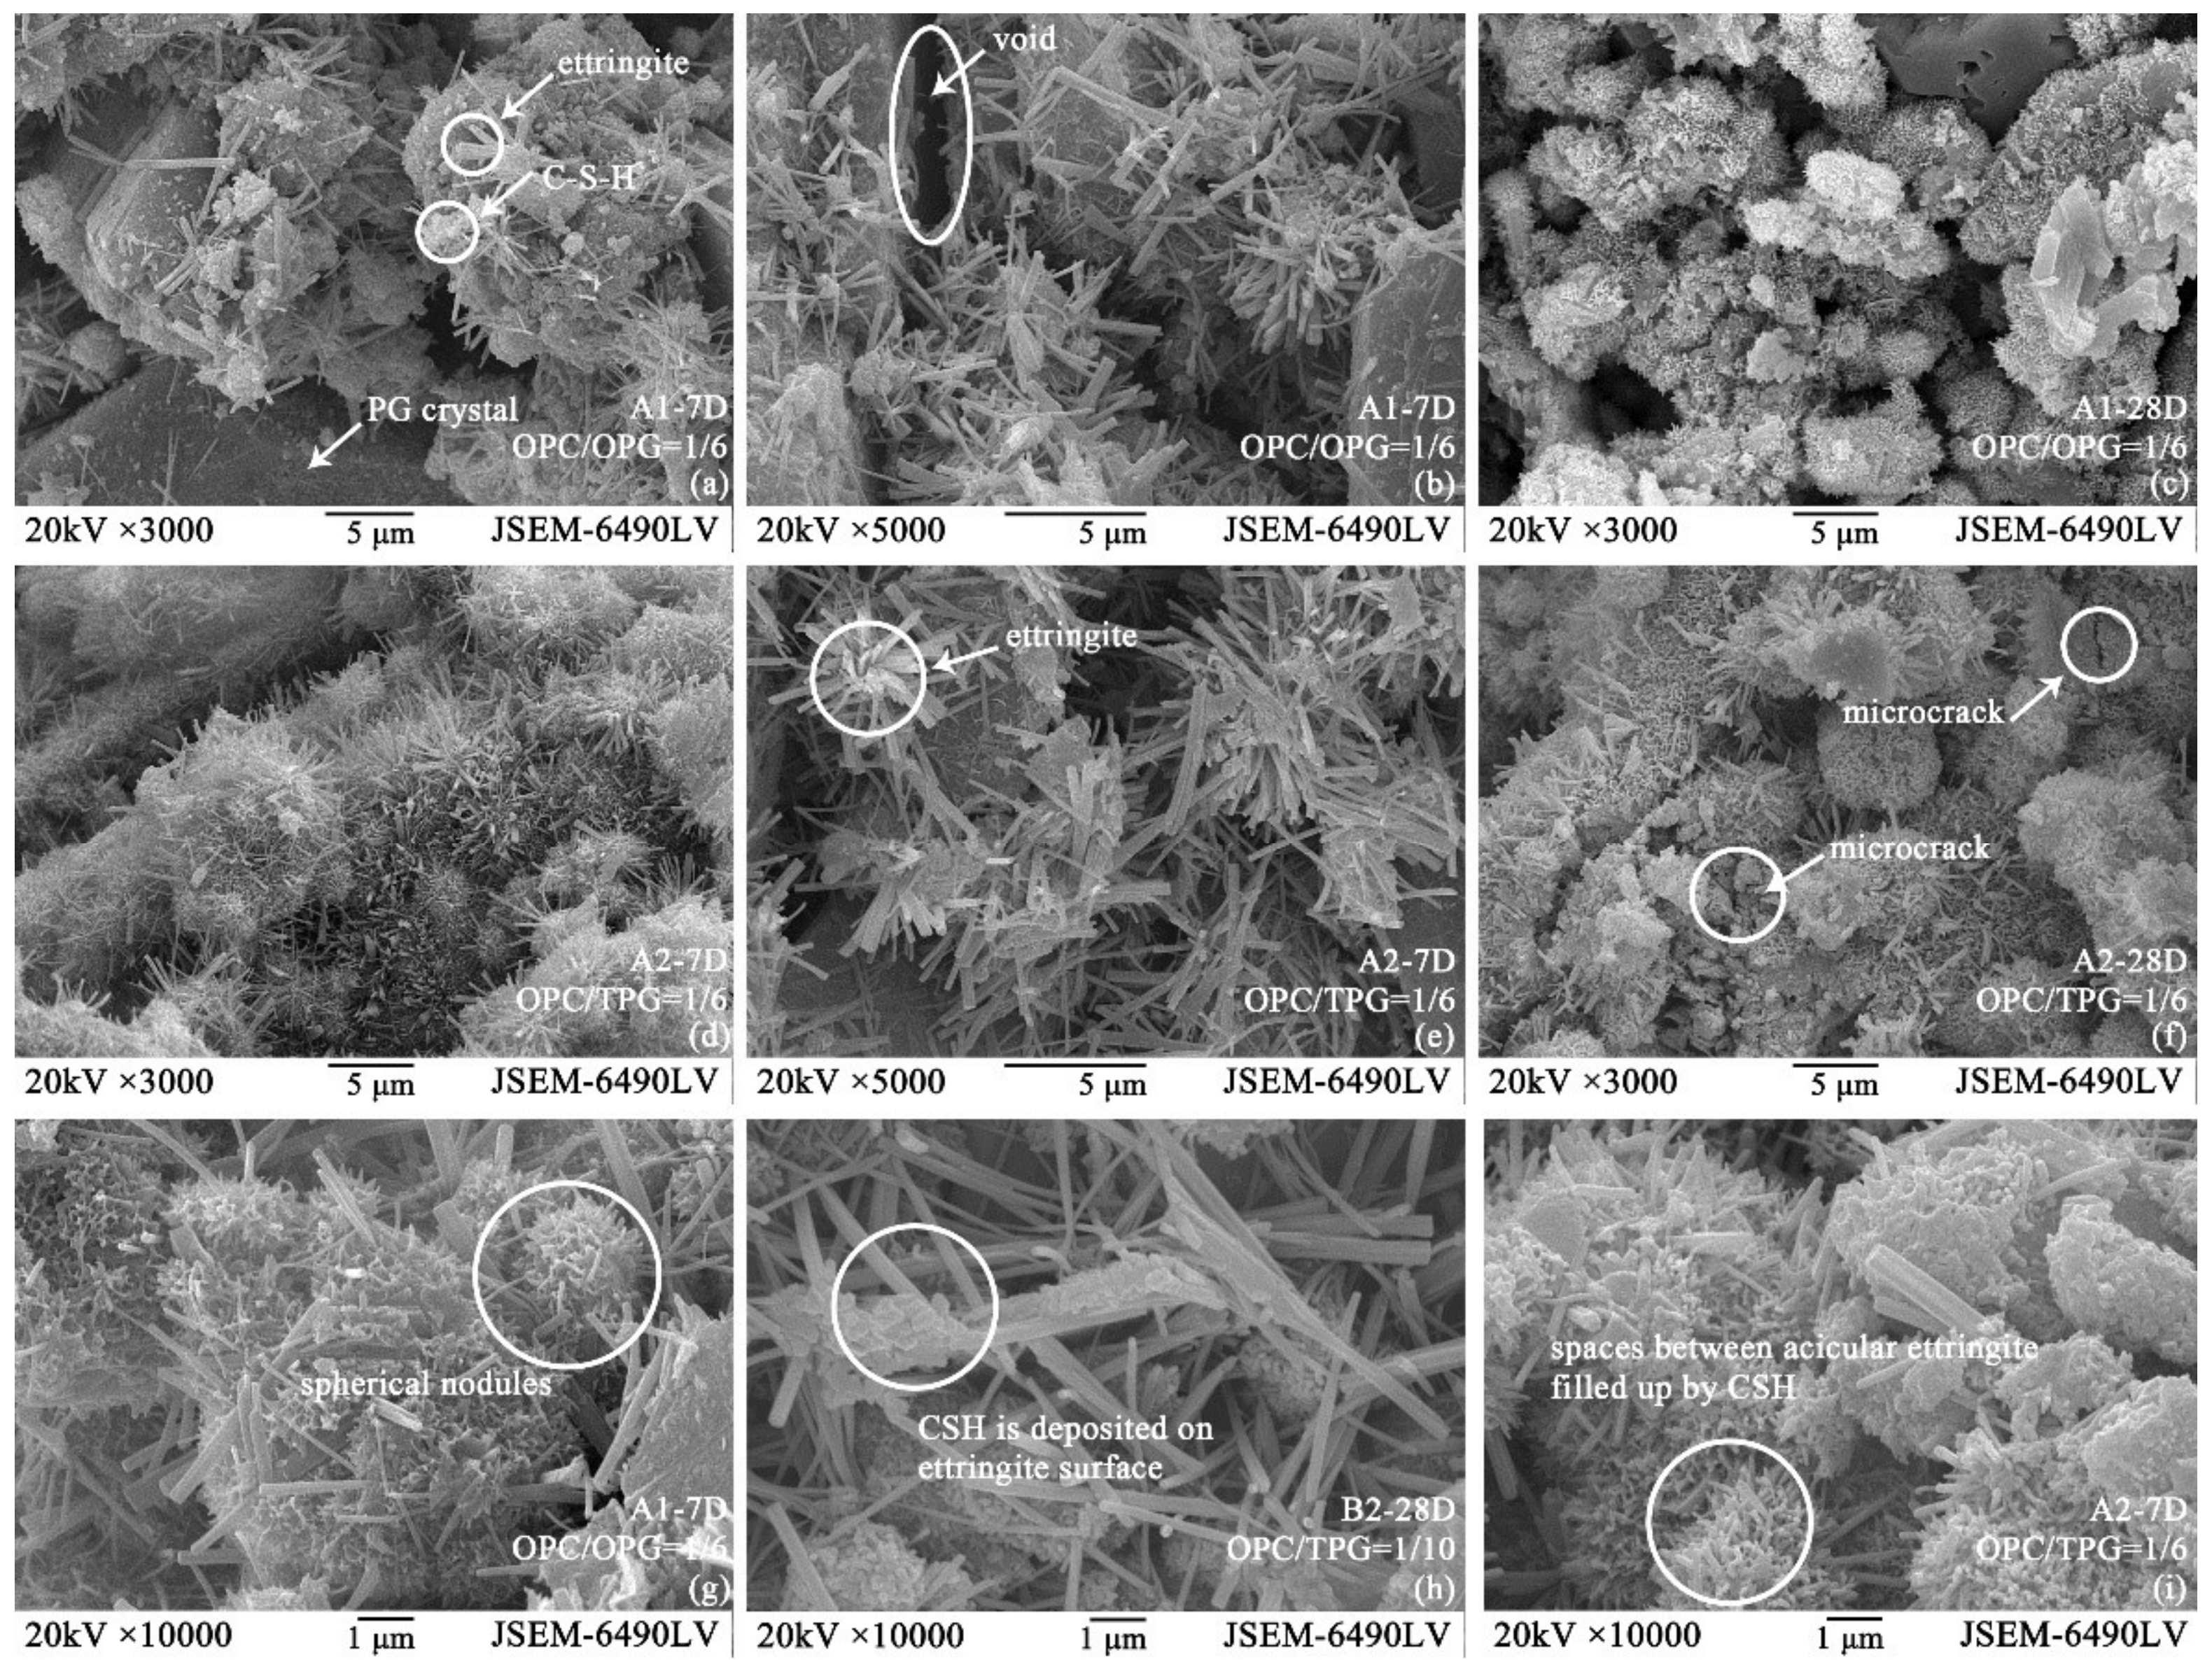
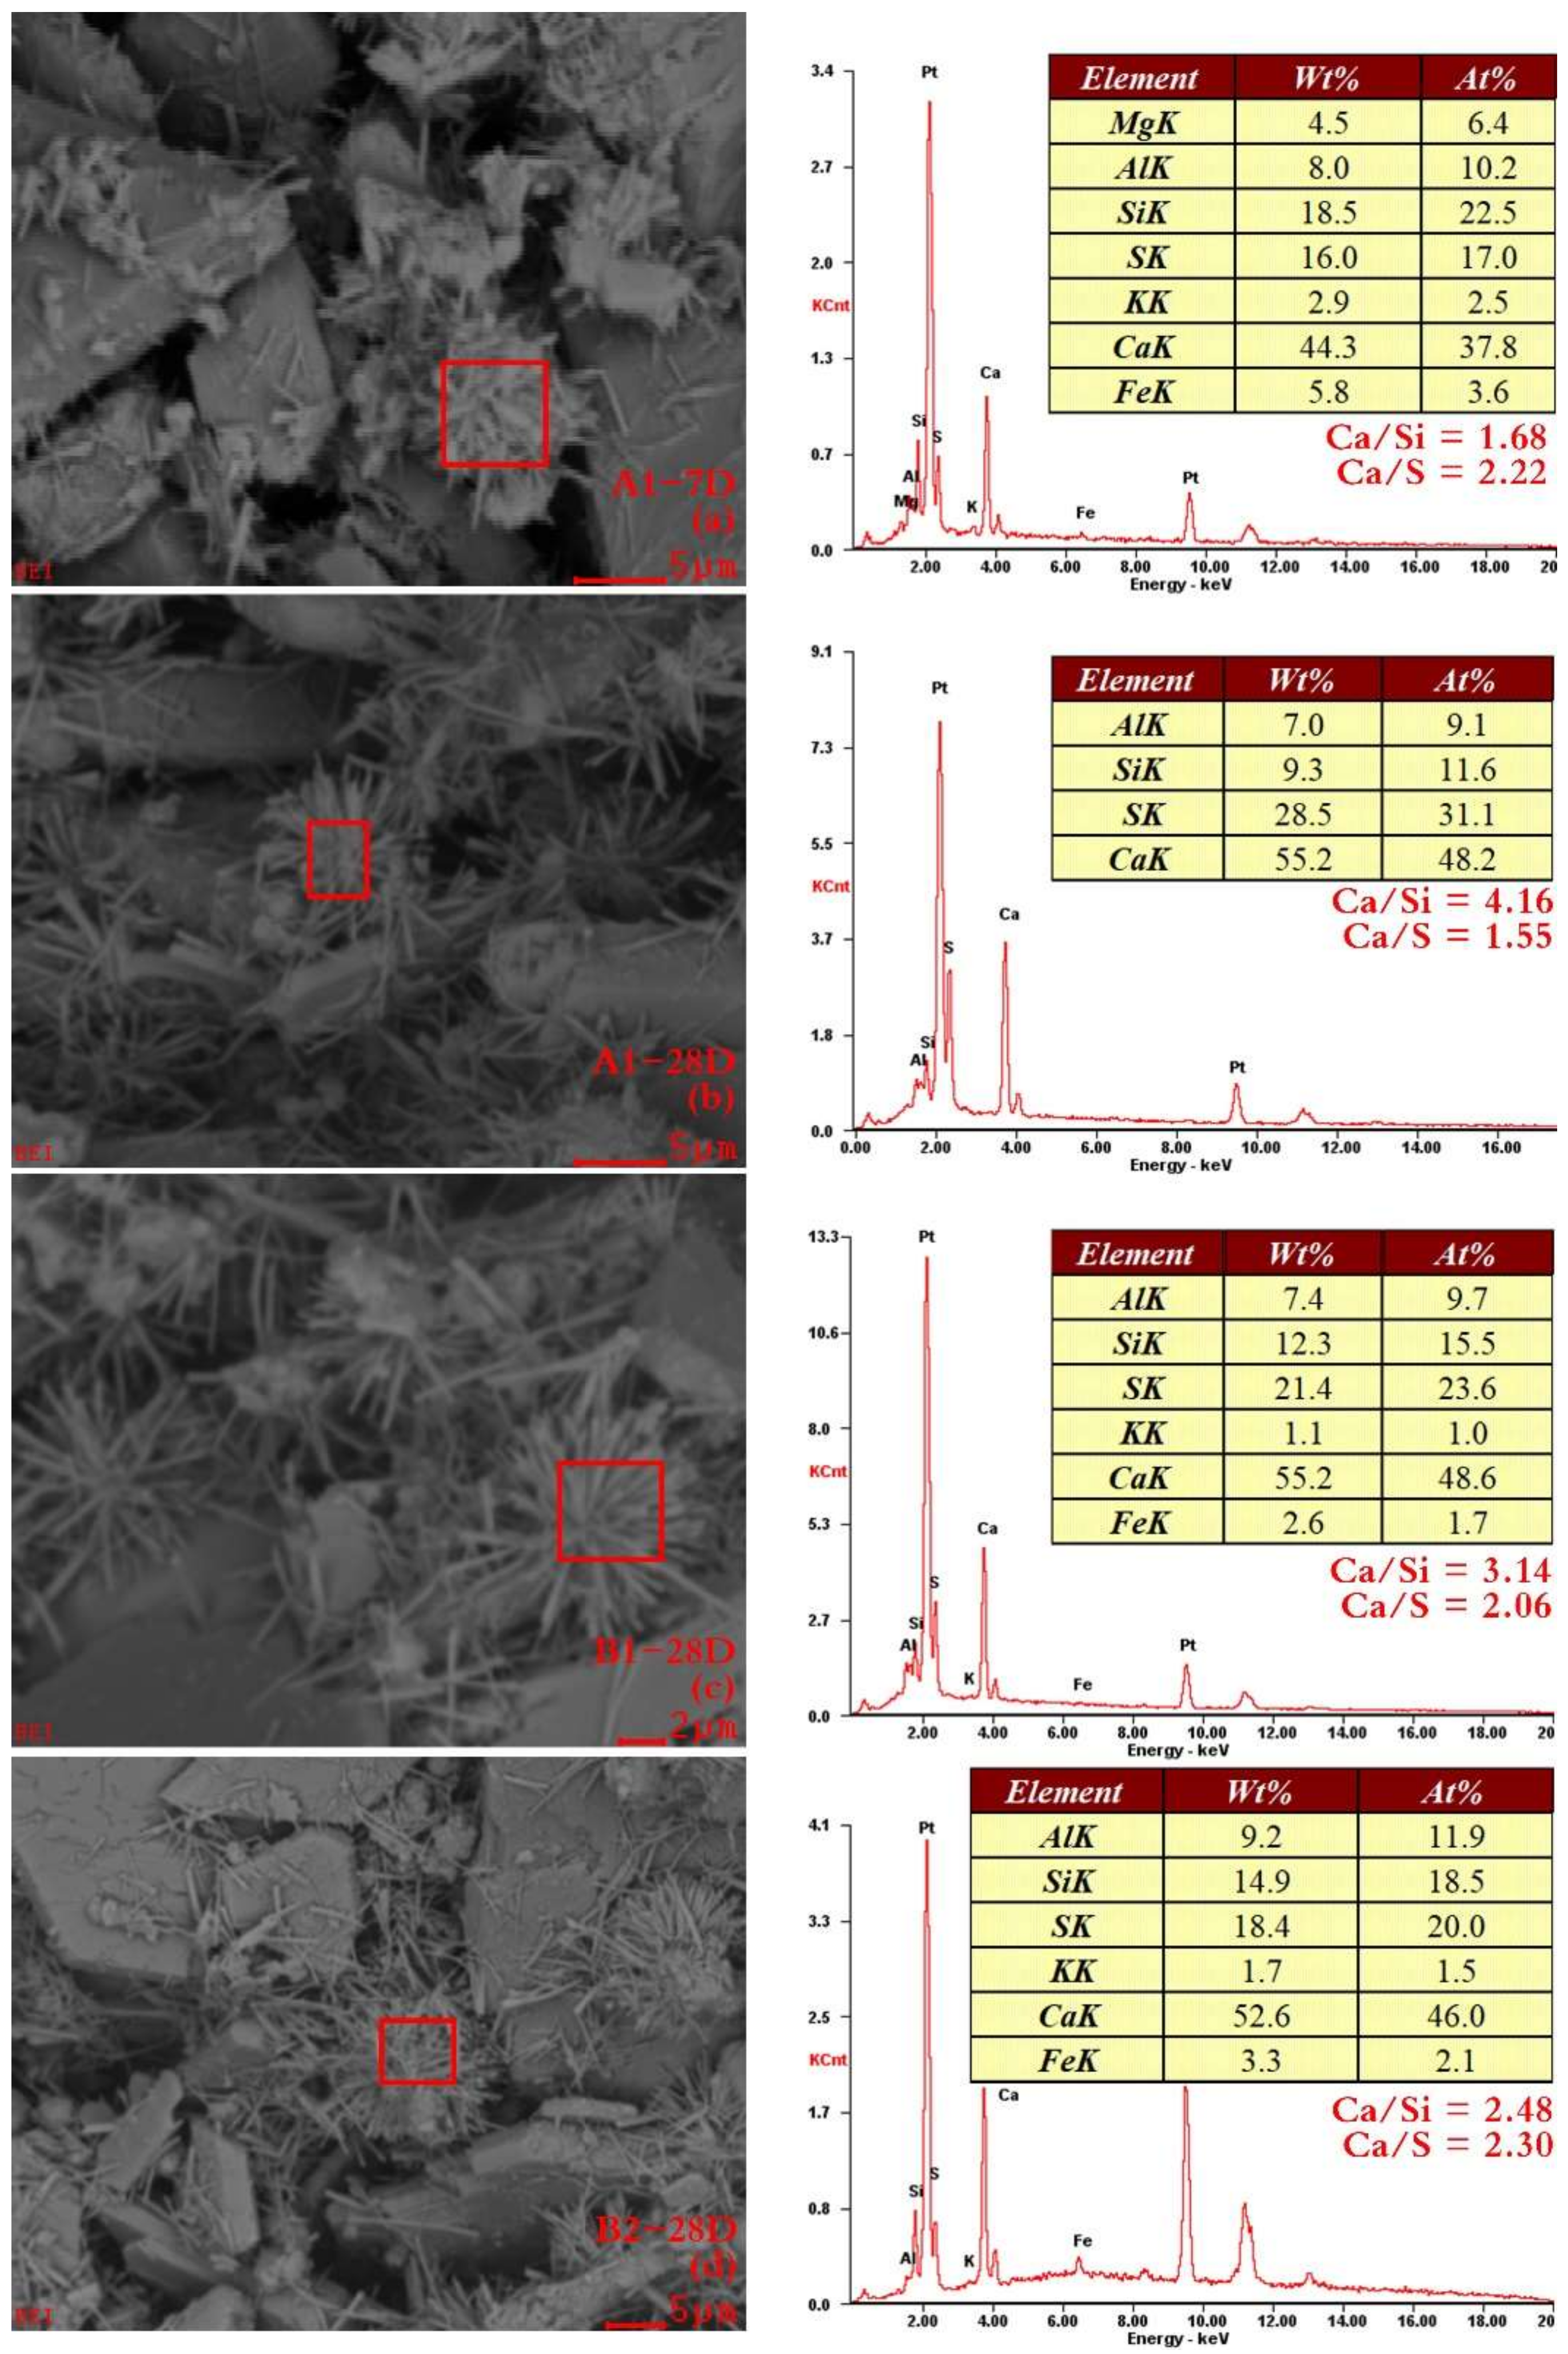
3.4. Microstructure Analysis

X-ray diffraction patterns of OCPB and TCPB samples are presented in Figure 10. It can be seen that the main crystalline hydration product at 7 days was ettringite. At 28 days, the intensity of gypsum significantly decreased, but there was still a large amount of unreacted gypsum present, while the ettringite partially carbonized and produced calcite. In general, carbonization at early hydration can enhance concrete resistance to sulfate attack, chloride penetration, and water absorption [70] but could bring severe threats to concrete structures [71]. In this study, no reduction of compressive strength was observed. Despite attempts to reduce the exposure to atmospheric CO2, it was confirmed that it can decompose by carbonation at 25 °C in a moist atmosphere [31,72]. As regards the source of quartz, this might be attributed to the raw materials instead of the decomposition of CSH [73] because the diffraction peaks in 28 days were not significantly enhanced.
The morphology shows that despite some micro-cracks and uncovered gypsum crystals being observed after 28 days of curing, the initial water-filled space reduced significantly, comparing the 7 day open and friable microstructures (Figure 11a,c,d,f). Similar to the hydrated OPG-based cement system [1,18], hydration products gradually bond unreacted particles to form a solid binder with the formation of an advanced hydration stage. The ettringite generates between the gypsum particles with amorphous hydrate evolving into the structure, filling the initial water-filled space (Figure 11g,h). Moreover, most of the hydration product images in Figure 11 are dominated by large acicular crystals, typically of the order of 0.2~0.5 μm in width and ranging from about 2 μm to over 10 μm in length but little growth occurred subsequently. The gathered CSH gel alternatively filled up the spaces between the acicular ettringite and spherical nodules formed (Figure 11g,i). Besides, even in 28 days, ettringite and CSH gel were the main hydration products instead of monosulfoaluminate and portlandite, which was also verified by XRD. That is because the excess sulfate system and acidic source can induce ettringite formation and portlandite consumption [74]. Furthermore, as demonstrated in the XRD tests, each sample gradually carbonized at the middle and late stages, and a large number of products such as quartz and calcite appeared [31,73]. Hence, after carbonization, precipitation of crystals occupied the spaces of pores and voids, identified as the weakest links.
Although many studies have been conducted [70,71,73], the relation between the chemical composition of hydration products and the macroscopic mechanical properties of the hardened material is not well understood. However, an ettringite assembly of stellate clusters (Figure 11e) has been confirmed that would have a significant contribution to the mechanical properties due to the interlocking of the “arms” from adjacent clusters [75]. Moreover, the presence of the stellate clusters seems to validate the ettringite formation and expansion mechanism [76,77,78]. Figure 12 presents the EDS spectra from stellate ettringite. Several regions were analyzed with EDS and were found to have similar compositions regardless of whether or not they had had water-washing pre-treatment. However, this can be used to eliminate the possibility that the observed phases were other hydrates with similar morphologies. The calculated Ca/S atomic ratios (Figure 12a,c,d) were from 2.06 to 2.30, which are close enough to the theoretical ratio of 2 for ettringite. In contrast, the calculated ratio of the A1-28D sample was only 1.55. It could be responsible for the non-ideal EDS specimens. The uneven flat cannot provide accurate quantitative data [75]. Therefore, the presence of calcite, which presents as the core of the stellate cluster, could be involved because a high Ca/Si ratio was observed.

4. Conclusions

The main goal of this study was to quantify the rheological characterization and failure performance of TCPB, thereby supplying more information for OPG recycling scenarios. Based on the results and discussion, the following conclusions were drawn:
In rheological characterization, all tested pastes demonstrated great shear-thinning and pseudoplastic characters, and the generalized Herschel–Bulkley model had the lowest deviation value. Besides, after water-washings, 13% and 16% of yield stress increase were observed with the ratios of A and B, respectively. The optimized particle size distribution of TPG could contribute to the non-Newtonian properties of TCPB mixtures.
Accompanied by more active AE events, the mechanical properties of the TCPB significantly increased. In both systems, the deformation performance and the activity of AE signals during compression were positively correlated. The AE counts occur during the quiet compaction period, whereas fragmentation dominates in the later stages. Two systems demonstrated similar internal damage fractal characteristics, with the fractal dimensions decreased to approximately 1.0 at the major crack generation period. With PCA, fluorine and phosphorus were confirmed to have an essential side effect on the fractal dimensions, preceded only by calcium and sulfate.
By defining fractal dimension values as a function of loading time, TCPB showed a rebound trend at the final stage, indicating more robust residual structures in these uniaxially compressed specimens. In addition, water-washings can bring downward trends to the b-values, representing unstable cracks with a high amplitude which were prone to generate in TCPB samples.
Through the microstructure and mineralogical analysis, water-washings obviously optimized the pore structures. Another interesting observation is that, in both systems, acicular ettringite was found that joins in the form of stellate clusters. Such a radiative structure may produce better mechanical properties, with the stress to break the interlocked “arms” contributing to the residual stress and the b-values rebound trend in TCPB. However, the hardened phase assemblage hypothesis is the more likely explanation and needs to be developed for future progress.

Supplementary Materials

The following are available online at https://www.mdpi.com/article/10.3390/ma14226993/s1, Figure S1: Diagram of UCS tests accompanied with AE system, Figure S2: Change in Dm values depending on m values selection, Table S1: Calculated parameters of the rheological models.

Author Contributions

Y.L.: Data curation, methodology, software, visualization, writing—original draft, and writing—review and editing; Q.C.: Funding acquisition, conceptualization, supervision, writing—original draft, and writing-review and editing; Y.W.: Funding acquisition, resources; Q.Z.: Funding acquisition, supervision, writing-review; H.L.: Resources and validation; C.J.: Data curation, formal analysis, and investigation; C.Q.: Data curation and investigation. All authors have read and agreed to the published version of the manuscript.

Funding

This research was funded by the science and technology innovation Program of Hunan Province (No. 2021RC3125), the National Natural Science Foundation of China No. 52104156, No. 52074351. and No. 52004330), and a scholarship granted by the China Scholarship Council (Grant No. CSC201906370062). And the APC was funded by the National Natural Science Foundation of China (No. 52104156).

Institutional Review Board Statement

Not applicable.

Informed Consent Statement

Not applicable.

Data Availability Statement

The data presented in this study are available on request from the corresponding author.

Acknowledgments

The authors thank Kai Luo, Xue Chen, Jianfeng Yang, and Yunrui Guo for acoustic emission data analyses.

Conflicts of Interest

The authors declare that they have no known competing financial interests or personal relationships that could have influenced the work reported in this paper.

Abbreviations

AEAcoustic emission
CPBCemented paste backfill
CSHCalcium silicate hydrates
DWDeionized water
OCPBOrdinary phosphogypsum based cemented paste backfill
OPCOrdinary Portland cement
OPGOrdinary phosphogypsum
PCAPrincipal component analysis
PSDParticle size distribution
SEMScanning electron microscopy
TCPBWater-washing treated phosphogypsum based cemented paste backfill
TPGWater-washing pre-treated phosphogypsum
UCSUniaxial compression strength
XRDX-ray powder diffraction
XRFX-ray fluorescence

References

  1. Chen, Q.; Zhang, Q.; Qi, C.; Fourie, A.; Xiao, C. Recycling phosphogypsum and construction demolition waste for cemented paste backfill and its environmental impact. J. Clean. Prod. 2018, 186, 418–429. [Google Scholar] [CrossRef]
  2. Fatila, E.M.; Pink, M.; Twum, E.B.; Karty, J.A.; Flood, A.H. Phosphate-phosphate oligomerization drives higher order co-assemblies with stacks of cyanostar macrocycles. Chem. Sci. 2018, 9, 2863–2872. [Google Scholar] [CrossRef] [PubMed] [Green Version]
  3. Geissler, B.; Mew, M.C.; Weber, O.; Steiner, G. Efficiency performance of the world’s leading corporations in phosphate rock mining. Resour. Conserv. Recycl. 2015, 105, 246–258. [Google Scholar] [CrossRef]
  4. Dong, L.; Shu, W.; Li, X.; Zhou, Z.; Gong, F.; Liu, X. Quantitative Evaluation and Case Study of Risk Degree for Underground Goafs with Multiple Indexes considering Uncertain Factors in Mines. Geofluids 2017, 2017, 1–15. [Google Scholar] [CrossRef] [Green Version]
  5. Li, H.; Zhao, B.; Guo, G.; Zha, J.; Bi, J. The influence of an abandoned goaf on surface subsidence in an adjacent working coal face: A prediction method. Bull. Eng. Geol. Environ. 2018, 77, 305–315. [Google Scholar] [CrossRef]
  6. Baryakh, A.A.; Telegina, E.A.; Samodelkina, N.A.; Devyatkov, S.Y. Prediction of the intensive surface subsidences in mining potash series. J. Min. Sci. 2005. [Google Scholar] [CrossRef]
  7. Gorman, M.R.; Dzombak, D.A. A review of sustainable mining and resource management: Transitioning from the life cycle of the mine to the life cycle of the mineral. Resour. Conserv. Recycl. 2018, 137, 281–291. [Google Scholar] [CrossRef]
  8. Geissler, B.; Hermann, L.; Mew, M.C.; Steiner, G. Striving toward a circular economy for phosphorus: The role of phosphate rock mining. Minerals 2018, 8, 395. [Google Scholar] [CrossRef] [Green Version]
  9. Pinto, P.X.; Al-Abed, S.R.; Holder, C.; Reisman, D.J. Evaluation of metal partitioning and mobility in a sulfidic mine tailing pile under oxic and anoxic conditions. J. Environ. Manag. 2014, 140, 135–144. [Google Scholar] [CrossRef]
  10. Chen, X.; Shi, X.; Zhou, J.; Chen, Q.; Yang, C. Feasibility of recycling ultrafine leaching residue by backfill: Experimental and CFD approaches. Minerals 2017, 7, 1–13. [Google Scholar] [CrossRef] [Green Version]
  11. Rashad, A.M. Phosphogypsum as a construction material. J. Clean. Prod. 2017, 166, 732–743. [Google Scholar] [CrossRef]
  12. Borges, R.C.; Ribeiro, F.C.A.; Da Costa Lauria, D.; Bernedo, A.V.B. Influence of phosphogypsum stacks on the distribution of natural radionuclides in surface and subsurface waters in the city of Imbituba, SC, Brazil. Water. Air. Soil Pollut. 2013, 224. [Google Scholar] [CrossRef]
  13. Xu, J.; Fan, L.; Xie, Y.; Wu, G. Recycling-equilibrium strategy for phosphogypsum pollution control in phosphate fertilizer plants. J. Clean. Prod. 2019, 215, 175–197. [Google Scholar] [CrossRef]
  14. Abril, J.M.; García-Tenorio, R.; Periáñez, R.; Enamorado, S.M.; Andreu, L.; Delgado, A. Occupational dosimetric assessment (inhalation pathway) from the application of phosphogypsum in agriculture in South West Spain. J. Environ. Radioact. 2009, 100, 29–34. [Google Scholar] [CrossRef]
  15. Soares, J.R.; Cantarella, H.; de Campos Menegale, M.L. Ammonia volatilization losses from surface-applied urea with urease and nitrification inhibitors. Soil Biol. Biochem. 2012, 52, 82–89. [Google Scholar] [CrossRef]
  16. Cánovas, C.R.; Chapron, S.; Arrachart, G.; Pellet-Rostaing, S. Leaching of rare earth elements (REEs) and impurities from phosphogypsum: A preliminary insight for further recovery of critical raw materials. J. Clean. Prod. 2019, 219, 225–235. [Google Scholar] [CrossRef]
  17. Deǧirmenci, N. Utilization of phosphogypsum as raw and calcined material in manufacturing of building products. Constr. Build. Mater. 2008, 22, 1857–1862. [Google Scholar] [CrossRef]
  18. Yang, L.; Zhang, Y.; Yan, Y. Utilization of original phosphogypsum as raw material for the preparation of self-leveling mortar. J. Clean. Prod. 2016, 127, 204–213. [Google Scholar] [CrossRef]
  19. Bagade, M.A.; Satone, S.R. An experimental investigation of partial replacement of cement by various percentage of Phosphogypsum in cement concrete. Int. J. Eng. Res. Appl. 2012, 2, 785–787. [Google Scholar]
  20. Liu, S.; Wang, L.; Yu, B. Effect of modified phosphogypsum on the hydration properties of the phosphogypsum-based supersulfated cement. Constr. Build. Mater. 2019, 214, 9–16. [Google Scholar] [CrossRef]
  21. Tian, T.; Yan, Y.; Hu, Z.; Xu, Y.; Chen, Y.; Shi, J. Utilization of original phosphogypsum for the preparation of foam concrete. Constr. Build. Mater. 2016, 115, 143–152. [Google Scholar] [CrossRef]
  22. Li, X.; Du, J.; Gao, L.; He, S.; Gan, L.; Sun, C.; Shi, Y. Immobilization of phosphogypsum for cemented paste backfill and its environmental effect. J. Clean. Prod. 2017, 156, 137–146. [Google Scholar] [CrossRef]
  23. Zhang, Q.L.; Li, Y.T.; Chen, Q.S.; Liu, Y.K.; Feng, Y.; Wang, D. Effects of temperatures and pH values on rheological properties of cemented paste backfill. J. Cent. South Univ. 2021, 28, 1707–1723. [Google Scholar] [CrossRef]
  24. Fall, M.; Adrien, D.; Célestin, J.C.; Pokharel, M.; Touré, M. Saturated hydraulic conductivity of cemented paste backfill. Miner. Eng. 2009, 22, 1307–1317. [Google Scholar] [CrossRef]
  25. Jiang, H.; Fall, M.; Cui, L. Freezing behaviour of cemented paste backfill material in column experiments. Constr. Build. Mater. 2017, 147, 837–846. [Google Scholar] [CrossRef]
  26. Li, X.; Zhou, S.; Zhou, Y.; Min, C.; Cao, Z.; Du, J.; Luo, L.; Shi, Y. Durability Evaluation of Phosphogypsum-Based Cemented Backfill Through Drying-Wetting Cycles. Minerals 2019, 9, 321. [Google Scholar] [CrossRef] [Green Version]
  27. Nizevičienė, D.; Vaičiukynienė, D.; Vaitkevičius, V.; Rudžionis, Ž. Effects of waste fluid catalytic cracking on the properties of semi-hydrate phosphogypsum. J. Clean. Prod. 2016, 137, 150–156. [Google Scholar] [CrossRef]
  28. Potgieter, J.H.; Potgieter, S.S.; McCrindle, R.I.; Strydom, C.A. An investigation into the effect of various chemical and physical treatments of a South African phosphogypsum to render it suitable as a set retarder for cement. Cem. Concr. Res. 2003, 33, 1223–1227. [Google Scholar] [CrossRef]
  29. Huang, Y.; Qian, J.; Liang, J.; Liu, N.; Li, F.; Shen, Y. Characterization and calorimetric study of early-age hydration behaviors of synthetic ye’elimite doped with the impurities in phosphogypsum. J. Therm. Anal. Calorim. 2016, 123, 1545–1553. [Google Scholar] [CrossRef]
  30. Jiang, G.; Wu, A.; Wang, Y.; Lan, W. Low cost and high efficiency utilization of hemihydrate phosphogypsum: Used as binder to prepare filling material. Constr. Build. Mater. 2018, 167, 263–270. [Google Scholar] [CrossRef]
  31. Liu, S.; Ouyang, J.; Ren, J. Mechanism of calcination modification of phosphogypsum and its effect on the hydration properties of phosphogypsum-based supersulfated cement. Constr. Build. Mater. 2020, 243, 118226. [Google Scholar] [CrossRef]
  32. Liu, Y.; Zhang, Q.; Chen, Q.; Qi, C.; Su, Z.; Huang, Z. Utilisation of water-washing pre-treated phosphogypsum for cemented paste backfill. Minerals 2019, 9, 175. [Google Scholar] [CrossRef] [Green Version]
  33. Monat, L.; Chaudhury, S.; Nir, O. Enhancing the Sustainability of Phosphogypsum Recycling by Integrating Electrodialysis with Bipolar Membranes. ACS Sustain. Chem. Eng. 2020, 8, 2490–2497. [Google Scholar] [CrossRef]
  34. Yan, D.; Peng, Z.; Yu, L.; Sun, Y.; Yong, R.; Karstensen, K.H. Characterization of heavy metals and PCDD/Fs from water-washing pretreatment and a cement kiln co-processing municipal solid waste incinerator fly ash. Waste Manag. 2018, 76, 106–116. [Google Scholar] [CrossRef] [PubMed]
  35. Mao, Y.; Wu, H.; Wang, W.; Jia, M.; Che, X. Pretreatment of municipal solid waste incineration fly ash and preparation of solid waste source sulphoaluminate cementitious material. J. Hazard. Mater. 2020, 385, 121580. [Google Scholar] [CrossRef]
  36. Rosales, J.; Pérez, S.M.; Cabrera, M.; Gázquez, M.J.; Bolivar, J.P.; de Brito, J.; Agrela, F. Treated phosphogypsum as an alternative set regulator and mineral addition in cement production. J. Clean. Prod. 2020, 244, 118752. [Google Scholar] [CrossRef]
  37. Ohno, K.; Ohtsu, M. Crack classification in concrete based on acoustic emission. Constr. Build. Mater. 2010, 24, 2339–2346. [Google Scholar] [CrossRef]
  38. Jiang, Y.; Xu, F.; Xu, B.; Jia, M.; Hu, J.; Gallego, A. Simulation and experimental investigation on the AE tomography to improve AE source location in the concrete structure. Math. Probl. Eng. 2014, 2014, 1–10. [Google Scholar] [CrossRef] [Green Version]
  39. Alver, N.; Tanarslan, H.M.; Sülün, Ö.Y.; Ercan, E.; Karcili, M.; Selman, E.; Ohno, K. Effect of CFRP-spacing on fracture mechanism of CFRP-strengthened reinforced concrete beam identified by AE-SiGMA. Constr. Build. Mater. 2014, 67, 146–156. [Google Scholar] [CrossRef]
  40. Ingraham, M.D.; Issen, K.A.; Holcomb, D.J. Use of acoustic emissions to investigate localization in high-porosity sandstone subjected to true triaxial stresses. Acta Geotech. 2013, 8, 645–663. [Google Scholar] [CrossRef]
  41. Dong, L.; Shu, W.; Sun, D.; Li, X.; Zhang, L. Pre-Alarm System Based on Real-Time Monitoring and Numerical Simulation Using Internet of Things and Cloud Computing for Tailings Dam in Mines. IEEE Access 2017, 5, 21080–21089. [Google Scholar] [CrossRef]
  42. Li, J.; Huang, Y.; Qi, W.; Kong, G.; Song, T. Loose gangues backfill body’s acoustic emissions rules during compaction test: Based on solid backfill mining. C.-Comput. Model. Eng. Sci. 2018, 115, 85–103. [Google Scholar] [CrossRef]
  43. Qi, T.; Feng, G. Resistivity and AE response characteristics in the failure process of CGB under uniaxial loading. Adv. Mater. Sci. Eng. 2017, 2017, 1–11. [Google Scholar] [CrossRef] [Green Version]
  44. Hames, B.; Ruiz, R.; Scarlata, C.; Sluiter, A.; Sluiter, J.; Templeton, D. Preparation of Samples for Compositional Analysis. Lab. Anal. Proced. (LAP) 2008, 1617, 65–71. [Google Scholar]
  45. Zhou, S.; Li, X.; Zhou, Y.; Min, C.; Shi, Y. Effect of phosphorus on the properties of phosphogypsum-based cemented backfill. J. Hazard. Mater. 2020, 399, 122993. [Google Scholar] [CrossRef]
  46. Liu, G.; Li, L.; Yao, M.; Landry, D.; Malek, F.; Yang, X.; Guo, L. An investigation of the uniaxial compressive strength of a cemented hydraulic backfill made of alluvial sand. Minerals 2017, 7, 1–13. [Google Scholar] [CrossRef] [Green Version]
  47. Ke, X.; Hou, H.; Zhou, M.; Wang, Y.; Zhou, X. Effect of particle gradation on properties of fresh and hardened cemented paste backfill. Constr. Build. Mater. 2015, 96, 378–382. [Google Scholar] [CrossRef]
  48. Gong, C.; Li, C.H.; Zhao, K. Study on fractal dimension of acoustic emission during cemented backfill micro crack evolution process. Appl. Mech. Mater. 2014, 556–562, 236–240. [Google Scholar] [CrossRef]
  49. Hot, J.; Bessaies-Bey, H.; Brumaud, C.; Duc, M.; Castella, C.; Roussel, N. Adsorbing polymers and viscosity of cement pastes. Cem. Concr. Res. 2014, 63, 12–19. [Google Scholar] [CrossRef]
  50. Yahia, A.; Khayat, K.H. Applicability of rheological models to high-performance grouts containing supplementary cementitious materials and viscosity enhancing admixture. Mater. Struct. Constr. 2003, 36, 402–412. [Google Scholar] [CrossRef]
  51. Wang, Y.; Gao, B.; Yue, Q.; Wang, Y. Effect of viscosity, basicity and organic content of composite flocculant on the decolorization performance and mechanism for reactive dyeing wastewater. J. Environ. Sci. 2011, 23, 1626–1633. [Google Scholar] [CrossRef]
  52. Bouras, R.; Kaci, A.; Chaouche, M. Influence of viscosity modifying admixtures on the rheological behavior of cement and mortar pastes. Korea Aust. Rheol. J. 2012, 24, 35–44. [Google Scholar] [CrossRef]
  53. Nehdi, M.; Rahman, M.A. Estimating rheological properties of cement pastes using various rheological models for different test geometry, gap and surface friction. Cem. Concr. Res. 2004, 34, 1993–2007. [Google Scholar] [CrossRef]
  54. Benyounes, K. Rheological behavior of cement-based grout with Algerian bentonite. SN Appl. Sci. 2019, 1, 1–8. [Google Scholar] [CrossRef] [Green Version]
  55. Roussel, N.; Lemaître, A.; Flatt, R.J.; Coussot, P. Steady state flow of cement suspensions: A micromechanical state of the art. Cem. Concr. Res. 2010, 40, 77–84. [Google Scholar] [CrossRef]
  56. Chen, Q.; Tao, Y.; Zhang, Q.; Qi, C. The rheological, mechanical and heavy metal leaching properties of cemented paste backfill under the influence of anionic polyacrylamide. Chemosphere 2022. [Google Scholar] [CrossRef] [PubMed]
  57. Bender, J.W.; Wagner, N.J. Optical measurement of the contributions of colloidal forces to the rheology of concentrated suspensions. J. Colloid Interface Sci. 1995. [Google Scholar] [CrossRef]
  58. Wu, J.; Jing, H.; Yin, Q.; Yu, L.; Meng, B.; Li, S. Strength prediction model considering material, ultrasonic and stress of cemented waste rock backfill for recycling gangue. J. Clean. Prod. 2020, 276, 123189. [Google Scholar] [CrossRef]
  59. Zhao, K.; Yu, X.; Zhu, S.; Zhou, Y.; Wang, Q.; Wang, J. Acoustic emission investigation of cemented paste backfill prepared with tantalum–niobium tailings. Constr. Build. Mater. 2020, 237, 117523. [Google Scholar] [CrossRef]
  60. Xu, W.; Cao, P.; Tian, M. Strength development and microstructure evolution of cemented tailings backfill containing different binder types and contents. Minerals 2018, 8, 1–15. [Google Scholar] [CrossRef] [Green Version]
  61. Carpinteri, A.; Corrado, M.; Lacidogna, G. Three different approaches for damage domain characterization in disordered materials: Fractal energy density, b-value statistics, renormalization group theory. Mech. Mater. 2012, 53, 15–28. [Google Scholar] [CrossRef]
  62. Carpinteri, A.; Lacidogna, G.; Pugno, N. Structural damage diagnosis and life-time assessment by acoustic emission monitoring. Eng. Fract. Mech. 2007, 74, 273–289. [Google Scholar] [CrossRef]
  63. Carpinteri, A.; Cornetti, P. A fractional calculus approach to the description of stress and strain localization in fractal media. Chaos, Solitons and Fractals 2002, 13, 85–94. [Google Scholar] [CrossRef]
  64. Zhao, Y.; Qiu, J.; Zhang, S.; Guo, Z.; Ma, Z.; Sun, X.; Xing, J. Effect of sodium sulfate on the hydration and mechanical properties of lime-slag based eco-friendly binders. Constr. Build. Mater. 2020, 250, 118603. [Google Scholar] [CrossRef]
  65. Albano, A.M.; Muench, J.; Schwartz, C.; Mees, A.I.; Rapp, P.E. Singular-value decomposition and the Grassberger-Procaccia algorithm. Phys. Rev. A 1988. [Google Scholar] [CrossRef] [PubMed] [Green Version]
  66. Dexing, L.; Enyuan, W.; Xiangguo, K.; Haishan, J.; Dongming, W.; Muhammad, A. Damage precursor of construction rocks under uniaxial cyclic loading tests analyzed by acoustic emission. Constr. Build. Mater. 2019, 206, 169–178. [Google Scholar] [CrossRef]
  67. Patil, H.; Dwivedi, A. Prediction of properties of the cement incorporated with nanoparticles by principal component analysis (PCA) and response surface regression (RSR). Mater. Today Proc. 2021, 43, 1358–1367. [Google Scholar] [CrossRef]
  68. Ballabio, D. A MATLAB toolbox for Principal Component Analysis and unsupervised exploration of data structure. Chemom. Intell. Lab. Syst. 2015. [Google Scholar] [CrossRef]
  69. van Mier, J.G.M. Failure of concrete under uniaxial compression: An overview. Fract. Mech. Concr. Struct. 1998, 2, 1169–1182. [Google Scholar]
  70. Rostami, V.; Shao, Y.; Boyd, A.J. Durability of concrete pipes subjected to combined steam and carbonation curing. Constr. Build. Mater. 2011, 25, 3345–3355. [Google Scholar] [CrossRef]
  71. Sideris, K.K.; Savva, A.E.; Papayianni, J. Sulfate resistance and carbonation of plain and blended cements. Cem. Concr. Compos. 2006, 28, 47–56. [Google Scholar] [CrossRef]
  72. Grounds, T.; Midgley, H.G.; Novell, D.V. Carbonation of ettringite by atmospheric carbon dioxide. Thermochim. Acta 1988, 135, 347–352. [Google Scholar] [CrossRef]
  73. Sharma, D.; Goyal, S. Effect of accelerated carbonation curing on near surface properties of concrete. Eur. J. Environ. Civ. Eng. 2020, 1–22. [Google Scholar] [CrossRef]
  74. Pelletier-Chaignat, L.; Winnefeld, F.; Lothenbach, B.; Le Saout, G.; Müller, C.J.; Famy, C. Influence of the calcium sulphate source on the hydration mechanism of Portland cement-calcium sulphoaluminate clinker-calcium sulphate binders. Cem. Concr. Compos. 2011, 33, 551–561. [Google Scholar] [CrossRef]
  75. Hargis, C.W.; Kirchheim, A.P.; Monteiro, P.J.M.; Gartner, E.M. Early age hydration of calcium sulfoaluminate (synthetic ye’elimite, C4A3S) in the presence of gypsum and varying amounts of calcium hydroxide. Cem. Concr. Res. 2013, 48, 105–115. [Google Scholar] [CrossRef]
  76. Scherer, G.W. Stress from crystallization of salt. Cem. Concr. Res. 2004, 34, 1613–1624. [Google Scholar] [CrossRef]
  77. Telesca, A.; Marroccoli, M.; Pace, M.L.; Tomasulo, M.; Valenti, G.L.; Monteiro, P.J.M. A hydration study of various calcium sulfoaluminate cements. Cem. Concr. Compos. 2014, 53, 224–232. [Google Scholar] [CrossRef]
  78. Komatsu, R.; Mizukoshi, N.; Makida, K.; Tsukamoto, K. In-situ observation of ettringite crystals. J. Cryst. Growth 2009, 311, 1005–1008. [Google Scholar] [CrossRef]
Figure 1. Flowchart for this study.
Materials 14 06993 g001
Figure 2. The particle size distribution of the raw materials. CVC: cumulative volume percentage curves; VC: volume distribution curves.
Materials 14 06993 g002
Figure 3. The microstructures of the OPG (a1a3) and TPG (b1b3).
Materials 14 06993 g003
Figure 4. Shear stress and viscosity values of tested mixtures. (a) experimental and simulated shear stress curved of A1 and A2 samples; (b) experimental and simulated shear stress curved of B1 and B2 samples; (c) viscosity values of A1 and A2 samples; (d) viscosity values of B1 and B2 samples.
Materials 14 06993 g004
Figure 5. Relation diagrams of stress, AE counts, and energy rate of OCPB and TCPB with 7 days (a,c) and 28 days of curing (b,d).
Materials 14 06993 g005
Figure 6. The relationship between phase space and correlation dimensions for the AE signals during monotonic compression. (a) samples with proportion A; (b) samples with proportion B.
Materials 14 06993 g006
Figure 7. PCA for the influence of curing ages and chemical composition on mechanical properties and D-values. (a) Elbow plot of PCA. (b) PCA with principal components 1 and 2 (c) PCA with principal components 2 and 3.
Materials 14 06993 g007
Figure 8. The relationship between DN-N during monotonic compression.
Materials 14 06993 g008
Figure 9. b-values of tested specimens. (a) samples with proportion A; (b) samples with proportion B.
Materials 14 06993 g009
Figure 10. XRD patterns of OCPB and TCPB samples in 7 days (a) and 28 days (b).
Materials 14 06993 g010
Figure 11. SEM images of OCPB and TCPB samples. (a,b) Internal microstructure of 7 days cured A1 sample; (c) internal microstructure showing voids still within the 28 days cured A1 sample; (d,e) 7 days cured A2 sample; (f) 28 days cured A2 sample demonstrating a more compact structure; (gi) amorphous hydrates filled the internal cracks.
Materials 14 06993 g011
Figure 12. SEM/EDX images of OCPB and TCPB samples. (a,b) 7 and 28 days cured A1 samples; (c,d) 28 days cured B1 and B2 samples.
Materials 14 06993 g012
Table 1. Mix proportions of the OCPB and TCPB samples.
No.OPG
(Dry, wt%)
TPG
(Dry, wt%)
Water
(wt%)
OPC
(wt%)
OPC/WaterOPG (TPG)/OPC
A151.43-40.008.570.2146:1
B154.55-40.005.450.13610:1
A2-51.4340.008.570.2146:1
B2-54.5540.005.450.13610:1
Table 2. The chemical composition of OPC, OPG, and TPG.
Chemical Composition (%)OPCOPGTPG
Na2O0.100.140.06
MgO1.820.110.01
Al2O34.320.800.29
SiO217.856.245.01
P2O50.211.450.57
SO33.4940.0244.43
Cl0.02--
K2O0.660.620.31
CaO61.0245.8047.15
TiO20.300.690.55
V2O50.04--
Cr2O30.03--
MnO0.27--
Fe2O33.803.011.08
CuO0.01--
ZnO0.04--
SrO0.070.100.06
ZrO20.01--
BaO0.040.080.07
F-0.930.42
Loss5.91--
Table 3. Fitting parameters of ln C(r) − ln r.
SamplesDdR2SamplesDdR2
A1-7D1.011−5.5890.995B1-7D1.009−5.1000.996
A2-7D1.115−5.8210.994B2-7D0.993−4.9560.997
A1-28D1.162−6.0190.992B1-28D0.953−5.1990.996
A2-28D1.116−6.6110.990B2-28D1.087−6.0970.996
Publisher’s Note: MDPI stays neutral with regard to jurisdictional claims in published maps and institutional affiliations.

