Influence of Potassium-Based Alkaline Electrolyzed Water on Hydration Process and the Properties of Cement-Based Materials with Fly Ash

 ,
,
Abstract
:1. Introduction
2. Experimental Program
2.1. Raw Materials
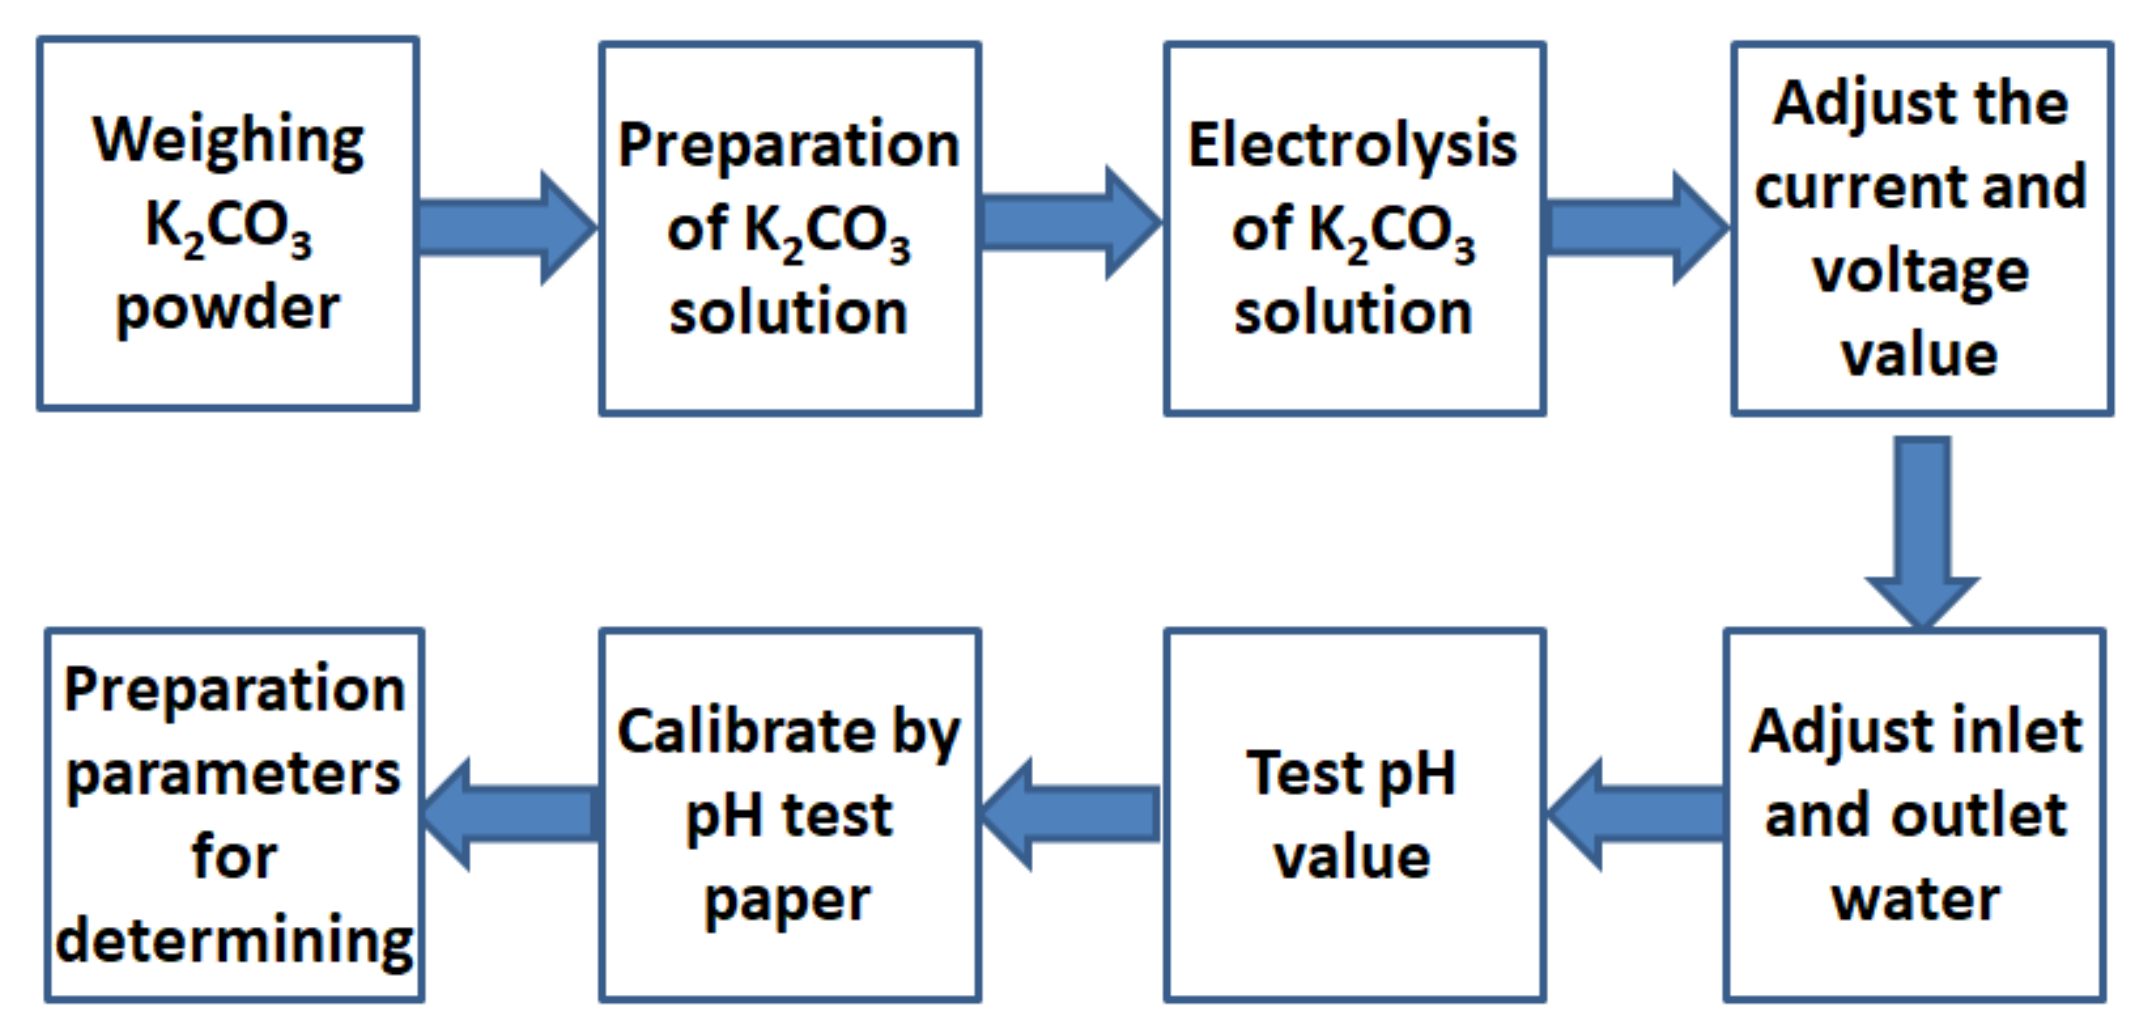
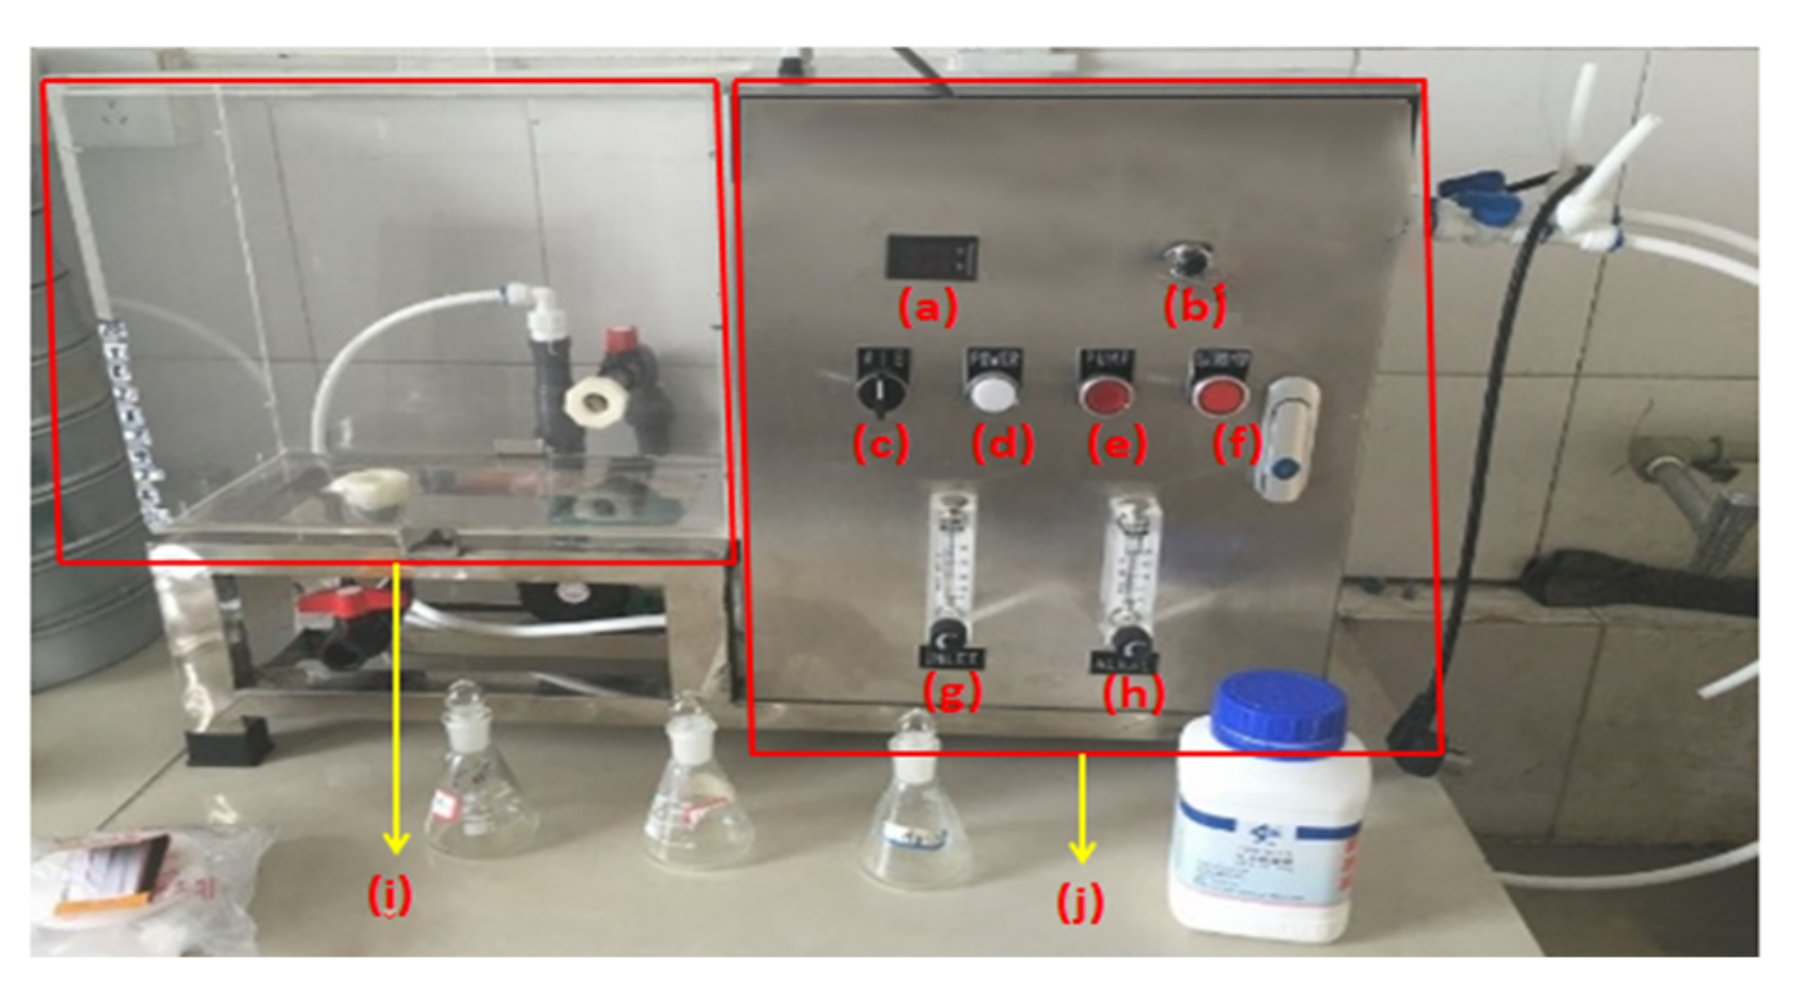
2.2. Preparation Procedures of AEW
2.3. Design of Experiment
2.4. Experimental Methods
2.4.1. Hydration Heat Analysis
2.4.2. XRD Analysis
2.4.3. Differential Thermal Analysis
2.4.4. SEM Observation
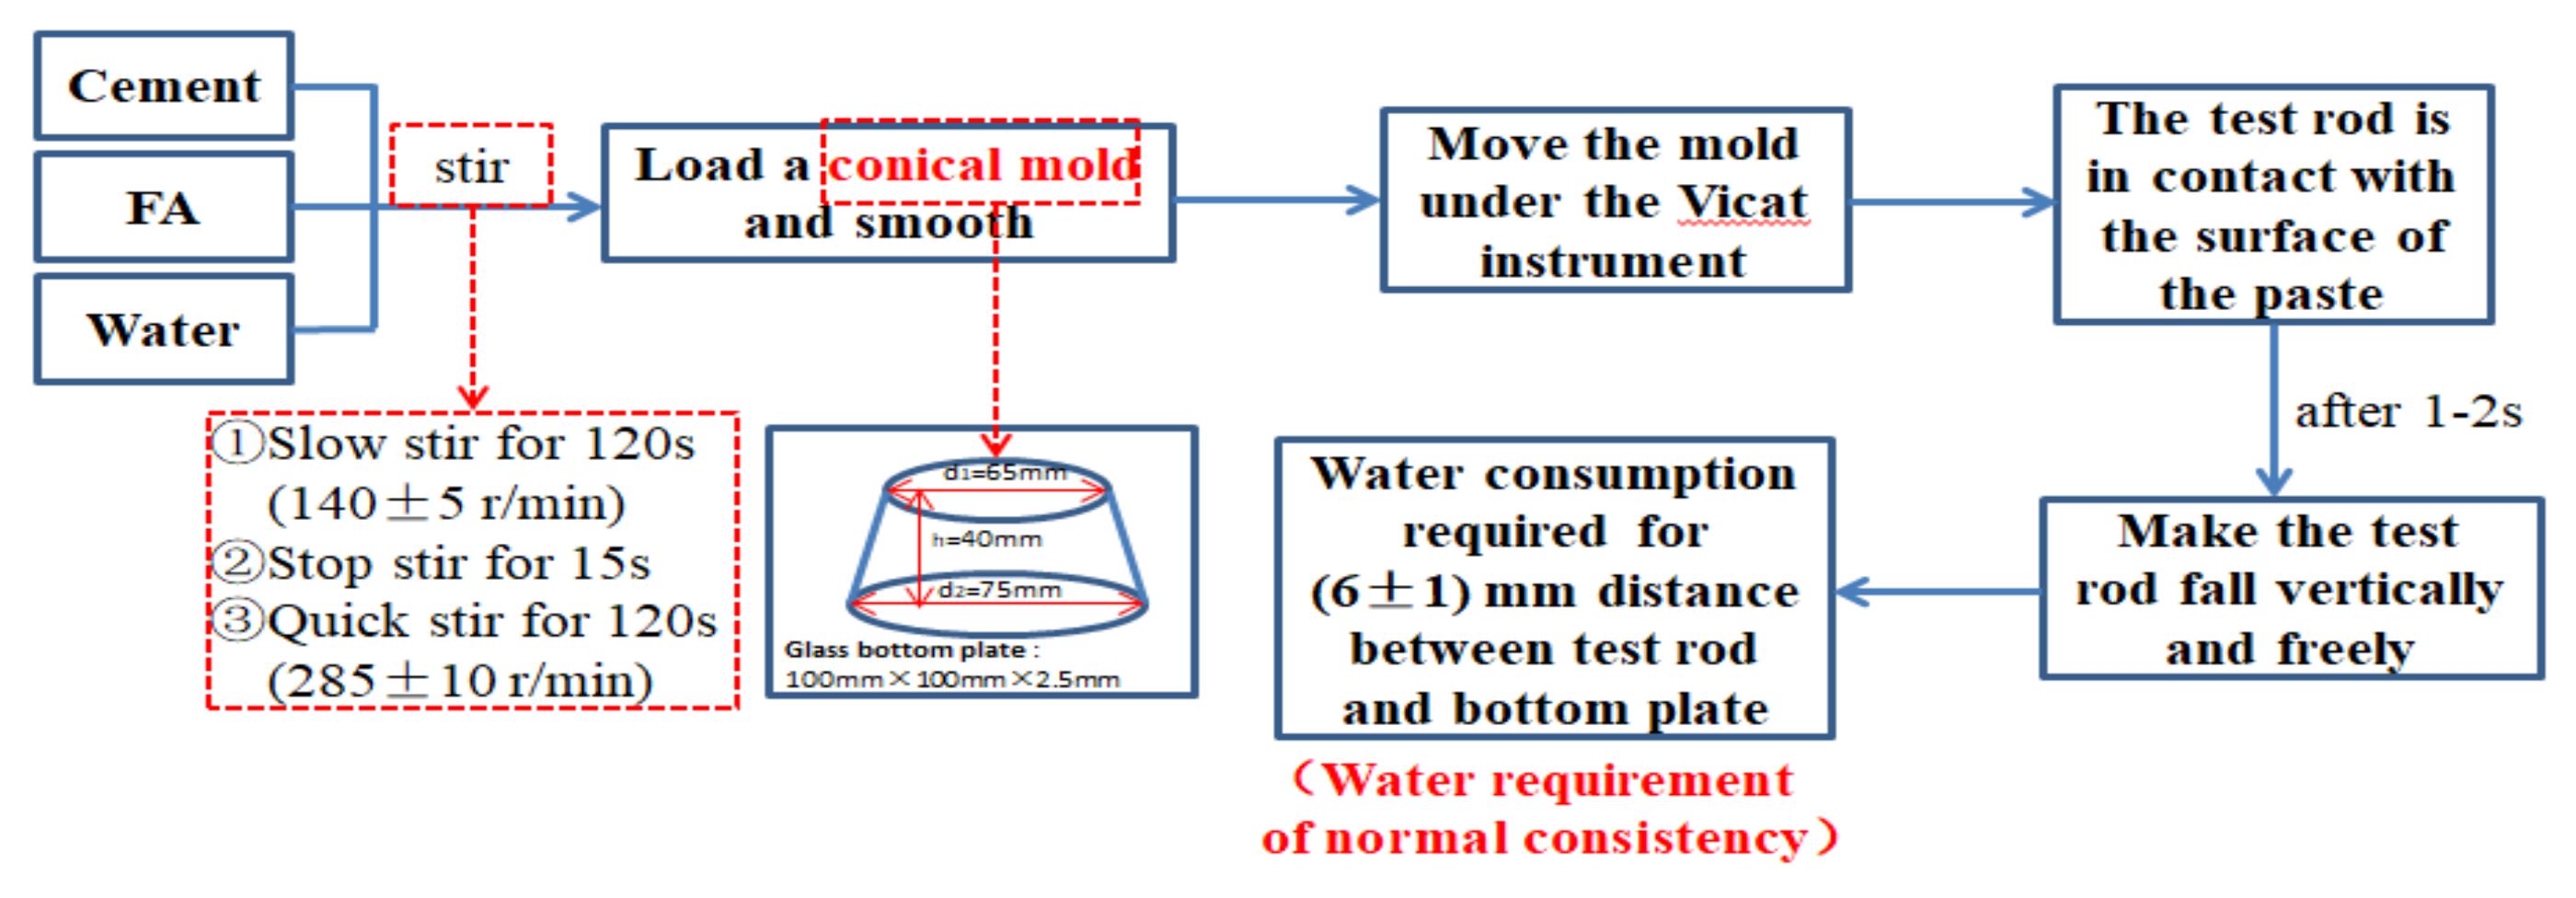
2.4.5. Macroscopic Property Test Methods
3. Results and Discussions
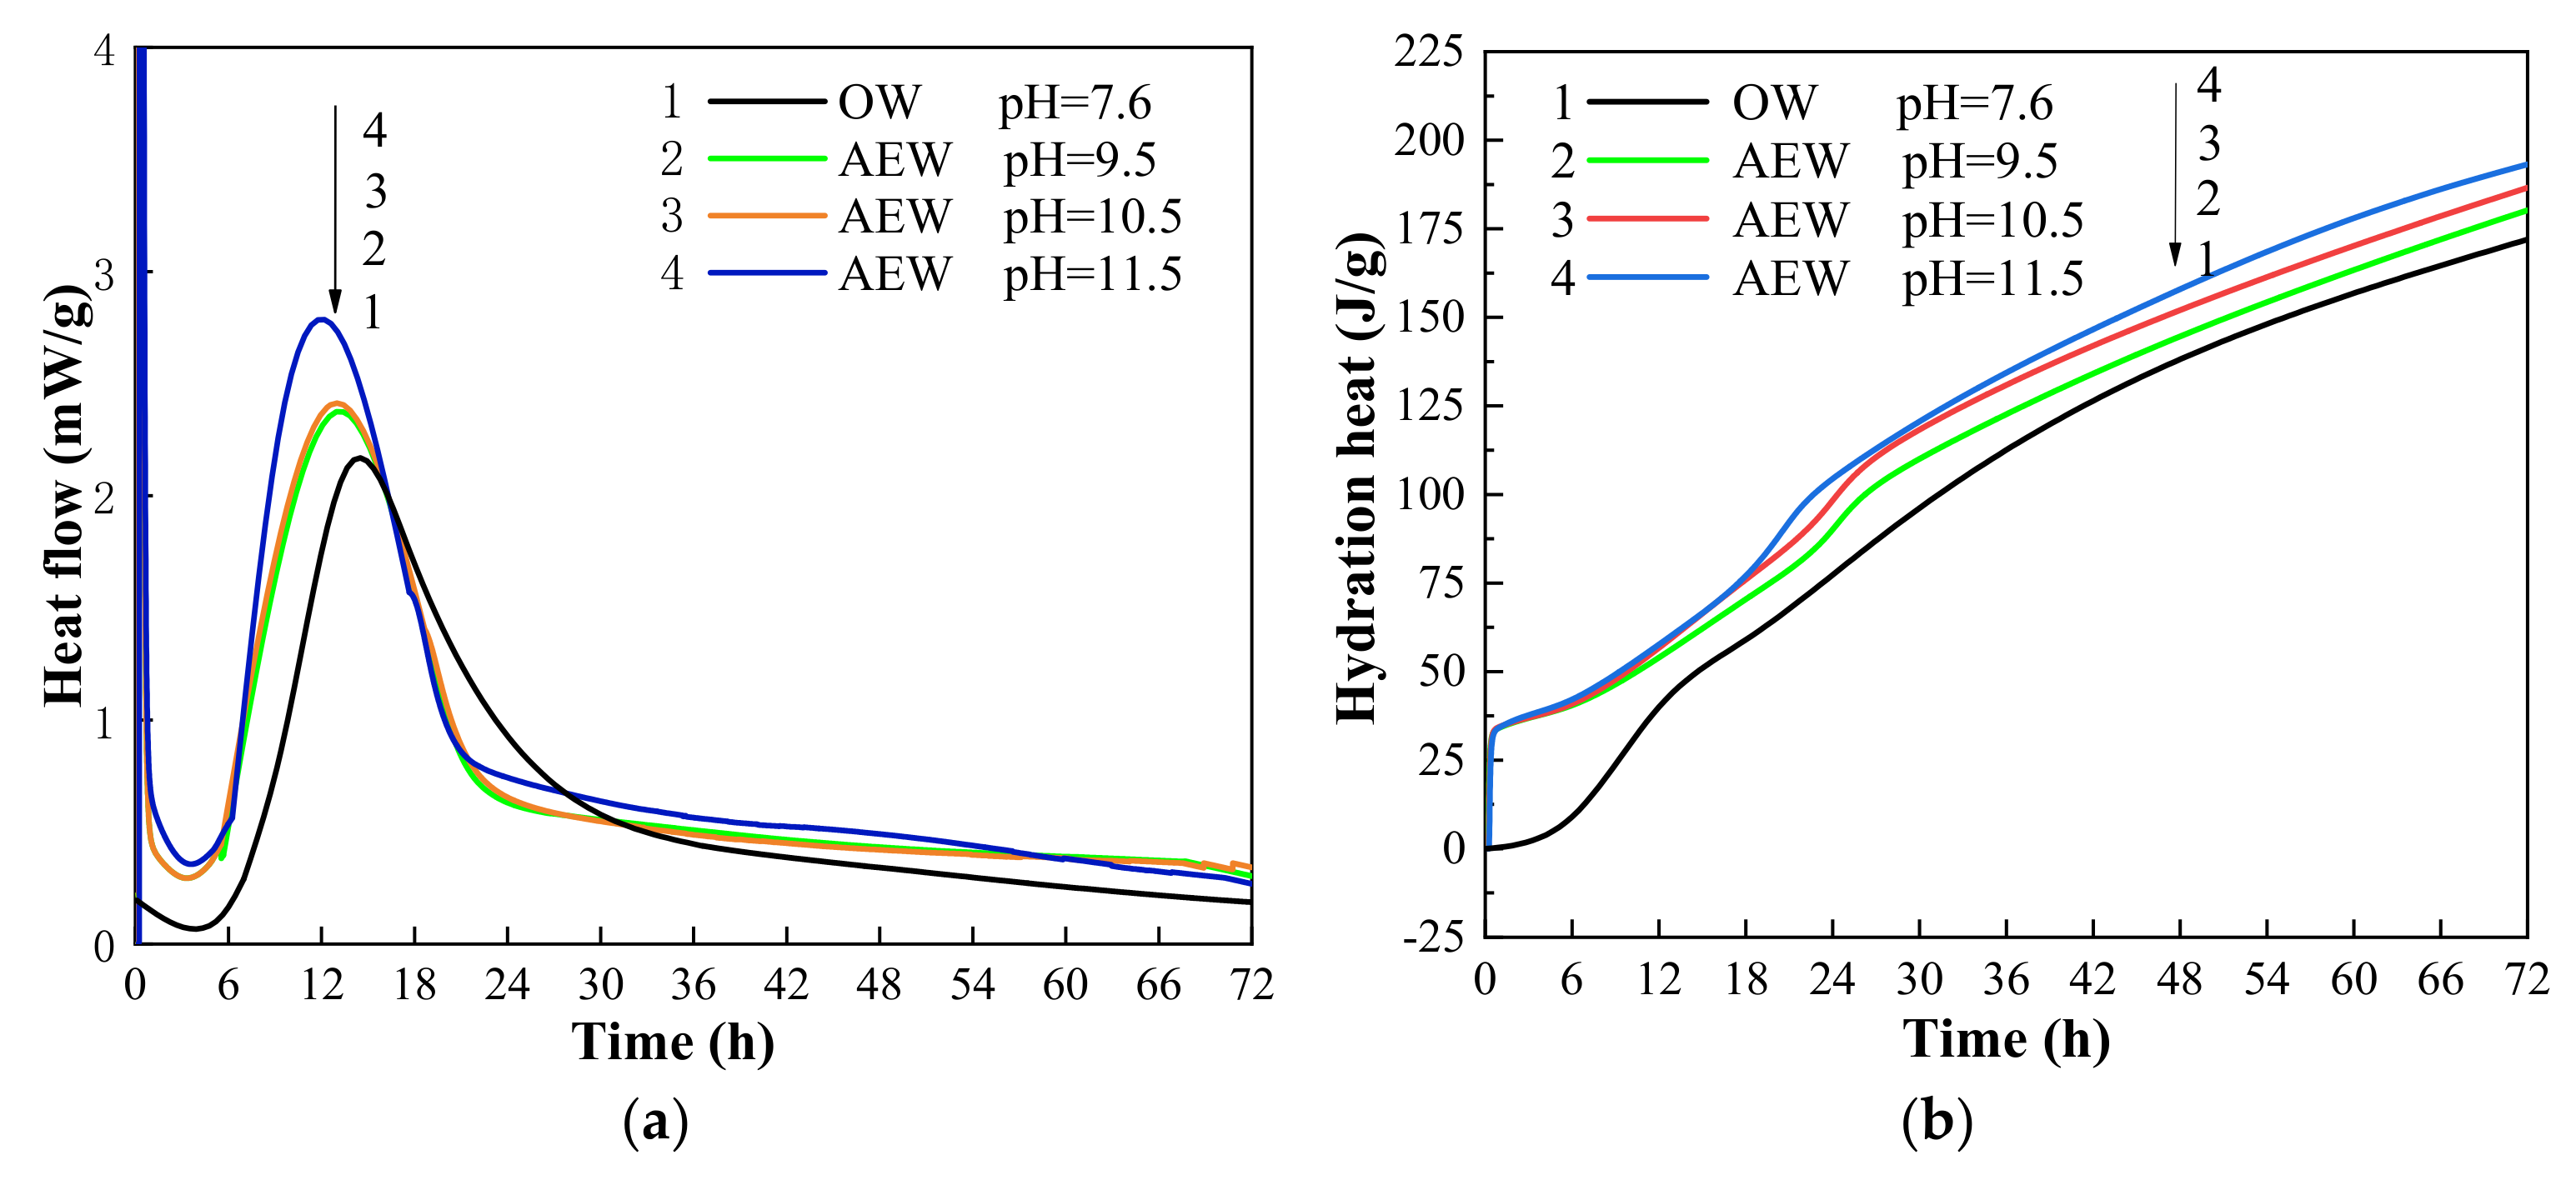
3.1. Hydration Heat Analysis
3.2. Hydration Product Analysis
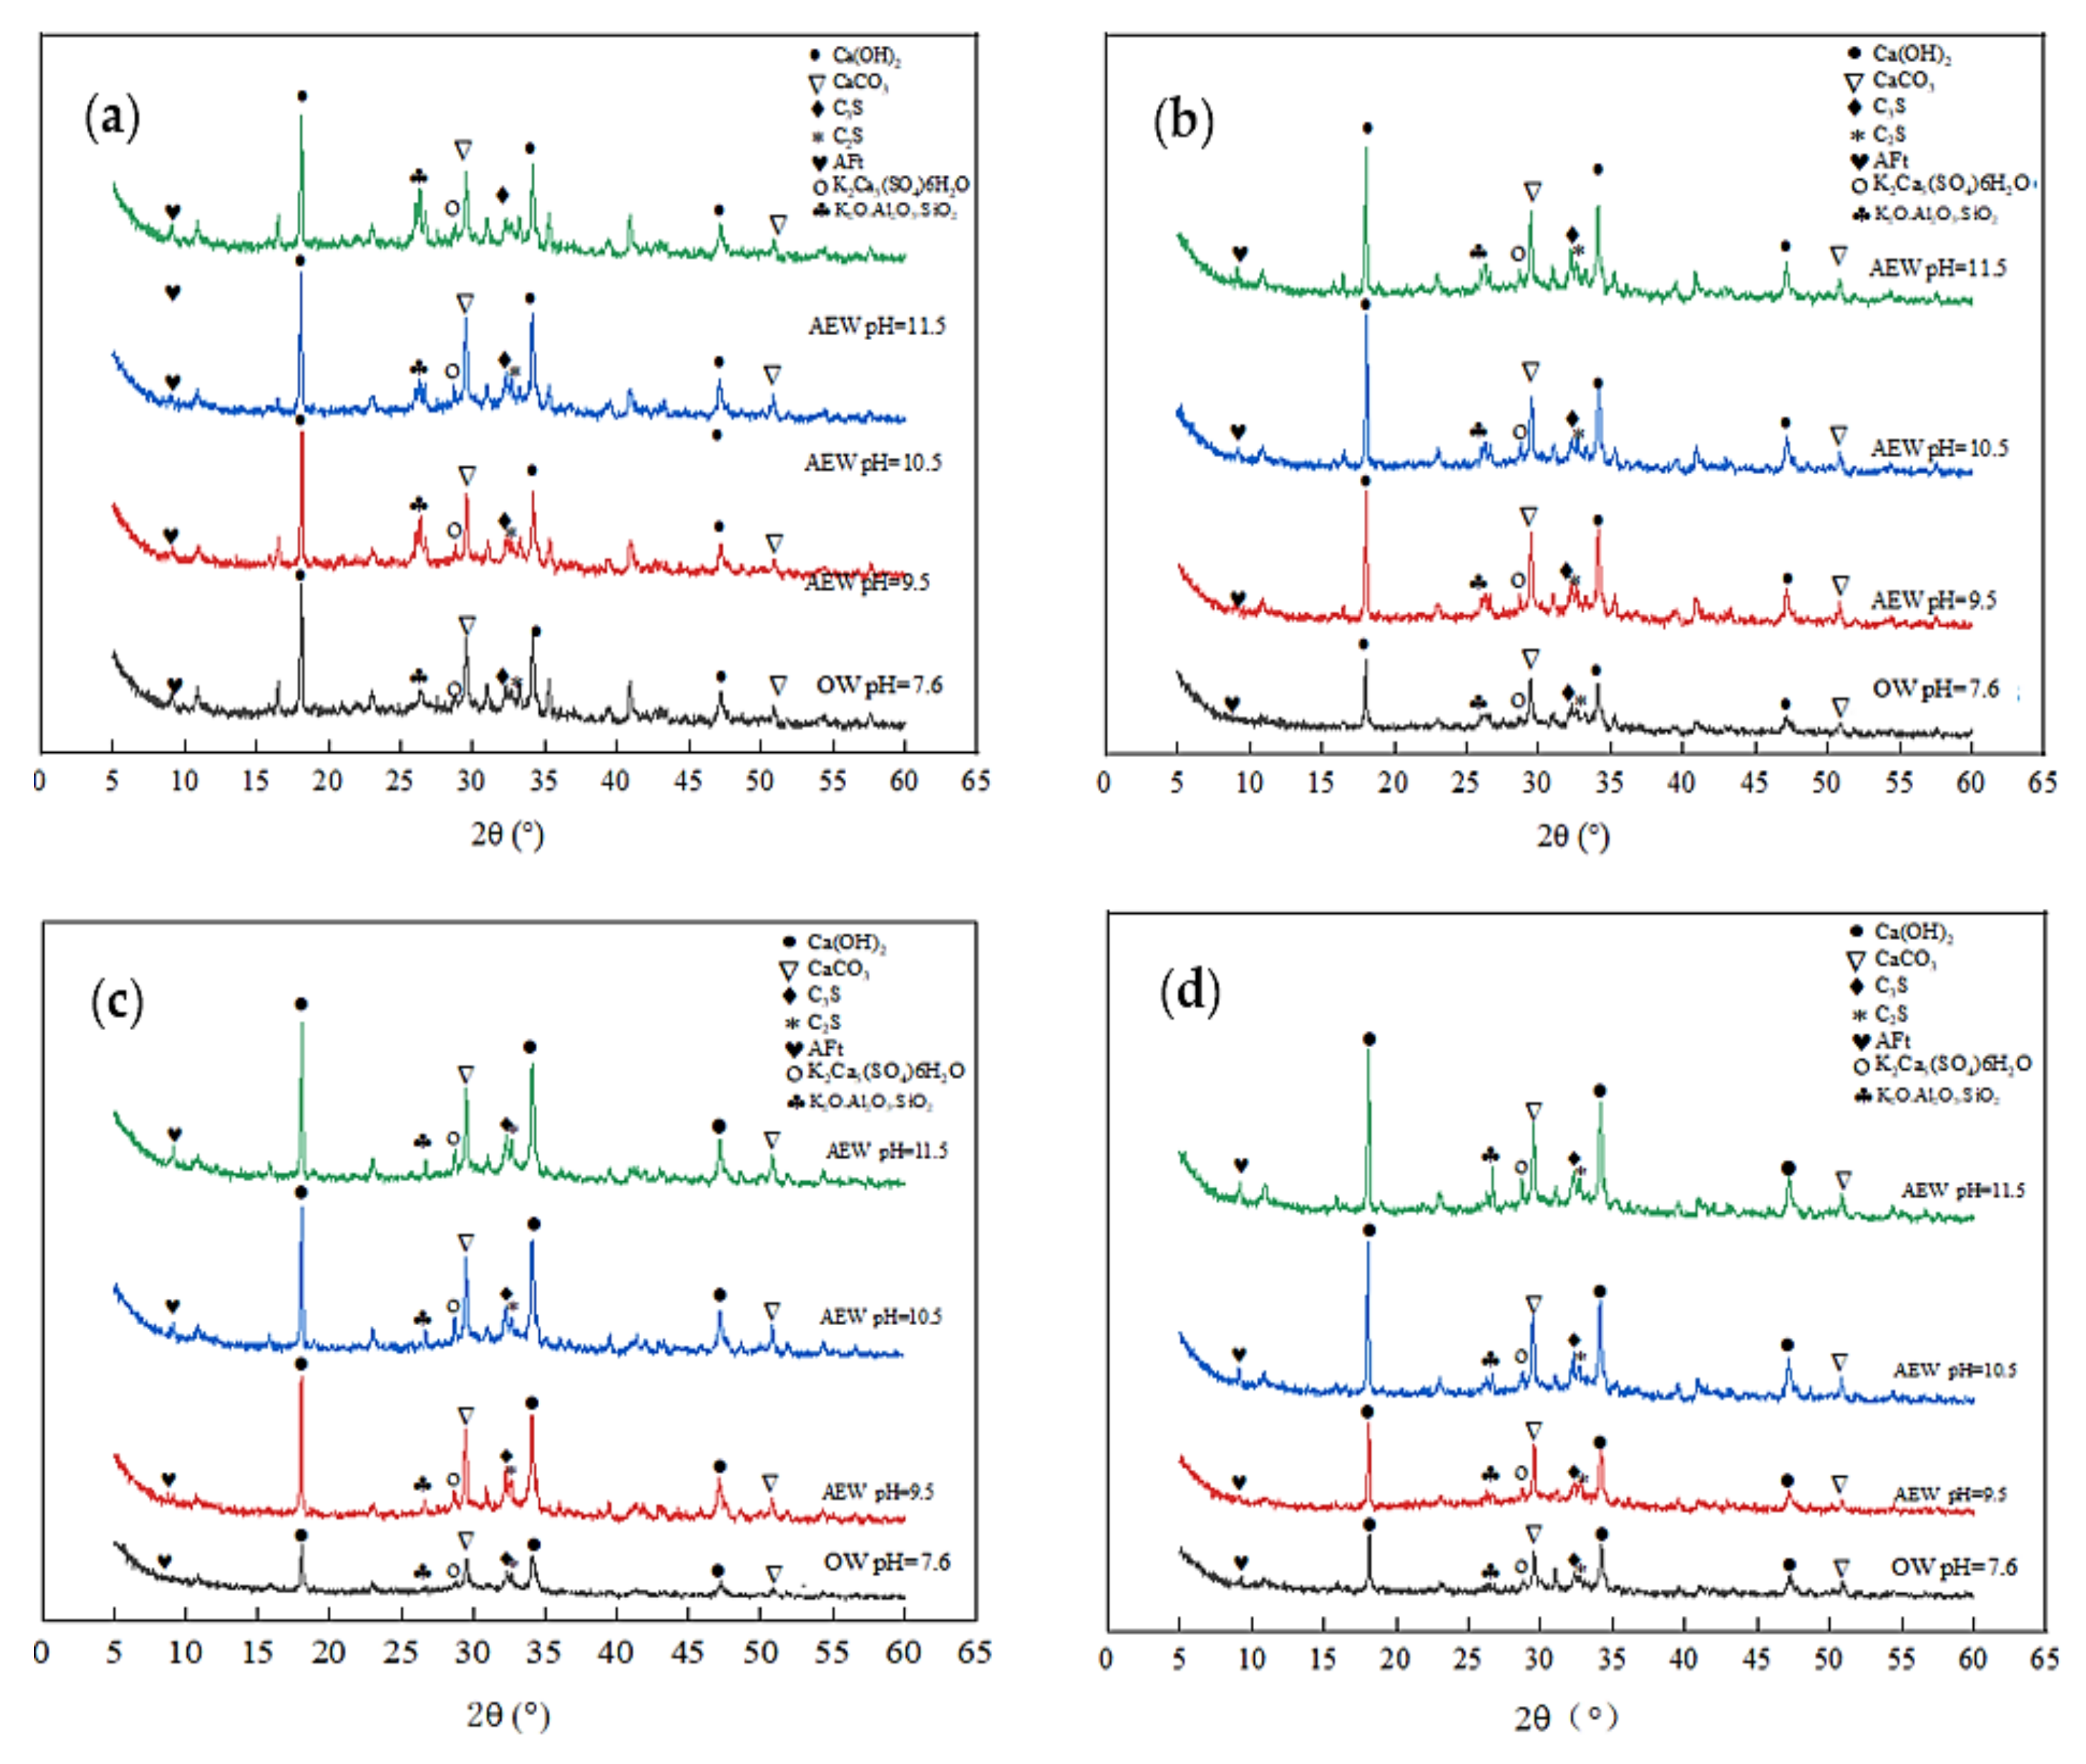
3.2.1. XRD Analysis
3.2.2. Differential Thermal Analysis
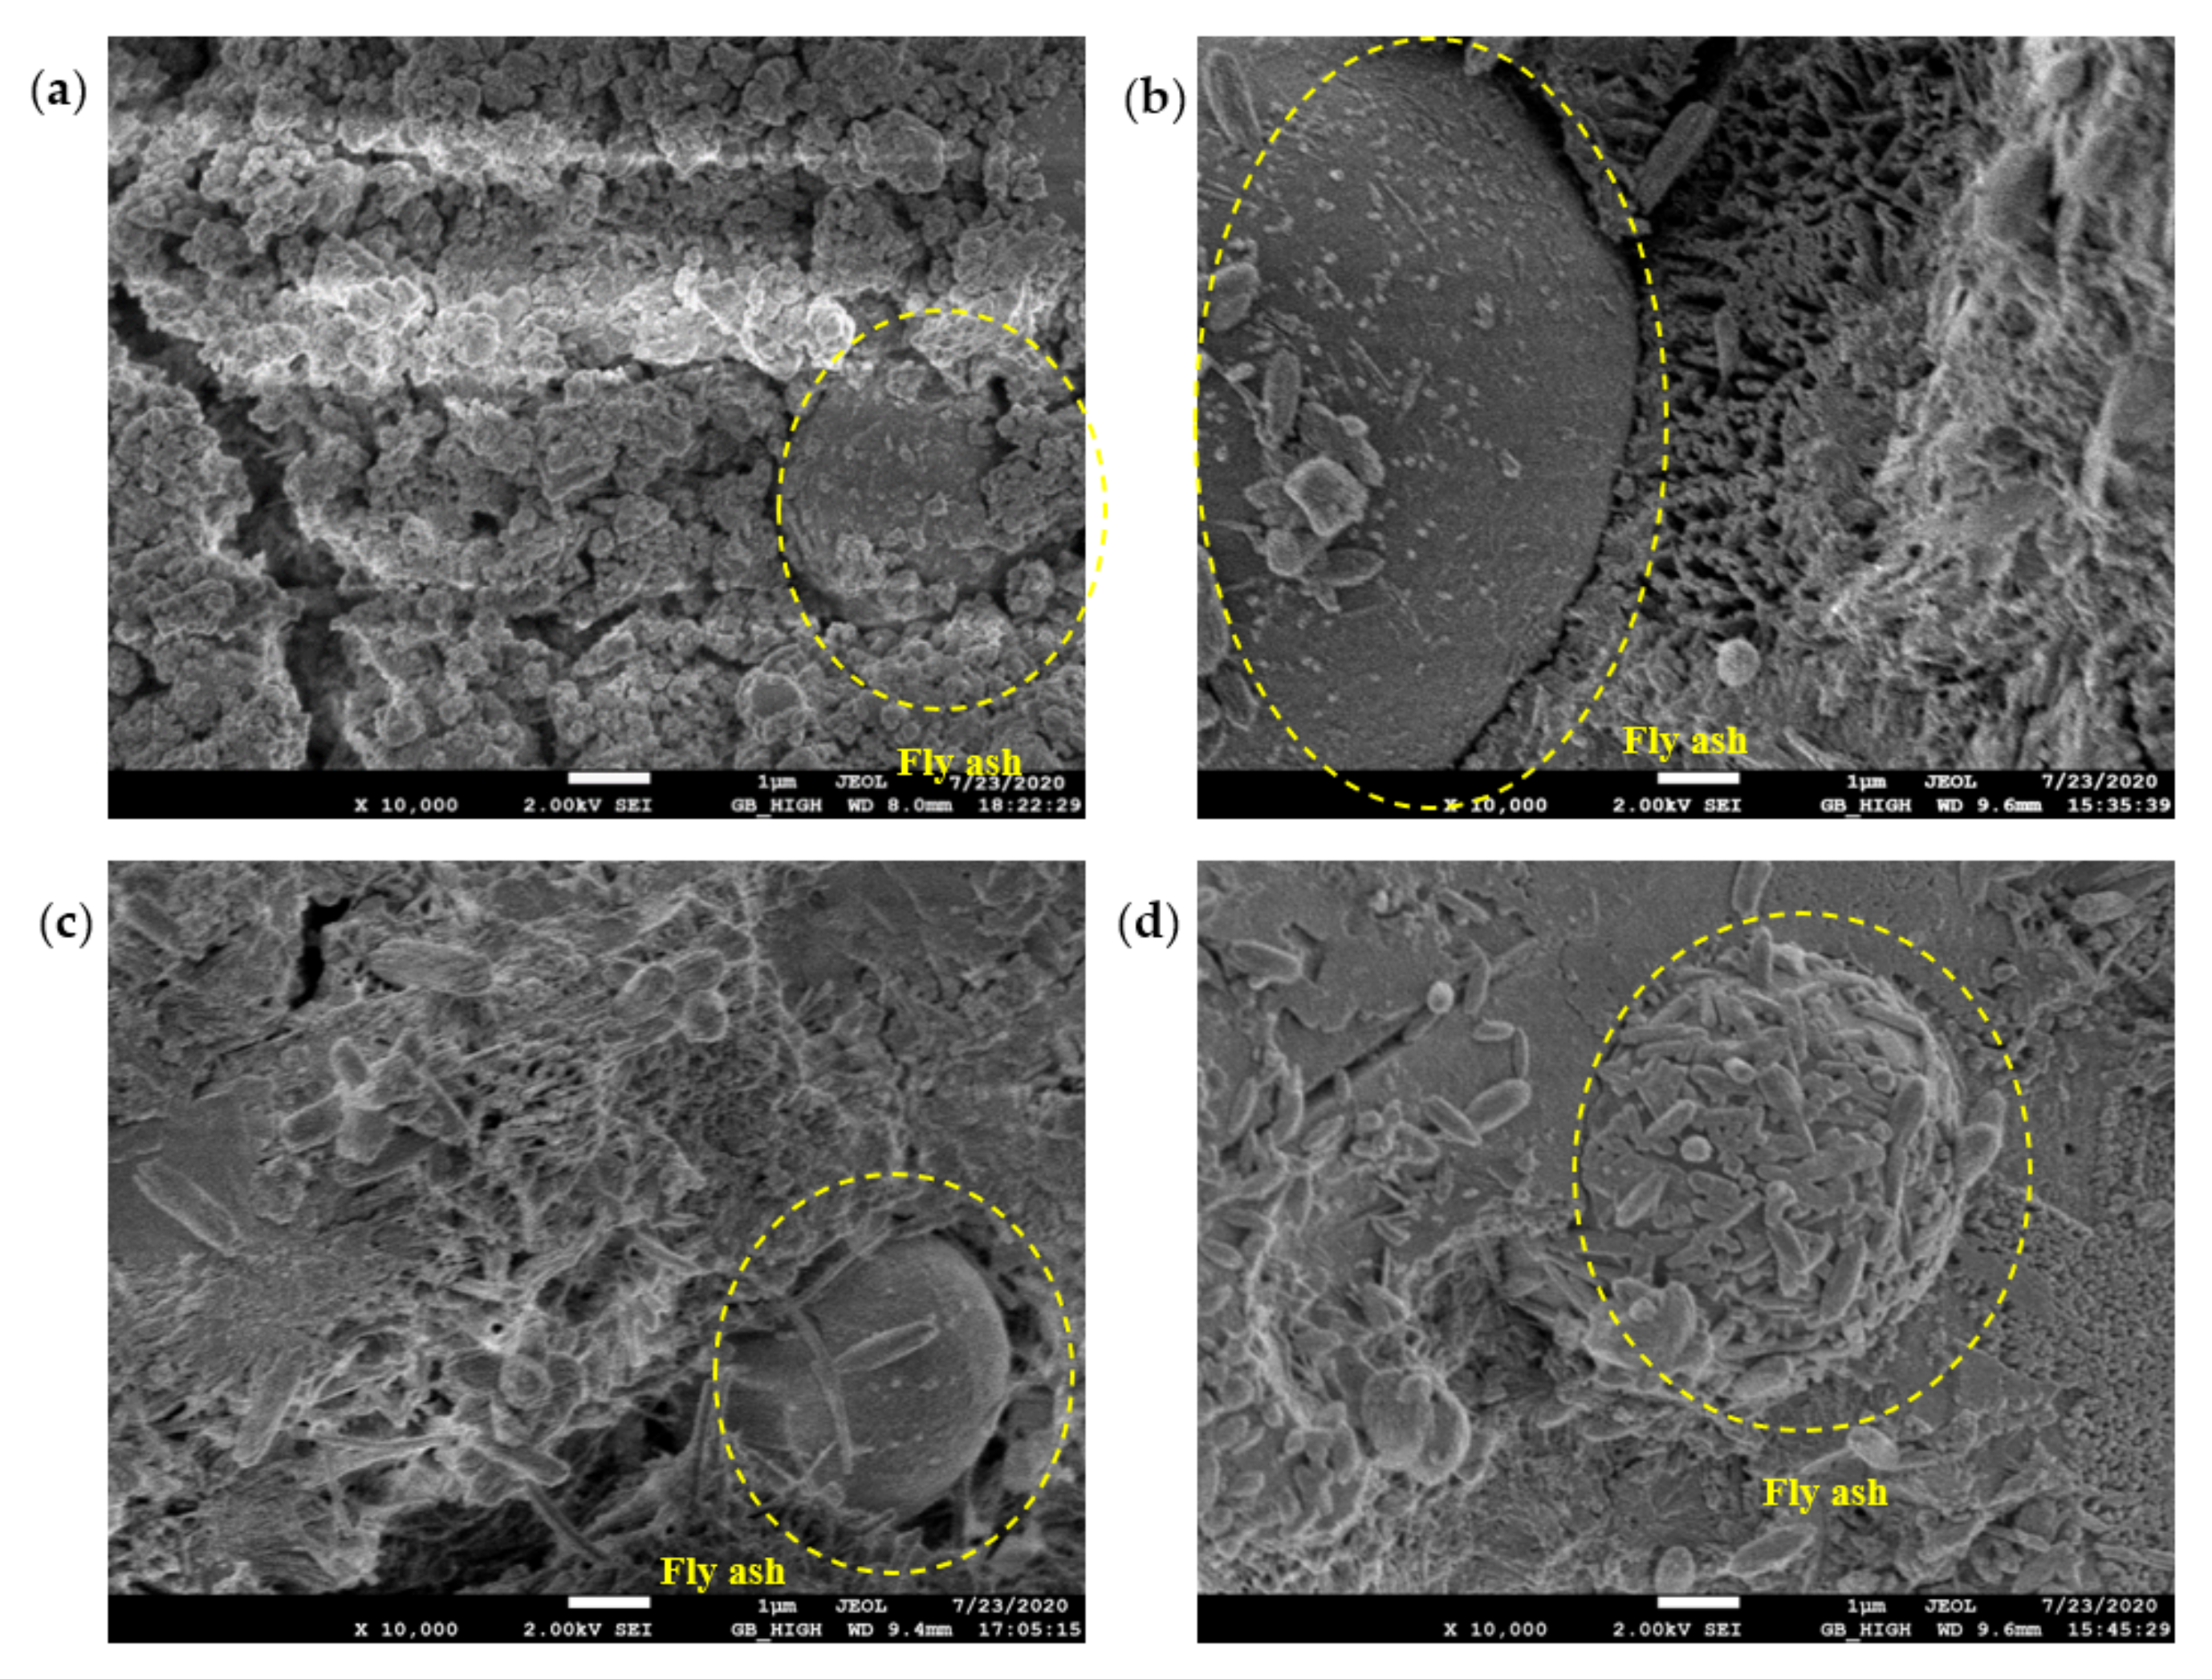
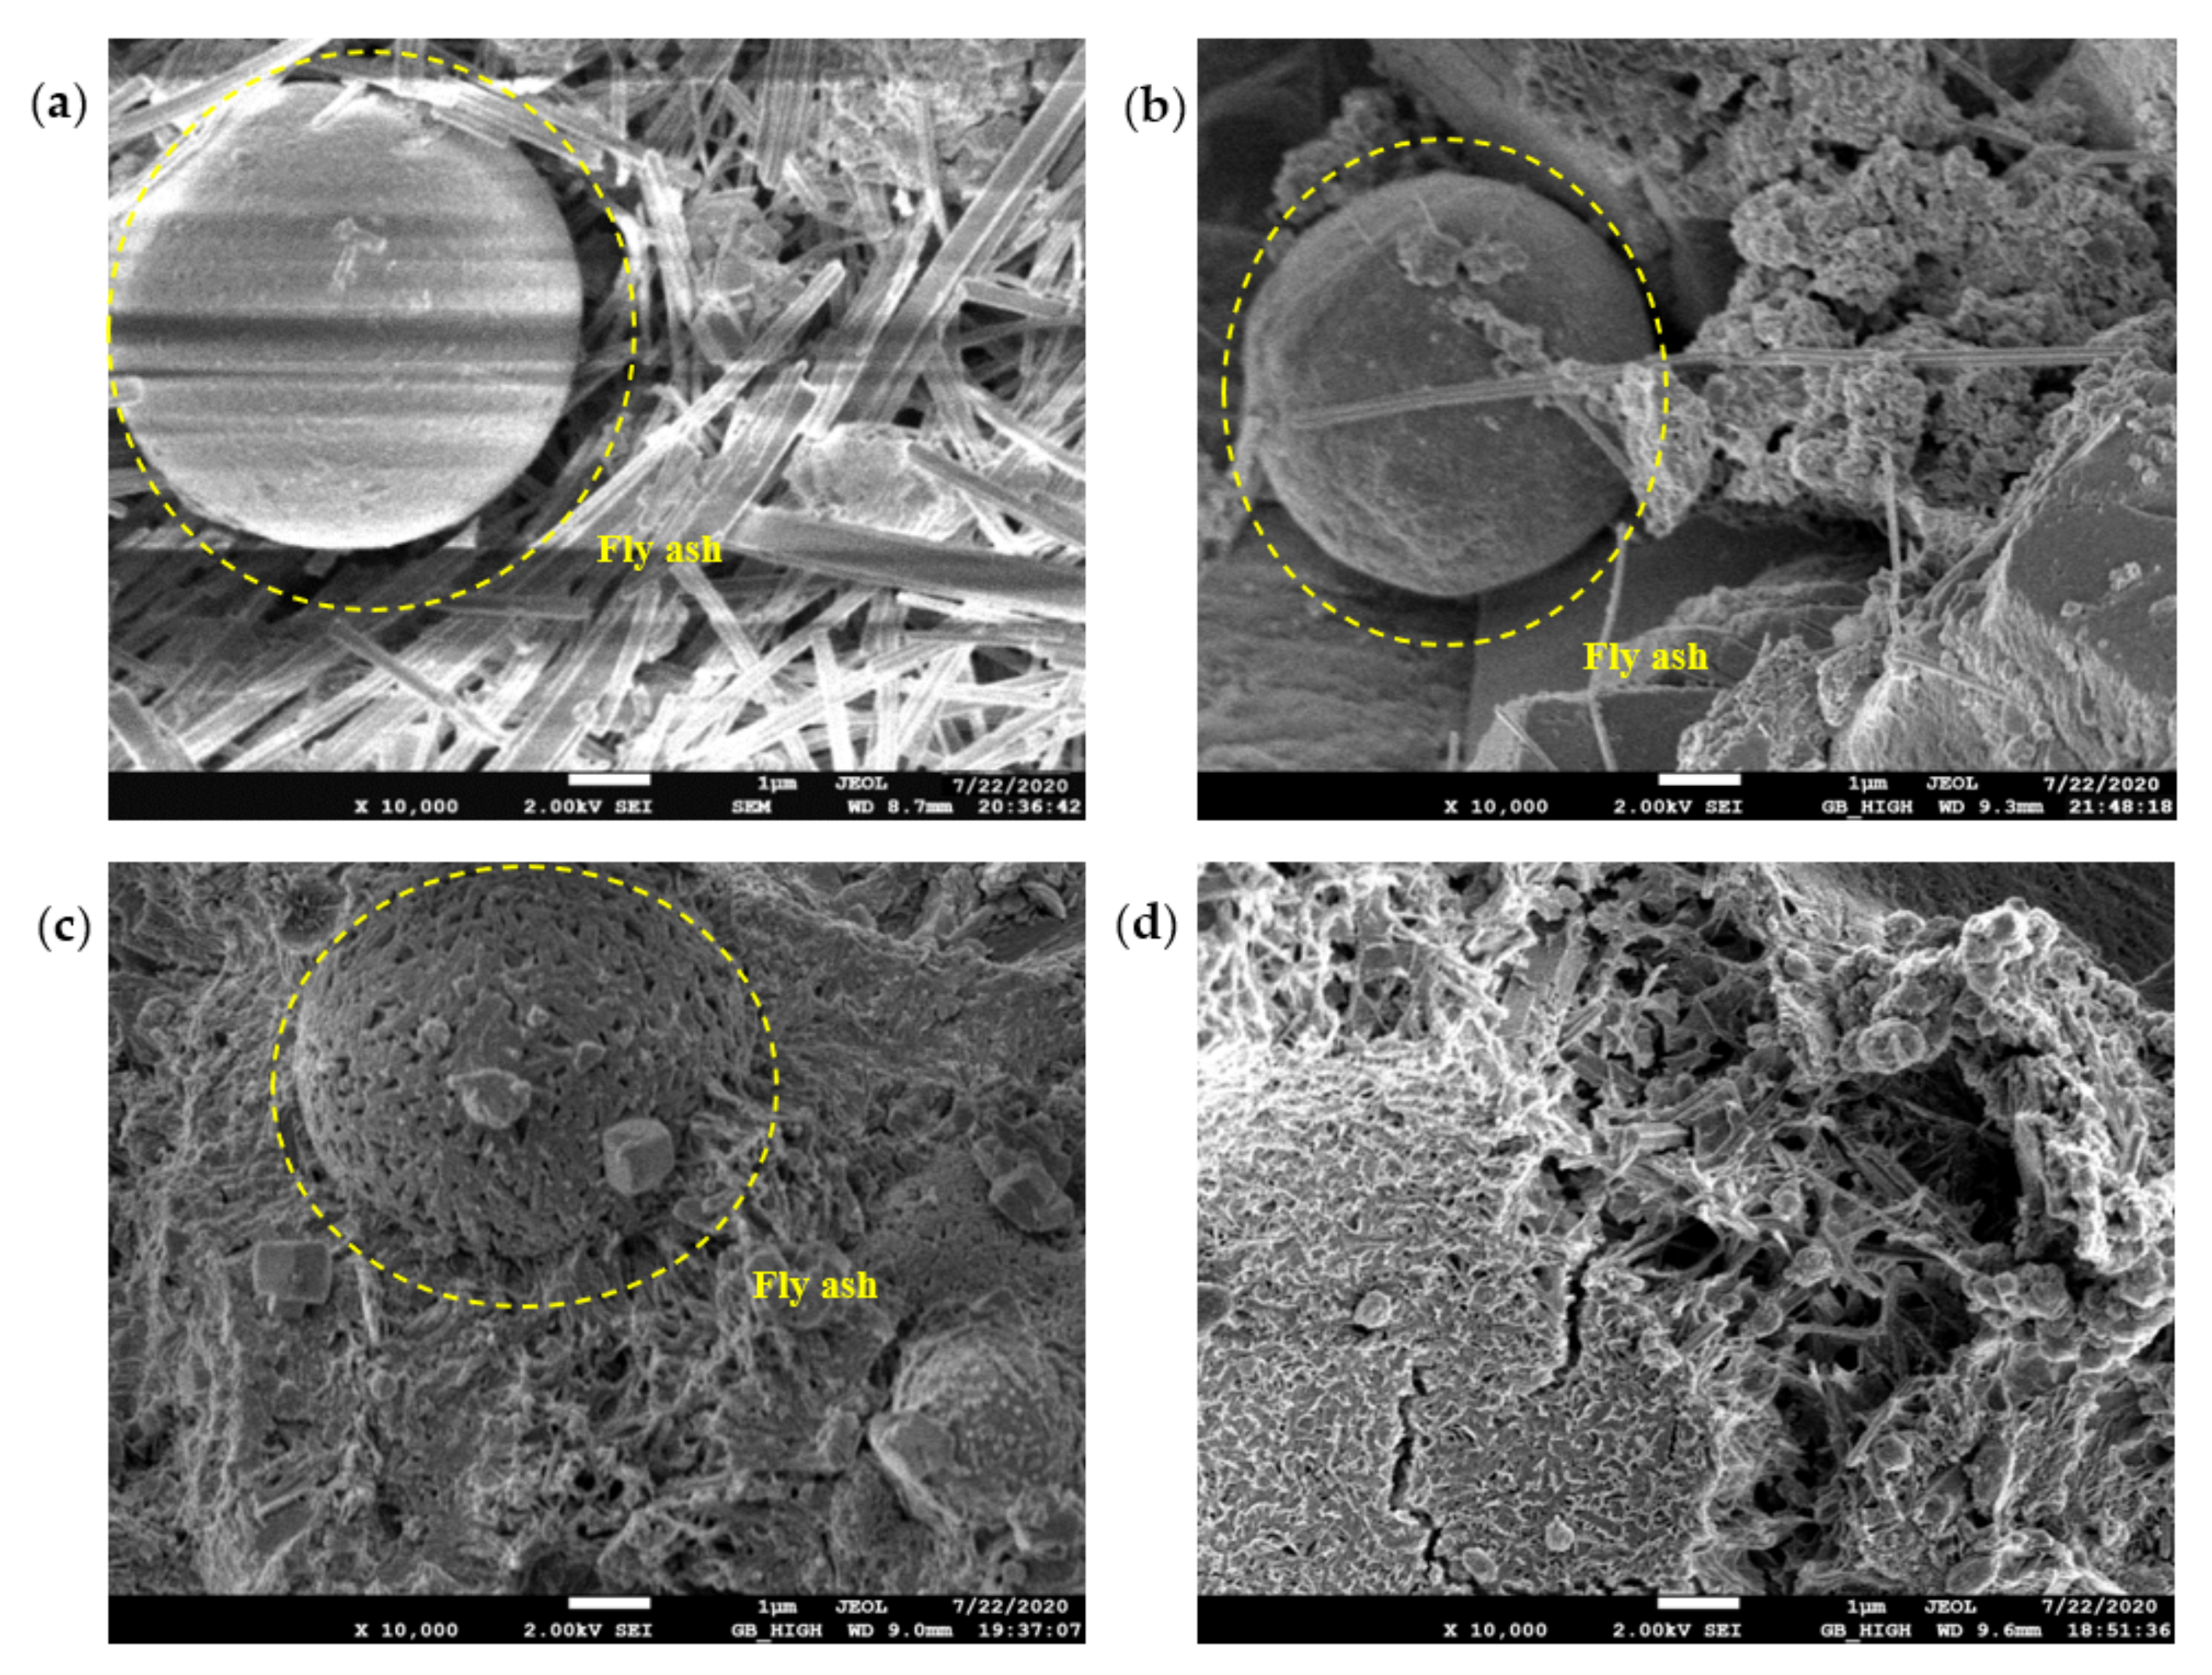
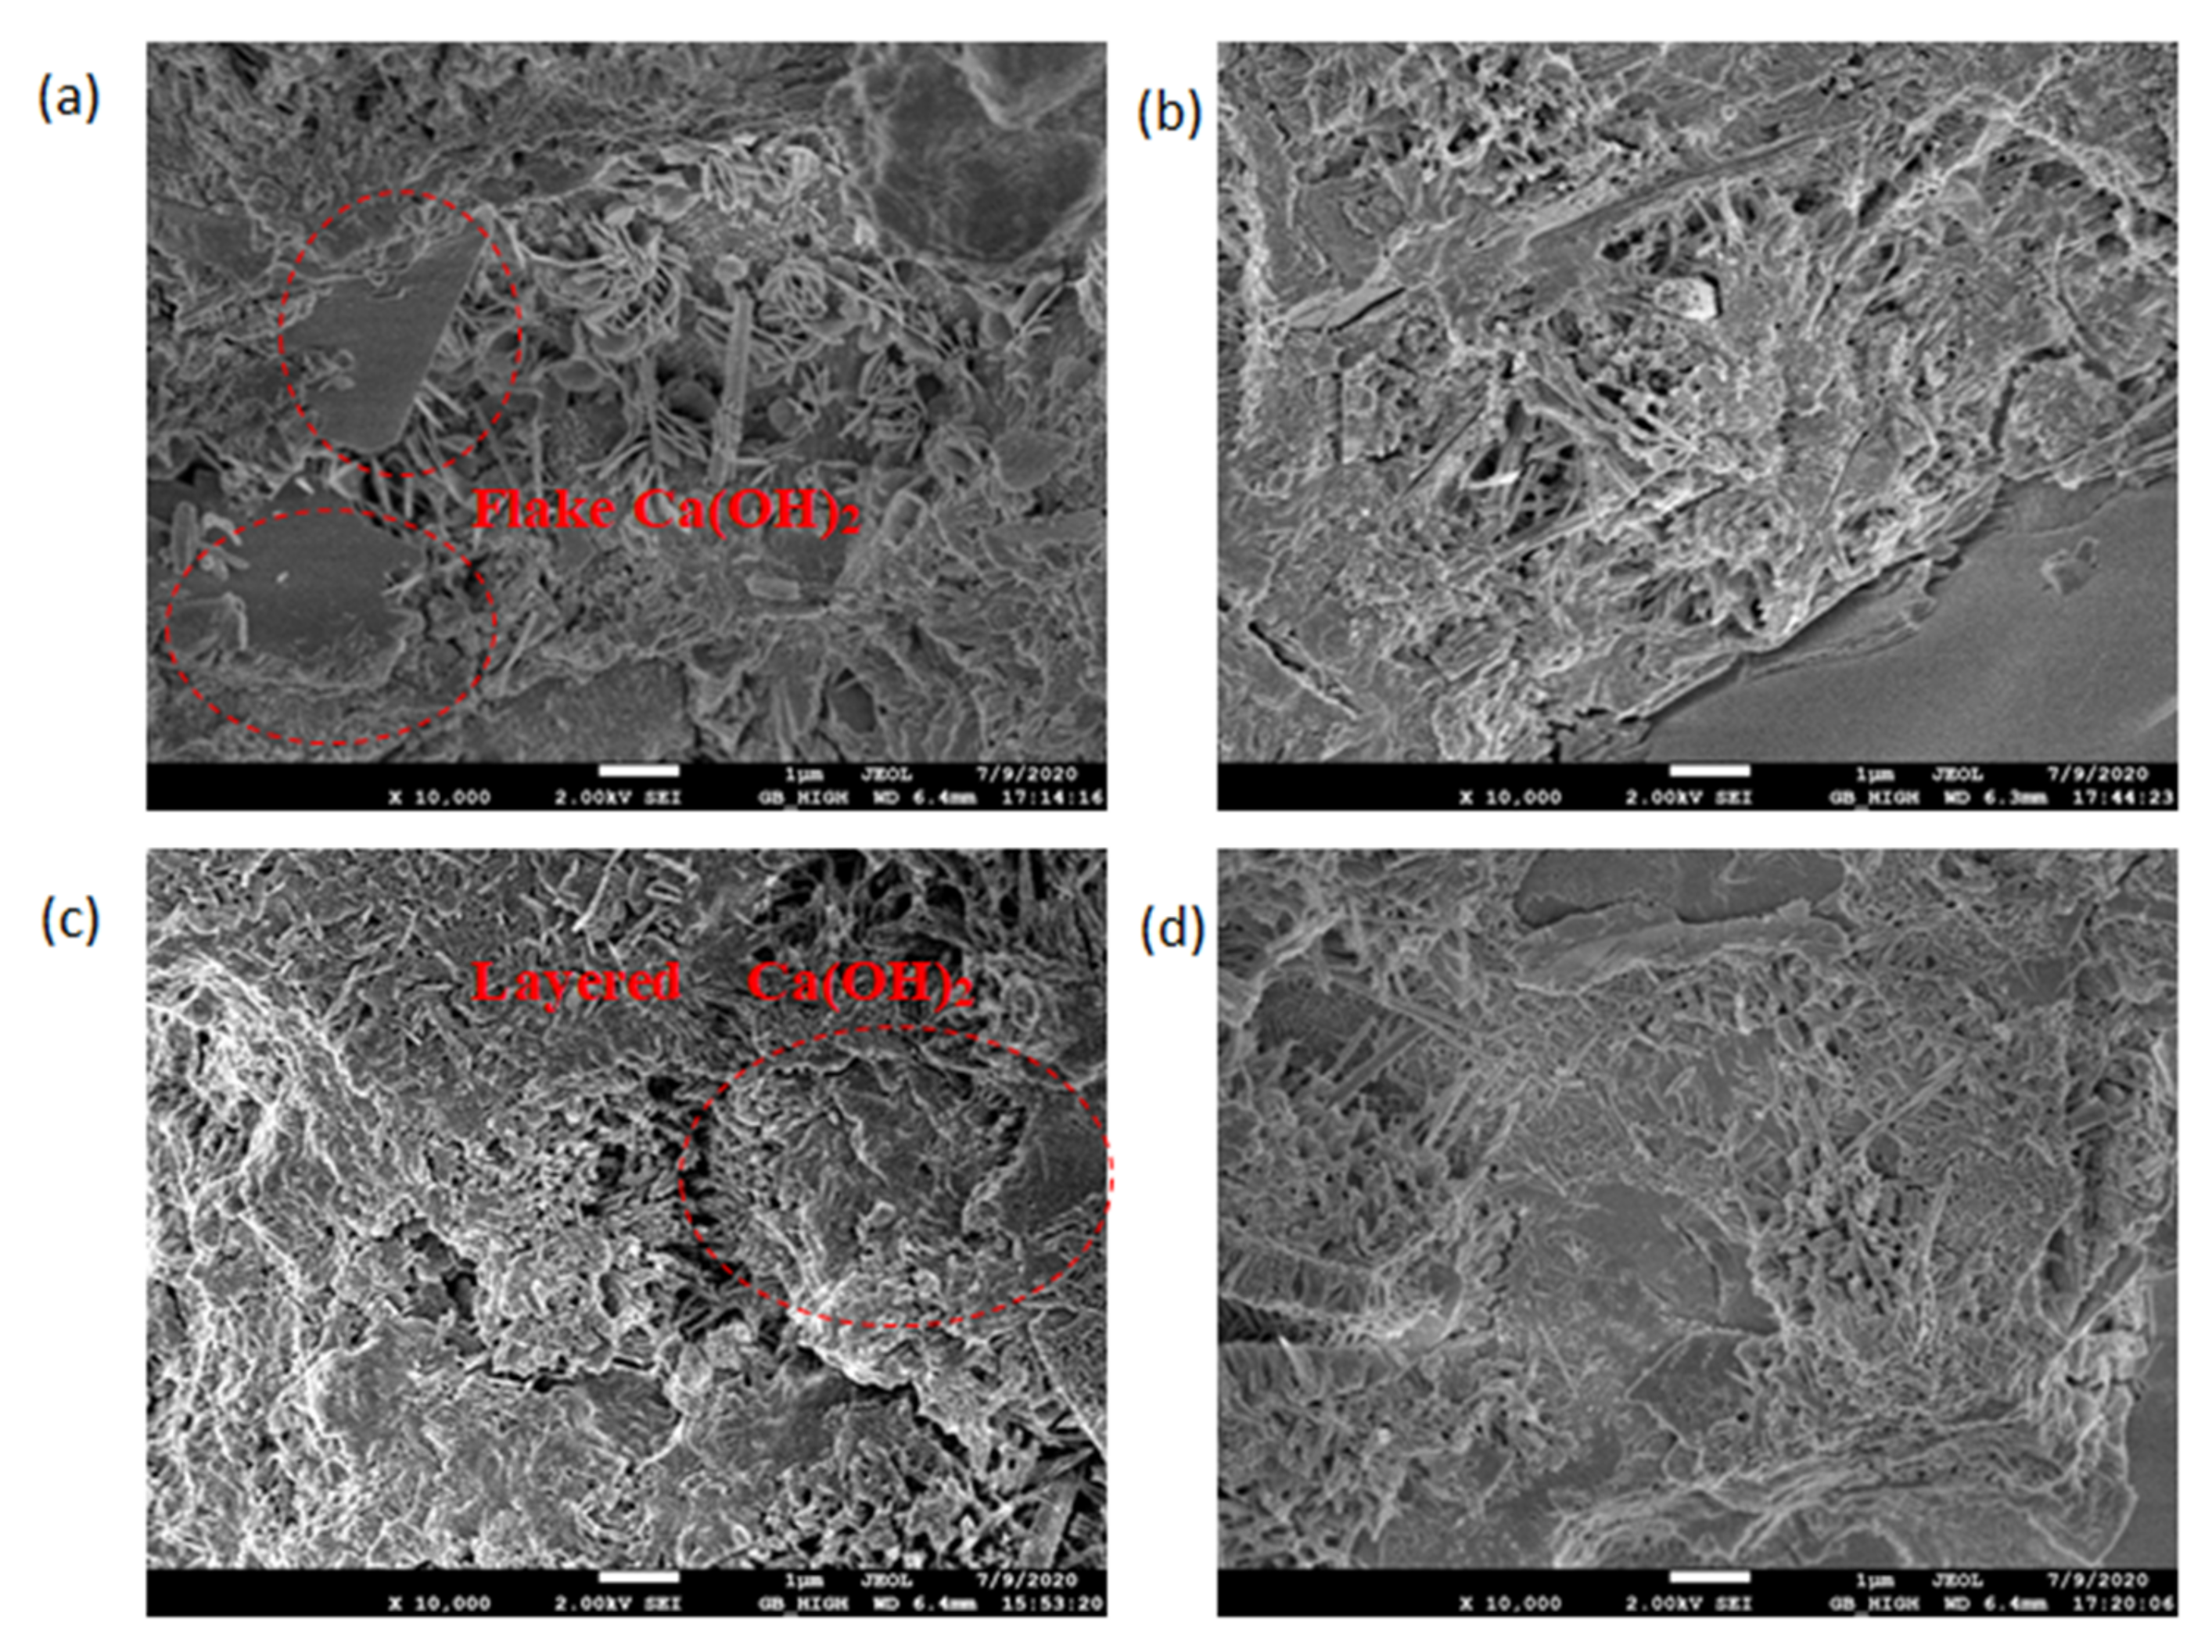
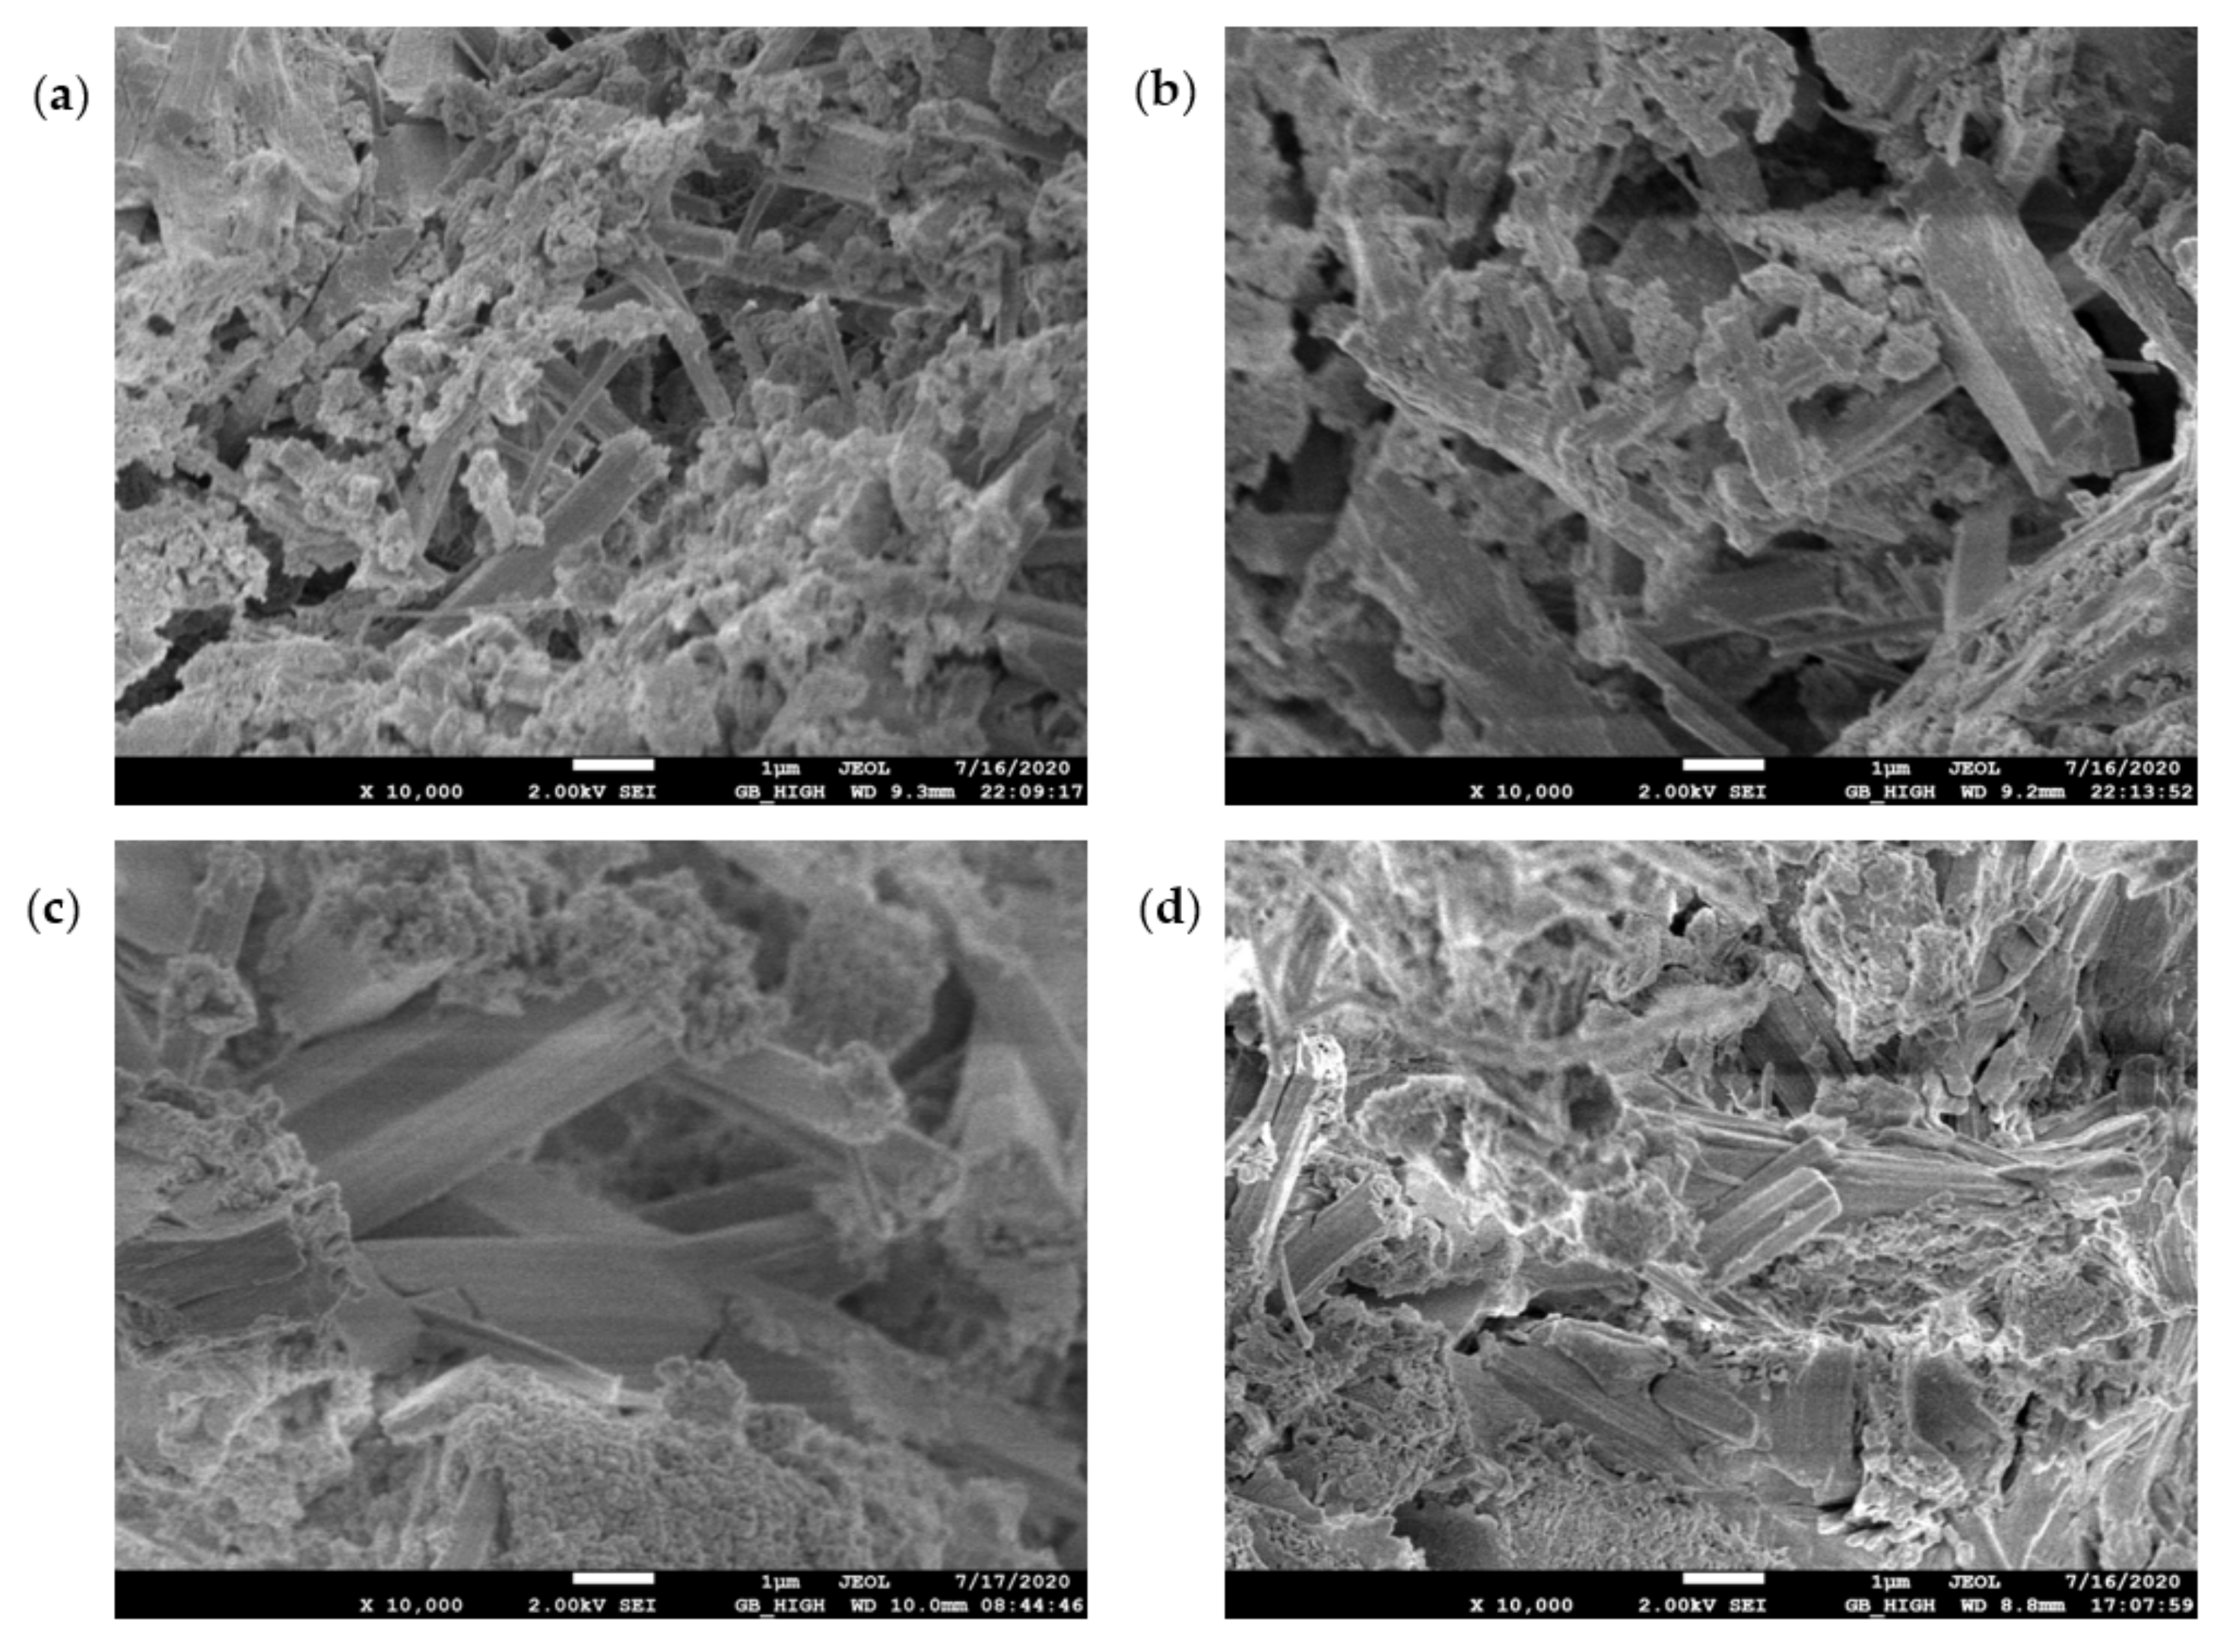
3.3. SEM Micromorphology
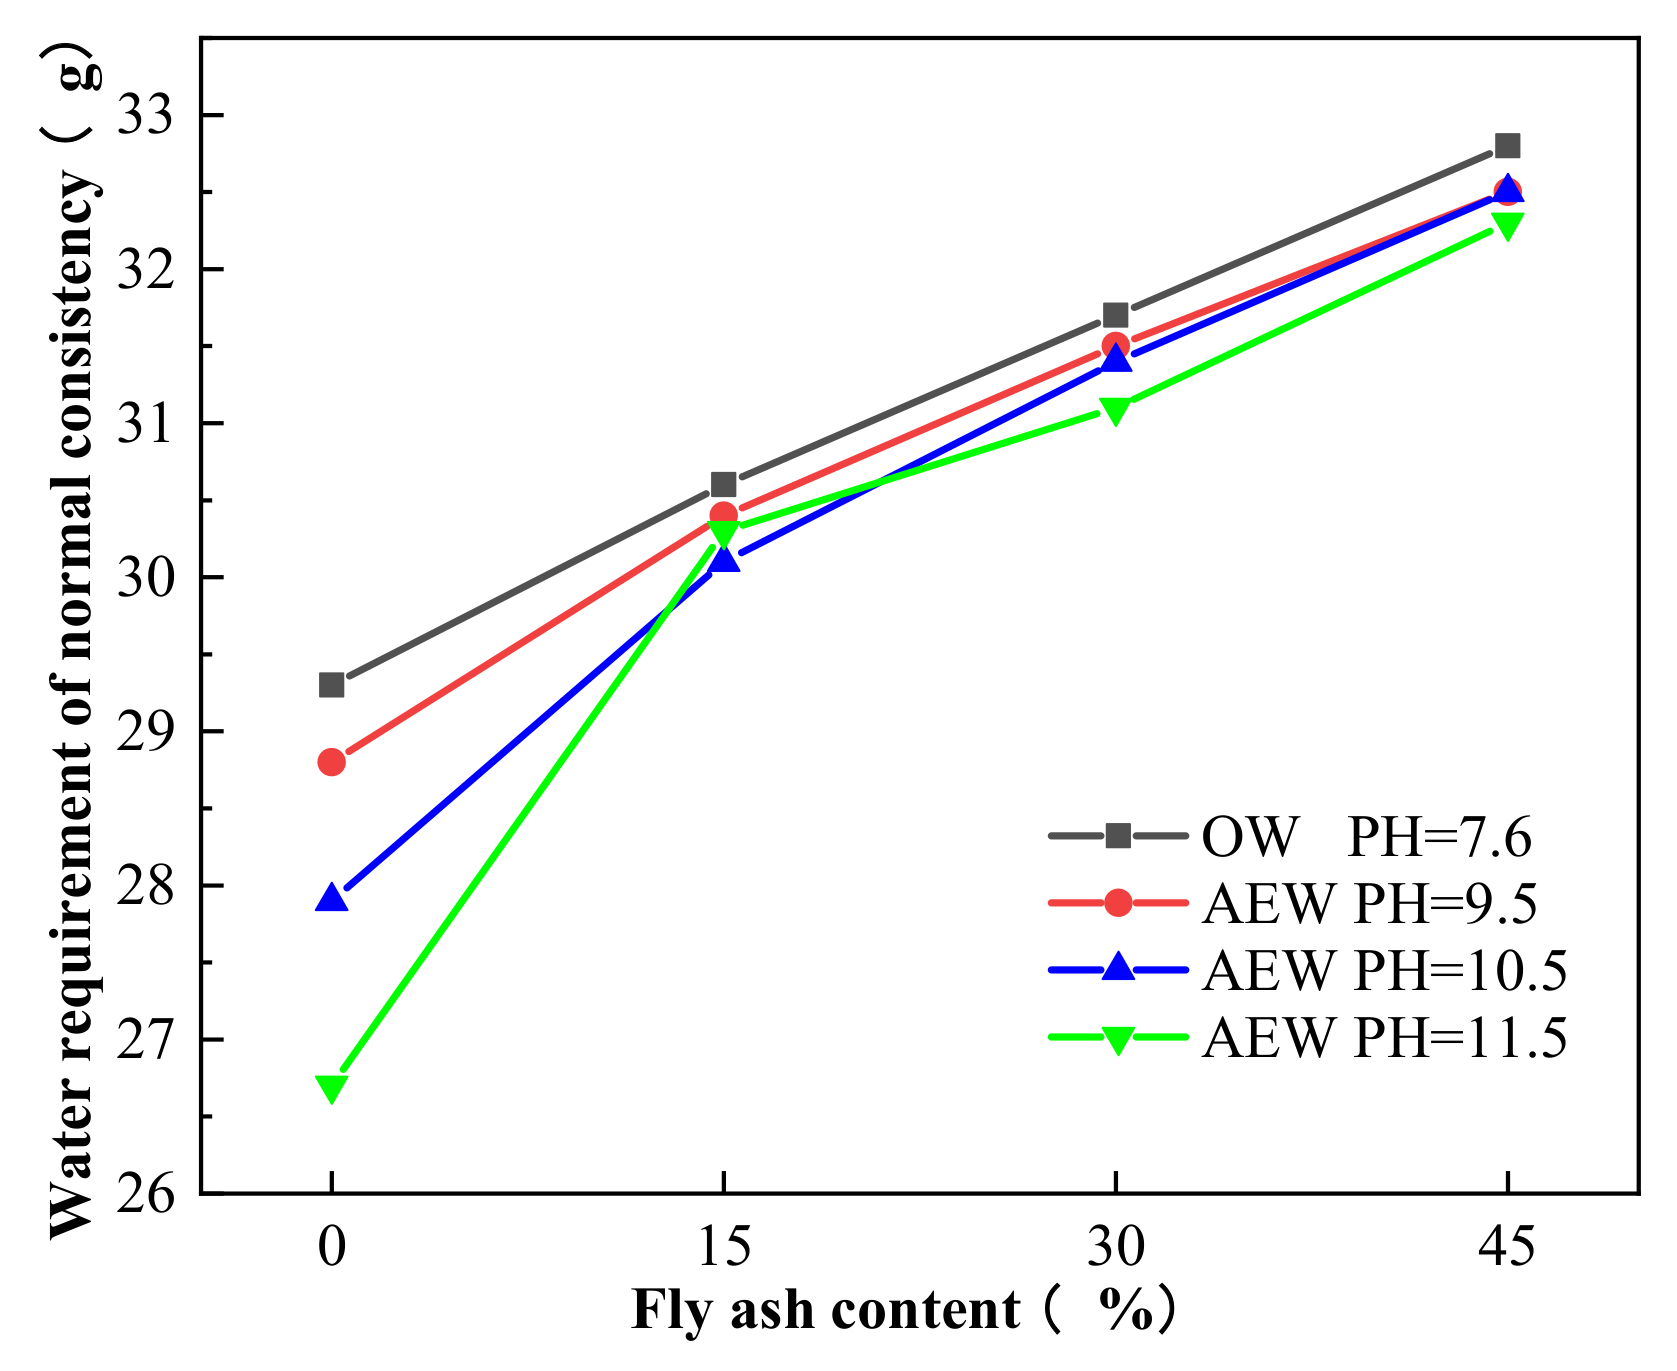
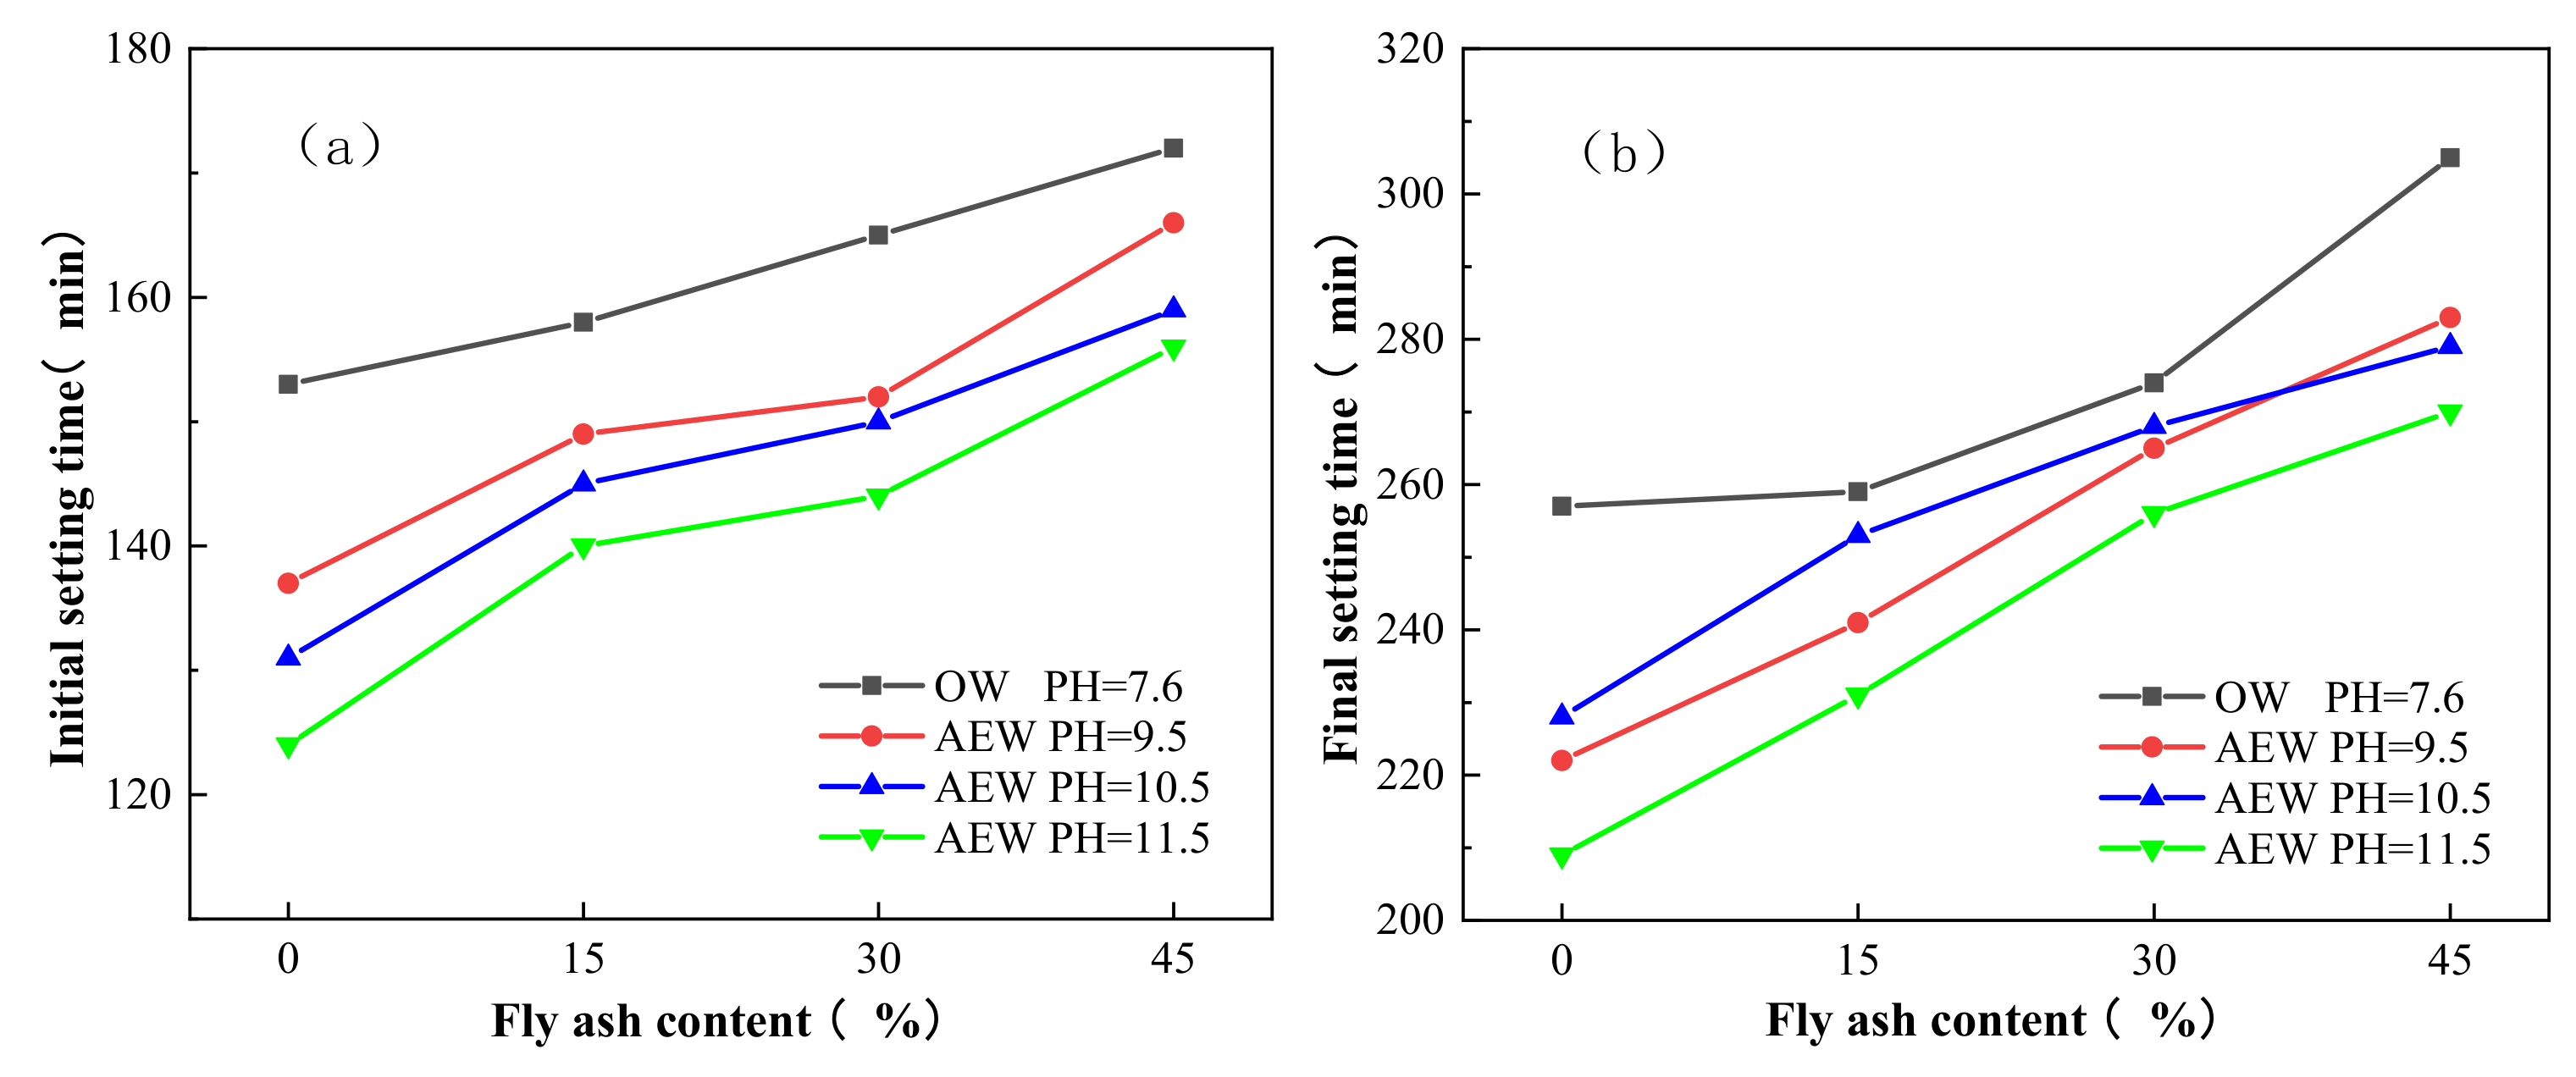
3.4. Workability of the Paste
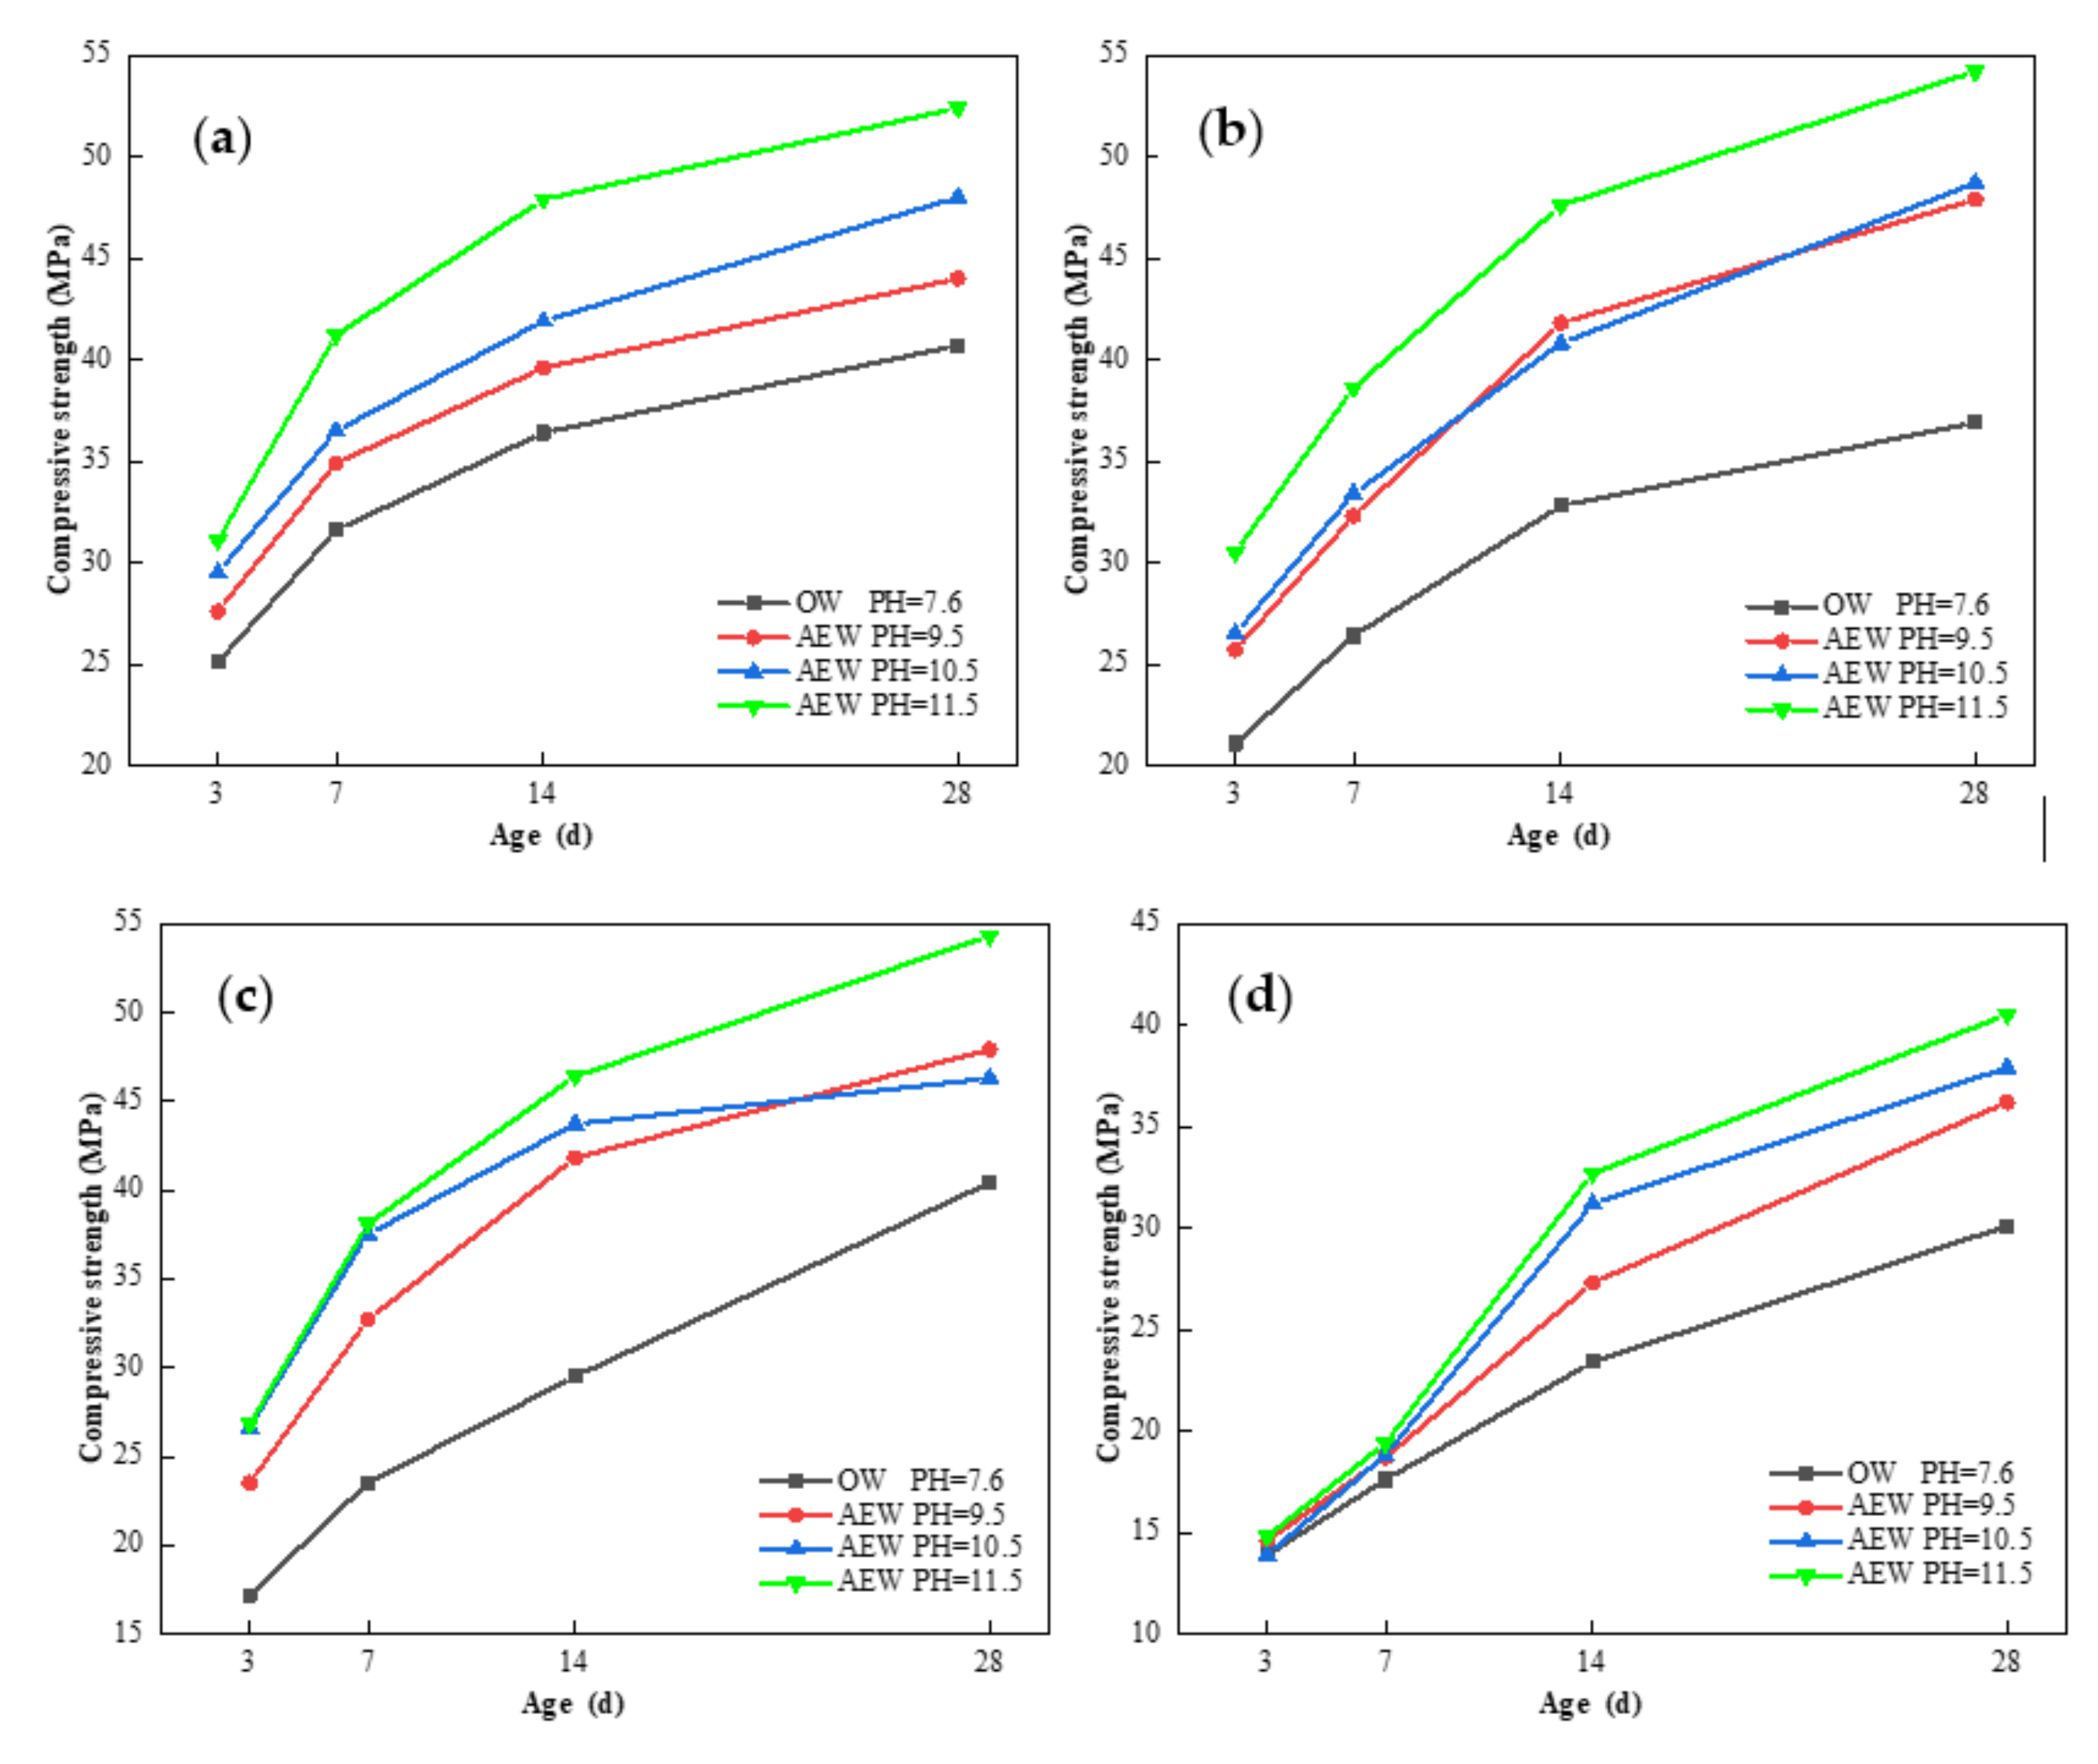
3.5. Mechanical Properties of Mortar
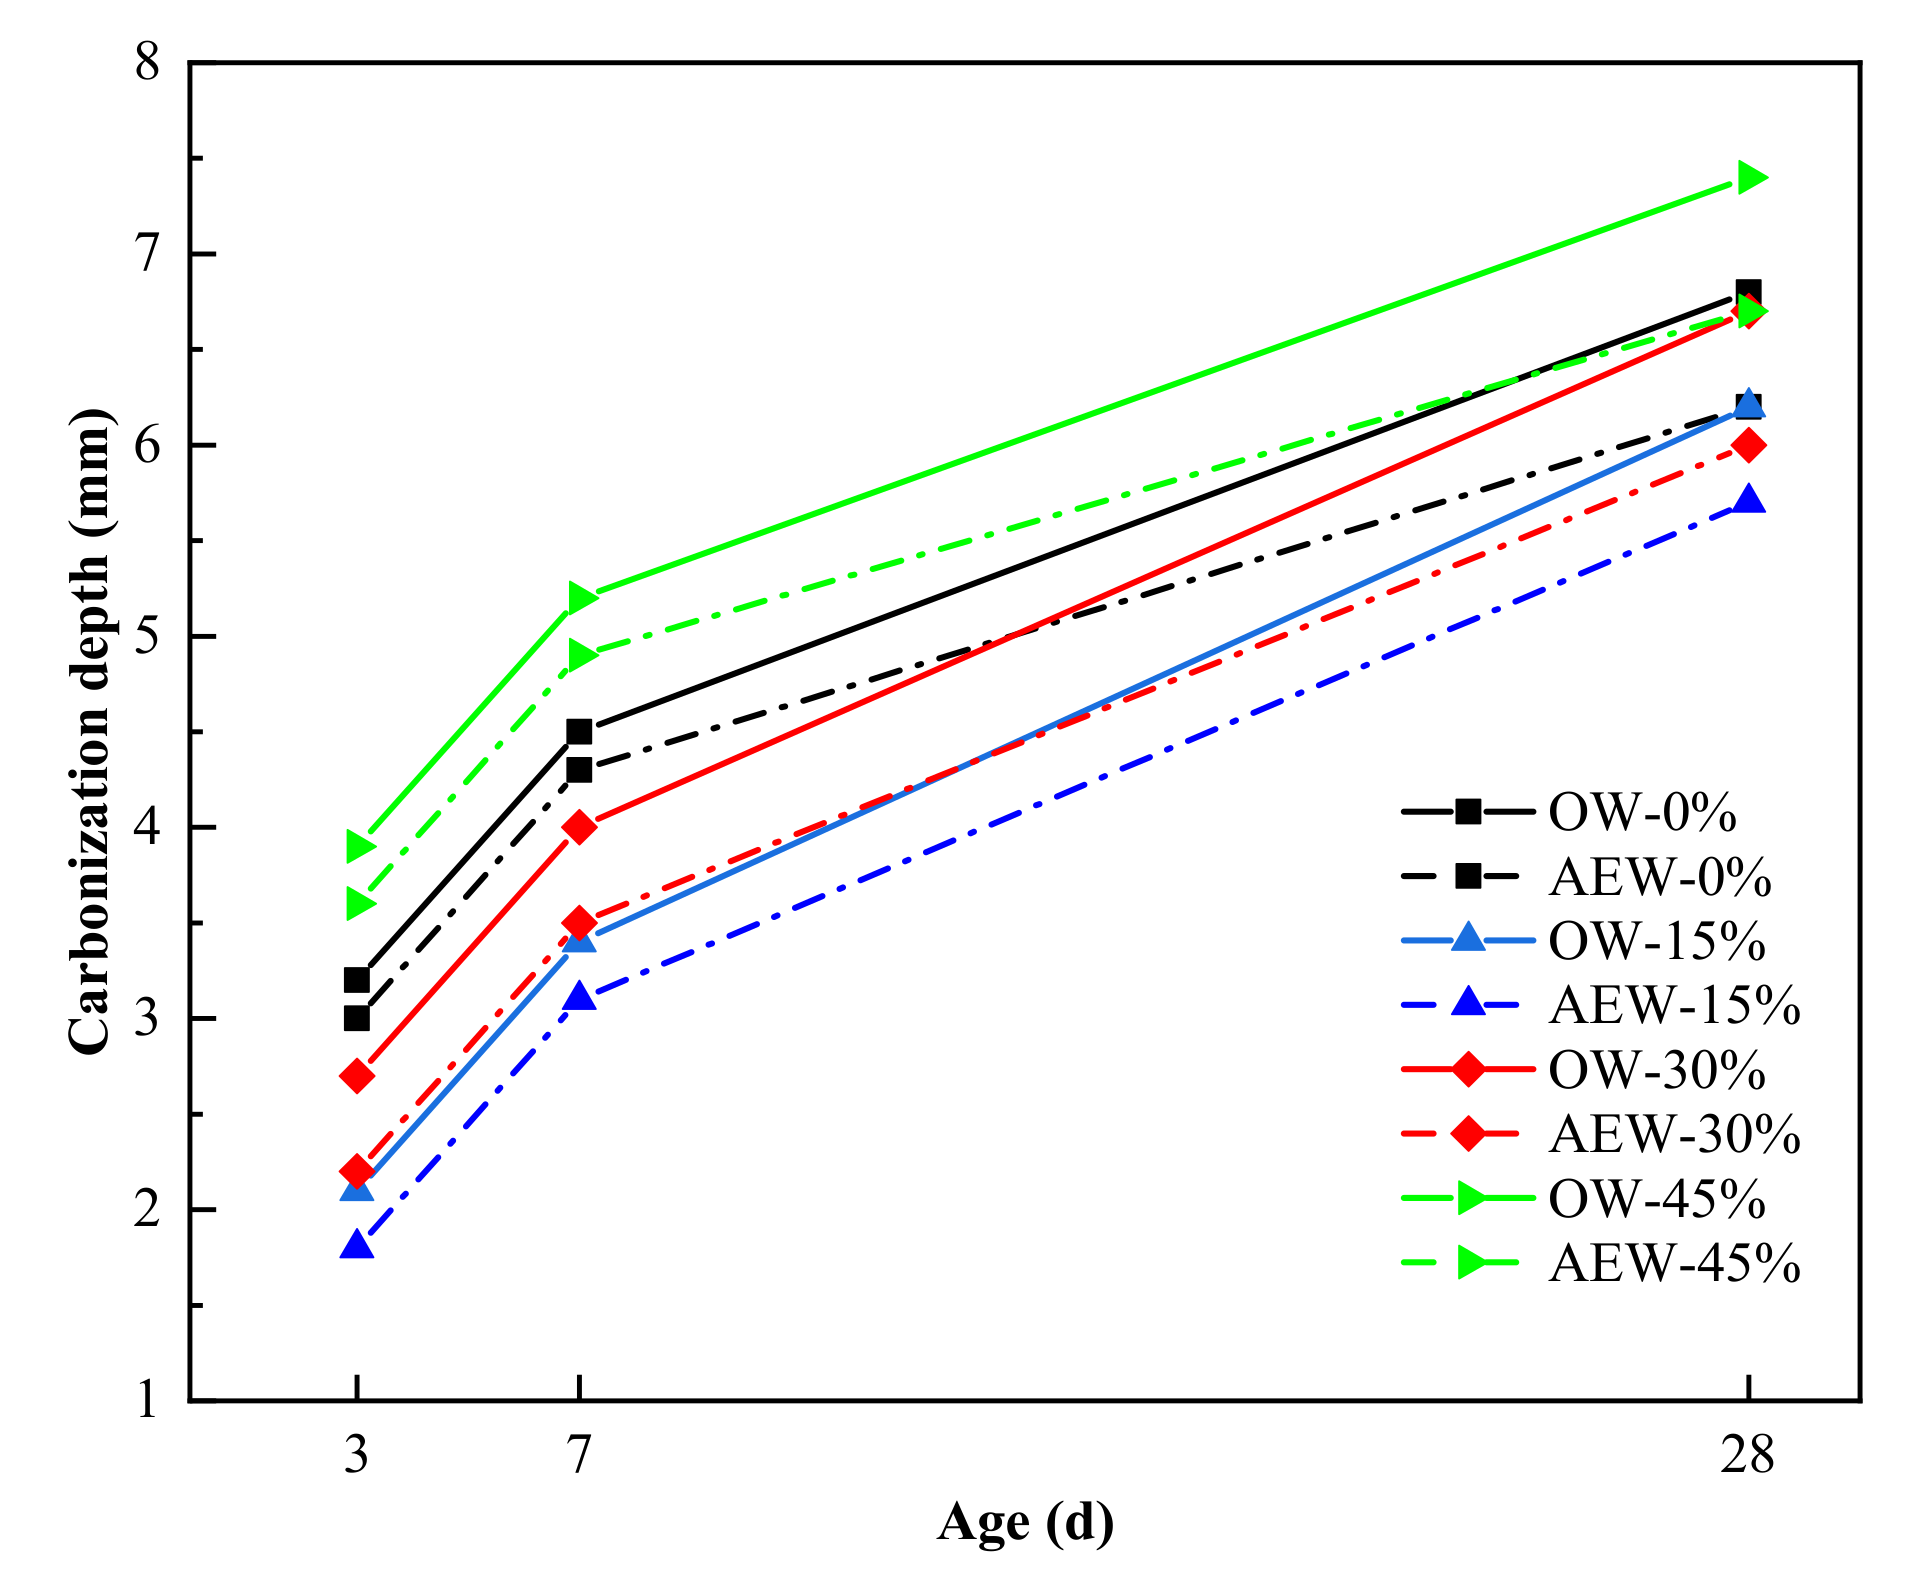
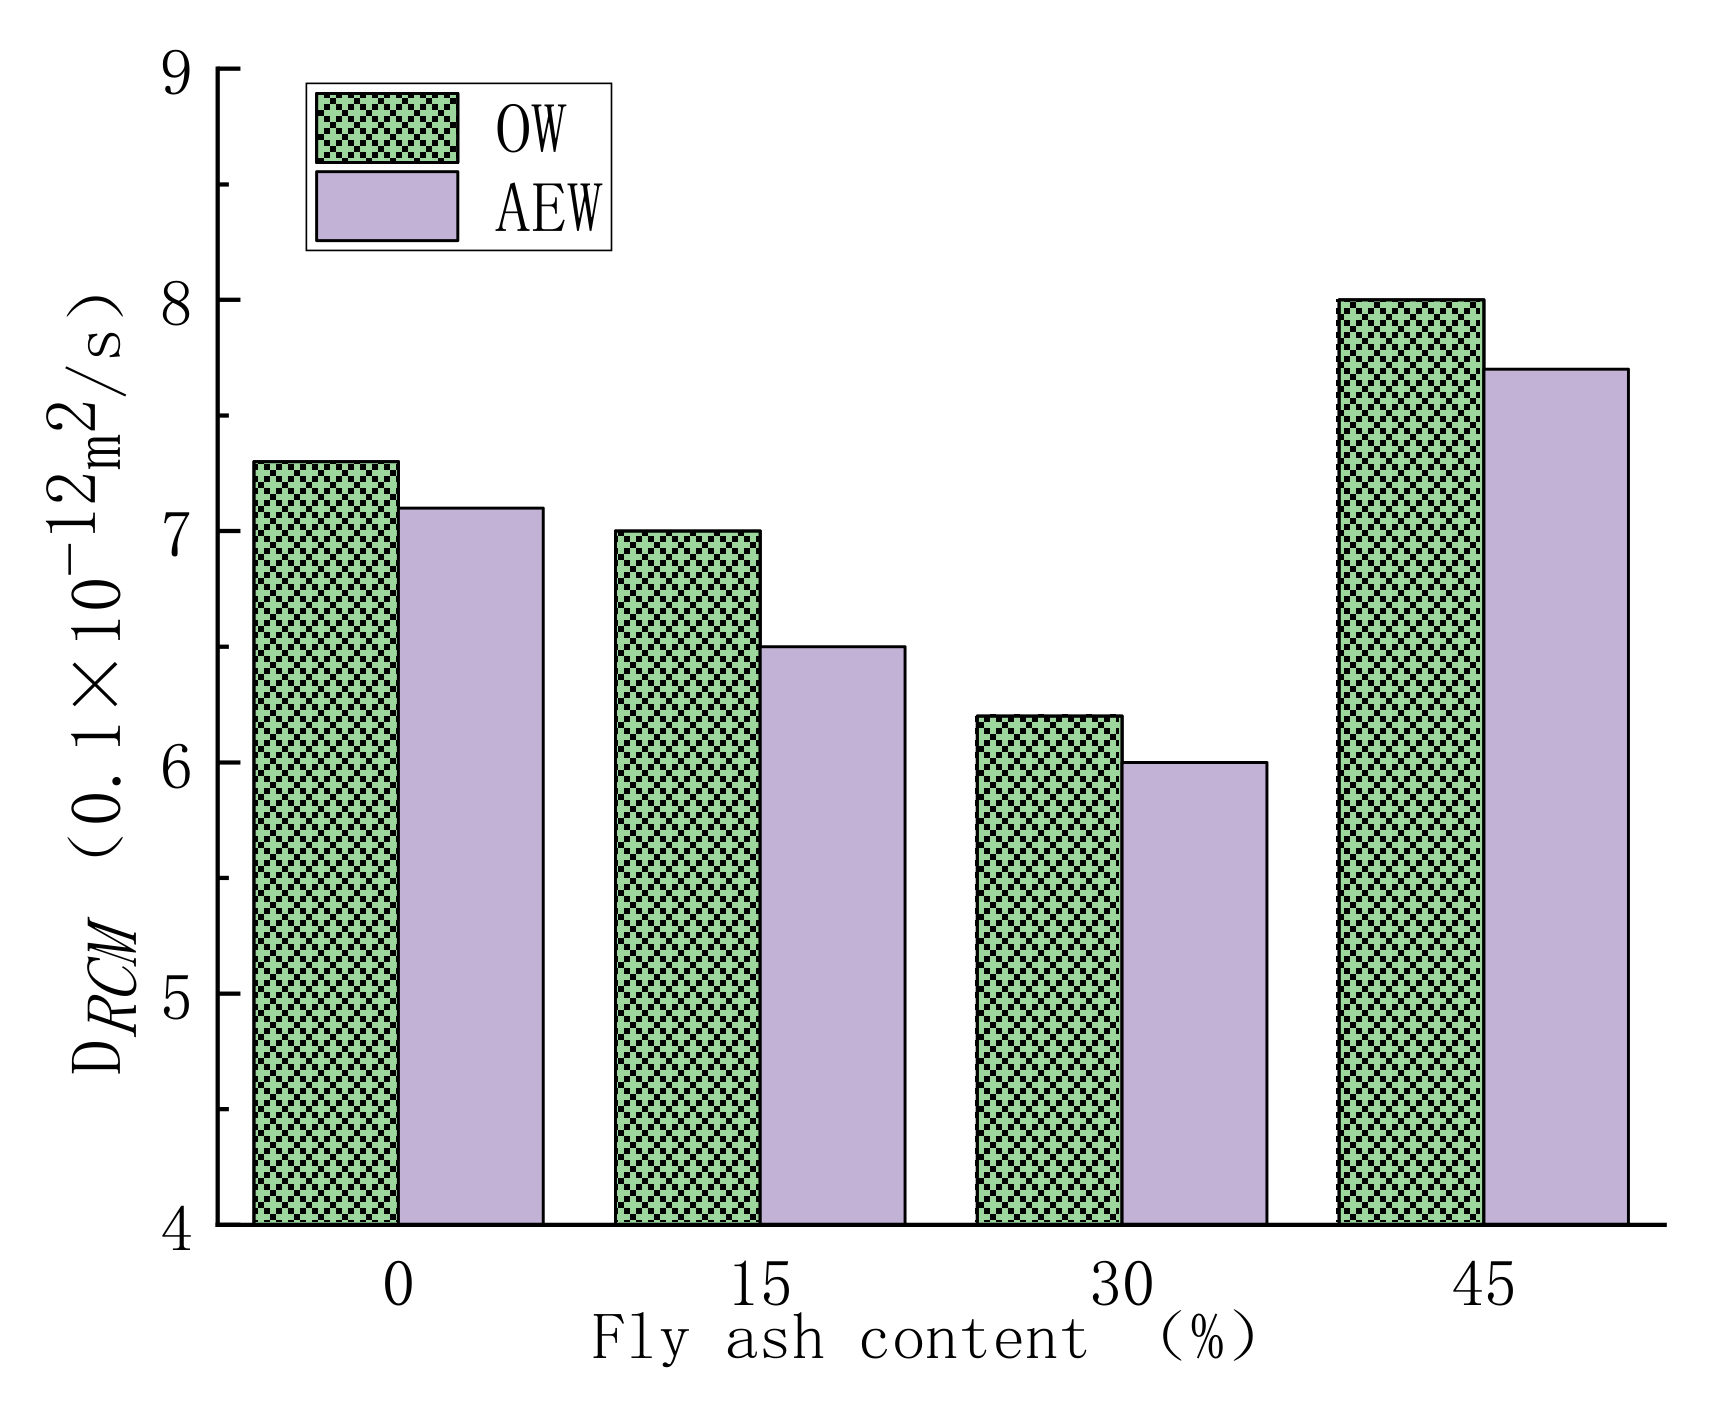
3.6. Durability of Concrete
4. Conclusions
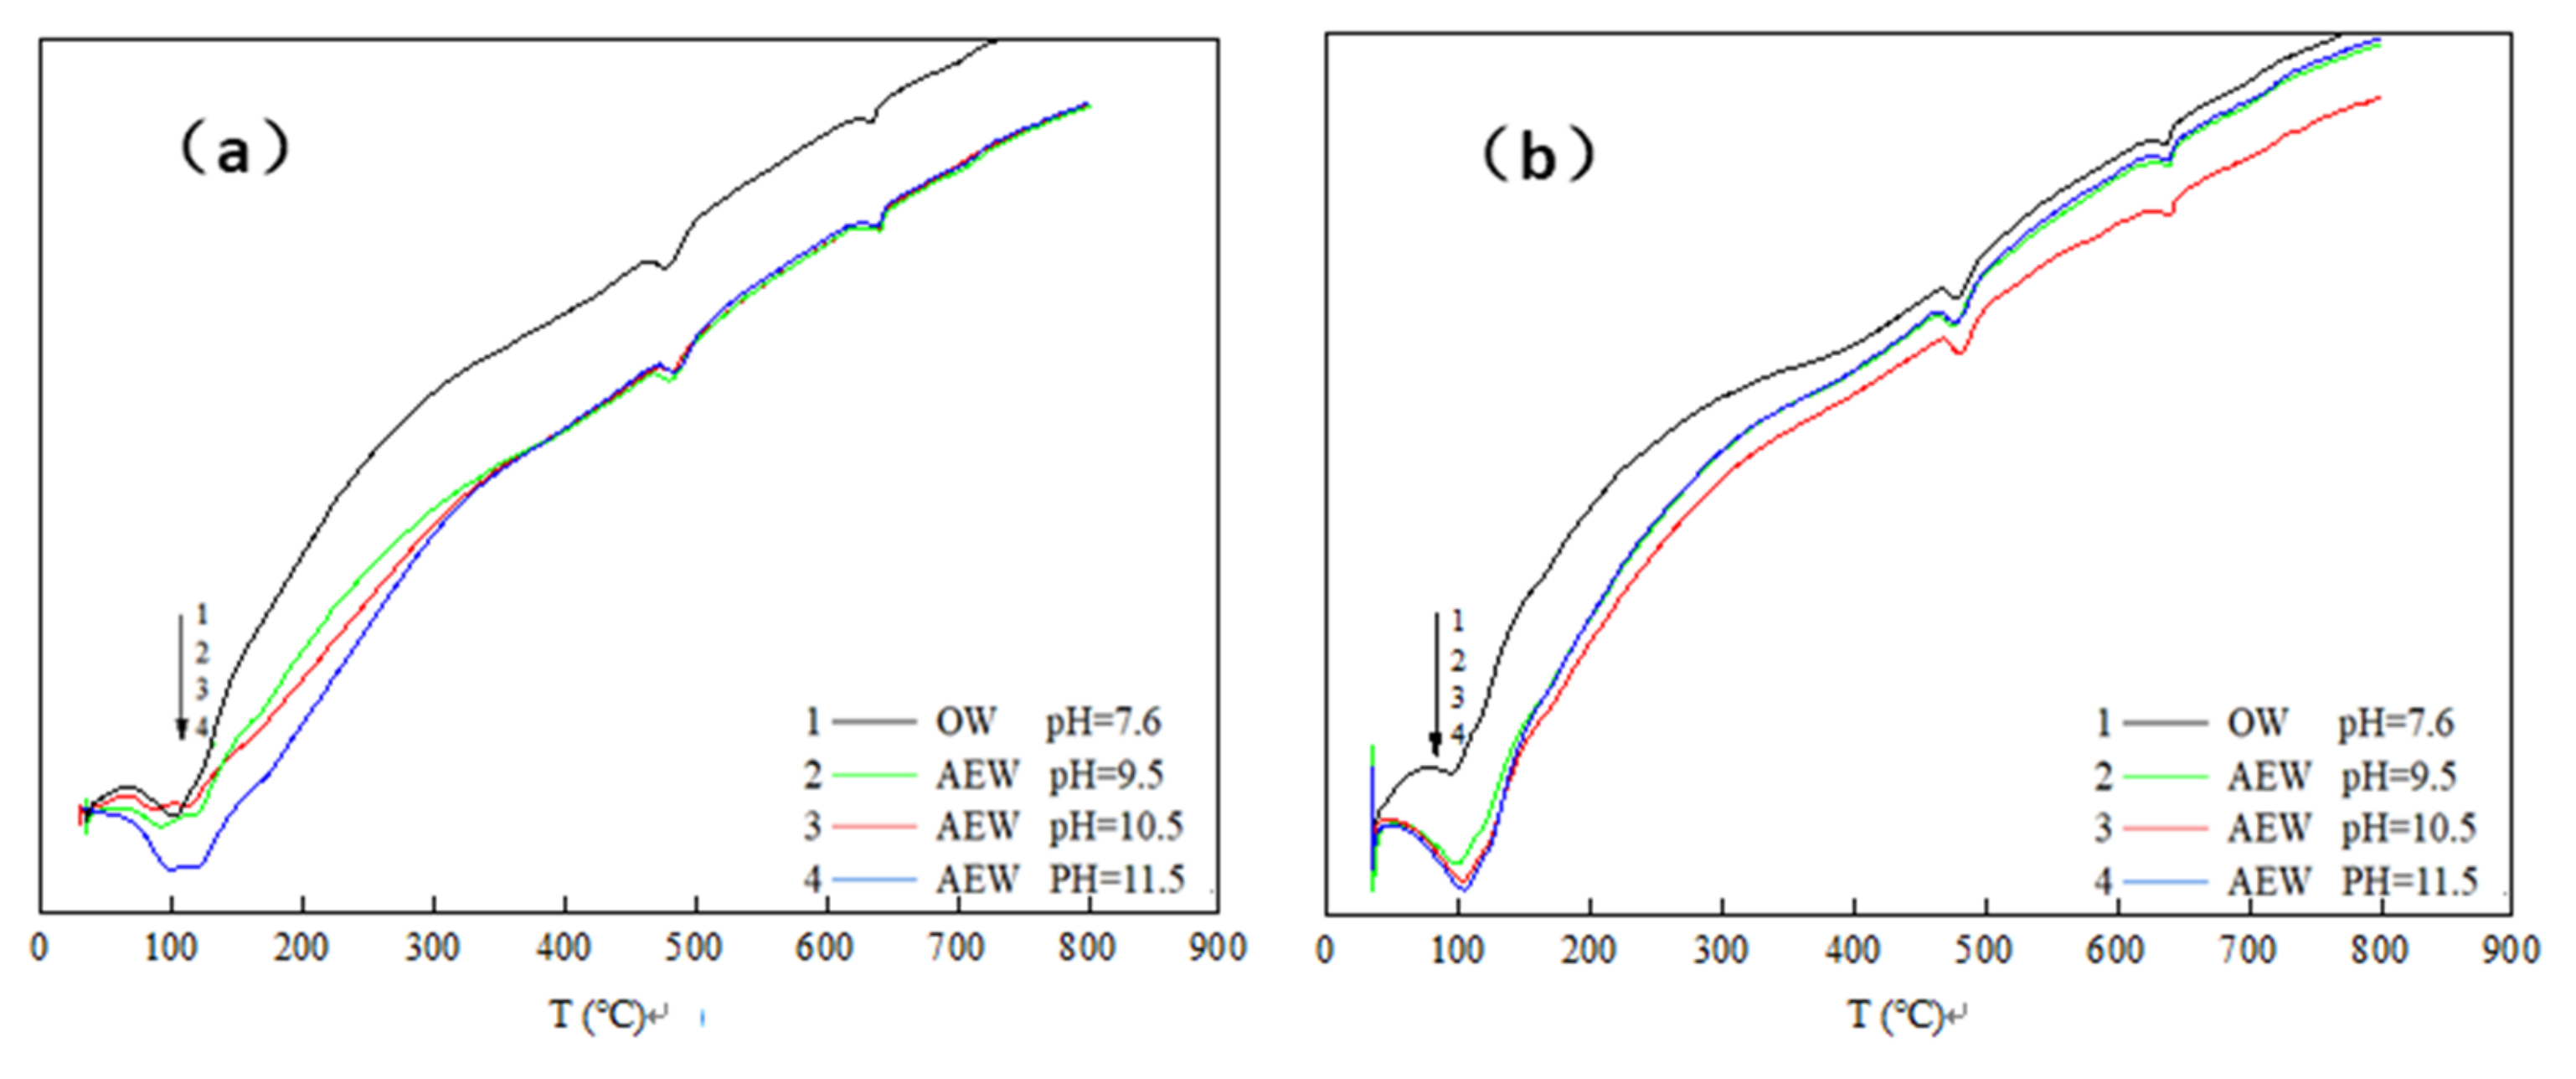
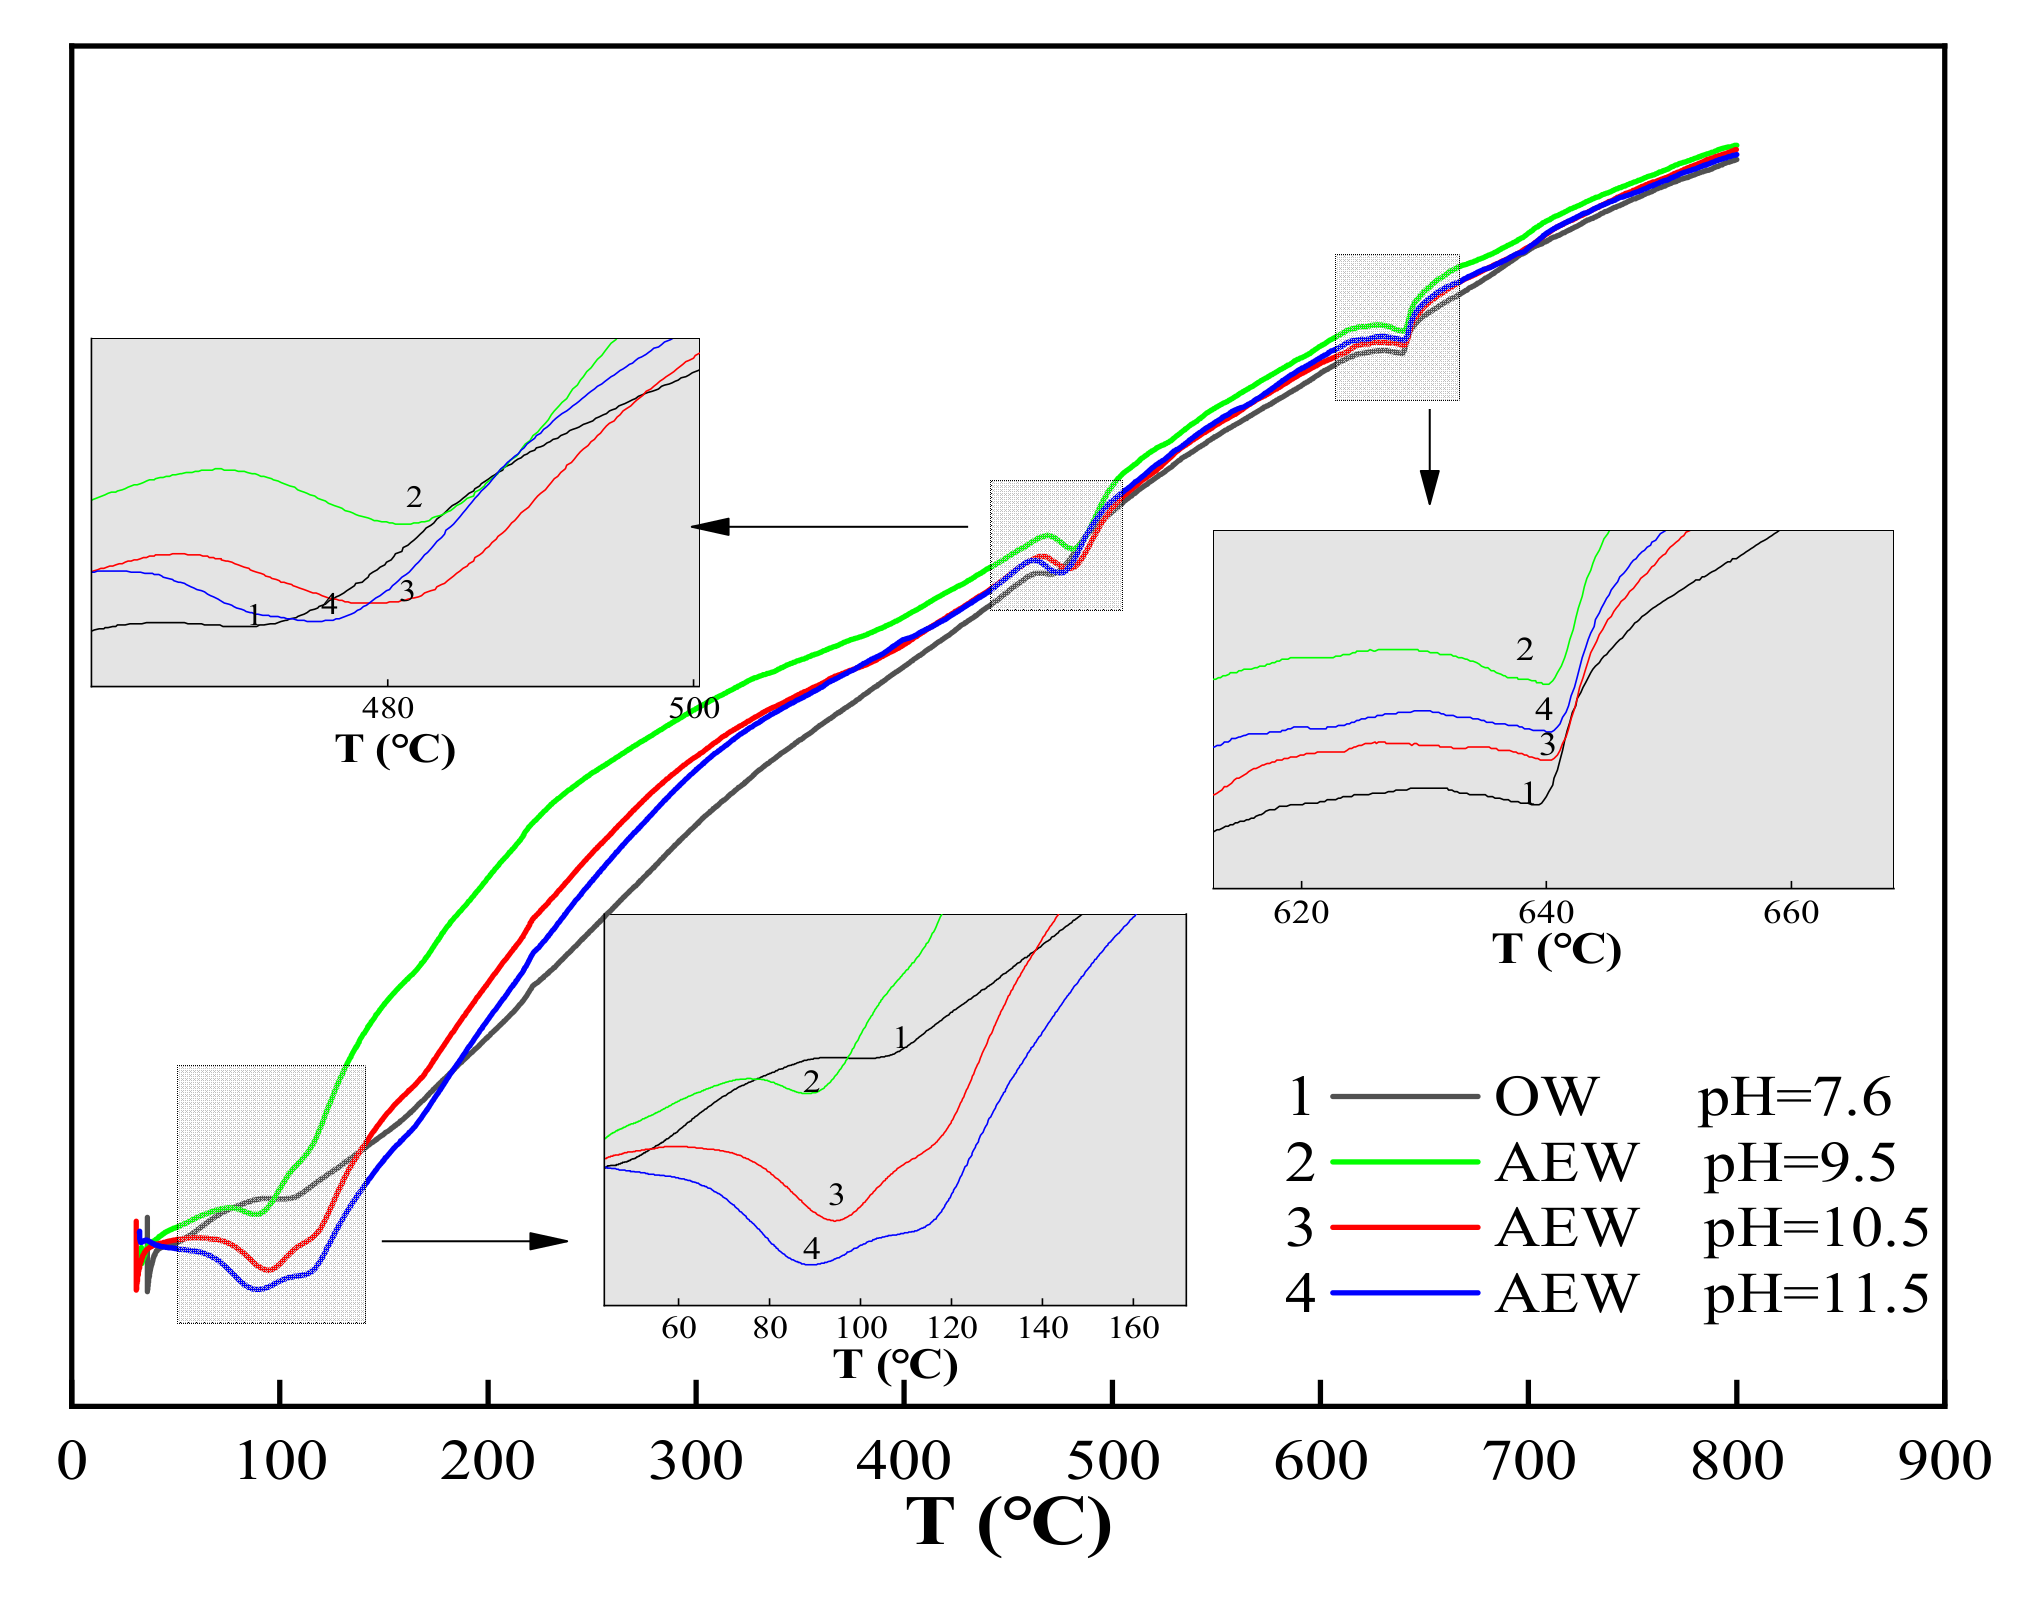
- AEW promoted the hydration process and hydration degree of cement and released more hydration heat, and their influence effectively increased with the increased pH value of AEW.
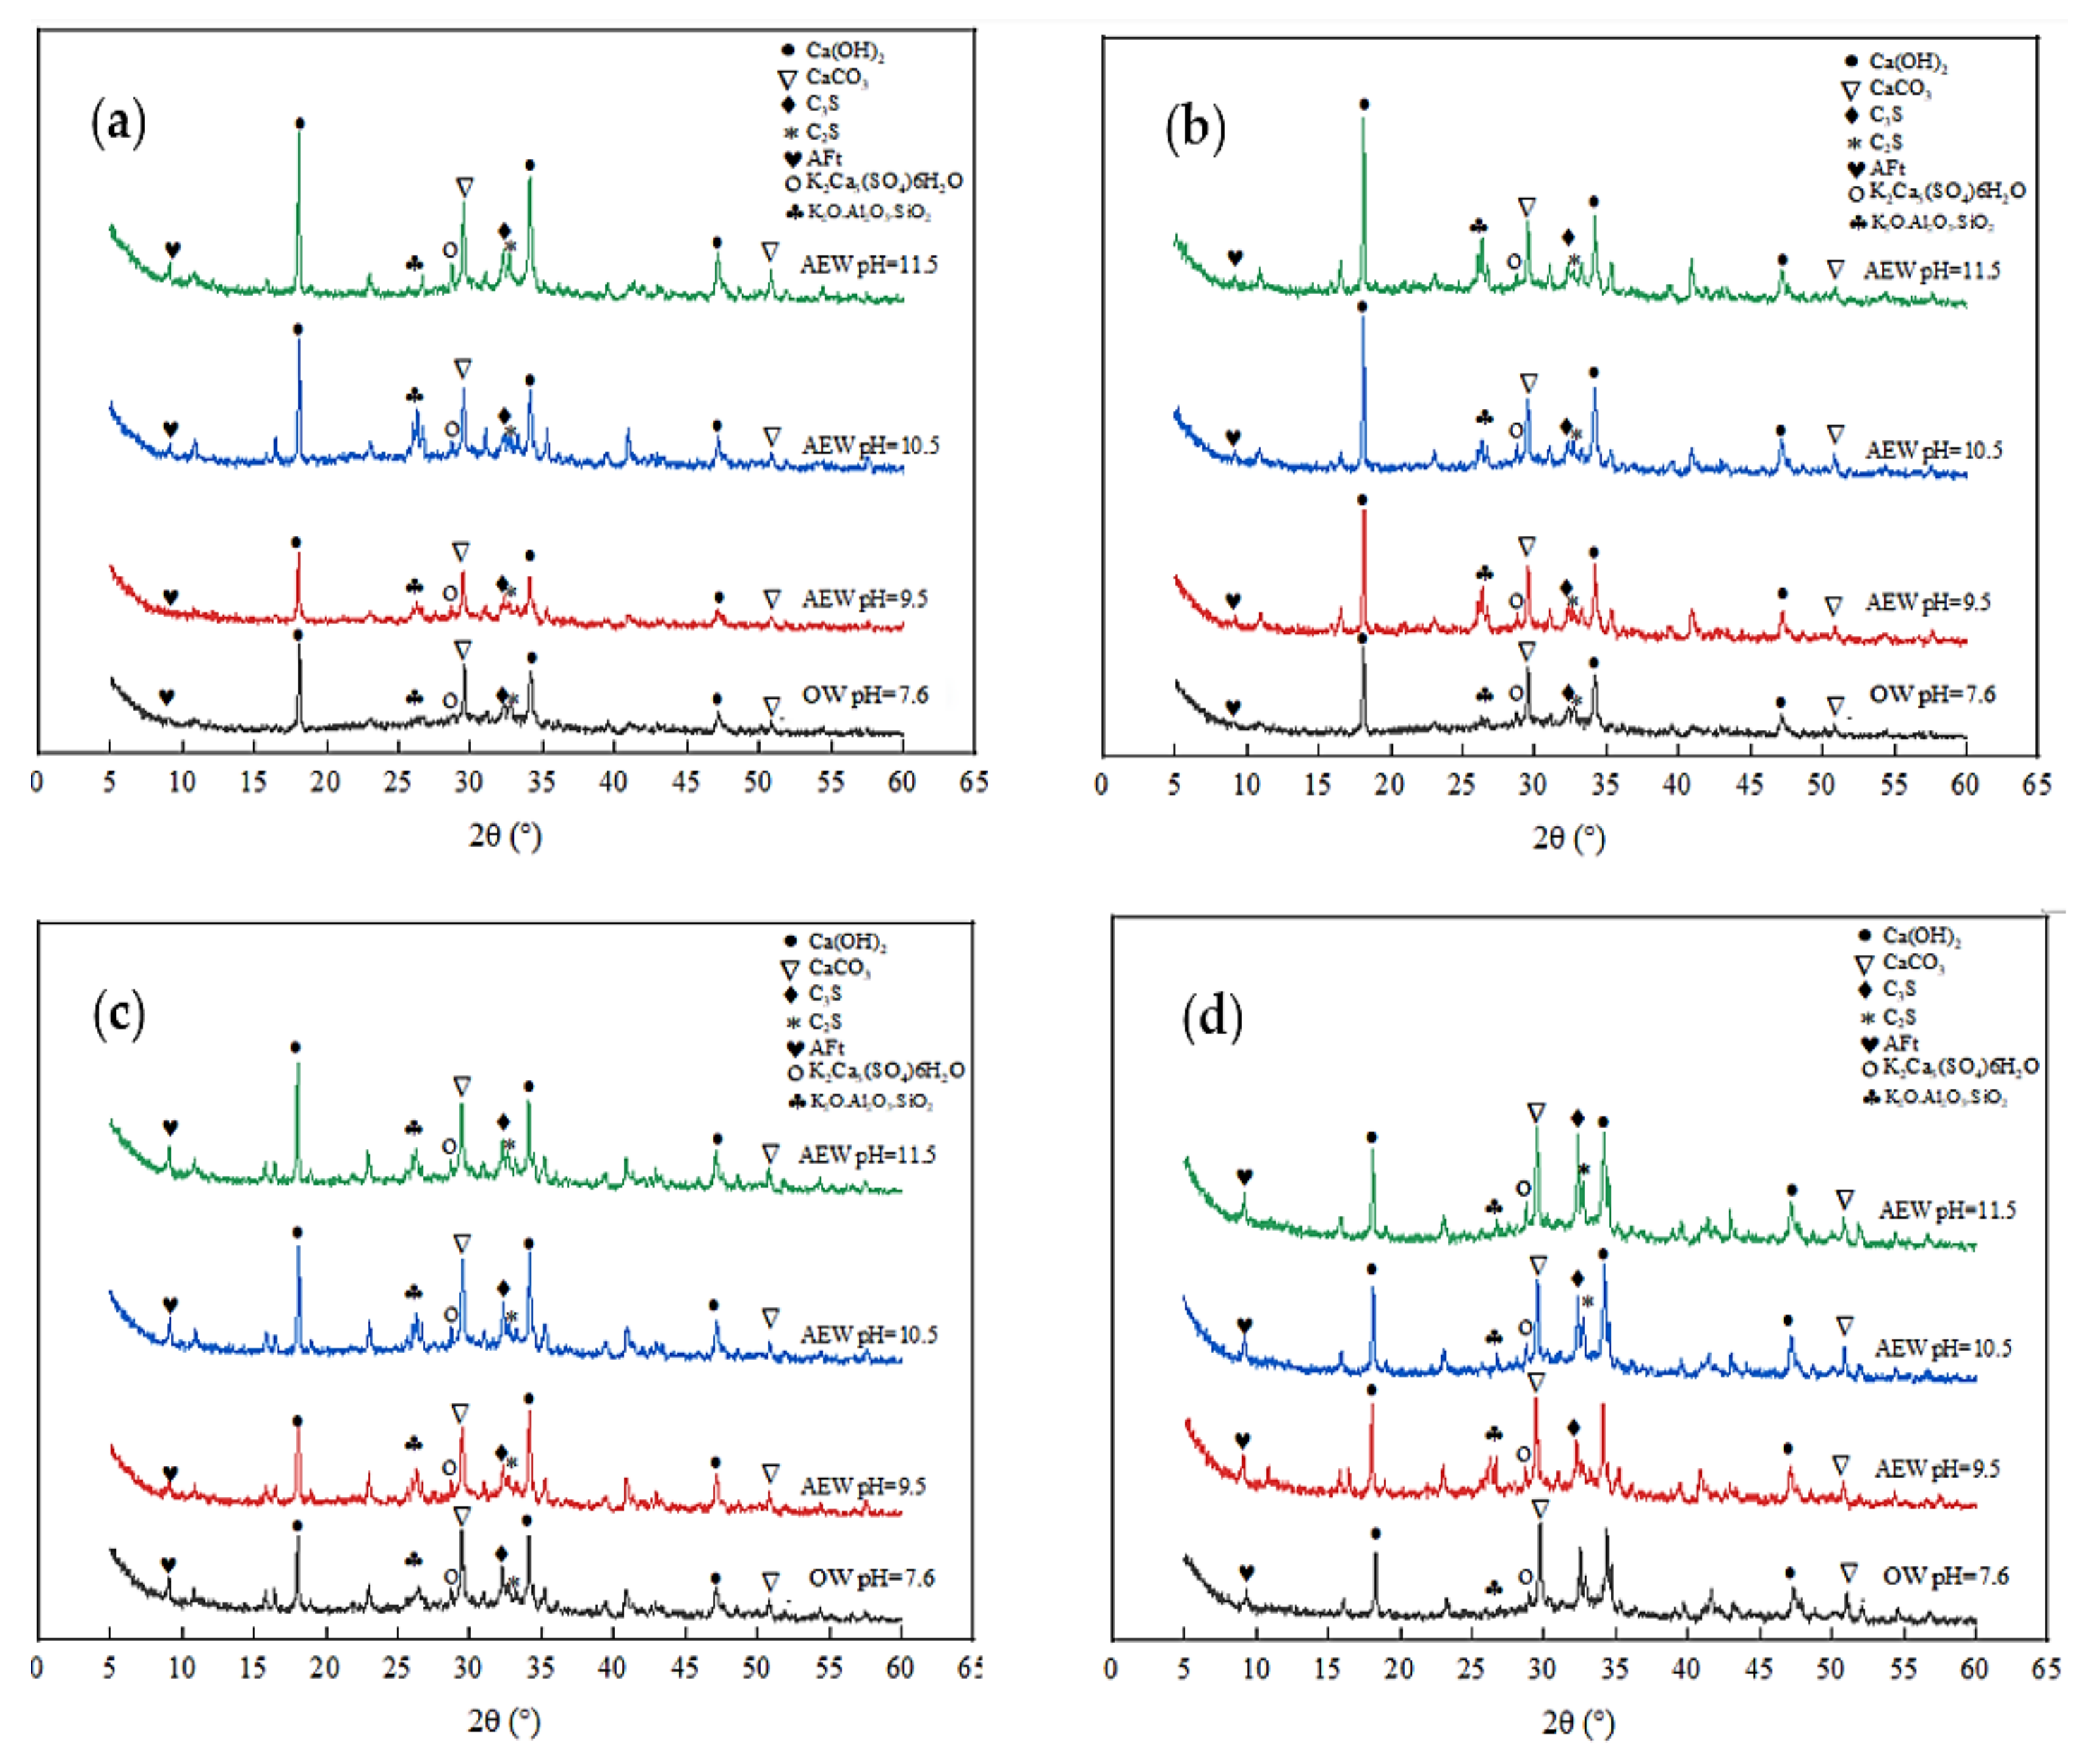
- AEW increased the formation of C-S-H gel, ettringite, and the Ca(OH)2 phase in cement hydration products. In addition, unlike OW, potassium hydroxide (KOH) in potassium-based AEW reacted with active minerals Al2O3 and SiO2 in cement and FA to form certain amounts of polycalcium potassium gypsum and potassium feldspar, which proved beneficial to the improvement of macroscopic strength.
- SEM observations showed that the higher the pH value of AEW samples, the denser the structure of the hydration products produced, and AEW with a pH value of 11.5 had a pronounced decomposition effect on the vitreous shell of FA, which better released SiO2 and other active components for hydration reaction, proving the feasibility of AEW to activate FA activity.
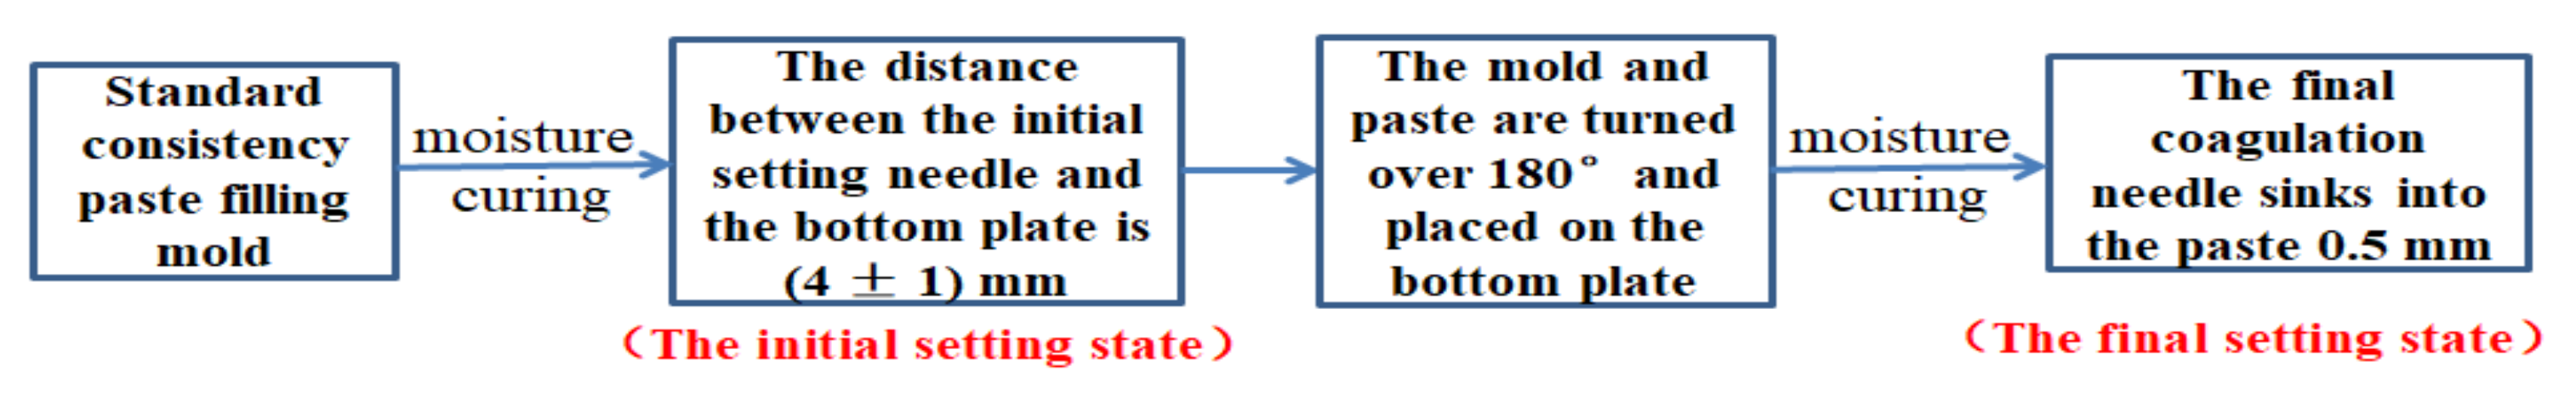
- The charge and small molecules of AEW effectively improved the functional properties of the paste, reduced the water requirement for a normal consistency, and shortened the initial setting time and final setting time, which was direct evidence that AEW promotes cement hydration. AEW also effectively improved the early and late strength of FA mortar and maintained excellent mechanical properties when the FA content was increased to 30%, thus achieving cement reduction. In addition, the hydration promotion effect of AEW and its alkali reserve reduced the carbonation rate and carbonation depth of concrete and improved concrete’s chloride ion penetration resistance.
Author Contributions
Funding
Institutional Review Board Statement
Informed Consent Statement
Data Availability Statement
Acknowledgments
Conflicts of Interest
Abbreviations
| AEW | alkaline electrolyzed water |
| AEWC | alkaline electrolyzed water concrete |
| AEWM | alkaline electrolyzed water mortar |
| AEWP | alkaline electrolyzed water paste |
| FA | fly ash |
| FAC | fly ash concrete |
| FAM | fly ash mortar |
| FAP | fly ash paste |
| OW | ordinary water |
| OWC | ordinary water concrete |
| OWM | ordinary water mortar |
| OWP | ordinary water paste |
References
- Blinova, I.; Bityukova, L.; Kasemets, K.; Ivask, A.; Kakinen, A.; Kurvet, I.; Bondarenko, O.; Kanarbik, L.; Sihtmäe, M.; Aruoja, V.; et al. Environmental hazard of oil shale combustion fly ash. J. Hazard. Mater. 2012, 229–230, 192–200. [Google Scholar] [CrossRef]
- Zhou, J.; Wu, S.; Pan, Y.; Zhang, L.; Cao, Z.; Zhang, X.; Yonemochi, S.; Hosono, S.; Wang, Y.; Oh, K.; et al. Enrichment of heavy metals in fine particles of municipal solid waste incinerator (MSWI) fly ash and associated health risk. Waste Manag. 2015, 43, 239–246. [Google Scholar] [CrossRef]
- Mandal, A.; Sengupta, D. Radioelemental study of Kolaghat, thermal power plant, West Bengal, India: Possible environmental hazards. Environ. Earth Sci. 2003, 44, 180–186. [Google Scholar] [CrossRef]
- Xu, G.; Shi, X. Characteristics and applications of fly ash as a sustainable construction material: A state-of-the-art review. Resour. Conserv. Recycl. 2018, 136, 95–109. [Google Scholar] [CrossRef]
- Chalee, W.; Ausapanit, P.; Jaturapitakkul, C. Utilization of fly ash concrete in marine environment for long term design life analysis. Mater. Des. 2010, 31, 1242–1249. [Google Scholar] [CrossRef]
- Yang, J.; Huang, J.; Su, Y.; He, X.; Tan, H.; Yang, W.; Strnadel, B. Eco-friendly treatment of low-calcium coal fly ash for high pozzolanic reactivity: A step towards waste utilization in sustainable building material. J. Clean. Prod. 2019, 238, 117962. [Google Scholar] [CrossRef]
- Hanif, A.; Lu, Z.; Li, Z. Utilization of fly ash cenosphere as lightweight filler in cement-based composites—A review. Constr. Build. Mater. 2017, 144, 373–384. [Google Scholar] [CrossRef]
- Huang, T.; Chiueh, P.; Lo, S. Life-cycle environmental and cost impacts of reusing fly ash. Resour. Conserv. Recycl. 2017, 123, 255–260. [Google Scholar] [CrossRef]
- Siddique, R. Performance characteristics of high-volume Class F fly ash concrete. Cem. Concr. Res. 2004, 34, 487–493. [Google Scholar] [CrossRef]
- Kayali, O.; Ahmed, M.S. Assessment of high volume replacement fly ash concrete—Concept of performance index. Constr. Build. Mater. 2013, 39, 71–76. [Google Scholar] [CrossRef]
- Nguyen, Q.D.; Castel, A.; Kim, T.; Khan, M.S. Performance of fly ash concrete with ferronickel slag fine aggregate against alkali-silica reaction and chloride diffusion. Cem. Concr. Res. 2021, 139, 106265. [Google Scholar] [CrossRef]
- Li, H.; Xu, D.; Feng, S.; Shang, B. Microstructure and performance of fly ash micro-beads in cementitious material system. Constr. Build. Mater. 2014, 52, 422–427. [Google Scholar] [CrossRef]
- Limbachiya, M.; Meddah, M.S.; Ouchagour, Y. Use of recycled concrete aggregate in fly-ash concrete. Constr. Build. Mater. 2011, 27, 439–449. [Google Scholar] [CrossRef]
- Kumar, S.; Mucsi, G.; Kristály, F.; Pekker, P. Mechanical activation of fly ash and its influence on micro and nano-structural behaviour of resulting geopolymers. Adv. Powder Technol. 2017, 28, 805–813. [Google Scholar] [CrossRef]
- Patil, A.G.; Anandhan, S. Influence of planetary ball milling parameters on the mechano-chemical activation of fly ash. Powder Technol. 2015, 281, 151–158. [Google Scholar] [CrossRef]
- Marjanovic, N.; Komljenovic, M.; Bascarevic, Z.; Nikolic, V. Improving reactivity of fly ash and properties of ensuing geopolymers through mechanical activation. Constr. Build. Mater. 2014, 57, 151–162. [Google Scholar] [CrossRef]
- Sadique, M.; Al-Nageim, H.; Atherton, W.; Seton, L.; Dempster, N. Mechano-chemical activation of high-Ca fly ash by cement free blending and gypsum aided grinding. Constr. Build. Mater. 2013, 43, 480–489. [Google Scholar] [CrossRef]
- Mucsi, G.; Kumar, S.; Csőke, B.; Kumar, R.; Molnár, Z.; Rácz, Á.; Madai, F.; Debreczeni, Á. Control of geopolymer properties by grinding of land filled fly ash. Int. J. Miner. Process. 2015, 143, 50–58. [Google Scholar] [CrossRef]
- Nikolic, V.; Komljenovic, M.; Marjanovic, N.; Bascarevic, Z.; Petrovic, R. Lead immobilization by geopolymers based on mechanically activated fly ash. Ceram. Int. 2014, 40, 8479–8488. [Google Scholar] [CrossRef]
- Haq, E.U.; Padmanabhan, S.K.; Licciulli, A.A. Synthesis and characteristics of fly ash and bottom ash based geopolymers–A comparative study. Ceram. Int. 2014, 40, 2965–2971. [Google Scholar] [CrossRef]
- Hefni, Y.; El Zaher, Y.A.; Wahab, M.A. Influence of activation of fly ash on the mechanical properties of concrete. Constr. Build. Mater. 2018, 172, 728–734. [Google Scholar] [CrossRef]
- Hadi, M.; Al-Azzawi, M.; Yu, T. Effects of fly ash characteristics and alkaline activator components on compressive strength of fly ash-based geopolymer mortar. Constr. Build. Mater. 2018, 175, 41–54. [Google Scholar] [CrossRef]
- Adak, D.; Sarkar, M.; Mandal, S. Effect of nano-silica on strength and durability of fly ash based geopolymer mortar. Constr. Build. Mater. 2014, 70, 453–459. [Google Scholar] [CrossRef]
- Ryu, G.S.; Lee, Y.B.; Koh, K.T.; Chung, Y.S. The mechanical properties of fly ash-based geopolymer concrete with alkaline activators. Constr. Build. Mater. 2013, 47, 409–418. [Google Scholar] [CrossRef]
- Sun, Z.; Vollpracht, A. Isothermal calorimetry and in-situ XRD study of the NaOH activated fly ash, metakaolin and slag. Cem. Concr. Res. 2018, 103, 110–122. [Google Scholar] [CrossRef]
- Palacios, M.; Alonso, M.; Varga, C.; Puertas, F. Influence of the alkaline solution and temperature on the rheology and reactivity of alkali-activated fly ash pastes. Cem. Concr. Compos. 2019, 95, 277–284. [Google Scholar] [CrossRef]
- Adak, D.; Sarkar, M.; Mandal, S. Structural performance of nano-silica modified fly-ash based geopolymer concrete. Constr. Build. Mater. 2017, 135, 430–439. [Google Scholar] [CrossRef]
- Tennakoon, C.; Nazari, A.; Sanjayan, J.G.; Sagoe-Crentsil, K. Distribution of oxides in fly ash controls strength evolution of geopolymers. Constr. Build. Mater. 2014, 71, 72–82. [Google Scholar] [CrossRef]
- Bignozzi, M.C.; Manzi, S.; Natali, M.E.; Rickard, W.; van Riessen, A. Room temperature alkali activation of fly ash: The effect of Na2O/SiO2 ratio. Constr. Build. Mater. 2014, 69, 262–270. [Google Scholar] [CrossRef]
- Fang, J.L.; Lu, W.X.; Xu, C.X. Progress in activiting techniques and mechanism studies of fly ash. J. Shanghai Univ. (Nat. Sci. Ed.) 2002, 8, 255–260. [Google Scholar]
- Marini, S.; Salvi, P.; Nelli, P.; Pesenti, R.; Villa, M.; Berrettoni, M.; Zangari, G.; Kiros, Y. Advanced alkaline water electrolysis. Electrochim. Acta 2012, 82, 384–391. [Google Scholar] [CrossRef]
- Sun, B.Q.; Wang, L.J. Preliminary Study on the Performance of Alkaline Redox Potential Water Mixing Concrete. J. Build. Mater. 2009, 12, 112–115. [Google Scholar]
- Tanaka, Y.; Saihara, Y.; Izumotani, K.; Nakamura, H. Daily ingestion of alkaline electrolyzed water containing hydrogen influences human health, including gastrointestinal symptoms. Med. Gas Res. 2018, 8, 160–166. [Google Scholar] [CrossRef]
- Li, Z.-H.; Zhou, B.; Li, X.-T.; Li, S.-G. Effect of alkaline electrolyzed water on physicochemical and structural properties of apricot protein isolate. Food Sci. Biotechnol. 2018, 28, 15–23. [Google Scholar] [CrossRef] [PubMed]
- Zeng, K.; Zhang, D. Recent progress in alkaline water electrolysis for hydrogen production and applications. Prog. Energy Combust. Sci. 2010, 36, 307–326. [Google Scholar] [CrossRef]
- Kovtun, M.; Ziolkowski, M.; Shekhovtsova, J.; Kearsley, E. Direct electric curing of alkali-activated fly ash concretes: A tool for wider utilization of fly ashes. J. Clean. Prod. 2016, 133, 220–227. [Google Scholar] [CrossRef] [Green Version]
- Ma, Y.; Ye, G.; Hu, J. Micro-mechanical properties of alkali-activated fly ash evaluated by nanoindentation. Constr. Build. Mater. 2017, 147, 407–416. [Google Scholar] [CrossRef]
- Wang, L.; Quan, H. Effects of Single and Compound Electrolyte Electrolyzed Cathode Waters on Mechanical Property and Hydration Reaction of Concrete. Sci. Adv. Mater. 2020, 12, 366–375. [Google Scholar] [CrossRef]
- Chakraborty, S.; Mandal, R.; Chattopadhyay, S.; Chakraborty, S. Investigation on the effectiveness of electrolyzed water in controlling the early age properties of cement mortar. Constr. Build. Mater. 2019, 211, 1–11. [Google Scholar] [CrossRef]
- Banfill, P. Re-alkalisation of carbonated concrete—Effect on concrete properties. Constr. Build. Mater. 1997, 11, 255–258. [Google Scholar] [CrossRef]
- Redaelli, E.; Bertolini, L. Resistance to carbonation of concrete after re-alkalization by absorption of sodium carbonate solution. Stud. Conserv. 2016, 61, 297–305. [Google Scholar] [CrossRef]
- Zhu, X.; Zi, G.; Cao, Z.; Cheng, X. Combined effect of carbonation and chloride ingress in concrete. Constr. Build. Mater. 2016, 110, 369–380. [Google Scholar] [CrossRef]
- Peng, X.; Hu, C.; Lan, C. Effect of mineral admixtures incorporation on chloride ion permeability resistance of low water-cement ratio concrete. Bull. Chin. Ceram. Soc. 2013, 32, 2435–2439. [Google Scholar]


| Constituent | CaO | SiO2 | Al2O3 | Fe2O3 | SO3 | MgO | Na2O | K2O | TiO2 |
| OPC | 62.73 | 17.80 | 6.38 | 5.83 | 2.98 | 1.94 | 0.86 | 0.58 | 0.52 |
| FA | 2.41 | 57.36 | 28.68 | 4.29 | 0.35 | 1.28 | 0.73 | 0.83 | 1.92 |
| Fineness Module | Specifications | Stacking Density (kg/m3) | Apparent Density (kg/m3) | Void Ratio/% | Micro Powder Content/% | Mud Content/% | Crushing Index/% |
|---|---|---|---|---|---|---|---|
| 2.43 | Medium sand Ⅱ class | 1450 | 2590 | 40 | 1.0 | 0.7 | 13 |
| Water Absorption/% | Moisture Content/% | Content of Needle-like Particles/% | Crushing Index/% | Stacking Density (kg/m3) | Apparent Density (kg/m3) |
|---|---|---|---|---|---|
| 1.7 | 0.42 | 4.05 | 11.2 | 1460 | 2510 |
| PH Value | ORP Value | K2CO3 Solution Concentration (%) | Total Inflow (L/h) | Alkaline Water Inflow (L/h) | Current (mA) | Voltage (V) |
|---|---|---|---|---|---|---|
| 9.5 | 224 | 0.05 | 40 | 20 | 0.6 | 10.1 |
| 10.5 | 207 | 0.08 | 40 | 20 | 1.0 | 18.7 |
| 11.5 | 200 | 0.10 | 40 | 20 | 3.0 | 25.6 |
| Types of Water | PH Value | Water | Cement | Fly Ash | Sand | Water Reducer |
|---|---|---|---|---|---|---|
| OW | 7.6 | 225 | 450 | 0 | 1350 | 5.4 |
| OW | 7.6 | 382.5 | 67.5 | |||
| OW | 7.6 | 315 | 135 | |||
| OW | 7.6 | 247.5 | 202.5 | |||
| AEW | 9.5 | 450 | 0 | |||
| AEW | 9.5 | 382.5 | 67.5 | |||
| AEW | 9.5 | 315 | 135 | |||
| AEW | 9.5 | 247.5 | 202.5 | |||
| AEW | 10.5 | 450 | 0 | |||
| AEW | 10.5 | 382.5 | 67.5 | |||
| AEW | 10.5 | 315 | 135 | |||
| AEW | 10.5 | 247.5 | 202.5 | |||
| AEW | 11.5 | 450 | 0 | |||
| AEW | 11.5 | 382.5 | 67.5 | |||
| AEW | 11.5 | 315 | 135 | |||
| AEW | 11.5 | 247.5 | 202.5 |
| Types of Water | Water | Cement | Fly Ash | River Sand | Gravel | Water Reducer | W/C |
|---|---|---|---|---|---|---|---|
| OW | 163 | 440 | 0 | 843 | 861 | 8.8 | 0.37 |
| AEW | 440 | 0 | |||||
| OW | 374 | 66 | |||||
| AEW | 374 | 66 | |||||
| OW | 308 | 132 | |||||
| AEW | 308 | 132 | |||||
| OW | 242 | 198 | |||||
| AEW | 242 | 198 |
Publisher’s Note: MDPI stays neutral with regard to jurisdictional claims in published maps and institutional affiliations. |
© 2021 by the authors. Licensee MDPI, Basel, Switzerland. This article is an open access article distributed under the terms and conditions of the Creative Commons Attribution (CC BY) license (https://creativecommons.org/licenses/by/4.0/).
Share and Cite
Yu, Z.; Xie, Z.; Zhang, T.; Yue, G.; Liu, H.; Li, Q.; Wang, L. Influence of Potassium-Based Alkaline Electrolyzed Water on Hydration Process and the Properties of Cement-Based Materials with Fly Ash. Materials 2021, 14, 6956. https://doi.org/10.3390/ma14226956
Yu Z, Xie Z, Zhang T, Yue G, Liu H, Li Q, Wang L. Influence of Potassium-Based Alkaline Electrolyzed Water on Hydration Process and the Properties of Cement-Based Materials with Fly Ash. Materials. 2021; 14(22):6956. https://doi.org/10.3390/ma14226956
Chicago/Turabian StyleYu, Zexin, Zixi Xie, Tianyu Zhang, Gongbing Yue, Haibao Liu, Qiuyi Li, and Liang Wang. 2021. "Influence of Potassium-Based Alkaline Electrolyzed Water on Hydration Process and the Properties of Cement-Based Materials with Fly Ash" Materials 14, no. 22: 6956. https://doi.org/10.3390/ma14226956
APA StyleYu, Z., Xie, Z., Zhang, T., Yue, G., Liu, H., Li, Q., & Wang, L. (2021). Influence of Potassium-Based Alkaline Electrolyzed Water on Hydration Process and the Properties of Cement-Based Materials with Fly Ash. Materials, 14(22), 6956. https://doi.org/10.3390/ma14226956