
A Novel Approach to the Holistic 3D Characterization of Weld Seams—Paving the Way for Deep Learning-Based Process Monitoring

 , , and
Abstract
:1. Introduction
2. State of the Art
2.1. Offline Characterization of the Weld Seam Geometry and Weld Defects
2.2. Online Process Monitoring in Laser Beam Welding
3. Objectives and Approach
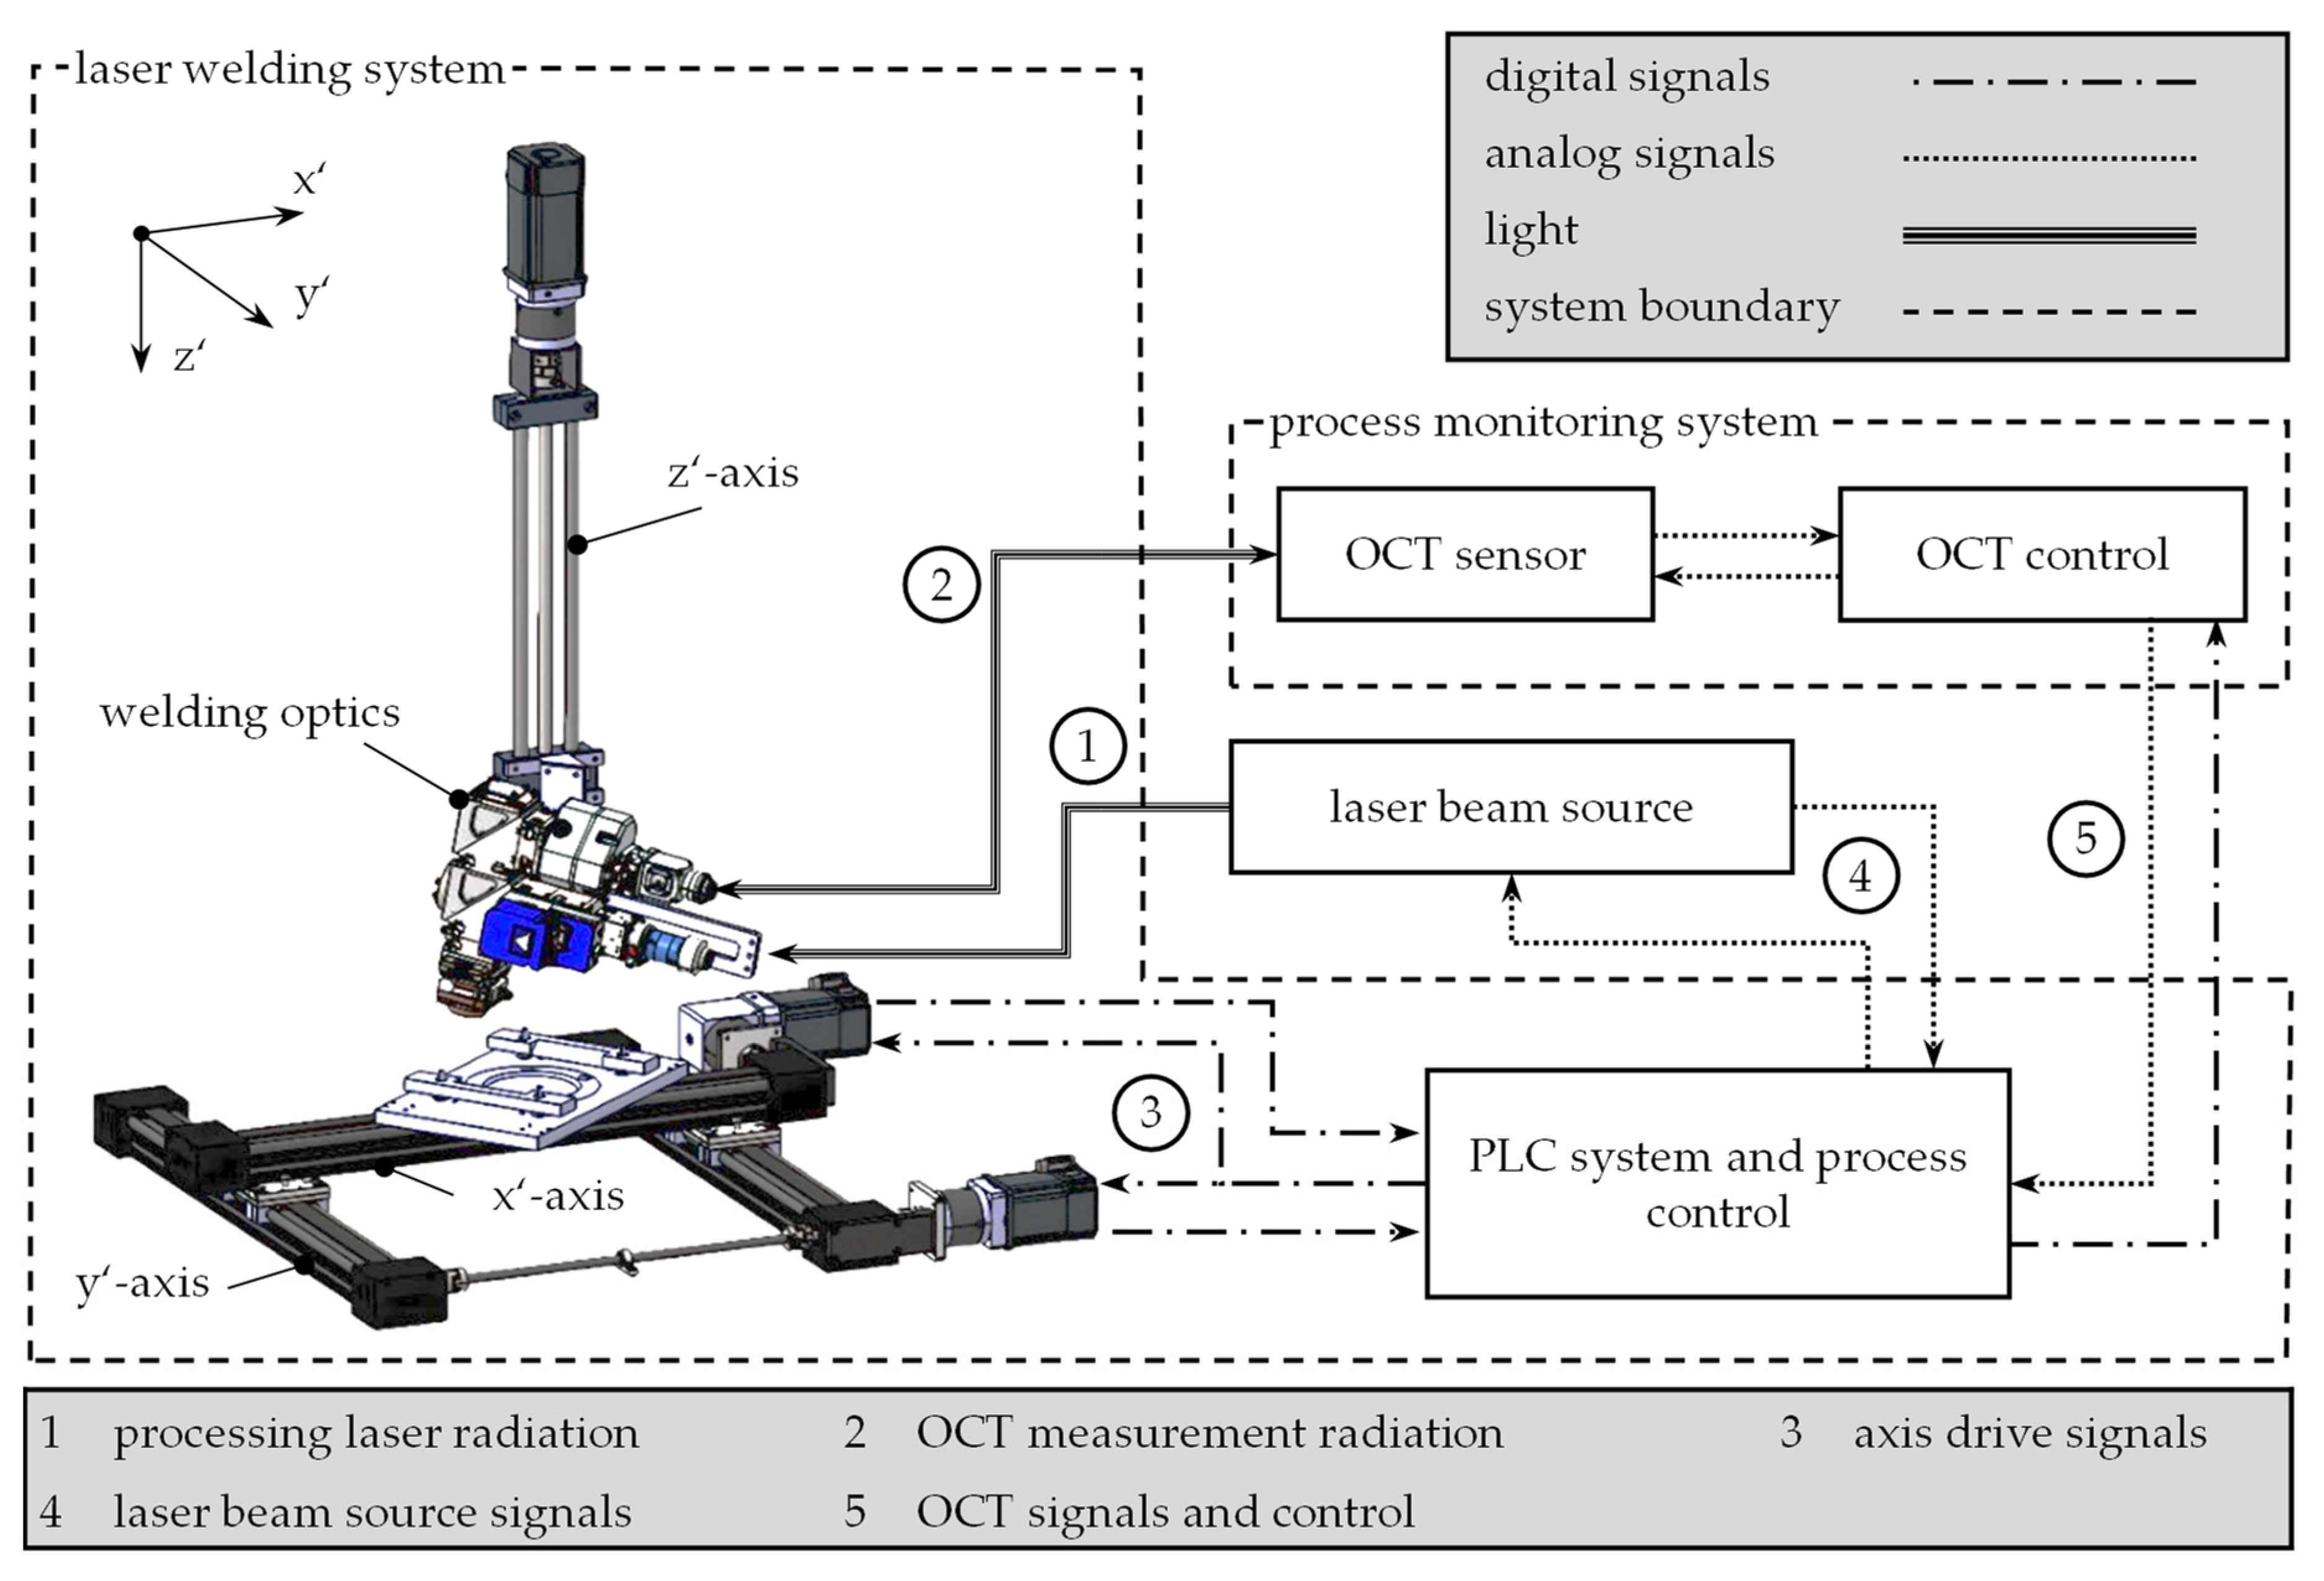
4. Materials and Experimental Set-Up
5. Methodology
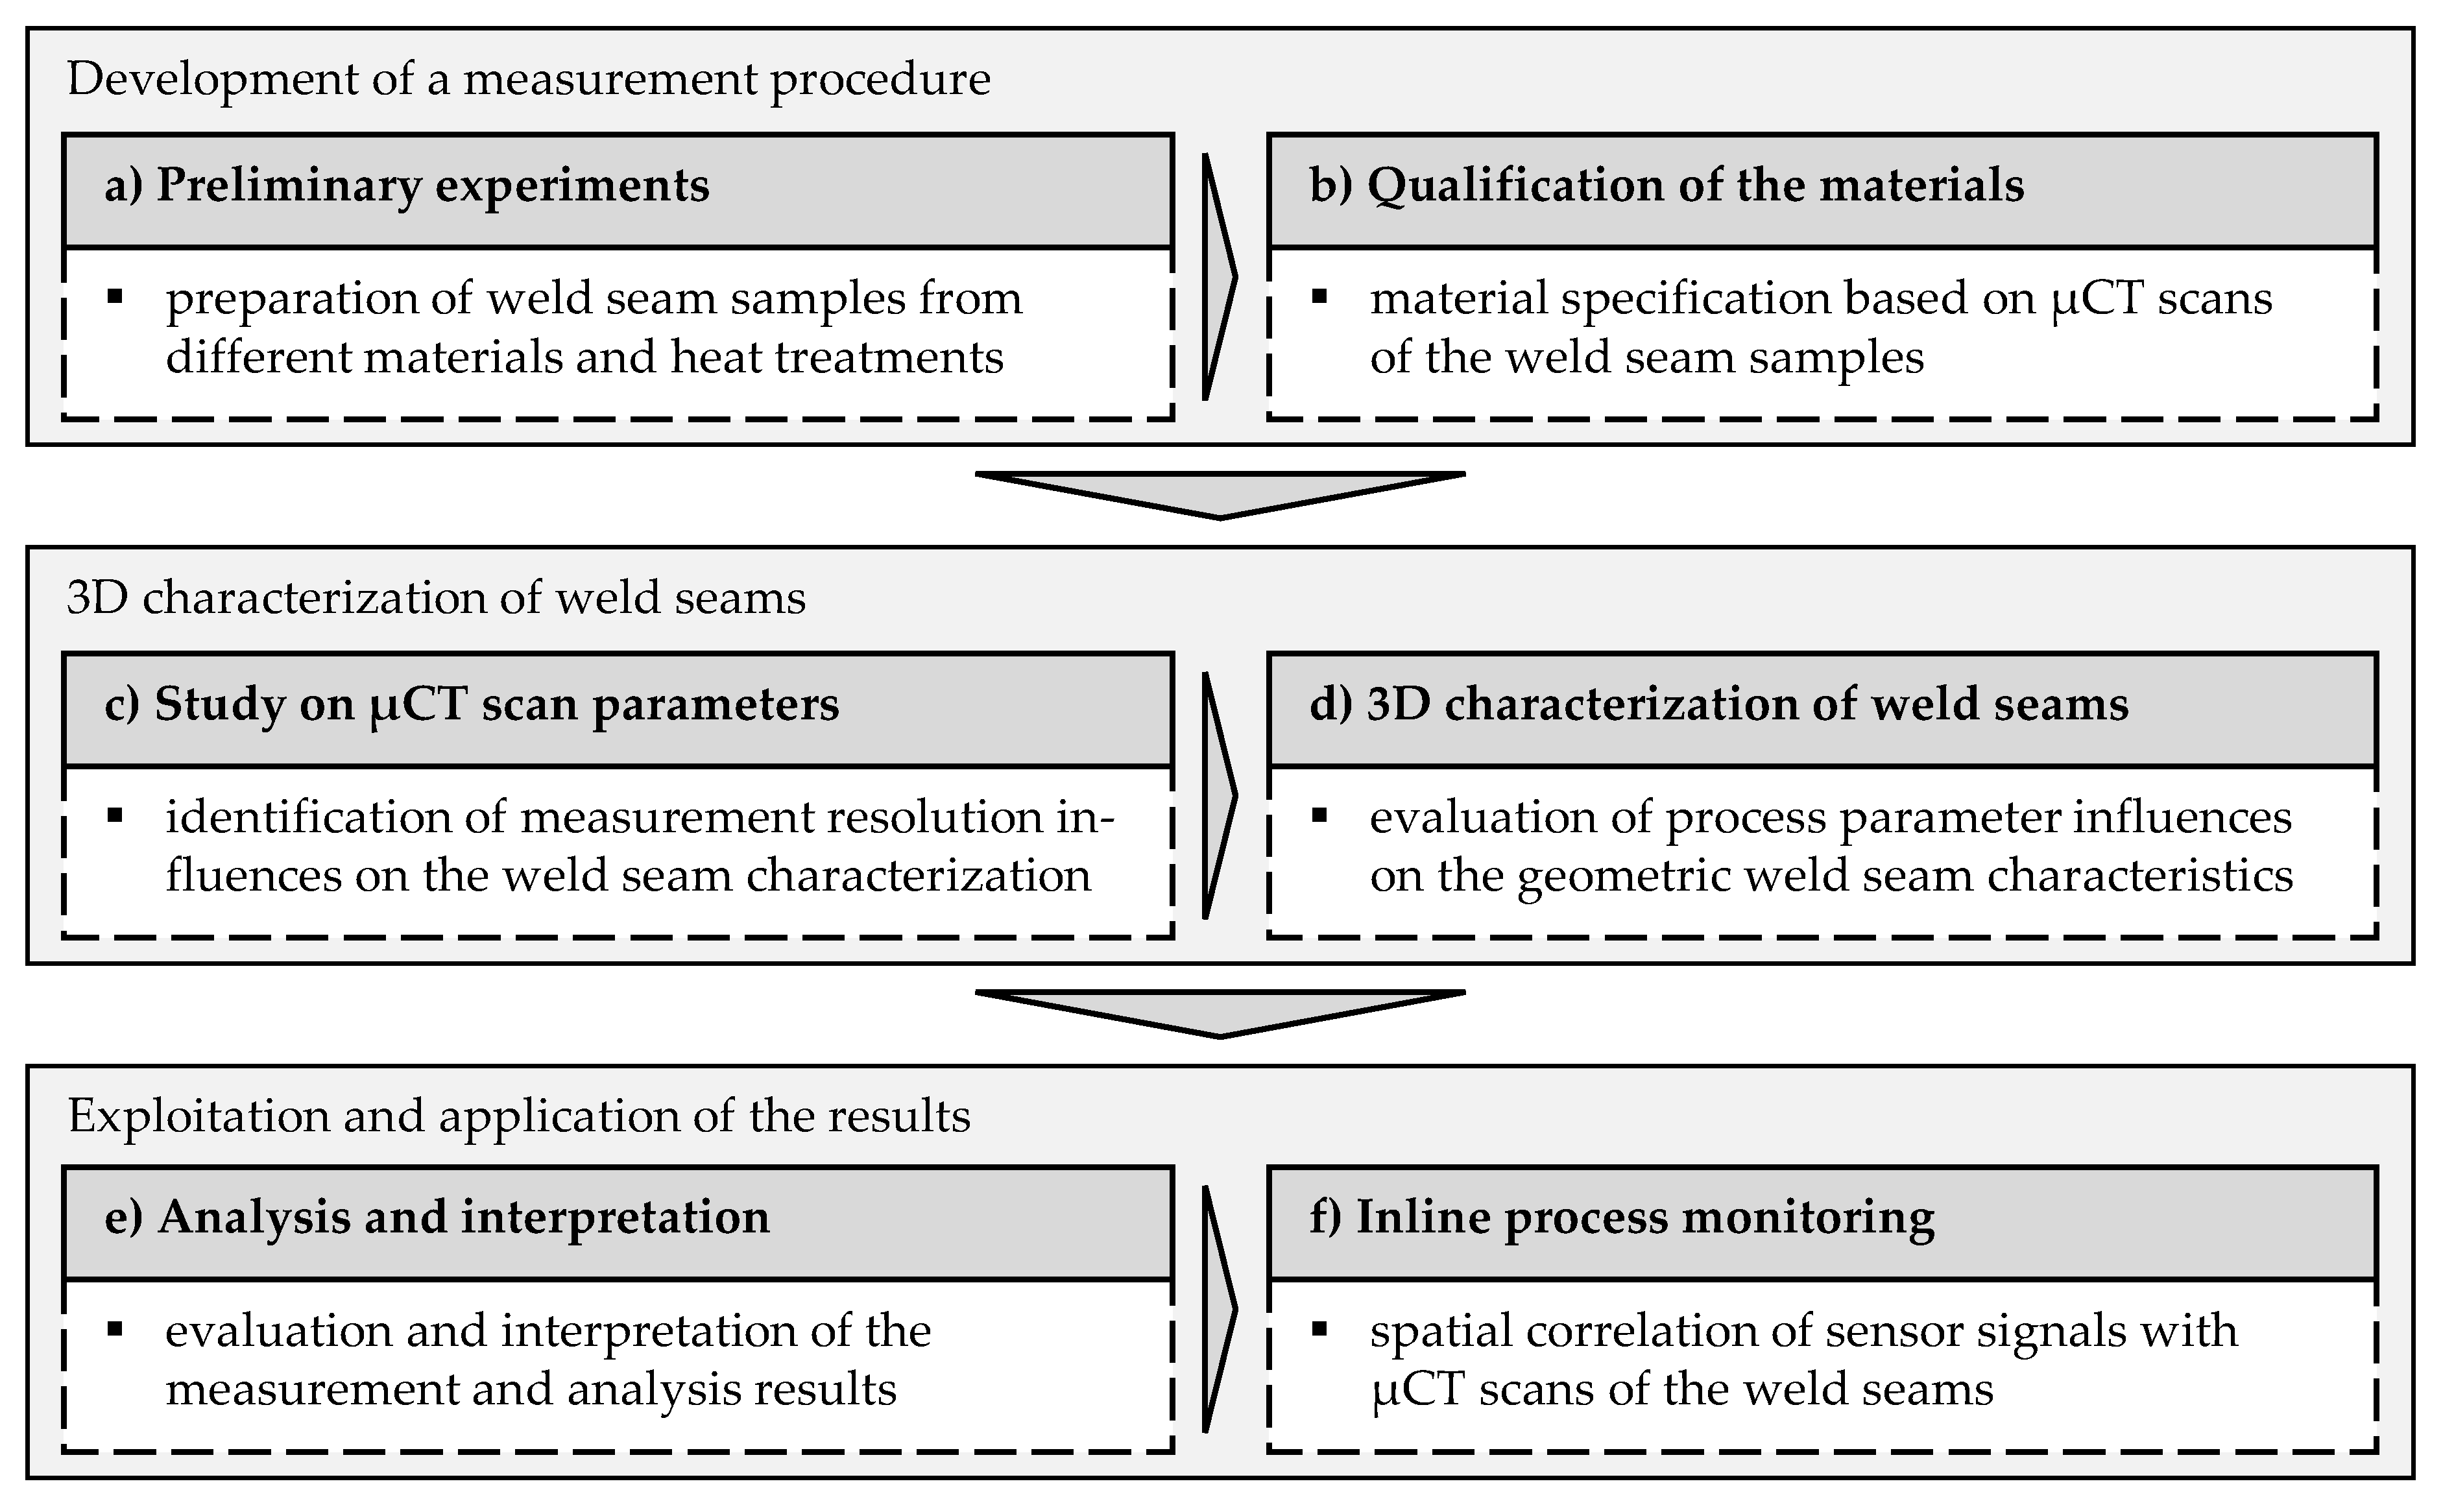
- (a)
- Preliminary experiments: In a preliminary experimental study, laser beam welding tests are carried out on various aluminum alloys without varying the welding parameters. The aim is to produce specimens for preliminary tests with µCT inspection.
- (b)
- Qualification of the materials: The µCT scans of the weld seam samples from the preliminary test series are evaluated and assessed with respect to their information content. For further investigations, the alloy AA 2219 is selected, allowing a comprehensive characterization of the geometric weld seam properties.
- (c)
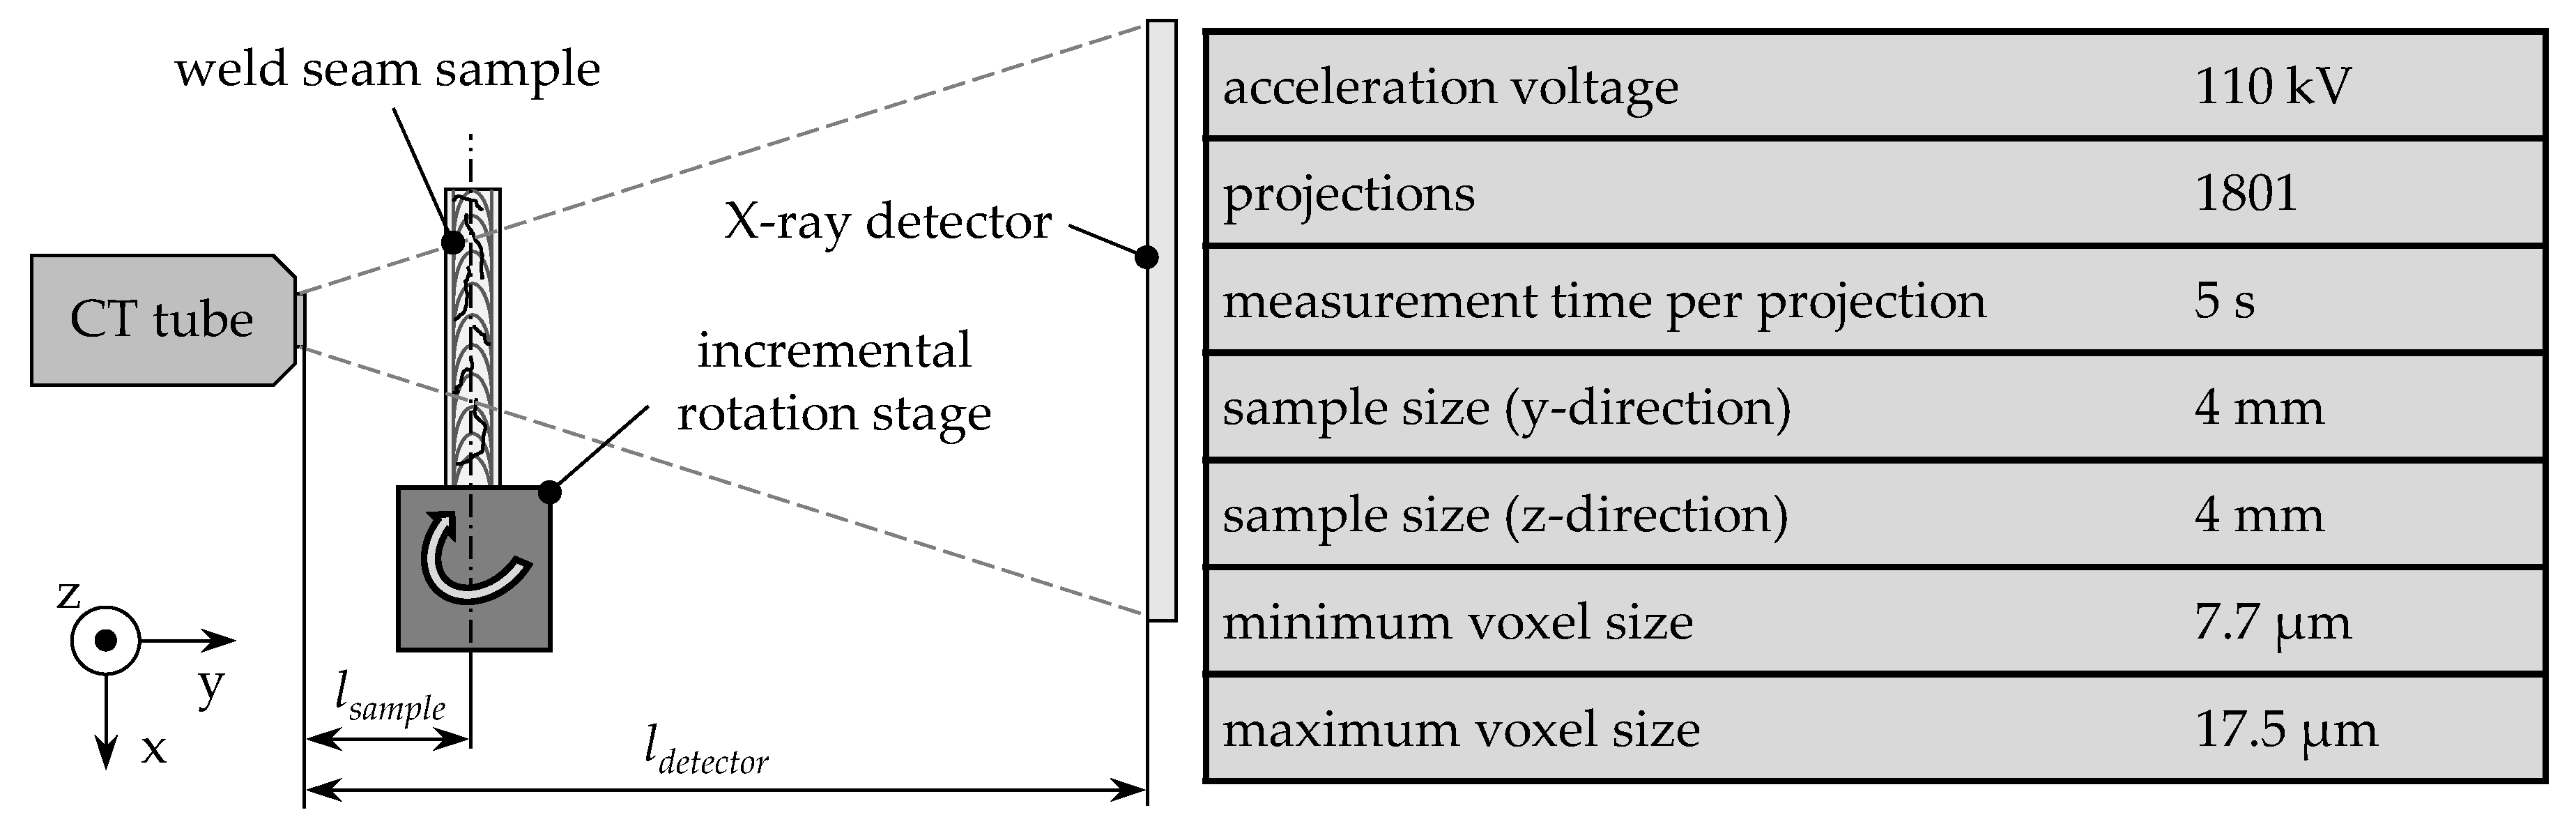
- Study on µCT scan parameters: In this step, an experimental study is carried out to evaluate the influence of the measurement parameters in µCT inspection on the quality of the resulting 3D images. The aim is to determine measurement parameters resulting in high contrast and detail quality of the images while maintaining the largest possible measurement volume.
- (d)
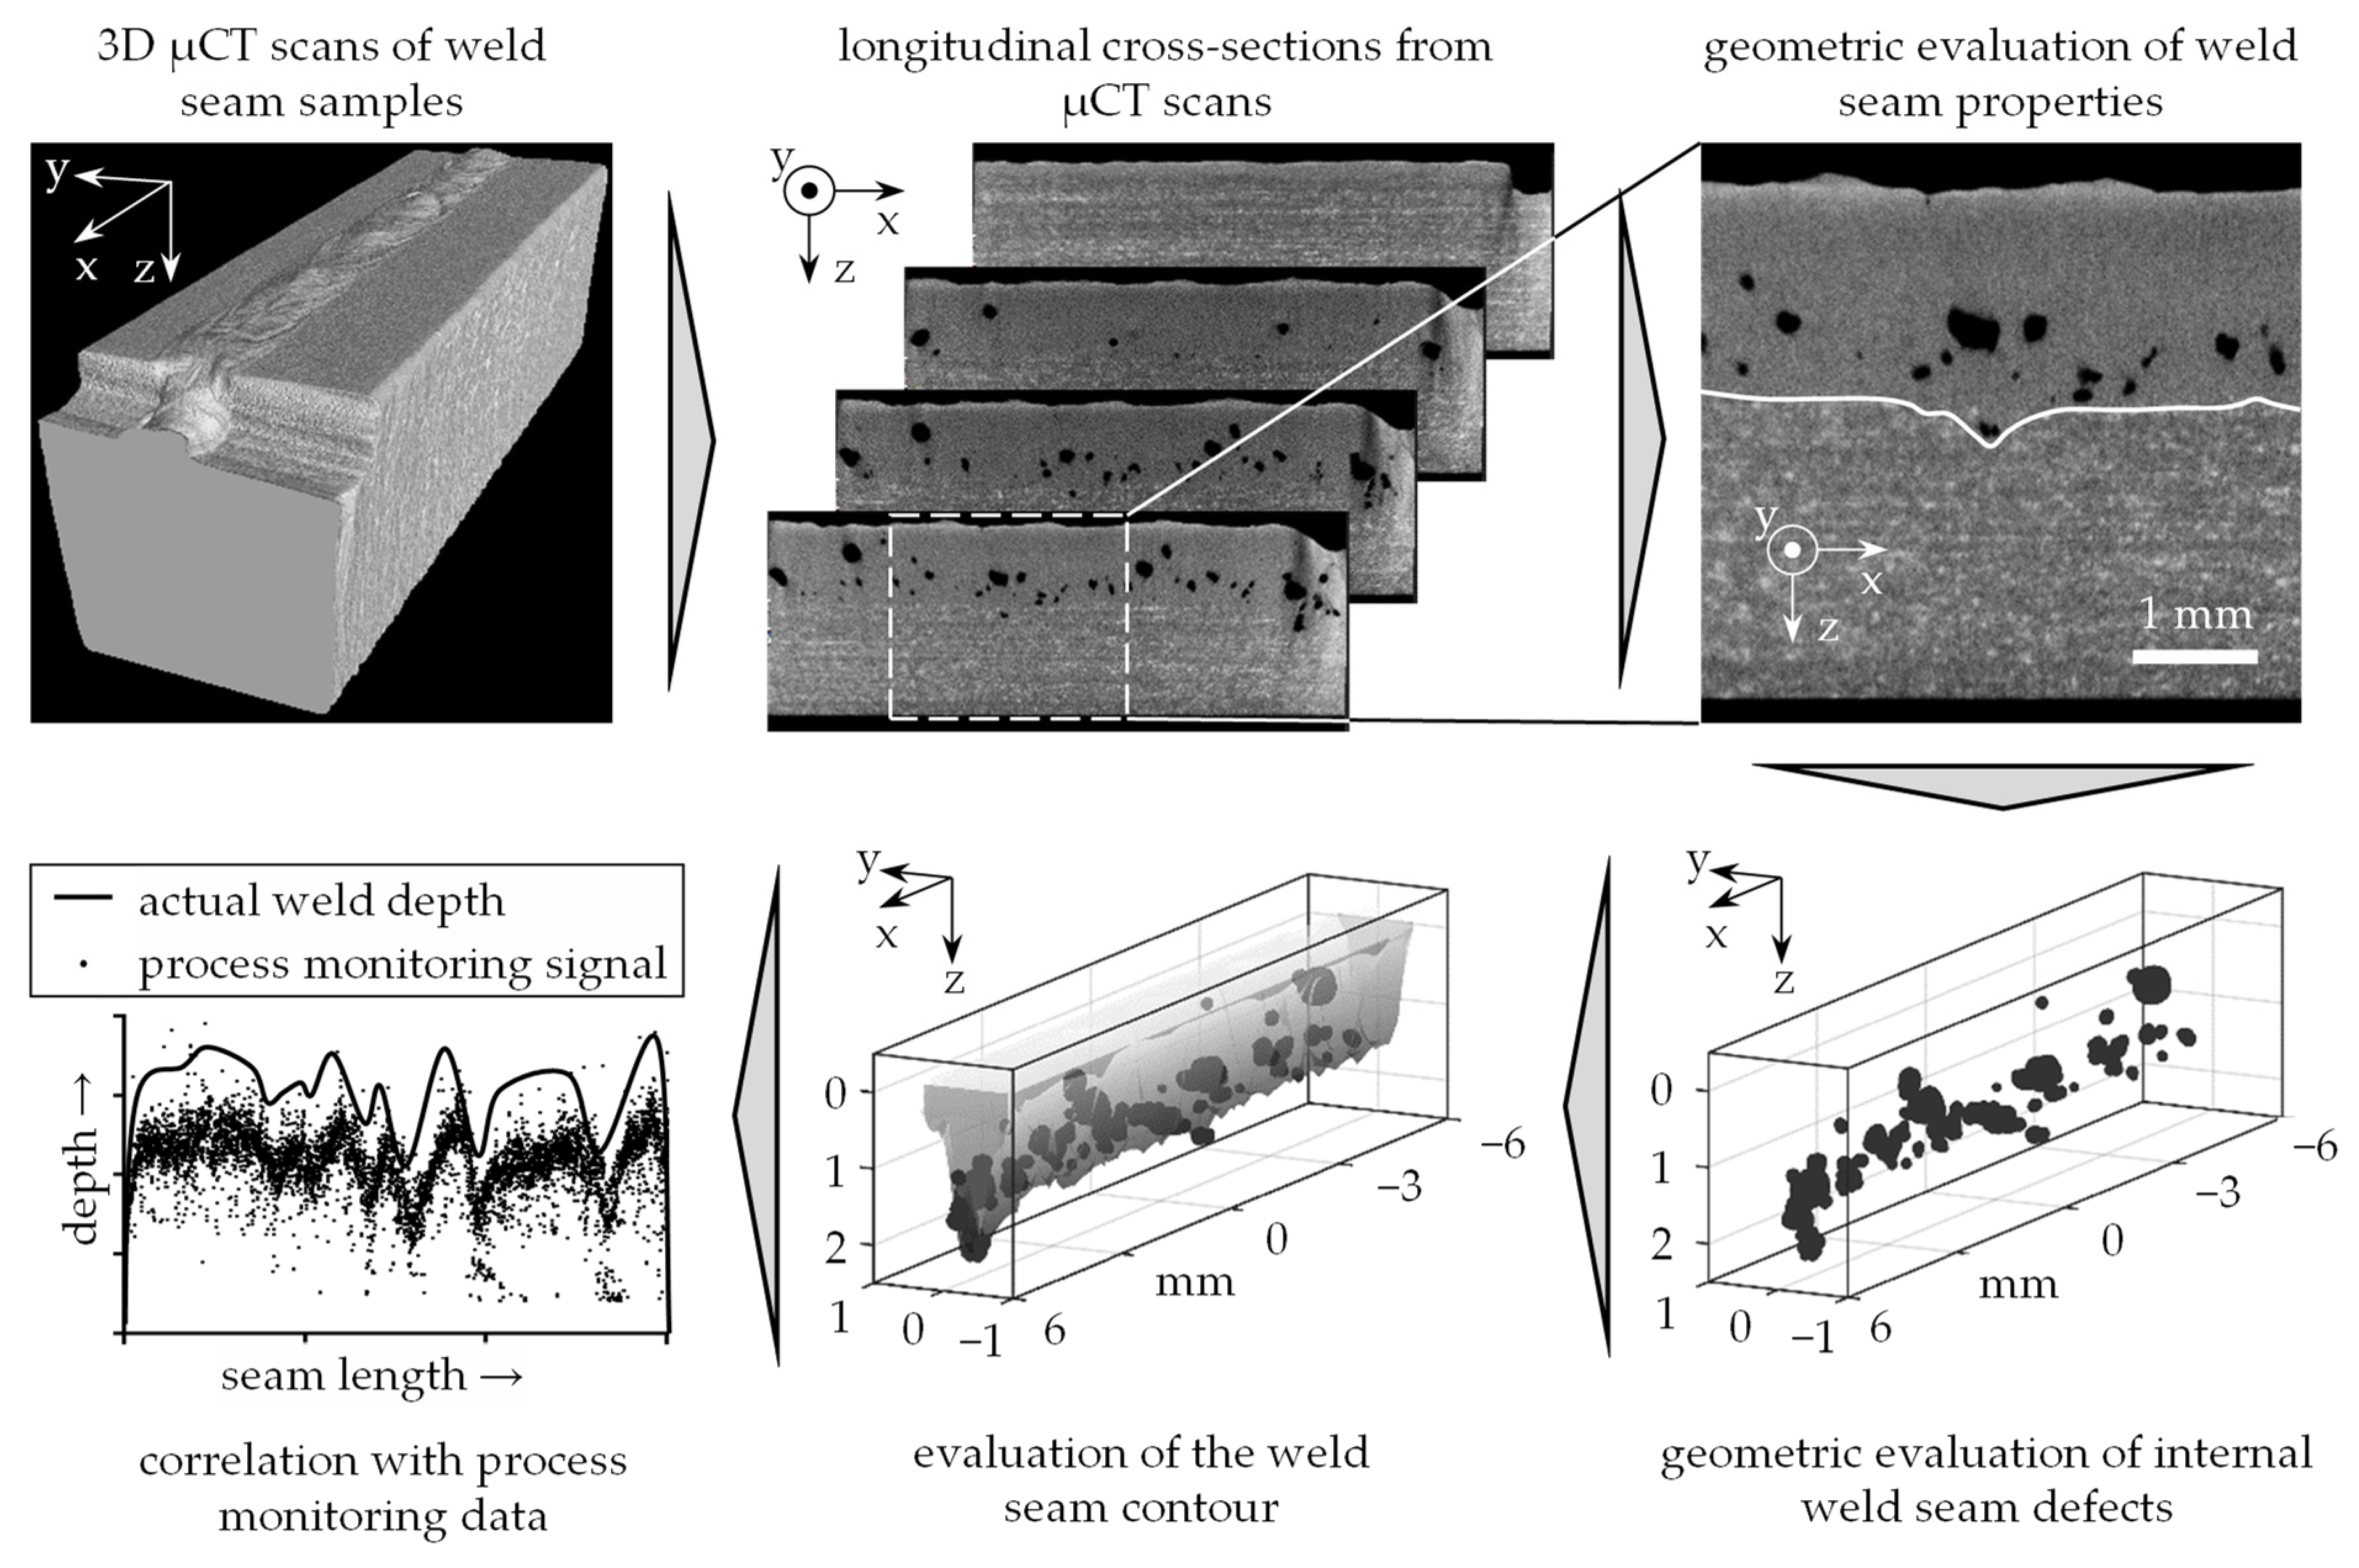
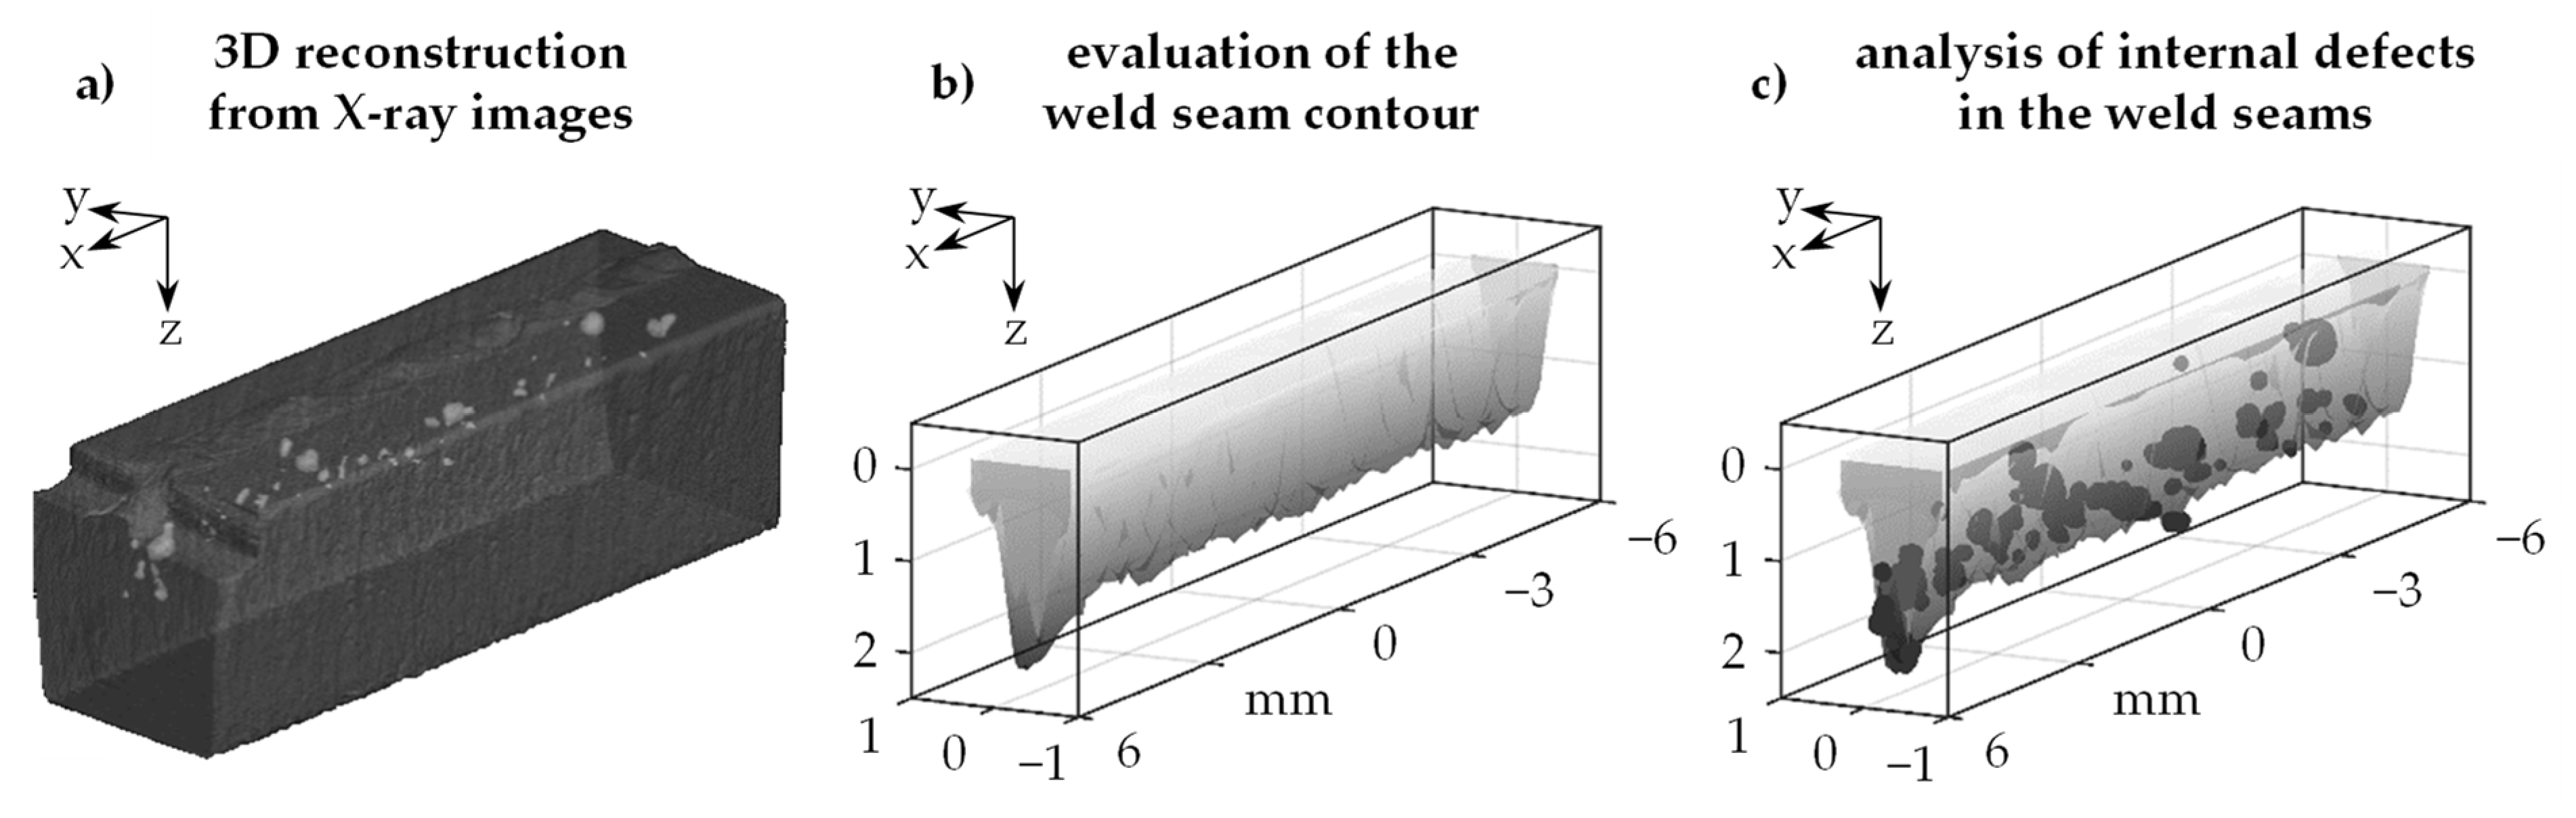
- 3D characterization of weld seams: Initially, weld seam samples are prepared following a full factorial experimental design. The samples are scanned using µCT with the previously defined measurement parameters. Based on the results of the measurements, the influences of the welding process parameters on the formation of the weld seam contour and on the occurrence of internal seam defects are investigated.
- (e)
- Analysis and interpretation: In this step, the individual result components are composed. For the first time, signal characteristics could be correlated with the real-time process parameters and weld seam defects, resulting in extensive information on the weld seam geometry. Extensive knowledge about the phenomena during the welding process can be gained from this.
- (f)
- Inline process monitoring: The findings gained from the analysis of the weld seams are compared with measurement signals from inline process monitoring systems. For this, the signals are correlated spatially with the µCT images and examined for distinct features. In addition, a method is developed which allows the entire data set to be decomposed into individual temporal elements to create an extensive database as a platform for Deep Learning approaches for the evaluation of measurement signals.
6. Experimental Results
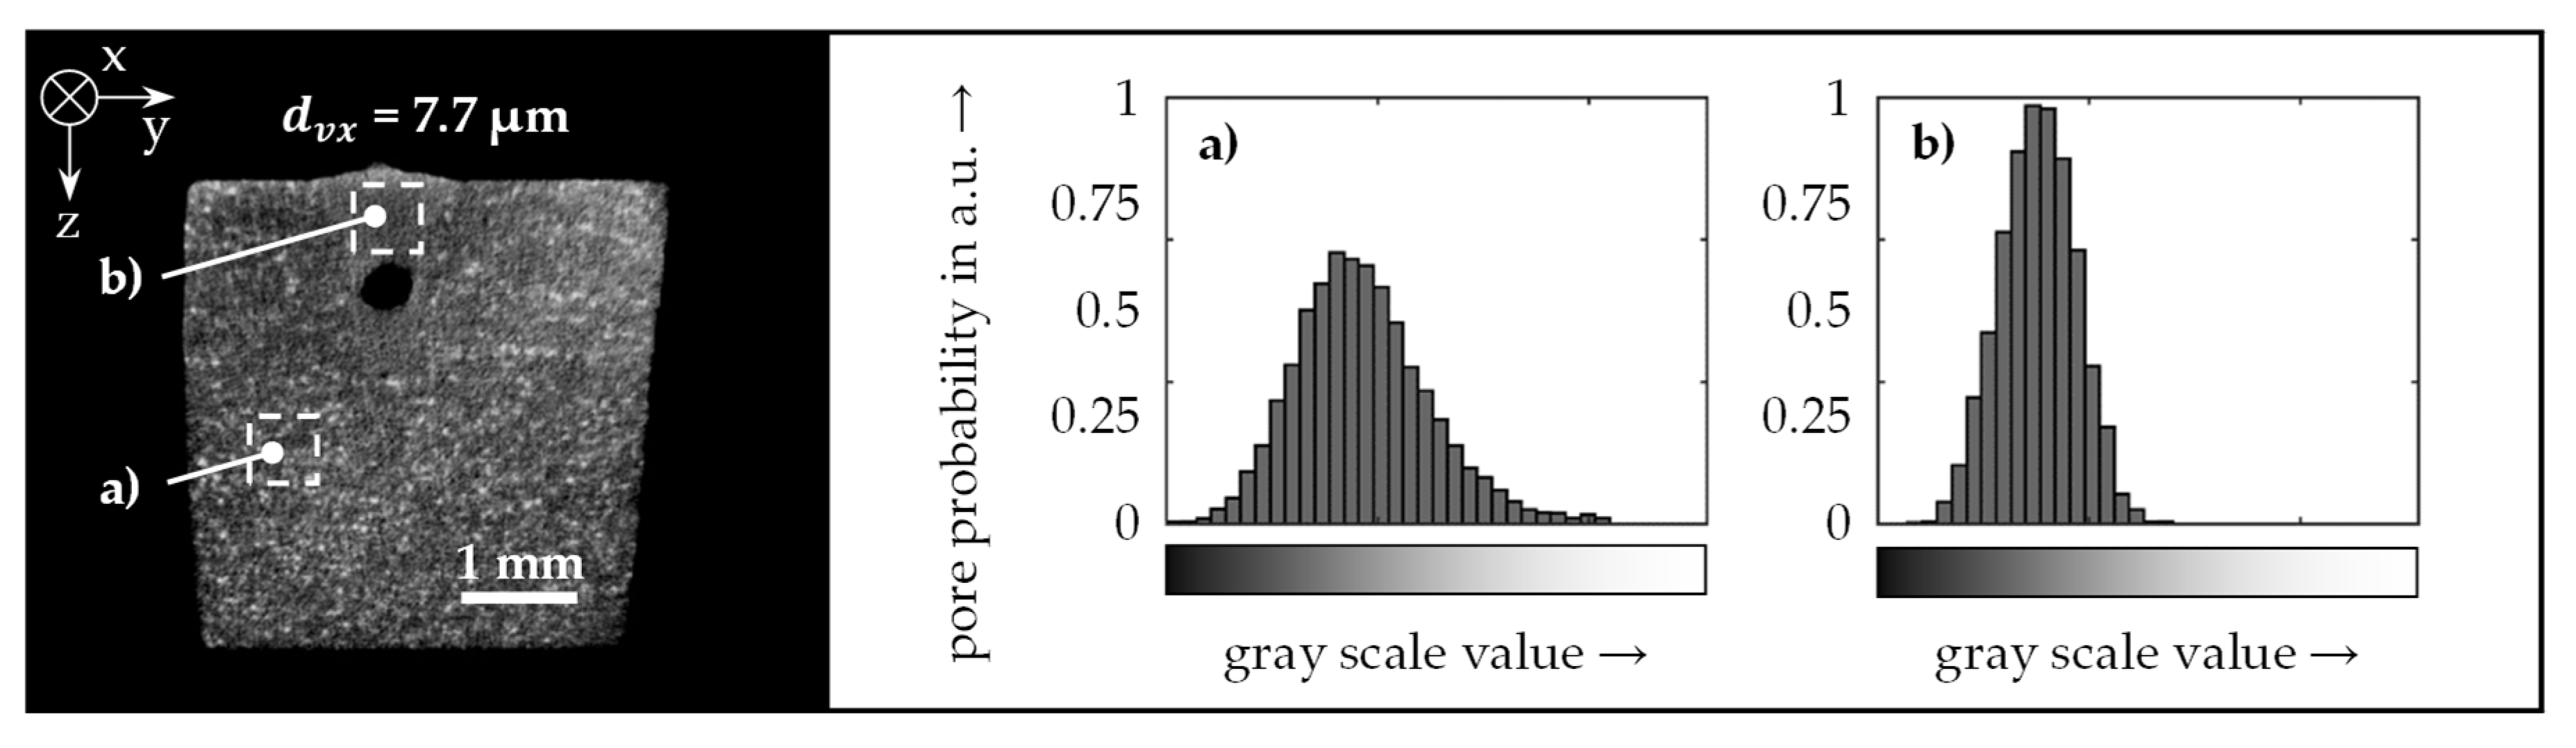
6.1. Influences of Process- and Measurement-Parameters on µCT Images
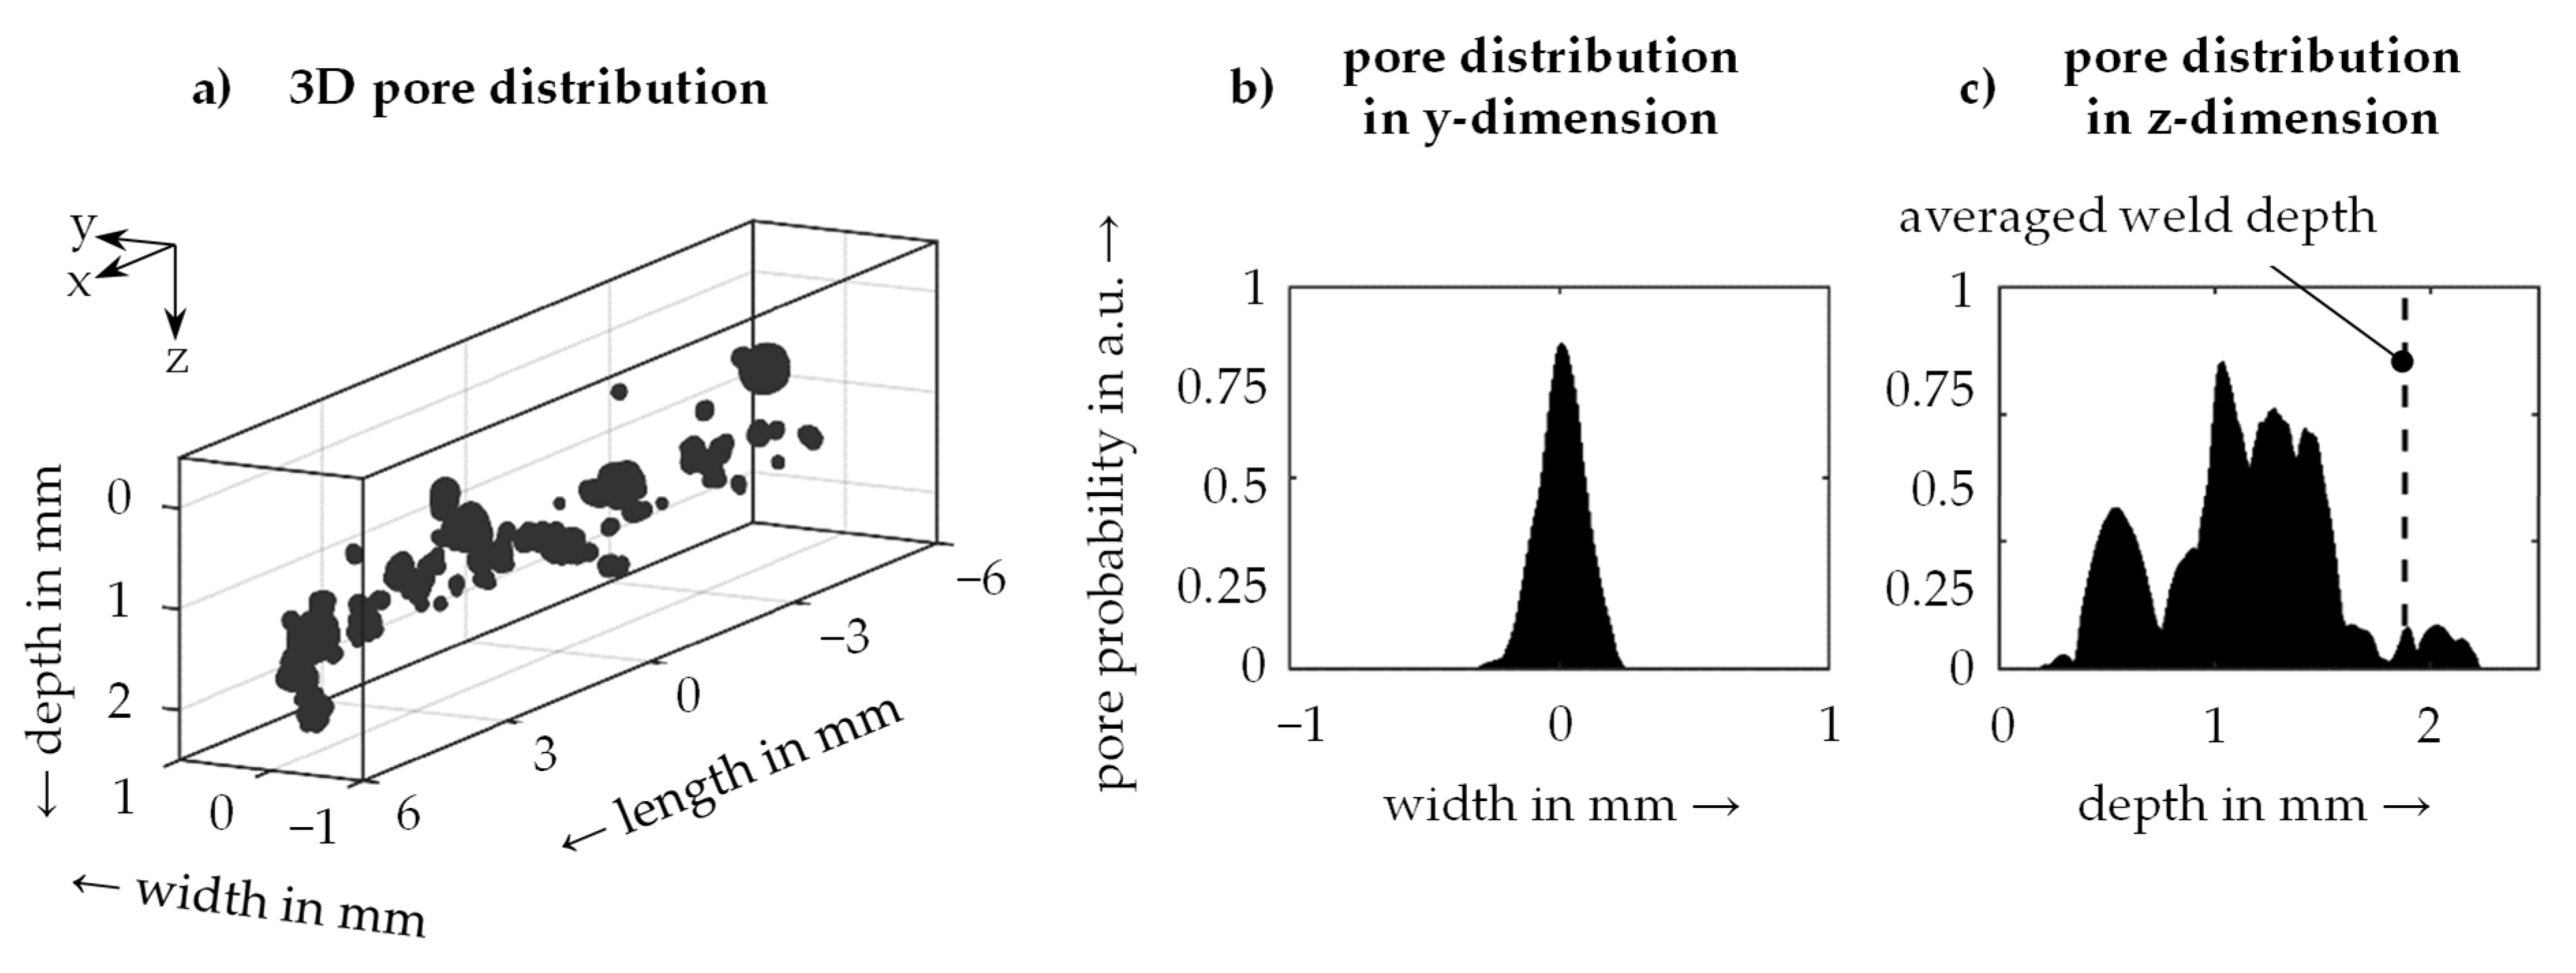
6.2. Analysis of Process Pores
6.3. Evaluation of the Weld Depth
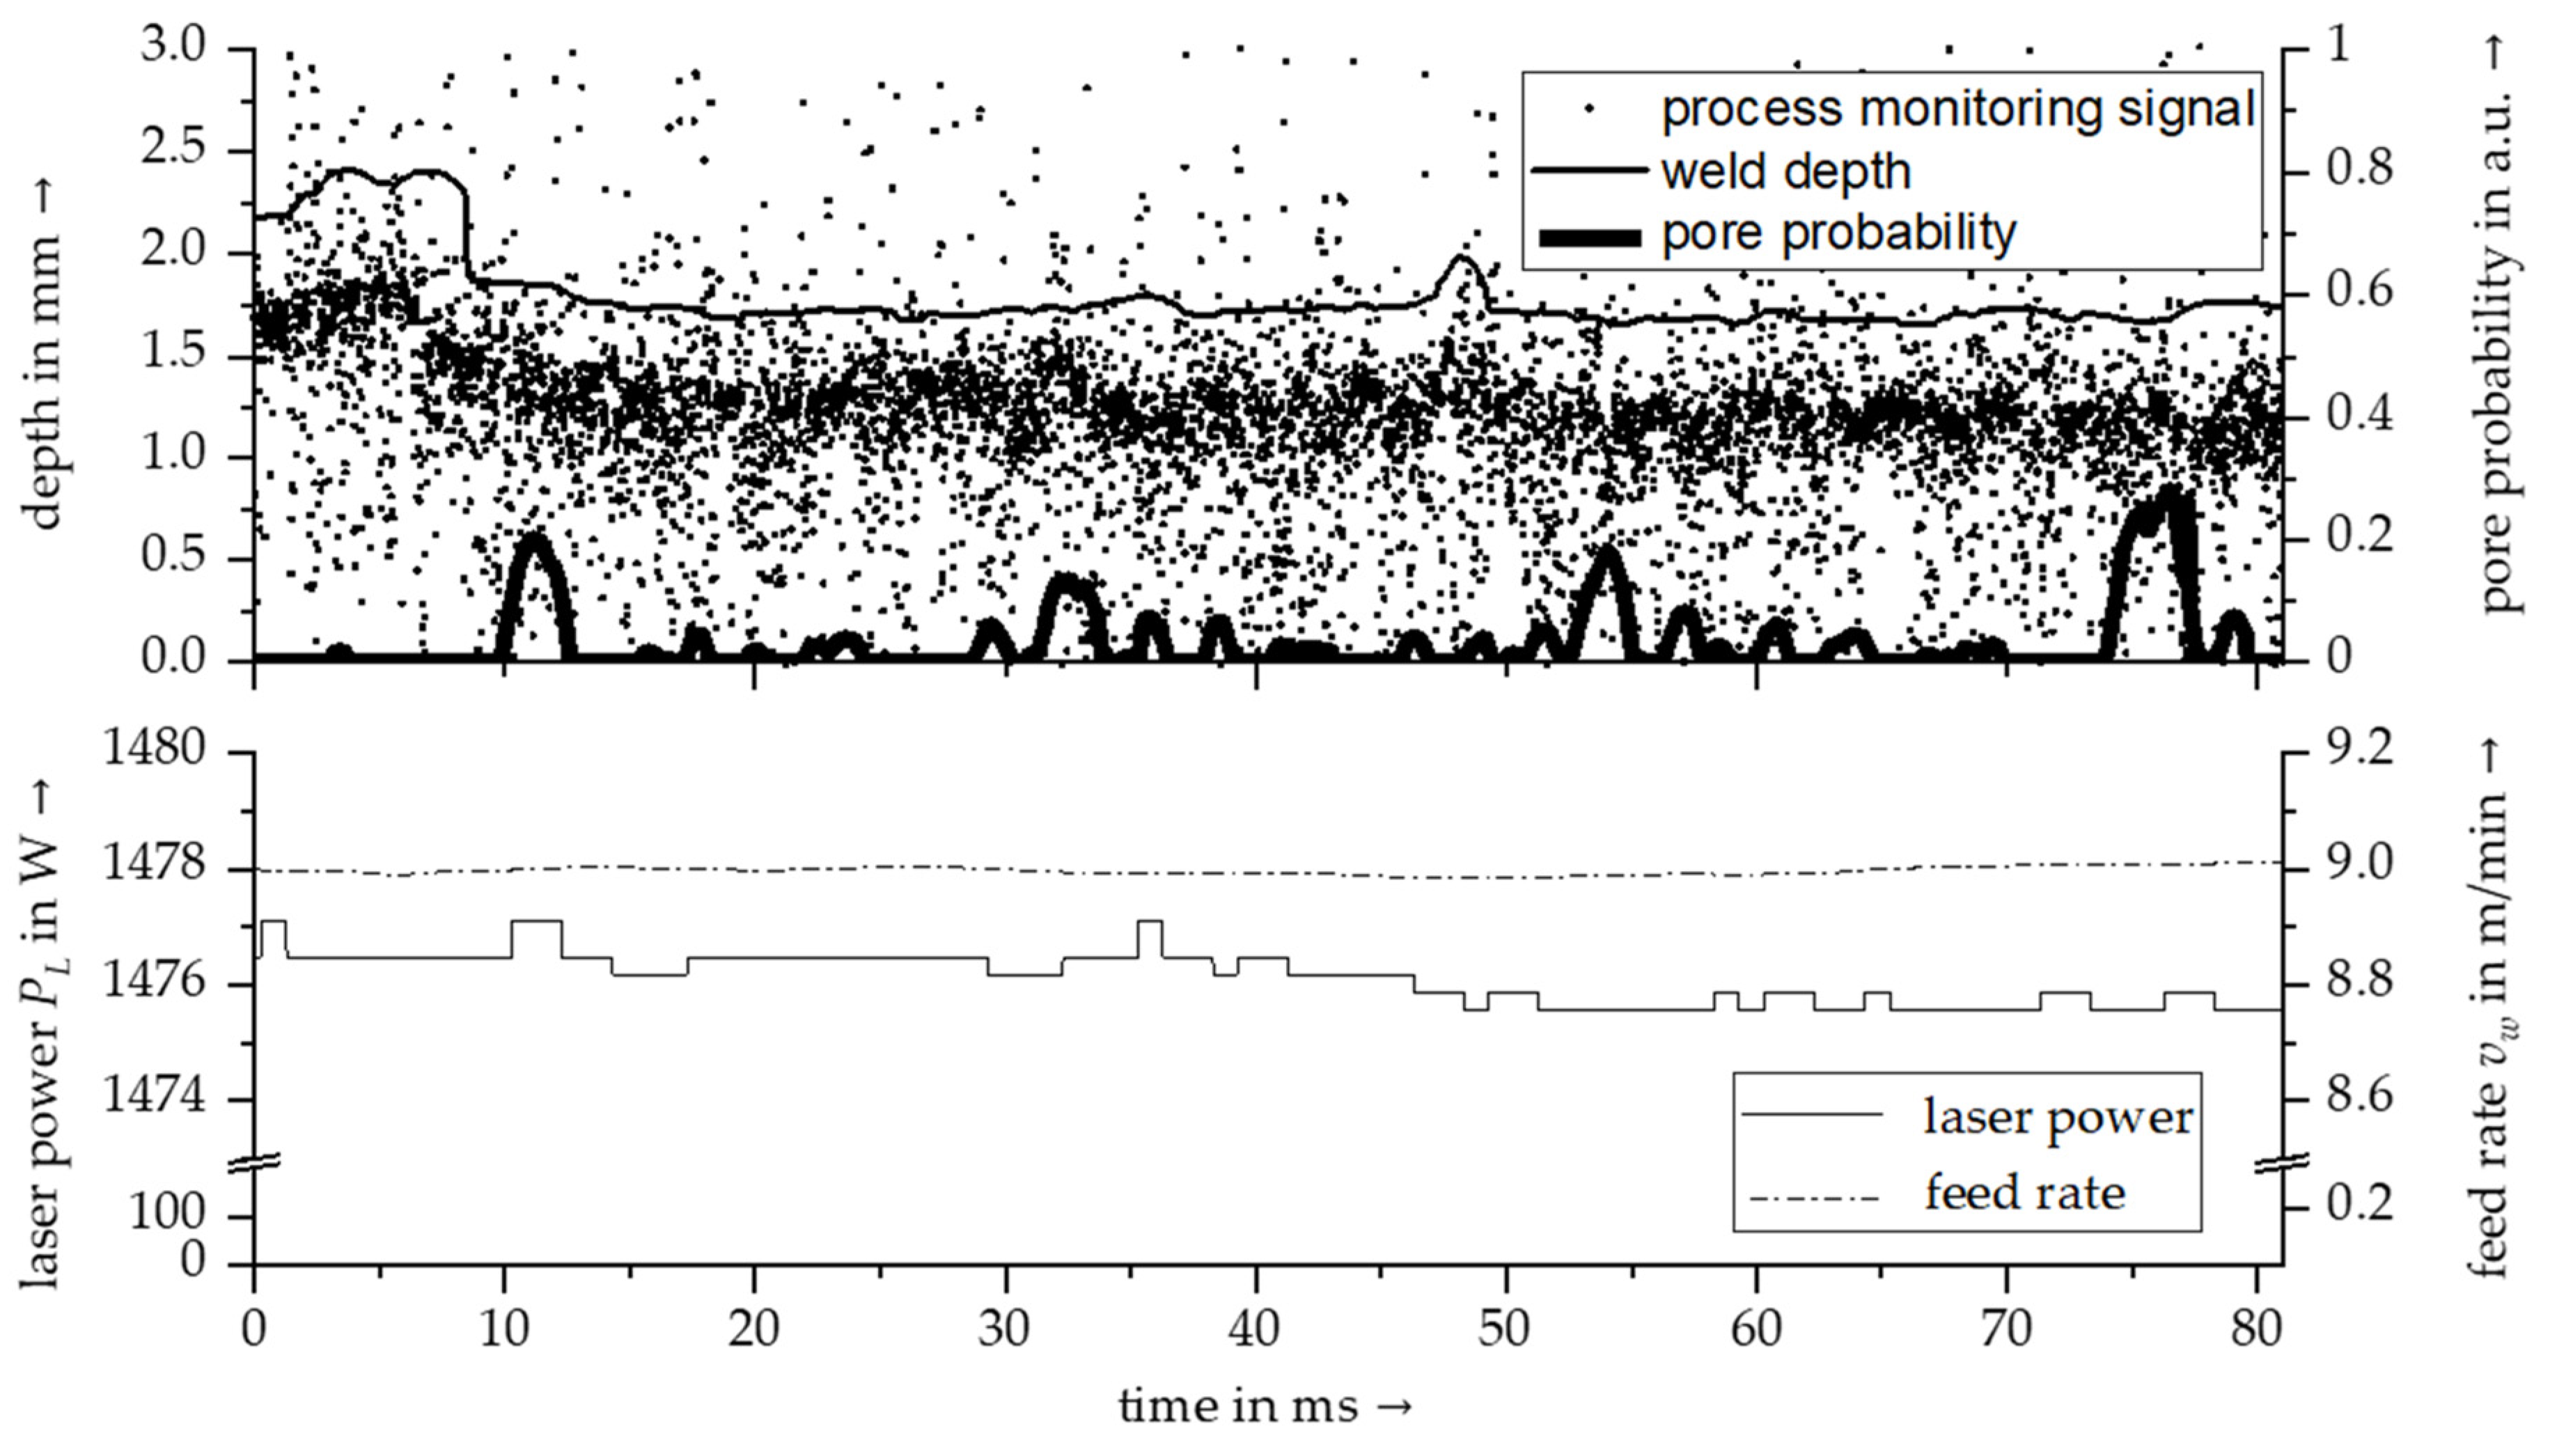
6.4. Correlation between µCT Images and Process Monitoring Sensor Signals
7. Conclusions and Outlook
Author Contributions
Funding
Institutional Review Board Statement
Informed Consent Statement
Acknowledgments
Conflicts of Interest
References
- Stavridis, J.; Papacharalampopoulos, A.; Stavropoulos, P. Quality assessment in laser welding: A critical review. Int. J. Adv. Manuf. Technol. 2018, 94, 1825–1847. [Google Scholar] [CrossRef]
- Purtonen, T.; Kalliosaari, A.; Salminen, A. Monitoring and Adaptive Control of Laser Processes. Phys. Procedia 2014, 56, 1218–1231. [Google Scholar] [CrossRef] [Green Version]
- LeCun, Y.; Bengio, Y.; Hinton, G. Deep learning. Nature 2015, 521, 436–444. [Google Scholar] [CrossRef] [PubMed]
- Li, B.; Shen, Y.; Hu, W. The study on defects in aluminum 2219-T6 thick butt friction stir welds with the application of multiple non-destructive testing methods. Mater. Des. 2011, 32, 2073–2084. [Google Scholar] [CrossRef]
- Liebl, S.; Stadter, C.; Ganser, A.; Zaeh, M.F. Numerical simulation of laser beam welding using an adapted intensity distribution. J. Laser Appl. 2017, 29, 22405. [Google Scholar] [CrossRef]
- Maev, R.G. Acoustic microscopy for materials characterization. In Materials Characterization Using Nondestructive Evaluation (NDE) Methods; Elsevie: Duxford, UK, 2016; pp. 161–175. ISBN 978-0-08-100040-3. [Google Scholar]
- Zhang, H. Application Research on Ultrasonic Phased Array Technology in Weld Seam Inspection. J. Phys. Conf. Ser. 2020, 1601, 42041. [Google Scholar] [CrossRef]
- Vicente, M.A.; González, D.C.; Mínguez, J. Recent advances in the use of computed tomography in concrete technology and other engineering fields. Micron 2019, 118, 22–34. [Google Scholar] [CrossRef]
- Chiffre, L.; Carmignato, S.; Kruth, J.P.; Schmitt, R.; Weckenmann, A. Industrial applications of computed tomography. CIRP Ann. 2014, 63, 655–677. [Google Scholar] [CrossRef]
- Moura, A.E.; Dantas, C.C.; Nery, M.S.; Barbosa, J.M.; Rolim, T.L.; Lima, E.; Melo, S.B.; Dos Santos, V.A. Non-destructive evaluation of weld discontinuity in steel tubes by gamma ray CT. Nucl. Instrum. Methods Phys. Res. Sect. B Beam Interact. Mater. At. 2015, 349, 155–162. [Google Scholar] [CrossRef]
- Palha, R.N.; Barros, P.S.; Yadava, Y.P.; Dantas, C.C.; Ferreira, R.A.S. Quantification of Discontinuities in Welded Joints Using Gamma Tomography. Mater. Res. 2019, 22. [Google Scholar] [CrossRef] [Green Version]
- Myrach, P.; Jonietz, F.; Meinel, D.; Suwala, H.; Ziegler, M. Calibration of thermographic spot weld testing with X-ray computed tomography. Quant. InfraRed Thermogr. J. 2017, 14, 122–131. [Google Scholar] [CrossRef]
- An, X.; Brambilla, M.; Dobson, A.; Francois, O. An Application of Computed Tomography Inspection on Butt Weld of Super Duplex Umbilical Tube. In Proceedings of the OTC, Offshore Technology Conference, Houston, TX, USA, 4–7 May 2015. [Google Scholar]
- Hamade, R.F.; Baydoun, A.M.R. Nondestructive detection of defects in friction stir welded lap joints using computed tomography. Mater. Des. 2019, 162, 10–23. [Google Scholar] [CrossRef]
- Earl, S.; Rankin, K.E.; Lewis, R.; Smith, L.; Rainforth, W.M. Verification of the use of Micro-CT scanning to assess the features of entire squat type defects. Wear 2019, 438–439, 203074. [Google Scholar] [CrossRef]
- Bakker, A.J.; Wu, X.; Katgerman, L.; van der Zwaag, S. Microstructural and X-ray tomographic analysis of damage in extruded aluminium weld seams. Mater. Sci. Technol. 2015, 31, 94–104. [Google Scholar] [CrossRef]
- Schaff, F.; Bachmann, A.; Zens, A.; Zaeh, M.F.; Pfeiffer, F.; Herzen, J. Grating-based X-ray dark-field computed tomography for the characterization of friction stir welds: A feasibility study. Mater. Charact. 2017, 129, 143–148. [Google Scholar] [CrossRef]
- Jin, Z.; Li, H.; Li, R.; Sun, Y.; Gao, H. 3D reconstruction of GMAW pool surface using composite sensor technology. Measurement 2019, 133, 508–521. [Google Scholar] [CrossRef]
- Xiong, J.; Liu, Y.; Yin, Z. Passive vision measurement for robust reconstruction of molten pool in wire and arc additive manufacturing. Measurement 2020, 153, 107407. [Google Scholar] [CrossRef]
- Stadter, C.; Schmoeller, M.; Zeitler, M.; Tueretkan, V.; Munzert, U.; Zaeh, M.F. Process control and quality assurance in remote laser beam welding by optical coherence tomography. J. Laser Appl. 2019, 31, 22408. [Google Scholar] [CrossRef]
- Schmoeller, M.; Stadter, C.; Liebl, S.; Zaeh, M.F. Inline weld depth measurement for high brilliance laser beam sources using optical coherence tomography. J. Laser Appl. 2019, 31, 22409. [Google Scholar] [CrossRef]
- Stadter, C.; Schmoeller, M.; Rhein, L.; Zaeh, M.F. Real-time prediction of quality characteristics in laser beam welding using optical coherence tomography and machine learning. J. Laser Appl. 2020, 32, 22046. [Google Scholar] [CrossRef]
- Stritt, P.; Boley, M.; Heider, A.; Fetzer, F.; Jarwitz, M.; Weller, D.; Weber, R.; Berger, P.; Graf, T. Comprehensive process monitoring for laser welding process optimization. In High-Power Laser Materials Processing: Lasers, Beam Delivery, Diagnostics, and Applications V; Dorsch, F., Kaierle, S., Eds.; SPIE LASE: San Francisco, CA, USA, 2016. [Google Scholar]
- Schmoeller, M.; Stadter, C.; Wagner, M.; Zaeh, M.F. Investigation of the influences of the process parameters on the weld depth in laser beam welding of AA6082 using machine learning methods. Procedia CIRP 2020, 94, 702–707. [Google Scholar] [CrossRef]
- Löveborn, D.; Larsson, J.K.; Persson, K.A. Weldability of Aluminium Alloys for Automotive Applications. Phys. Procedia 2017, 89, 89–99. [Google Scholar] [CrossRef]
- Schmoeller, M.; Neureiter, M.; Stadter, C.; Zaeh, M.F. Numerical weld pool simulation for the accuracy improvement of inline weld depth measurement based on optical coherence tomography. J. Laser Appl. 2020, 32, 22036. [Google Scholar] [CrossRef]
- Stadter, C.; Kick, M.K.; Schmoeller, M.; Zaeh, M.F. Correlation analysis between the beam propagation and the vapor capillary geometry by machine learning. Procedia CIRP 2020, 94, 742–747. [Google Scholar] [CrossRef]


| Alloy | Heat Treatment | Alloying Elements (Percent by Weight) |
|---|---|---|
| AA 2219 | T87 | Cu 6.3; Mn 0.3; Ti 0.06; V 0.1; Zr 0.18 |
| EN AW-5083 | — | Mg 4.4; Mn 0.7; Cr 0.15 |
| EN AW-5083 | artificially aged 1 | Mg 4.4; Mn 0.7; Cr 0.15 |
| EN AW-6060 | — | Si 0.4; Mg 0.5; Fe 0.2 |
| EN AW-6082 | — | Si 1.0; Mg 0.85; Mn 0.65 |
| Resolution | Voxels | Dimensions |
|---|---|---|
| 7.7 µm | 700 × 700 × 1600 | 5.39 × 5.39 × 12.32 mm³ |
| 10.0 µm | 600 × 600 × 1600 | 6.00 × 6.00 × 16.00 mm³ |
| 15.0 µm | 400 × 400 × 1700 | 6.00 × 6.00 × 25.50 mm³ |
| 17.0 µm | 320 × 320 × 800 | 5.44 × 5.44 × 13.60 mm³ |
Publisher’s Note: MDPI stays neutral with regard to jurisdictional claims in published maps and institutional affiliations. |
© 2021 by the authors. Licensee MDPI, Basel, Switzerland. This article is an open access article distributed under the terms and conditions of the Creative Commons Attribution (CC BY) license (https://creativecommons.org/licenses/by/4.0/).
Share and Cite
Schmoeller, M.; Stadter, C.; Kick, M.K.; Geiger, C.; Zaeh, M.F. A Novel Approach to the Holistic 3D Characterization of Weld Seams—Paving the Way for Deep Learning-Based Process Monitoring. Materials 2021, 14, 6928. https://doi.org/10.3390/ma14226928
Schmoeller M, Stadter C, Kick MK, Geiger C, Zaeh MF. A Novel Approach to the Holistic 3D Characterization of Weld Seams—Paving the Way for Deep Learning-Based Process Monitoring. Materials. 2021; 14(22):6928. https://doi.org/10.3390/ma14226928
Chicago/Turabian StyleSchmoeller, Maximilian, Christian Stadter, Michael Karl Kick, Christian Geiger, and Michael Friedrich Zaeh. 2021. "A Novel Approach to the Holistic 3D Characterization of Weld Seams—Paving the Way for Deep Learning-Based Process Monitoring" Materials 14, no. 22: 6928. https://doi.org/10.3390/ma14226928
APA StyleSchmoeller, M., Stadter, C., Kick, M. K., Geiger, C., & Zaeh, M. F. (2021). A Novel Approach to the Holistic 3D Characterization of Weld Seams—Paving the Way for Deep Learning-Based Process Monitoring. Materials, 14(22), 6928. https://doi.org/10.3390/ma14226928