Article

Electrochemical Study of Clean and Pre-Corroded Reinforcements Embedded in Mortar Samples with Variable Amounts of Chloride Ions

by
María de las Nieves González
1,
María Isabel Prieto
1,*,
Alfonso Cobo
1 and
Fernando Israel Olmedo
2
1
Escuela Técnica Superior de Edificación, Universidad Politécnica de Madrid, Avda. Ramiro de Maeztu, 7, 28040 Madrid, Spain
2
Valladares Ingeniería S.L, C/Julián Camarillo, 42, 28037 Madrid, Spain
*
Author to whom correspondence should be addressed.
Materials 2021, 14(22), 6883; https://doi.org/10.3390/ma14226883
Submission received: 2 October 2021 / Revised: 11 November 2021 / Accepted: 12 November 2021 / Published: 15 November 2021

Abstract

:
The present study investigates the possibility of re-surfacing previously corroded reinforcements and the suitability of the two electrochemical techniques that are widely used to determine the state of corrosion of steel (the corrosion potential Ecorr and the corrosion rate icorr). In order to test this, 32 pre-corroded B500SD reinforcing steel bars have been used for one year, where half of the bars have been cleaned to eliminate corrosion products. The other half have been maintained with the generated corrosion products. Subsequently, the bars have been embedded in cement mortar samples with variable amounts of chloride ion, and Ecorr and icorr have been measured for 250 days. The results showed that it is not possible to rework the reinforcement without removing corrosion products and that it is not possible to predict the passive or active state of steel by measuring Ecorr only.

1. Introduction

Reinforcement corrosion is accepted as the main cause of the reduction in the service life of reinforced concrete structures (RCSs) [1,2,3]. The enormous economic impact of this problem, due to the direct and indirect costs involved, has led to a vast development of new technologies and materials with the purpose of increasing the durability of RCSs [4,5,6,7]. In the USA, direct costs due to corrosion of RCSs infrastructure are estimated at 0.25% of GNP, which corresponds to USD 16.6 billion per year [8].
The steel reinforcements embedded in the RCS are in a passive state that are protected against corrosion. This protection is due to the existence of a passive layer formed at the steel/concrete interface, which is self-healing and very thin around 10 nm [9]. Its formation and stability are guaranteed by the high alkalinity of the concrete, usually between the range of pH 13–14, and by the existence of an appropriate electrochemical potential [10].
The loss of the passivity of the RCS reinforcement is due, in most cases, to the following factors: the presence of despassivating ions, essentially chlorides, in sufficient quantity to locally break up the passivating layers [11]; or the decrease in the pH of the concrete, due to the effect of the CO2 present in the atmosphere [12,13,14]. In addition to the triggering factor that induces corrosion, the environment in which the structure is located determines the variables that most significantly influence its behavior. In the case of marine environments, the chloride diffusion coefficient, the concentration of chlorides on the surface and the thickness of the rebar coating are the most determining parameters to be able to evaluate its behavior, while in the case of underground tunnels, although corrosion is induced by chlorides, the formation of NaCl crystals is a parameter to take into account [15,16].
For decades, numerous investigations have been carried out to explain the role of the factors that trigger corrosion of rebars, especially chloride ions [17,18], whose mechanism can be seen in the Figure 1.
The critical threshold of chloride ions (Ccrit) needed to despassivate the steel is one of the critical parameters in the prediction and evaluation of corrosion [17]. The knowledge of Ccrit is fundamental when establishing the requirements to achieve structures with sufficient durability and to evaluate the service life or residual life of existing structures [18]. The onset of corrosion due to the effect of chlorides in the concrete reinforcements has been related to an increase in the ratio [Cl]/[OH] above a certain value, which was initially set by Haussman at 0.6 [19,20,21,22,23,24]. However, it was later found that it can be affected by other parameters such as the amount of air retained in the holes of the steel-concrete interface or the presence of defects [23,25,26,27,28,29,30]. Numerous studies depict that there is a significant dispersion in Ccrit values. In most cases, the limits are set in relation to the weight of the cement: For example, for concrete with a water/cement ratio of 0.5 mainly located in marine environments in the intertidal zone in Europe with a limit value of 0.5% suggested [31]. In Spain, the mandatory regulations establish a durability strategy based on the service life of the structure, but always with a limit of Cl of 0.4% [32]. In the United States, the thresholds are set according to the exposure class of the structure, ranging from 0.15% to 0.30%, and may reach 1% for structures located in dry environments [33]. At present, there are numerous investigations that model the corrosion behavior of the reinforcements embedded in the reinforced concrete and the influence of the concrete quality, the concentration of chlorides and the coating and the cracking, on the rate of corrosion, under different environmental conditions [34,35,36,37]. In addition, these investigations, validated on the corresponding experimental works, have allowed to simulate the influence that the size of the pits have on the geometry of the fissures and how the accumulation of oxide in the pits influence the adhesion between concrete and steel [38].
The realization of potential maps according to ASTM C876-09 [39] is the electrochemical technique most commonly used to diagnose the risk of corrosion in RCSs [2,40]. However, the results of the evaluation of RCSs with corroded reinforcements may indicate different degrees of corrosion or probability of corrosion depending on the technique used for corrosion assessment [41,42]. It is generally accepted that the measurements of corrosion potential (Ecorr) should be completed with other procedures [40,43]. The measurement of corrosion rate is a quantitative technique that is known for decades [44]. However there have been found large variations in the values of corrosion rate for narrow ranges of values of corrosion potential [45].
Taking into account the previous premises, the aims of the work are to verify the possibility of re-surfacing previously corroded reinforcements and to verify the suitability of two electrochemical techniques widely used to determine the corrosion status of reinforcement by correlating the Ecorr and the icorr measurements.

2. Experimental Program

In this study, two issues related to corrosion of RCS reinforcements have been investigated: (i) The possibility of re-surfacing previously corroded reinforcements and (ii) the verification of the suitability of two electrochemical techniques widely used to determine the corrosion status of reinforcements. In order to test this, 32 B500SD reinforcing steel bars of 6 mm diameter and 120 mm length have been used. The chemical composition of the steel is shown in Table 1. The analyses have been carried out with an Optical Emission Spectrometer by Arc/Spark model SPECTROMAX.
The rebars have been embedded in cement mortar samples of 80 × 55 × 20 mm3 with a cement/sand/water dosage of 1/3/0.5. CEM I 42.5R Portland cement according to RC-16 standard [46], siliceous sand with a maximum size of 0.4 mm and drinking water supplied by Canal de Isabel II in Madrid were used. The physical characteristics and chemical composition of the cement and the sand used can be seen in Table 2.
The steel rebars were embedded in the specimens, leaving 5 cm outside, in which the risk of differential aeration at the triple atmosphere/mortar/steel interface was eliminated by means of adhesive tape. The specimens were demolded after 24 h and cured in a wet chamber for 28 days at a temperature of 20 ± 2 °C and a humidity above 90%. Subsequently, they were subjected to a constant anodic polarization of 20 µA/cm2 during one year. In the photograph (Figure 2a), one of the specimens can be seen after the passage of the electric current. The samples were mixed with an addition of 2% of Cl in relation to the weight of the cement to ensure that the anodic polarization would lead to corrosion of the reinforcements and would not cause the electrolysis of the water in the pore network.
Once the pre-corrosion of the rebars was complete, the mortar samples were then broken and the rebars removed. Half of the rebars (16 pieces) were chosen at random, and the corrosion products were completely removed by dissolving the iron oxides and hydroxides in 50% HCl inhibited with 4g/l urotropin (hexamethylenetetramine). With the clean rebars (CLN), 8 specimens similar to those of the first phase were performed, but with variable amounts of chloride ion of 0.0%; 0.2%; 0.4%; 0.6%; 0.8%; 1.0%; 1.5%; and 2.0% in relation to the weight of cement and with the incorporation of a third rebar located in the center to facilitate the electrochemical measurements (Figure 2b). The same process has been carried out with the rebars that hold the corrosion products. Then the 16 specimens were kept in a wet chamber for 250 days at a temperature of 20 ± 2 °C and a humidity above 90%. During this time the corrosion potential (Ecorr), and corrosion rate were periodically recorded using an AUTOLAB/PGSTAT302N potentiostat in which the outer bars were used as working electrodes and the central bar as an auxiliary electrode (Figure 3). The reference electrode used was Cu/CuSO4. The corrosion rate was measured by the corrosion current density (icorr) obtained by measuring the polarization resistance (Rp) by the Stern and Geary equation [47]:
i corr = B R p
where the value of 26 mV for the constant B was chosen [48]. The value of Rp was obtained by applying polarization of 10 mV and measuring the current response after 15 s. The reference values for predicting the corrosion state as a function of Ecorr and icorr are shown in Table 3 [39,49].
With respect to the thresholds of the Ecorr value there is a very broad consensus throughout the scientific and technical community, most likely due to the enormous diffusion at the international level of the ASTM C 876-09 standard. Regarding icorr thresholds, it is widely accepted that icorr < 0.1 µA/cm2 corresponds to steel in a passive state, and above this value steel corrodes and icorr > 1 µA/cm2 is very dangerous [42,44,50,51,52,53].

3. Results and Discussion

Figure 4 shows the evolution in time of the icorr of all the analyzed rebars. Each of the data have been obtained as the arithmetic mean of the two rebars in the same state and embedded in the same specimen. The abbreviation CLN indicates that the rebar has been cleaned while the abbreviation COR indicates that the rebar keeps the corrosion products. The final numbers indicate the amount of Cl, expressed as a percentage by weight of cement, present in the specimens. It can be seen that, in most cases, the starting point is an icorr that decreases in a very similar way during the first 35 days of exposure. After this period of exposure, the icorr remains at very stable values most probably because of the humidity of the environment remaining constant. Figure 5 shows the values corresponding to the icorr of all the rebars after 250 days.
If the clean rebars (CLN) are analyzed, the analysis depicted in Figure 4 and Figure 5 indicate that only the rebars embedded in mortar samples of up to 0.4% of Cl in weight of cement are kept in a passive state. These results are in agreement with the indications of the EHE and ACI [32,33,54]. The embedded rebars in specimens with 0.6% Cl are maintained with low corrosion levels. Rebars in specimens with 0.8% Cl are maintained with icorr between 1 and 2 µA/cm2. With higher amounts of Cl, the rebars maintain icorr at approximately 10 µA/cm2. Similar results were obtained in previous investigations, observing that a greater amount of chloride ion present in the mortar, generates a higher rate of corrosion in the rebars [49,55,56].
All the rebars that have kept the corrosion products (COR) exhibit very high icorr values (10 µA/cm2) regardless of the amount of Cl present in the mortar. Moreover, the icorr of the bars does not depend on the amount of chloride ion, which proves the impossibility of reworking reinforcements with thick corrosion products when these are not eliminated. This is because the icorr in the reinforcements that corrode in an active state are sufficient to maintain an acid pH in the steel/corrosion products interface within such an alkaline medium as concrete, so that, once corrosion has been triggered, Cl are not necessary to maintain it [49,55,57]. Similar results were obtained by Miranda et al., when they observed that the higher the degree of pre-corrosion of the steel, the higher its corrosion rate, even in chloride-free environments [56,57].
The evolution of the Ecorr in the same period of time can be seen in Figure 6. Figure 7 depicts in more detail the Ecorr values reached by all the bars after 250 days.
If we compare the evolution in time of the graphs in Figure 4 and Figure 6, we can see that the Ecorr suffers a greater variation than the icorr, reaching, in some cases (corroded rebar introduced in a specimen with 0.4% of Cl), values, during the whole studied period, typical of the passive, uncertain and active state, since the measurement of the potential for corrosion varies enormously depending on various factors, such as temperature and humidity [58]. It can also be seen that at 250 days, the Ecorr value depends much more on the amount of Cl in the specimen than on the passive or active state of the rebar, so that the Ecorr of rebars in specimens containing the same amount of Cl are very similar, regardless of whether the rebar has been embedded in the clean specimen or with the corrosion products (Figure 6 and Figure 7).
If the values of Ecorr and icorr are represented in a system of axes together with the thresholds that delimit the passive and active states, it is possible to check the validity of the Ecorr measurements as a predictor of the corrosion state of a rebar (Table 3). Choosing as ordinate axis the value of Ecorr and as x-axis the value of icorr and marking by vertical and horizontal lines the thresholds of these values, the space is divided into 6 quadrants (Figure 8).
In quadrants A and F, corrosion states coincide that predict the measurements of the Ecorr and icorr: Quadrant A corresponds to measurements that indicate the passive state while the measurements of quadrant F indicate the active state. In contrast, quadrants B and E define corrosion states with total discrepancy between the prediction of the Ecorr and icorr. Quadrants C and D define corrosion states where the Ecorr predicts an uncertain state.
Figure 9 depicts the Ecorr and icorr values for each of the specimens obtained in all measurements. The graphs on the left column correspond to the clean rebars (CLN) while the right column corresponds to the values of the rebars with corrosion products (COR). In the two graphs located in the same row, the amount of Cl present in the test pieces coincides. Figure 10 shows the values of all the rebars together.
The analysis of all the graphs in Figure 9, shows that only the predictions of the Ecorr and icorr for rebars with an ongoing corrosion process and containing at least 0.8% Cl coincide. In these cases, all the data points of the graphs are located in quadrant F indicated in Figure 8, regardless of whether the rebars are clean or with corrosion products. In addition, the Ecorr value becomes more electronegative as the amount of Cl present in the specimen increases and regardless of the state of the rebar. This trend is more pronounced for very low amounts of Cl and does not depend on the corrosion state of the reinforcement.
The analysis in Figure 10 allows verification of (i) the rebars in passive state (icorr < 0.1 µA/cm2) show a large number of Ecorr values corresponding to high probabilities of corrosion (quadrant A) or uncertain states (quadrant C), and (ii) the rebars in active state (icorr > 0.1 µA/cm2) that show a large number of Ecorr values corresponding to low probabilities of corrosion (quadrant F) or uncertain states (quadrant D). These results show the impossibility of predicting the passive or active state of the steel only by means of Ecorr measurements [58].

4. Conclusions

Previously corroded reinforcing steel bars have been soaked in mortar samples with varying contents of Cl- in two different states: previously pickled and with the corrosion products. They have been kept for 250 days in a humid chamber, and Ecorr and icorr have been measured and obtained with the following conclusions being drawn:
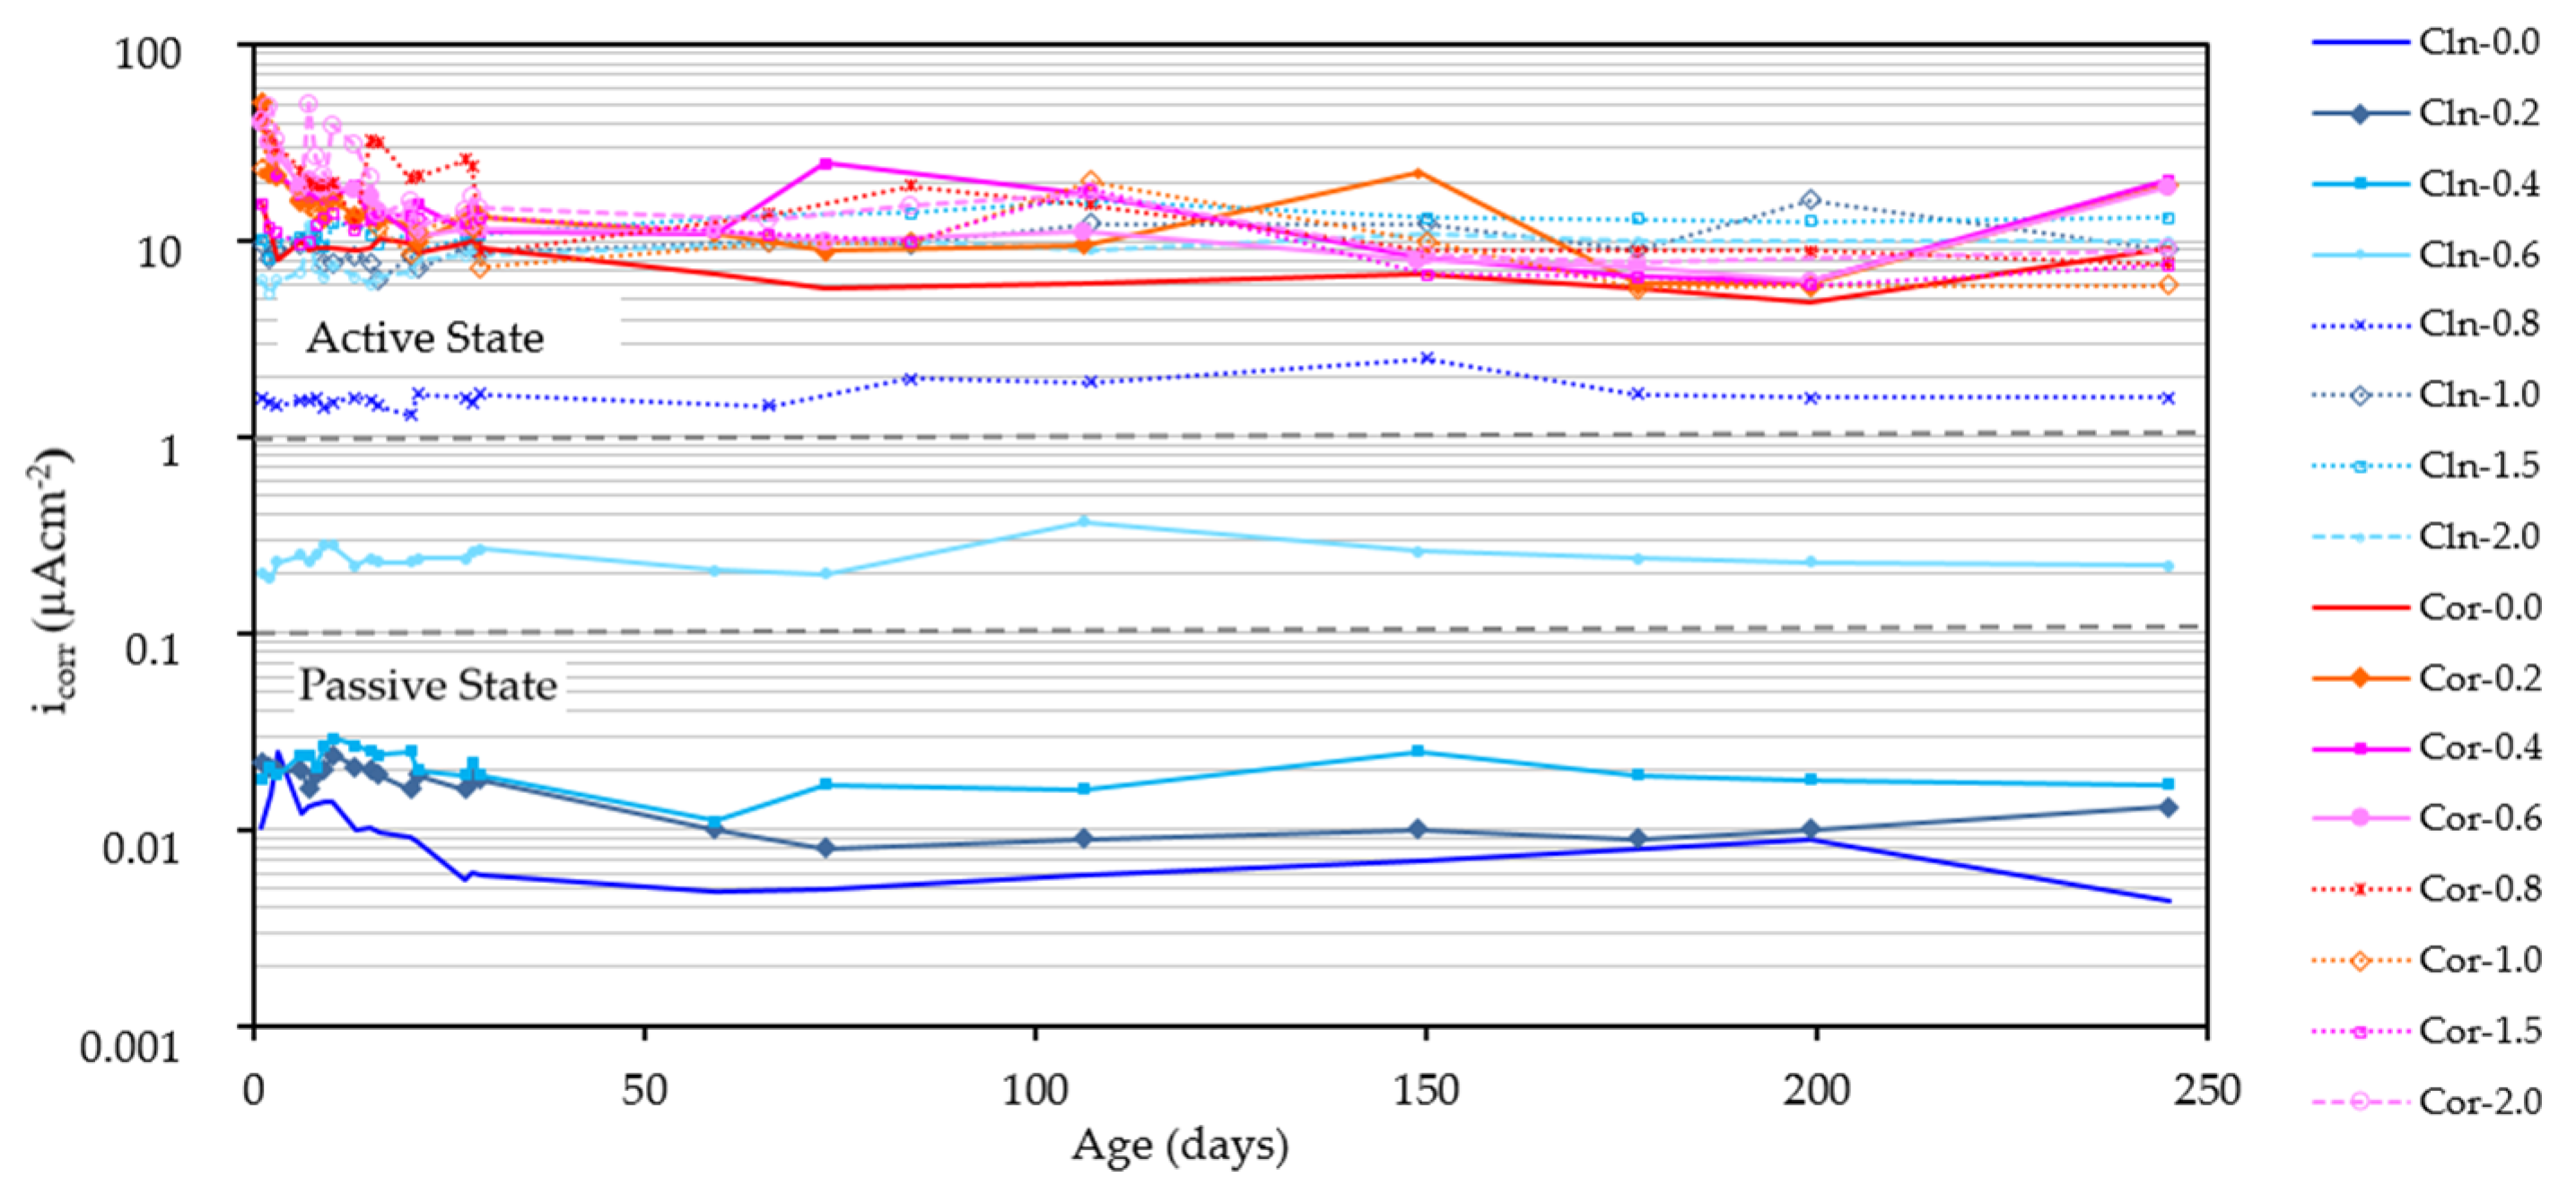
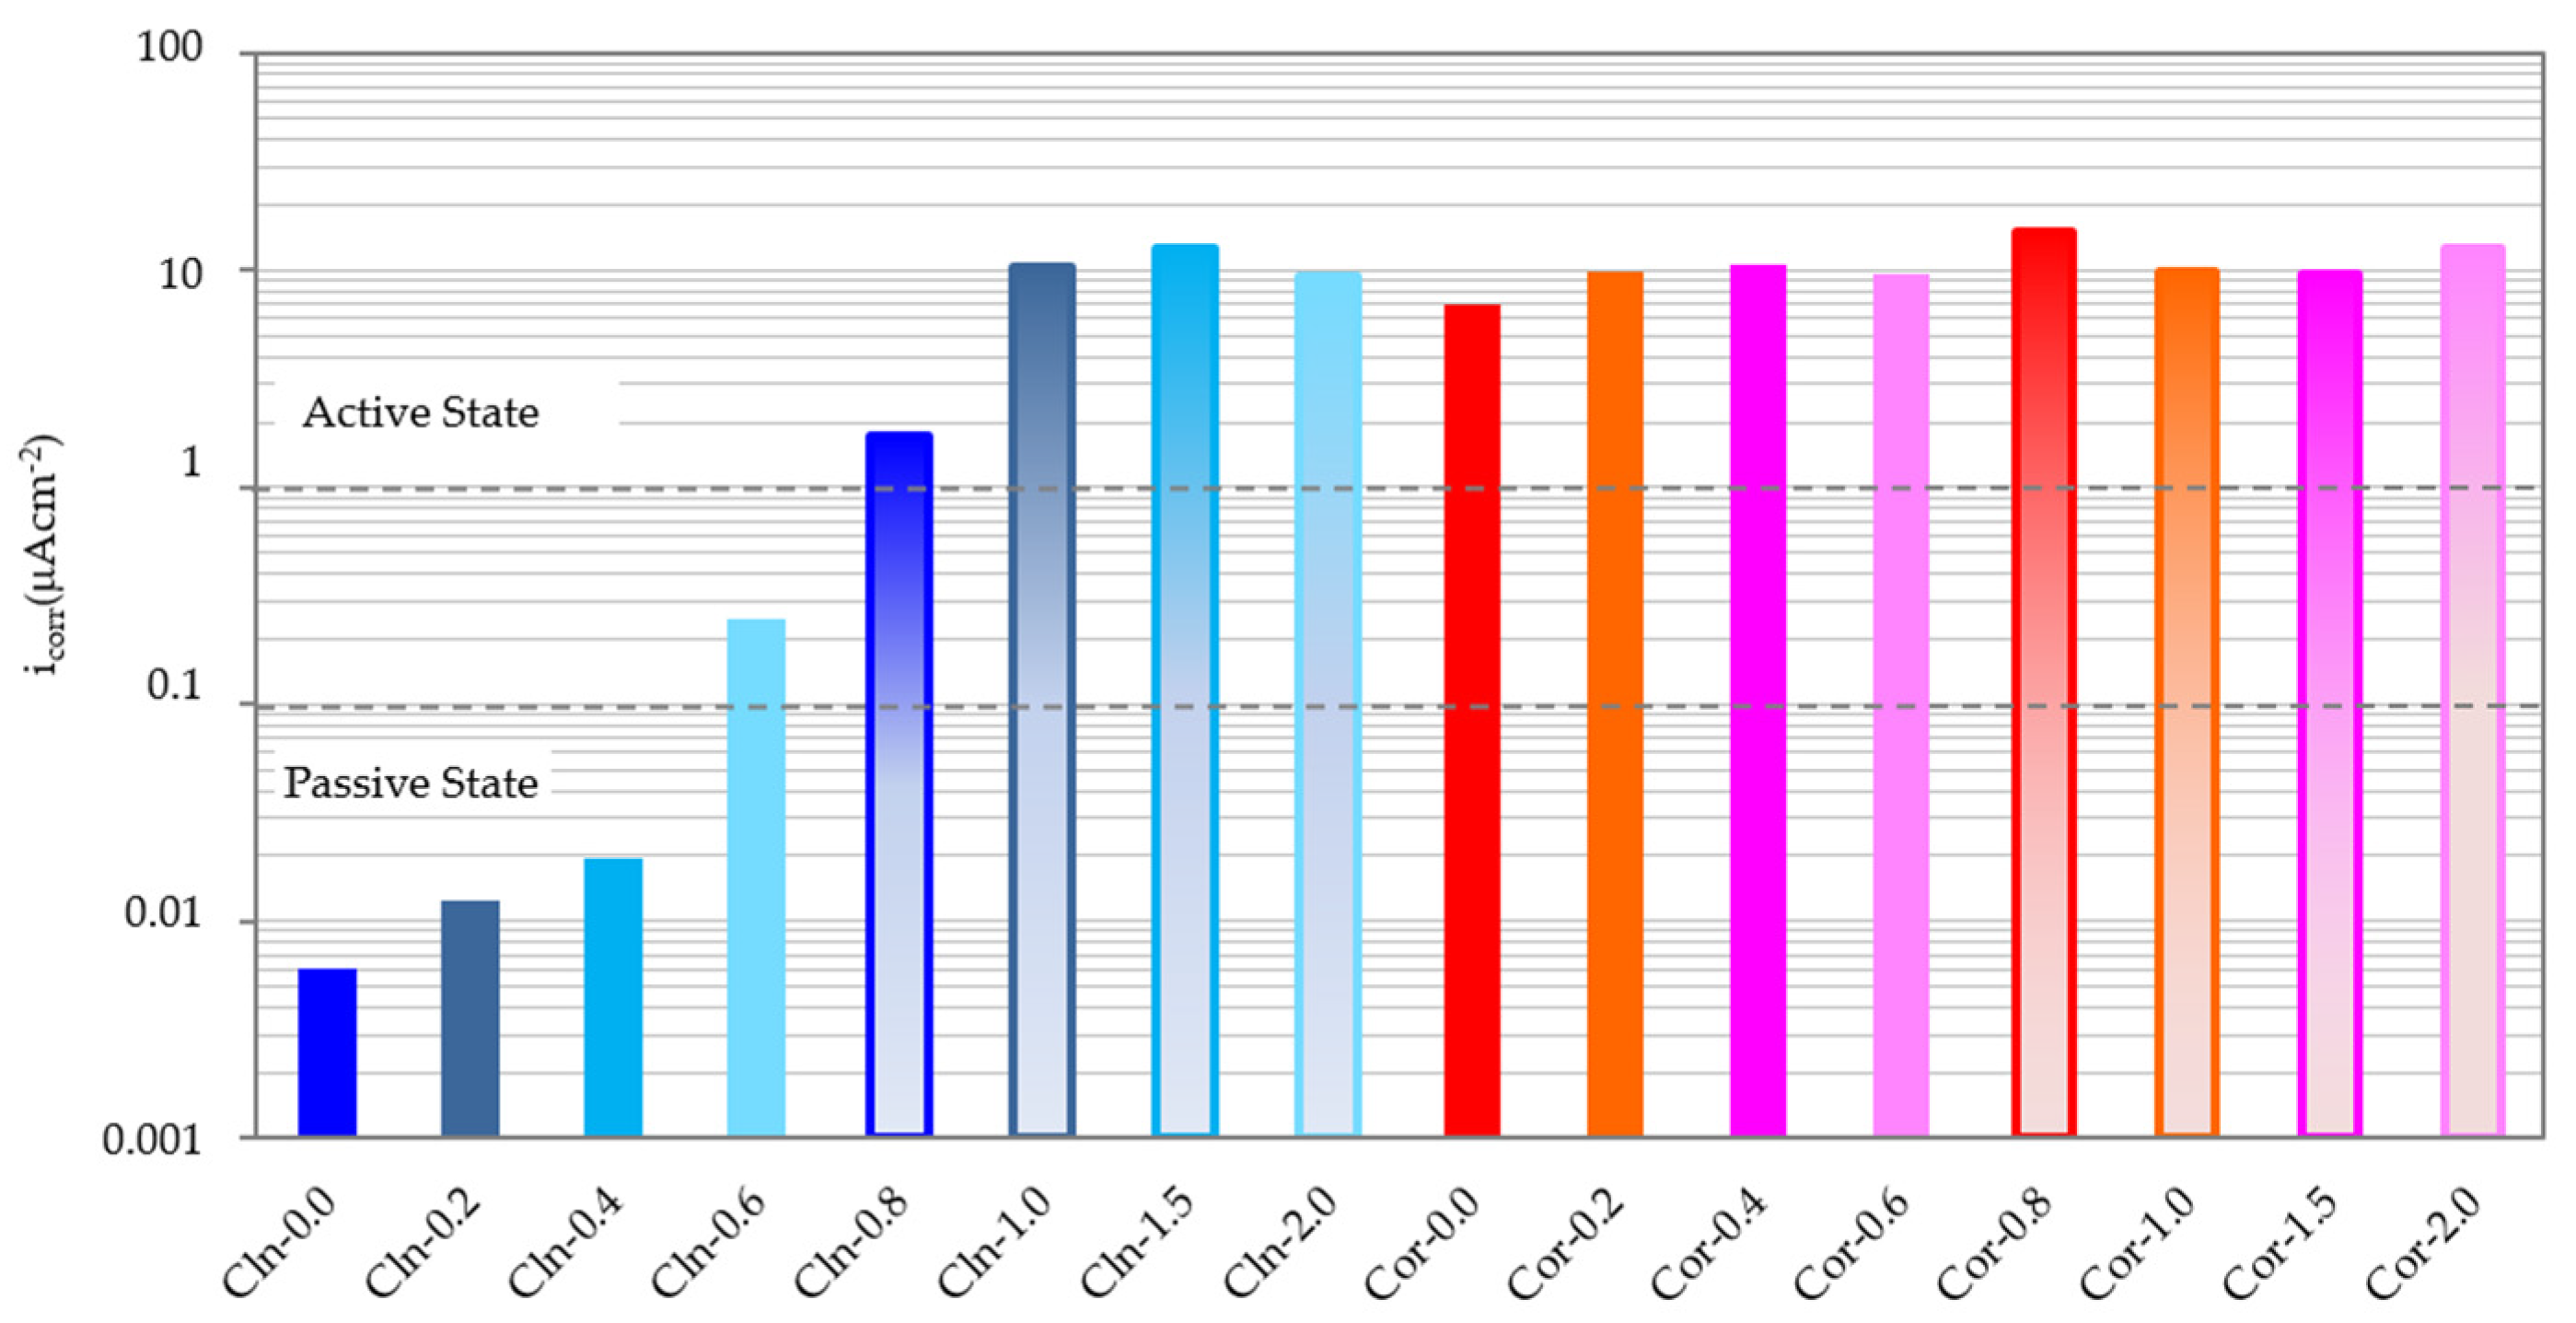
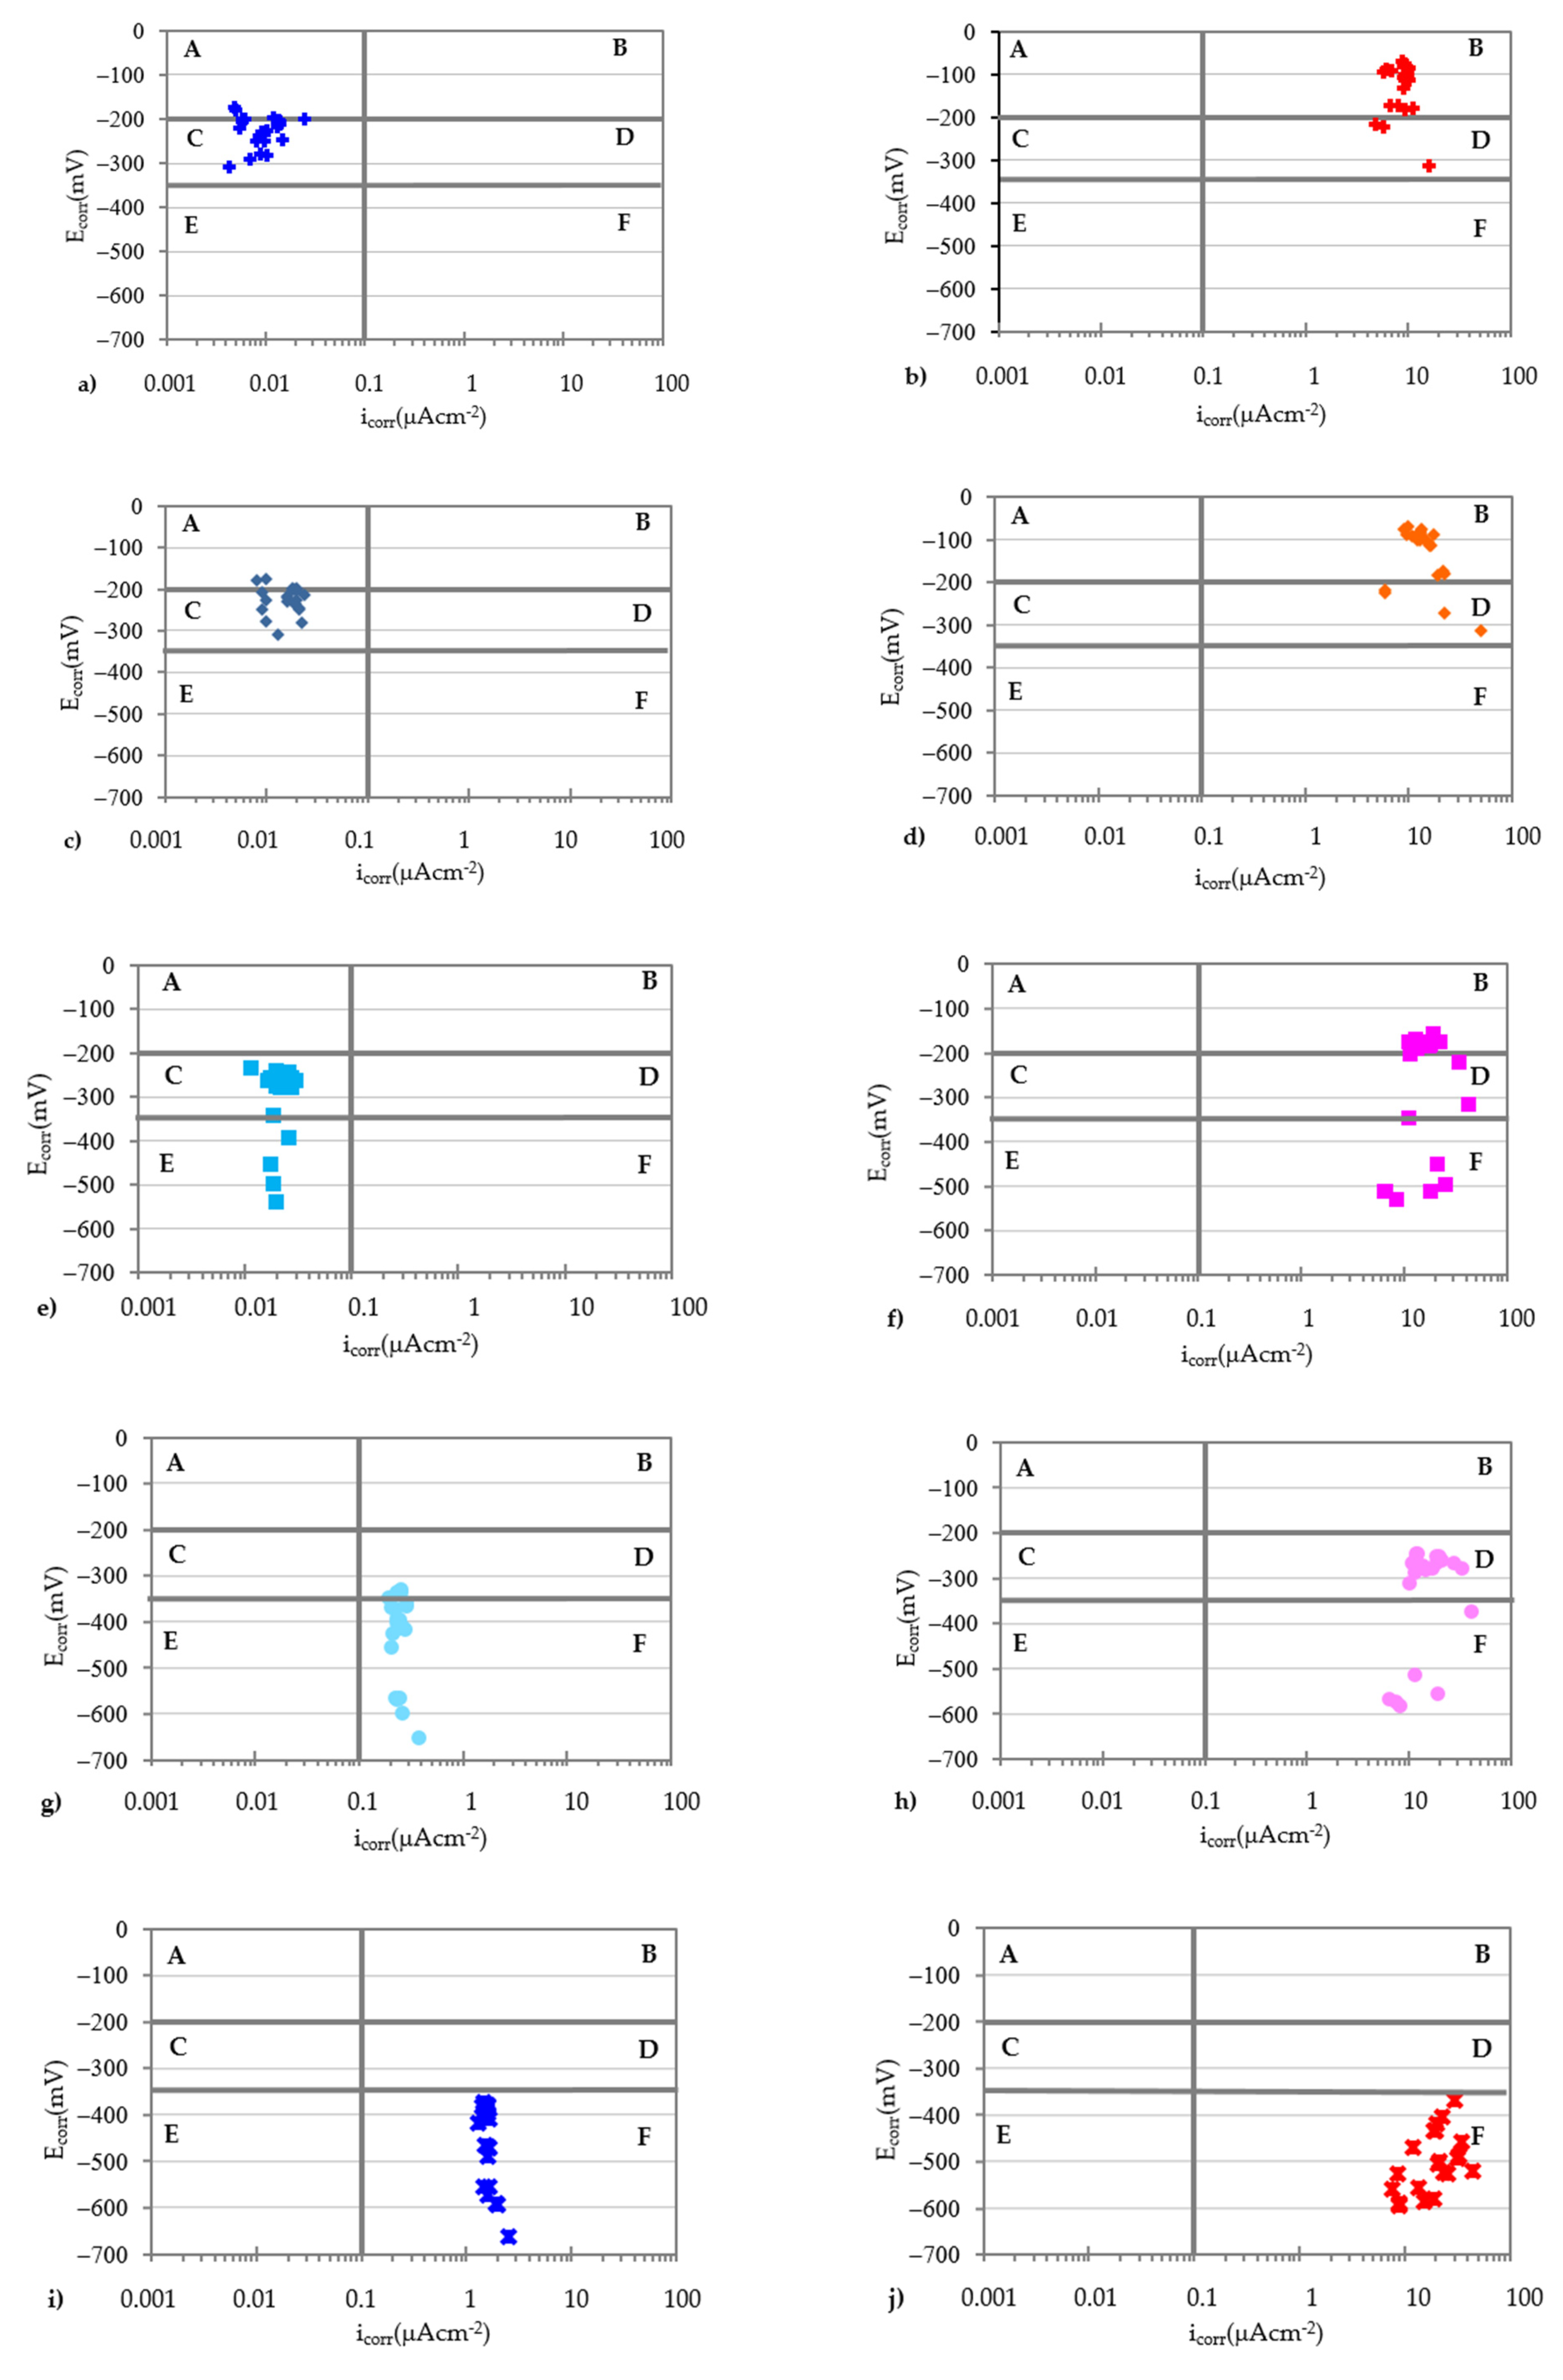
  • All the rebars that have kept the corrosion products showed a very high icorr and a similar value, approximately 10 µA/cm2, regardless of the number of chlorides present in the specimen.
  • Clean rebars (CLN) embedded in specimens with 0.6 Cl remain with uncertain icorr (values between 0.1 and 1.0 µA/cm2).
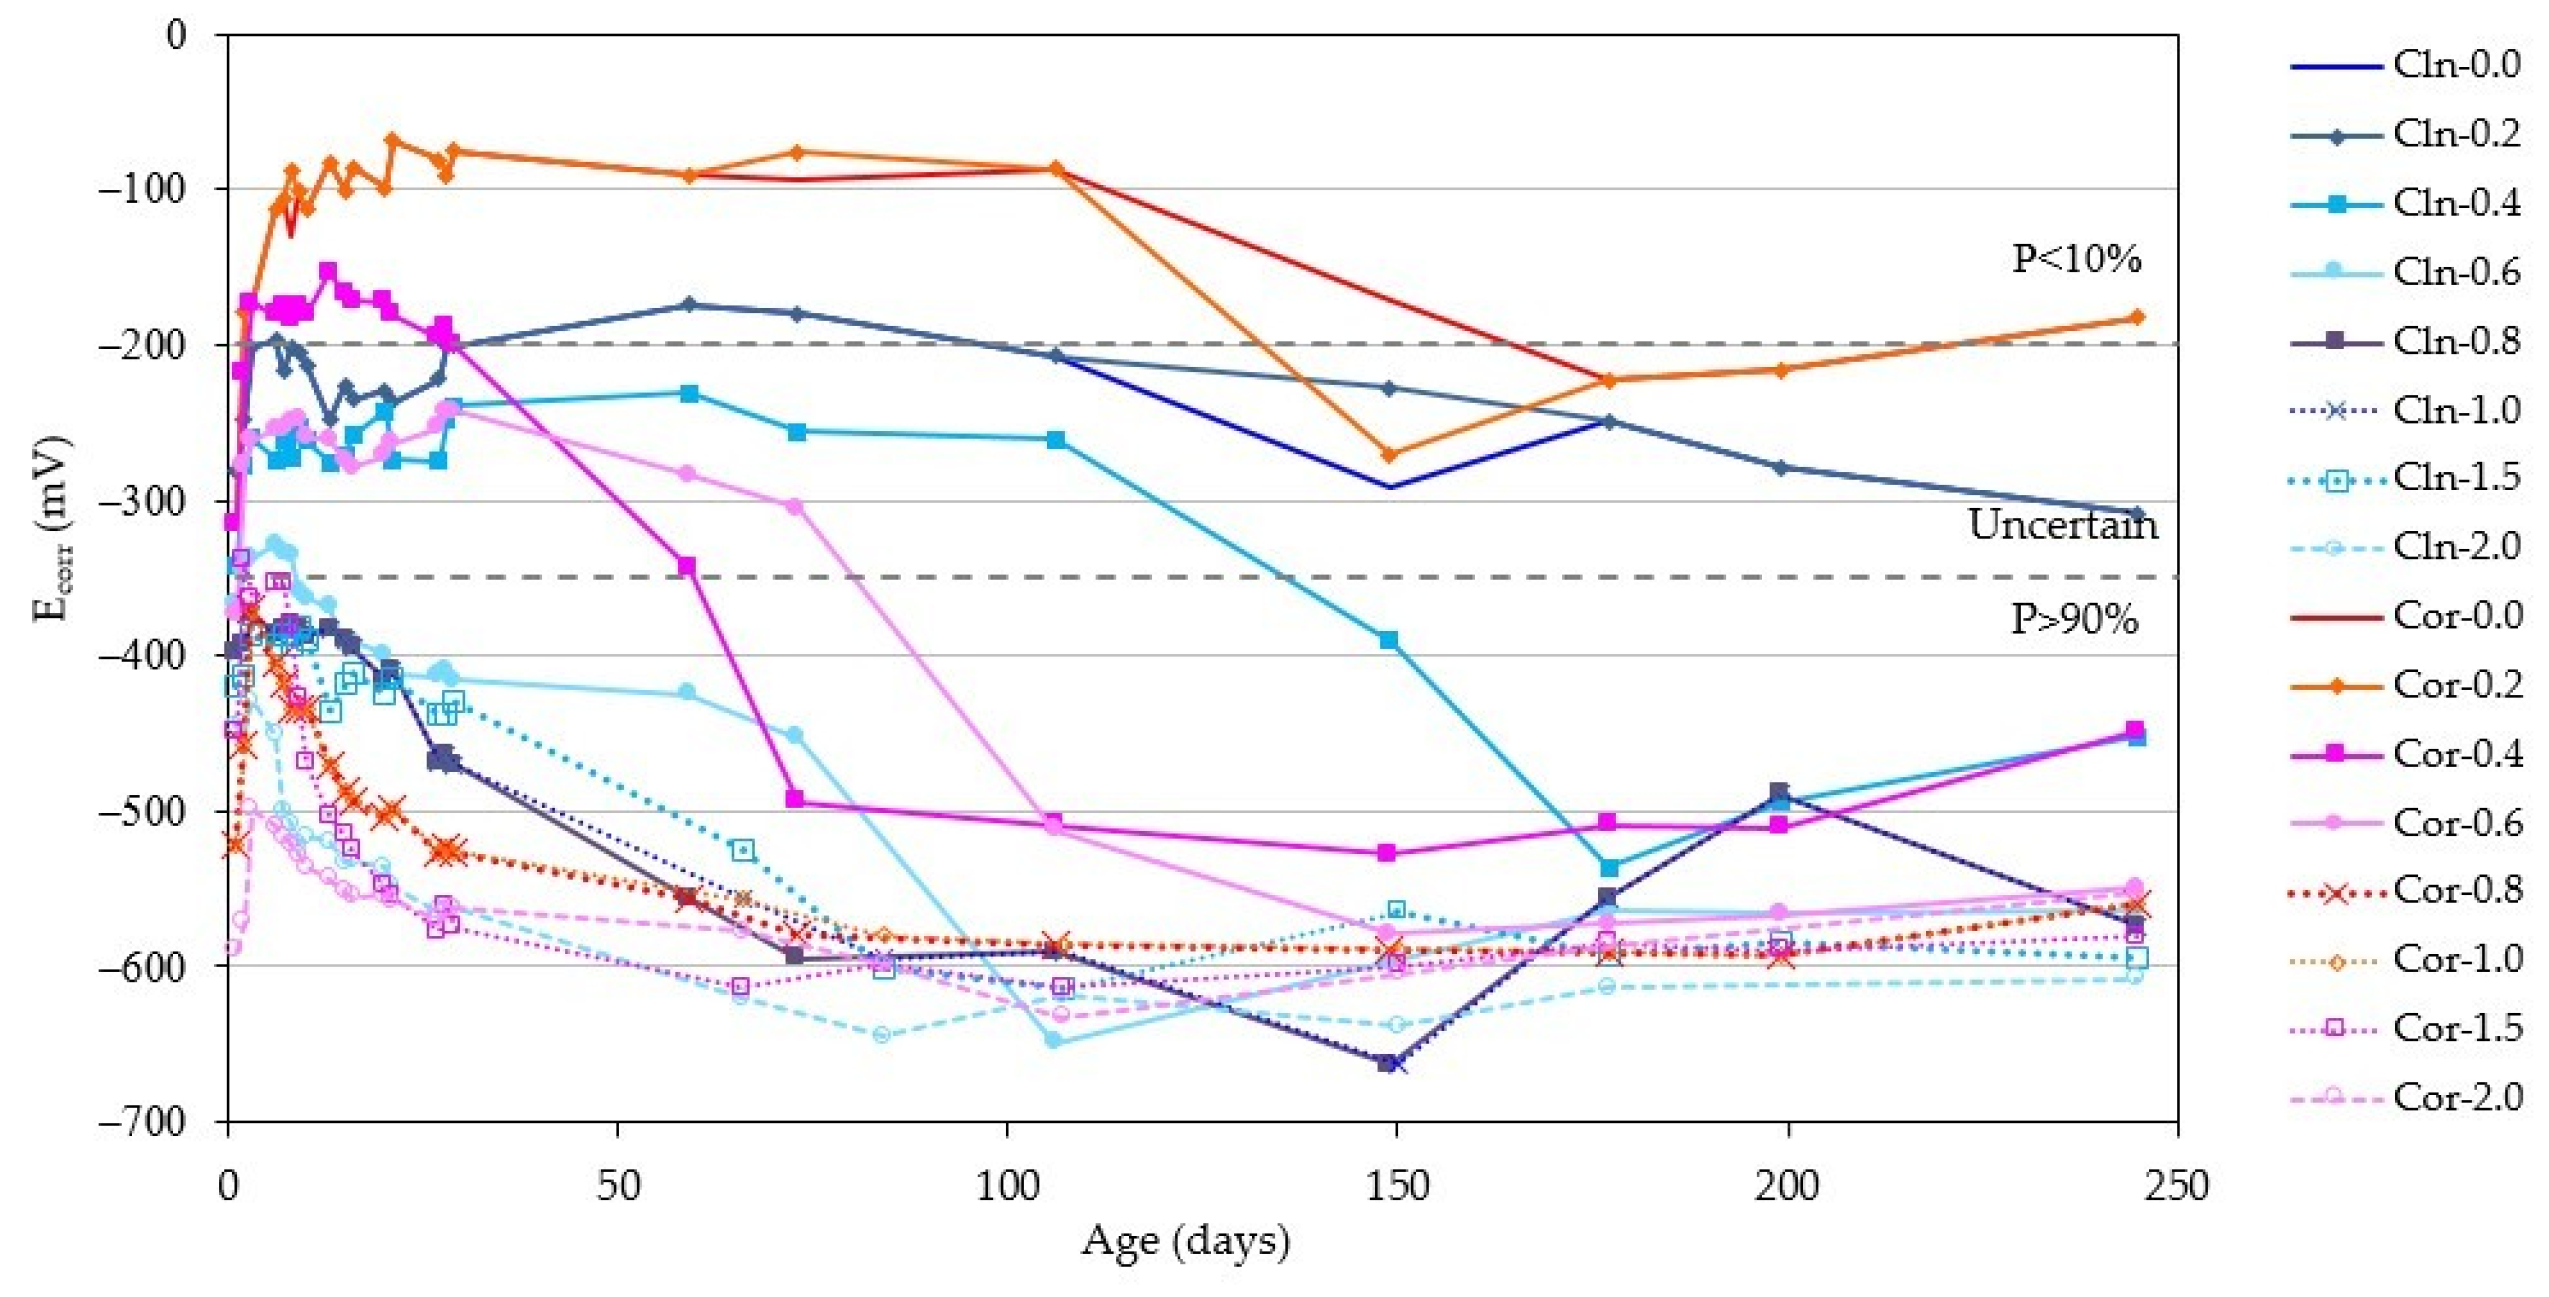
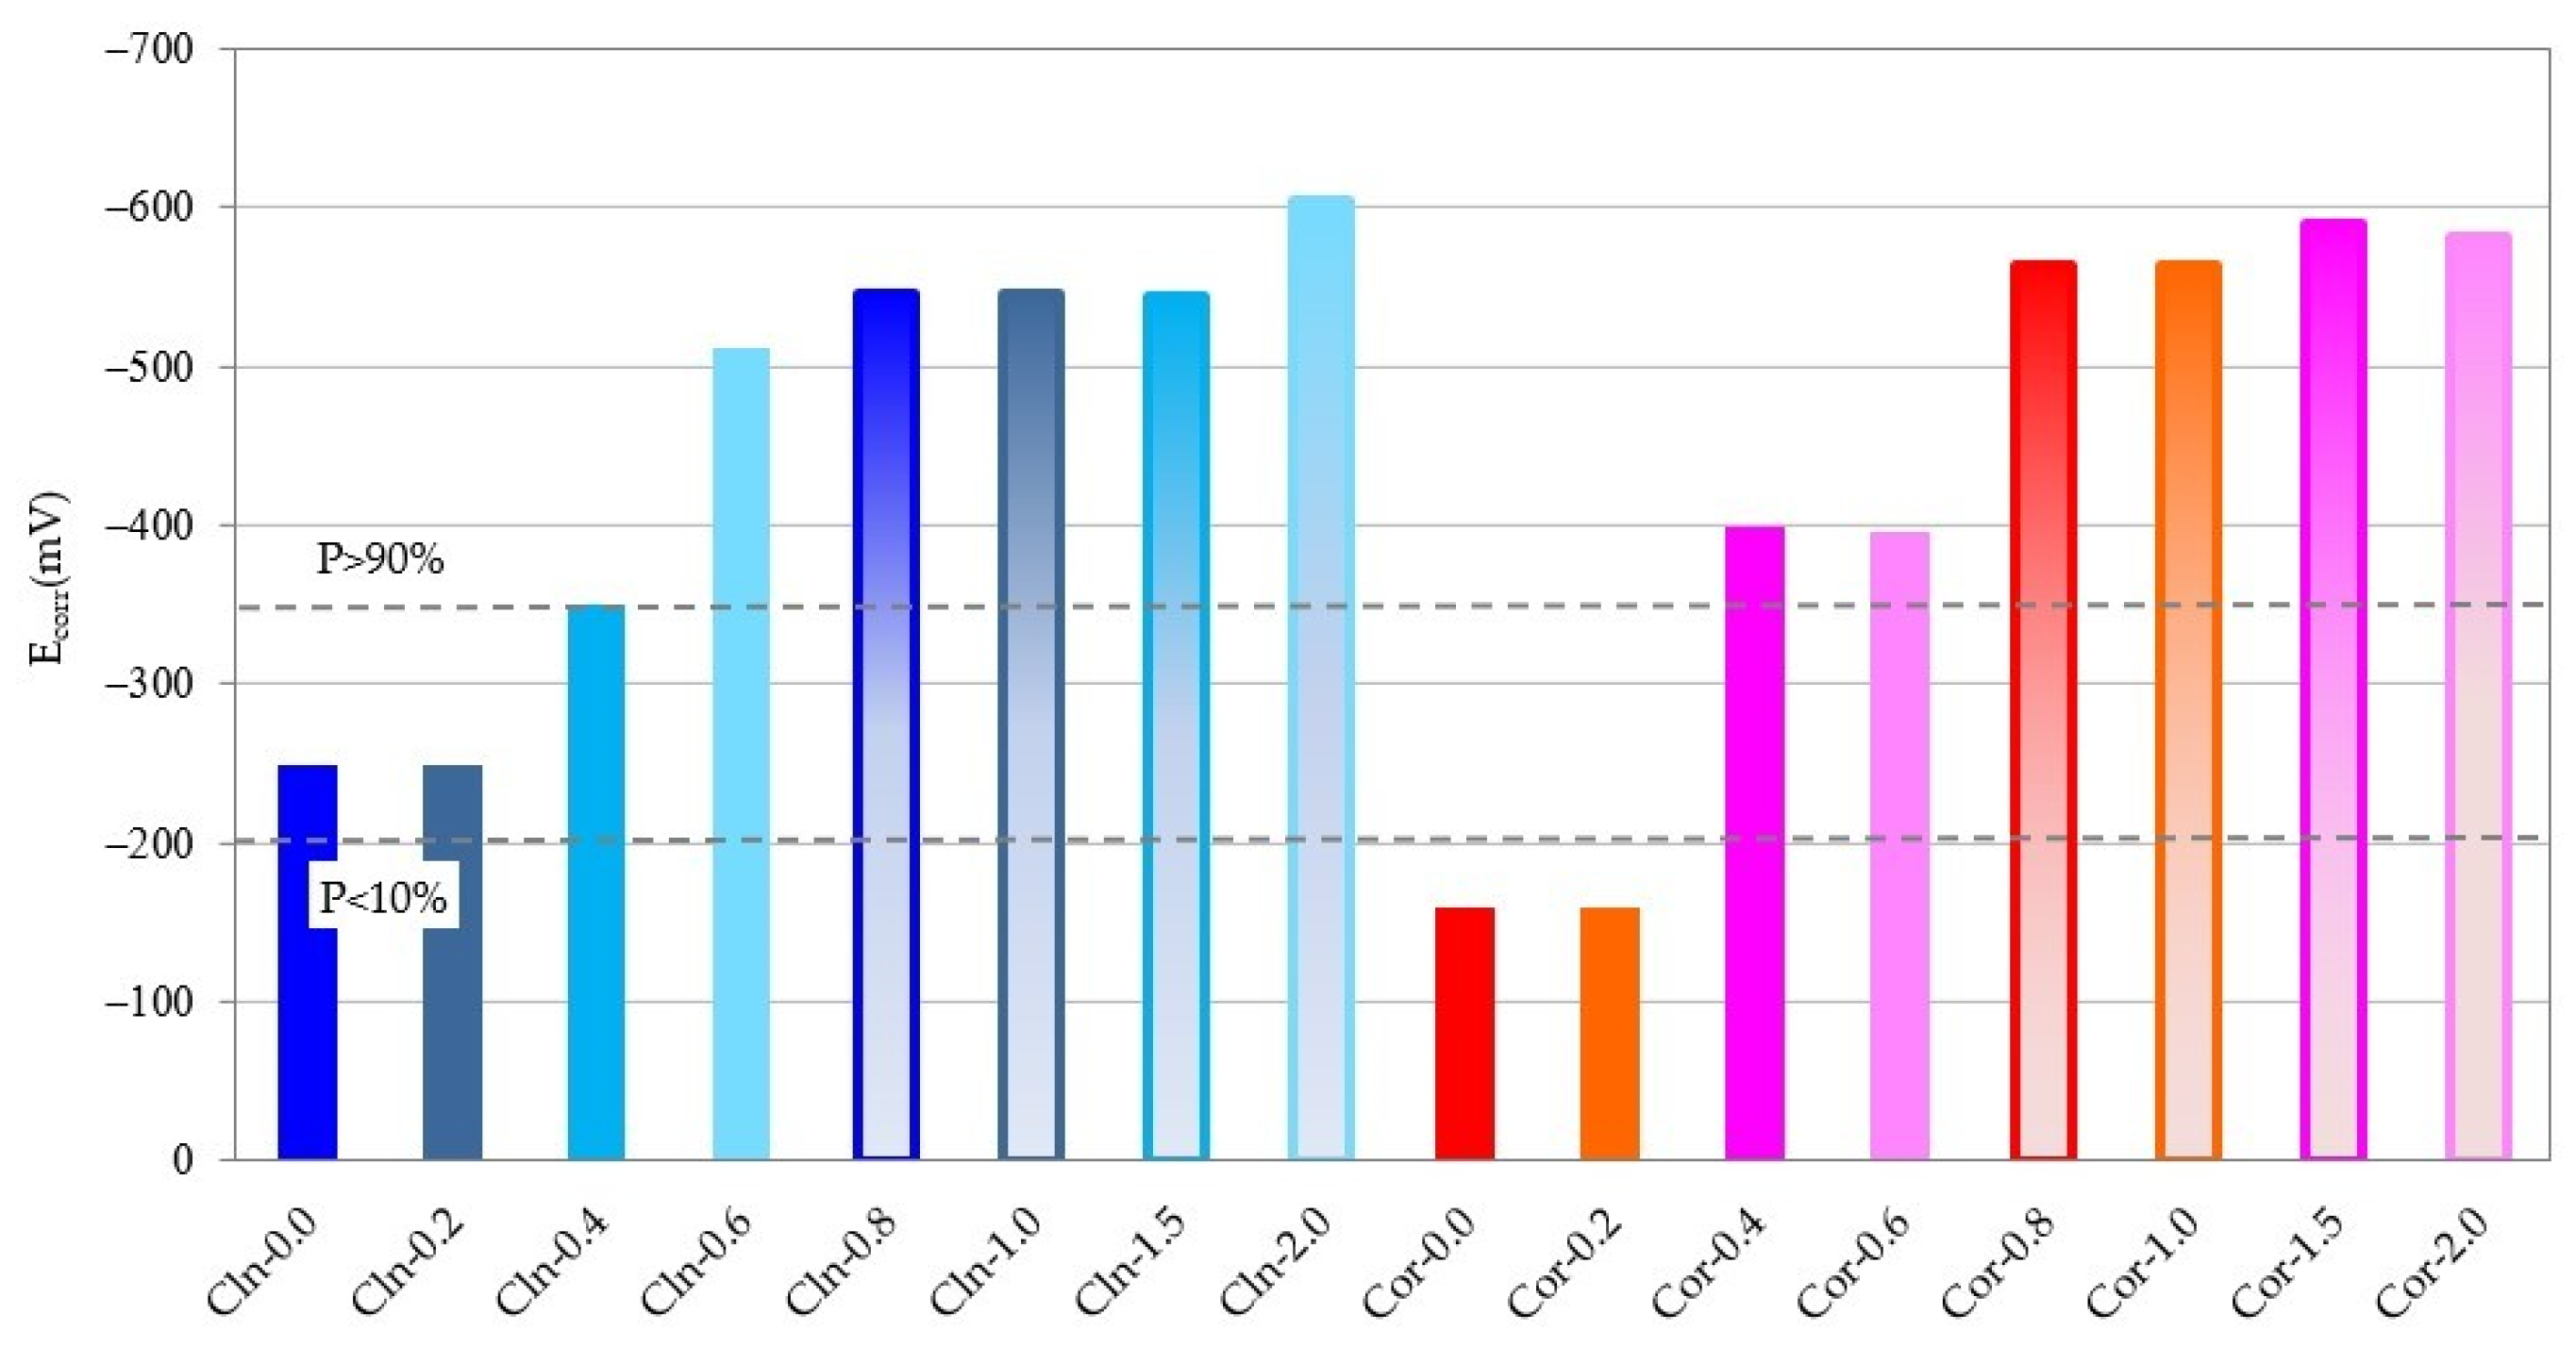
  • The values of the Ecorr measurement depended more on the amount of Cl present in the specimen than on the passive or active state of the rebars.
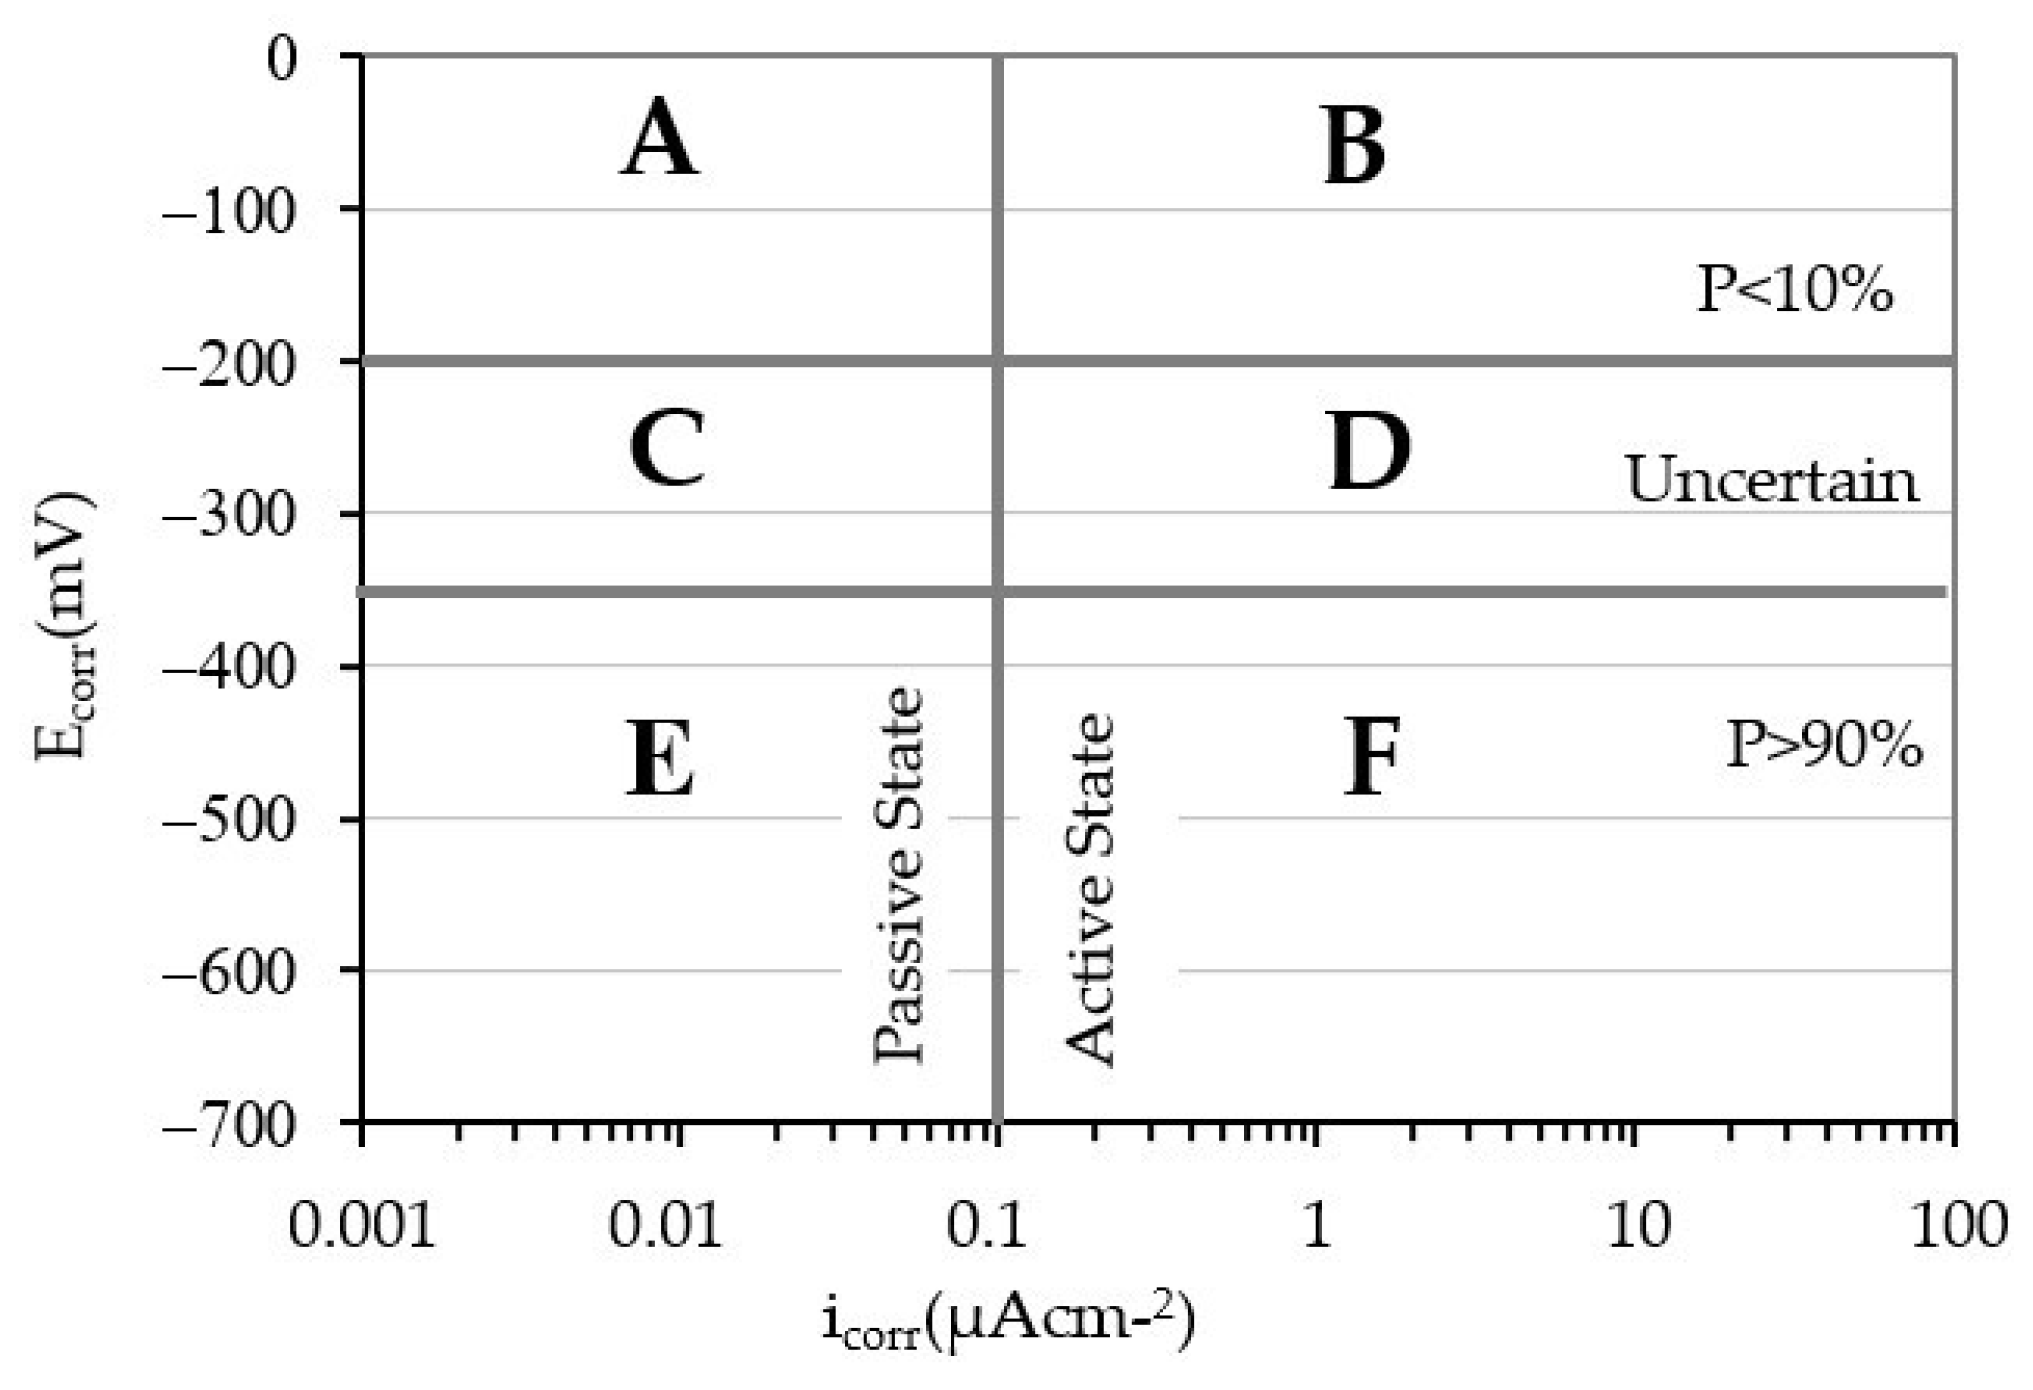
  • Only the predictions of the Ecorr and icorr coincided in bars embedded in specimens with at least a 0.8% Cl by weight cement ratio, regardless of whether the rebar is clean or maintains the corrosion products.
  • The low correlation of the results obtained in the Ecorr and icorr in different situations, makes it impossible to predict the passive or active state of the steel solely based on Ecorr measurements.
  • To repair a concrete structure corroded by the effect of chloride ions, the concrete that surrounds the rebars must be removed so that all the corrosion products generated on the surface of the rebars can be eliminated. If the complete removal of the corrosion products is not achieved, even if a repair mortar is placed on it, the rebars will remain in active state.

Author Contributions

Conceptualization, A.C. and M.d.l.N.G.; methodology, A.C. and M.I.P.; software, F.I.O.; validation, M.d.l.N.G. and M.I.P.; formal analysis, M.I.P. and F.I.O.; investigation, A.C.; resources, M.d.l.N.G.; data curation, F.I.O.; writing—original draft preparation, A.C.; writing—review and editing, M.I.P.; visualization, M.d.l.N.G.; supervision, A.C.; project administration, M.d.l.N.G. All authors have read and agreed to the published version of the manuscript.

Funding

This research received no external funding.

Institutional Review Board Statement

Not applicable.

Informed Consent Statement

Not applicable.

Data Availability Statement

Data available on request.

Conflicts of Interest

The authors declare no conflict of interest.

References

  1. Slater, J.E. Corrosion of Metals in Association with Concrete; ASTM-STP: Philadelphia, PA, USA, 1983; Volume 818. [Google Scholar]
  2. Flis, J.; Pickering, H.W.; Osseo-Asare, K. Interpretation of Impedance Data for Reinforcing Steel in Alcaline Solutions Containing Chlorides and Acetates. Electrochim. Acta 1998, 43, 1921–1929. [Google Scholar] [CrossRef]
  3. Page, C.L. Mechanism of corrosion protection in reinforced concrete marine structures. Nature 1975, 258, 514–515. [Google Scholar] [CrossRef]
  4. Hope, B.B.; Page, J.A.; Ip, A.K.C. Corrosion rates of steel in concrete. Cem. Concr. Res. 1986, 16, 771–781. [Google Scholar] [CrossRef]
  5. Federal Highway Administration. 6 FHWA Research Engineer Wins Arthur S. Flemming Award Promoted Advanced Bridge Inspection Technologies; Federal Highway Administration: Washington, DC, USA, 2001. [Google Scholar]
  6. BRE Group. Report No 4; Building Research Establishment Ltd.: Watford, UK, 2001. [Google Scholar]
  7. Angst, U.M. Challenges and opportunities in corrosion of steel in concrete. Mater. Struct. 2018, 51, 4. [Google Scholar] [CrossRef] [Green Version]
  8. Pillai, R.G.; Trejo, D. Surface condition effects on critical chloride threshold of steel reinforcement. ACI Mater. J. 2005, 102, 103–109. [Google Scholar]
  9. Gancedo, J.R.; Alonso, C.; Andrade, C.; Gracia, M. AES study of the passive layer formed on iron in saturated Ca(OH)2 solutions. Corrosion 1989, 45, 976–977. [Google Scholar] [CrossRef]
  10. Torbati-Sarraf, H.; Poursaee, A. Corrosion of coupled steel with different microstructures in concrete environment. Constr. Build. Mater. 2018, 167, 680–687. [Google Scholar] [CrossRef]
  11. González, J.A.; Otero, E.; Feliú, S.; Bautista, A.; Ramírez, E.; Rodríguez, P.; López, W. Some considerations on the effect of chloride ion son the corrosion of Steel reinforcements embedded in concrete structures. Mag. Concr. Res. 1998, 50, 189–199. [Google Scholar] [CrossRef]
  12. Galán, I.; Andrade, C.; Castellote, M. Natural and accelerated CO2 binding Kinetics in cement paste at different relative humidity. Cem. Concr. Res. 2013, 49, 21–28. [Google Scholar] [CrossRef]
  13. Revert, A.B.; De Weerdt, K.; Hornbstel, K.; Geiker, M.R. Carbonation-induced corrosion: Investigation of the corrosion onset. Constr. Build. Mater. 2018, 162, 847–856. [Google Scholar] [CrossRef]
  14. Piqueras, M.A.; Company, R.; Jódar, L. Numerical analysis and computing of free boundary problems for concrete carbonation chemical corrosion. J. Comput. Appl. 2018, 336, 297–316. [Google Scholar] [CrossRef]
  15. Tristan Senga Kiesse, T.S.; Bonnet, S.; Amiri, O.; Ventura, A. Analysis of corrosion risk due to chloride diffusion for concrete structures in marine environment. Mar. Struct. 2020, 73, 102804. [Google Scholar] [CrossRef]
  16. Li, C.; Chen, Q.; Wang, R.; Wu, M.; Jiang, Z. Corrosion assessment of reinforced concrete structures exposed to chloride environments in underground tunnels: Theoretical insights and practical data interpretations. Cem. Concr. Compos. 2020, 112, 103652. [Google Scholar] [CrossRef]
  17. Angst, U.; Elsener, B.; Larsen, C.K.; Vennesland, O. Critical chloride content in reinforced concrete—A review. Cem. Concr. Res. 2009, 39, 1122–1138. [Google Scholar] [CrossRef]
  18. Wang, Y.; Liu, C.; Wang, Y.; Li, Q.; Liu, Z. Investigation on chloride threshold for reinforced concrete by a test method combining ANDT and ACMT. Constr. Build. Mater. 2019, 214, 158–168. [Google Scholar] [CrossRef]
  19. Page, C.L.; Lambert, P.; Vassie, P.R.W. Investigation of reinforcement corrosion: 1. The pore electrolyte phase in chloride-contaminated concrete. Mater. Struct. 1991, 24, 243–252. [Google Scholar] [CrossRef]
  20. Lambert, P.; Page, C.L.; Vassie, P.R.W. Investigation of reinforcement corrosion: 2. Electrochemical monitoring of steel in chloride-contaminated concrete. Mater. Struct. 1991, 24, 351–358. [Google Scholar] [CrossRef]
  21. Oh, B.H.; Jang, S.Y.; Shin, Y.S. Experimental investigation of the threshold chloride concentration for corrosion initiation in reinforced concrete structures. Mag. Concr. Res. 2003, 55, 117–124. [Google Scholar] [CrossRef]
  22. Kayyali, O.A.; Haque, M.N. The ratio of Cl-/OH- in chloride contaminated concrete. A most important criterion. Mag. Concr. Res. 1995, 47, 235–242. [Google Scholar] [CrossRef]
  23. Ann, K.T.; Song, H.W. Chloride threshold level for corrosion of steel in concrete. Corros. Sci. 2007, 49, 4113–4133. [Google Scholar] [CrossRef]
  24. Haussman, D.A. Steel corrosion in concrete; How does it occur? Mater. Prot. 1967, 6, 19–23. [Google Scholar]
  25. Rossi, E.; Polder, R.; Copuroglu, O.; Nigland, T.; Savija, B. The influence of defects at the steel/concrete interface for chloride-induced pitting corrosion of naturally deteriorated 20 years old specimens studied through X-ray Computed Tomography. Constr. Build. Mater. 2020, 235, 117474. [Google Scholar] [CrossRef]
  26. Shi, J.; Ming, J. Influence of defects at the steel-mortar interface on the corrosion behavior of steel. Constr. Build. Mater. 2017, 136, 118–125. [Google Scholar] [CrossRef]
  27. Soylev, T.A.; Francois, R. Quality of steel-concrete interface and corrosion of reinforcing steel. Cem. Concr. Res. 2003, 33, 1407–1415. [Google Scholar] [CrossRef]
  28. Mohammed, T.U.; Otsuki, N.; Hamada, H.; Yamaji, T. Chloride-induced corrosion of steel bars in concrete with presence of gap at steel-concrete interface. ACI Mater. J. 2002, 99, 149–156. [Google Scholar]
  29. Kenny, A.; Katz, A. Steel-concrete interface influence on chloride threshold for corrosion–Empirical reinforcement to theory. Constr. Build. Mater. 2020, 244, 118376. [Google Scholar] [CrossRef]
  30. Alhozaimy, A.; Hussain, R.R.; Al-Negheimish, A. Electro-chemical investigation for the effect of rebar source and surface condition on the corrosion rate of reinforced concrete structures under varying corrosive environments. Constr. Build. Mater. 2020, 244, 118317. [Google Scholar] [CrossRef]
  31. Duracrete. General Guidelines for Durability Design and Redesign; CUR: Gouda, Belgium, 2000. [Google Scholar]
  32. de Fomento, M. Instrucción de Hormigón Estructural EHE-08; Madrid, Spain, 2008. Available online: https://www.mitma.gob.es/recursos_mfom/1820100.pdf (accessed on 20 October 2021).
  33. American Concrete Institute. ACI 318-19 Building Code Requirements for Structural Concrete and Commentary; American Concrete Institute: Farmington Hills, MI, USA, 2019. [Google Scholar]
  34. Ožbolt, J.; Balabanic, G.; Kušter, M. 3D Numerical modelling of steel corrosion in concrete structures. Corros. Sci. 2011, 53, 4166–4177. [Google Scholar] [CrossRef]
  35. Chauhan, A.; Sharma, U.K. Crack propagation in reinforced concrete exposed to non-uniform corrosion under real climate. Eng. Fract. Mech. 2021, 248, 107719. [Google Scholar] [CrossRef]
  36. Chen, J.; Zhang, W.; Tang, Z.; Huang, Q. Experimental and numerical investigation of chloride-induced reinforcement corrosion and mortar cover cracking. Cem. Concr. Compos. 2020, 111, 103620. [Google Scholar] [CrossRef]
  37. Xu, F.; Xiao, Y.; Wang, S.; Li, W.; Liu, W.; Du, D. Numerical model for corrosion rate of steel reinforcement in cracked reinforced concrete structure. Constr. Build. Mater. 2018, 180, 55–67. [Google Scholar] [CrossRef]
  38. Fekak, F.E.; Garibaldi, L.; Elkhalfi, A.; Alami, E.E. A numerical study of pitting corrosion in reinforced concrete structures. J. Build. Eng. 2021, 43, 102789. [Google Scholar]
  39. ASTM C876-09 Standard. Standard Test Method for Half-Cell Potentials of Uncoated Reinforcing Steel in Concrete; ASTM International: West Conshohocken, PA, USA, 2009. [Google Scholar] [CrossRef]
  40. Videm, K. Corrosion of Reinforcement in Concrete. Monitoring, Prevention and Rehabilitation. (EFC 25); RC Press: London, UK, 1998; Chapter 10; pp. 104–121. [Google Scholar]
  41. Ismail, M.; Ohtsu, M. Corrosion rate of ordinary and high-performance concrete subjected to chloride attack by AC impedance spectroscopy. Constr. Build. Mater. 2006, 20, 458–469. [Google Scholar] [CrossRef]
  42. Reou, J.S.; Ann, K.Y. Electrochemical assessment on the corrosion risk of steel embedment in OPC concrete depending on the corrosion detection techniques. Mater. Chem. Phys. 2009, 113, 78–84. [Google Scholar] [CrossRef]
  43. Andrade, C.; Keddam, M.; Nóvoa, X.R.; Pérez, M.C.; Rangel, C.M.; Takenouti, H. Electrochemical behavior of steel rebars in concrete: Influence of environmental factors and cement chemistry. Electrochim. Acta 2001, 46, 3905–3912. [Google Scholar] [CrossRef]
  44. González, J.A.; Miranda, J.M.; Feliú, S. Considerations on reproducibility of potential and corrosion rate measurements in reinforced concrete. Corros. Sci. 2004, 46, 2467–2485. [Google Scholar] [CrossRef]
  45. Sagües, A. Corrosion Measurement Techniques for Steel in Concrete. In Corrosion-National Association of Corrosion Engineers Annual Conference; NACE: Houston, TX, USA, 1993. [Google Scholar]
  46. Ministerio de la Presidencia. RC-16, Instrucción para la Recepción de Cementos; Boletín Oficial del Estado: Madrid, Spain, 2016. [Google Scholar]
  47. Stern, M.; Geary, A.L. Electrochemical polarization I. A theoretical analysis of the shape of the polarization curves. J. Electrochem. Soc. 1957, 104, 56–63. [Google Scholar] [CrossRef]
  48. Bastidas, D.M.; González, J.A.; Feliú, S.; Cobo, A.; Miranda, J.M. A quantitative study of concrete-embedded steel corrosion using potentiostatic pulses. Corrosion 2007, 63, 1094–1100. [Google Scholar] [CrossRef]
  49. Prieto, M.I.; Cobo, A.; Rodríguez, A.; González, M.N. The efficiency of surface-applied corrosion inhibitors as a method for the repassivation of corroded reinforcement bars embedded in ladle furnace slag mortars. Constr. Build. Mater. 2014, 54, 70–77. [Google Scholar] [CrossRef] [Green Version]
  50. Browne, R.D.; Geoghegan, M.P.; Baker, A.F. Corrosion Monitoring of Steel in Concrete. In Corrosion of Reinforcement in Concrete Construction; Crane, A.P., Ed.; Ellis Horwood Ltd.: Chichester, UK, 1983; Chapter 13; pp. 193–222. [Google Scholar]
  51. Elsener, B.; Andrade, C.; Gulikers, J.; Polder, R.; Raupach, M. Half-cell potential measurements—Potential mapping on reinforced concrete structures. Mater. Struct. 2003, 36, 1–11. [Google Scholar] [CrossRef]
  52. Andrade, C.; Alonso, C. Test methods for on-site corrosion rate measurements of steel reinforcement in concrete by means of the polarization resistance method. Mater. Struct. 2004, 37, 623–643. [Google Scholar] [CrossRef]
  53. Network, D. Manual de Inspección, Evaluación y Diagnóstico de Corrosión en Estructuras de Hormigón Armado; CYTED Programe: Rio de Janeiro, Brazil, 1998; ISBN 980-296-541-3. [Google Scholar]
  54. Eurocode 2: Design of Concrete Structures—Part 1-1: General Rules and Rules for Buildings; CEN: Brussels, Belgium, 2004.
  55. Prieto, M.I.; Cobo, A.; Rodríguez, A.; Calderón, V. Corrosion behavior of reinforcements bars embedded in mortar specimens containing ladle furnace slag in partial substitution of aggregate and cement. Constr. Build. Mater. 2013, 38, 188–194. [Google Scholar] [CrossRef]
  56. Martinez, M.J.; Lopez, M.; Cantero, D.; Rodríguez, J. Influence of the previous state of corrosion of rebars in predicting the service life of reinforced concrete structures. Constr. Build. Mater. 2018, 188, 915–923. [Google Scholar] [CrossRef]
  57. Miranda, J.M.; González, J.A.; Cobo, A.; Otero, E. Several question about electrochemical rehabilitation methods for reinforced concrete structures. Corros. Sci. 2006, 48, 2172–2188. [Google Scholar] [CrossRef]
  58. Macdonald, D.D.; Qiu, J.; Zhu, Y.; Yang, J.; Engelhardt, G.R.; Sagüés, A. Corrosion of rebar in concrete. Part I: Calculation of the corrosion potential in the passive state. Corros. Sci. 2020, 177, 109018. [Google Scholar] [CrossRef]
Figure 1. Chloride corrosion mechanism in reinforced concrete structures.
Materials 14 06883 g001
Figure 2. Specimens used in the study of corrosion. (a) Symptoms in pre-corroded specimens (first phase); (b) Scheme of the specimens with variable amounts of chloride ion (second phase).
Materials 14 06883 g002
Figure 3. Performing electrochemical measurements.
Materials 14 06883 g003
Figure 4. Evolution of icorr over time for all the rebars studied.
Materials 14 06883 g004
Figure 5. icorr measurement of all rebars after 250 days.
Materials 14 06883 g005
Figure 6. Evolution of the Ecorr over time for all the rebars studied.
Materials 14 06883 g006
Figure 7. Measurement of the Ecorr of all rebars after 250 days.
Materials 14 06883 g007
Figure 8. Joint representation of Ecorr and icorr in the plane.
Materials 14 06883 g008
Figure 9. Ecorr and icorr values for each of the rebars. (a) Cln-0.0; (b) Cor-0.0; (c) Cln-0.2; (d) Cor-0.2; (e) Cln-0.4; (f) Cor-0.4; (g) Cln-0.6; (h) Cor-0.6; (i) Cln-0.8; (j) Cor-0.8; (k) Cln-1.0; (l) Cor-1.0; (m) Cln-1.5; (n) Cor-1.5; (o) Cln-2.0; (p) Cor-2.0.
Materials 14 06883 g009aMaterials 14 06883 g009b
Figure 10. Ecorr and icorr values for all rebars.
Materials 14 06883 g010
Table 1. Chemical composition of the steel used.
ElementCSiMnPSCrNiCuMo
Composition (%)0.210.220.72<0.010.0220.050.090.08<0.05
Table 2. Physical characteristics and chemical composition of cement and sand.
Physical Characteristics Chemical Composition
CementBlaine specific surface area414 m2/kgSO3 3.40%
Density3.15 g/cm3Cl0.01%
Initial setting time108 minCalcination loss1.72%
Final setting time160 minInsoluble residue0.40%
SandSand equivalent78S, SO3, Cl and low specific
Real density2.619 g/cm3weight particles0.00%
Normal absorption coefficient15%Fine0.78%
Saturated surface dry density 2.630 g/cm3
Clay clumps0.01%
Coefficient of type of course aggregate0.26%
Soft particles0.93%
Table 3. Reference values for Ecorr and icorr.
MeasurementRiskValues
Ecorr (mV)High >90%Ecorr < −350
Uncertainty −350 < Ecorr < −200
Low <10%Ecorr > −200
icorr (μA/cm2)Active state icorr > 1μA/cm2
High corrosion0.5 μA/cm2 < icorr < 1 μA/cm2
Low corrosion 0.1 μA/cm2 < icorr < 0.5 μA/cm2
Passive state icorr < 0.1 μA/cm2
Publisher’s Note: MDPI stays neutral with regard to jurisdictional claims in published maps and institutional affiliations.

