
Effect of pH on the Corrosion and Repassivation Behavior of TA2 in Simulated Seawater

 ,
, 
Abstract
:1. Introduction
2. Experimental
2.1. Materials and Specimens
2.2. Electrochemical Analysis
2.3. Immersion Tests
2.4. Morphology Analysis
2.5. Friction Electrode Test
3. Results
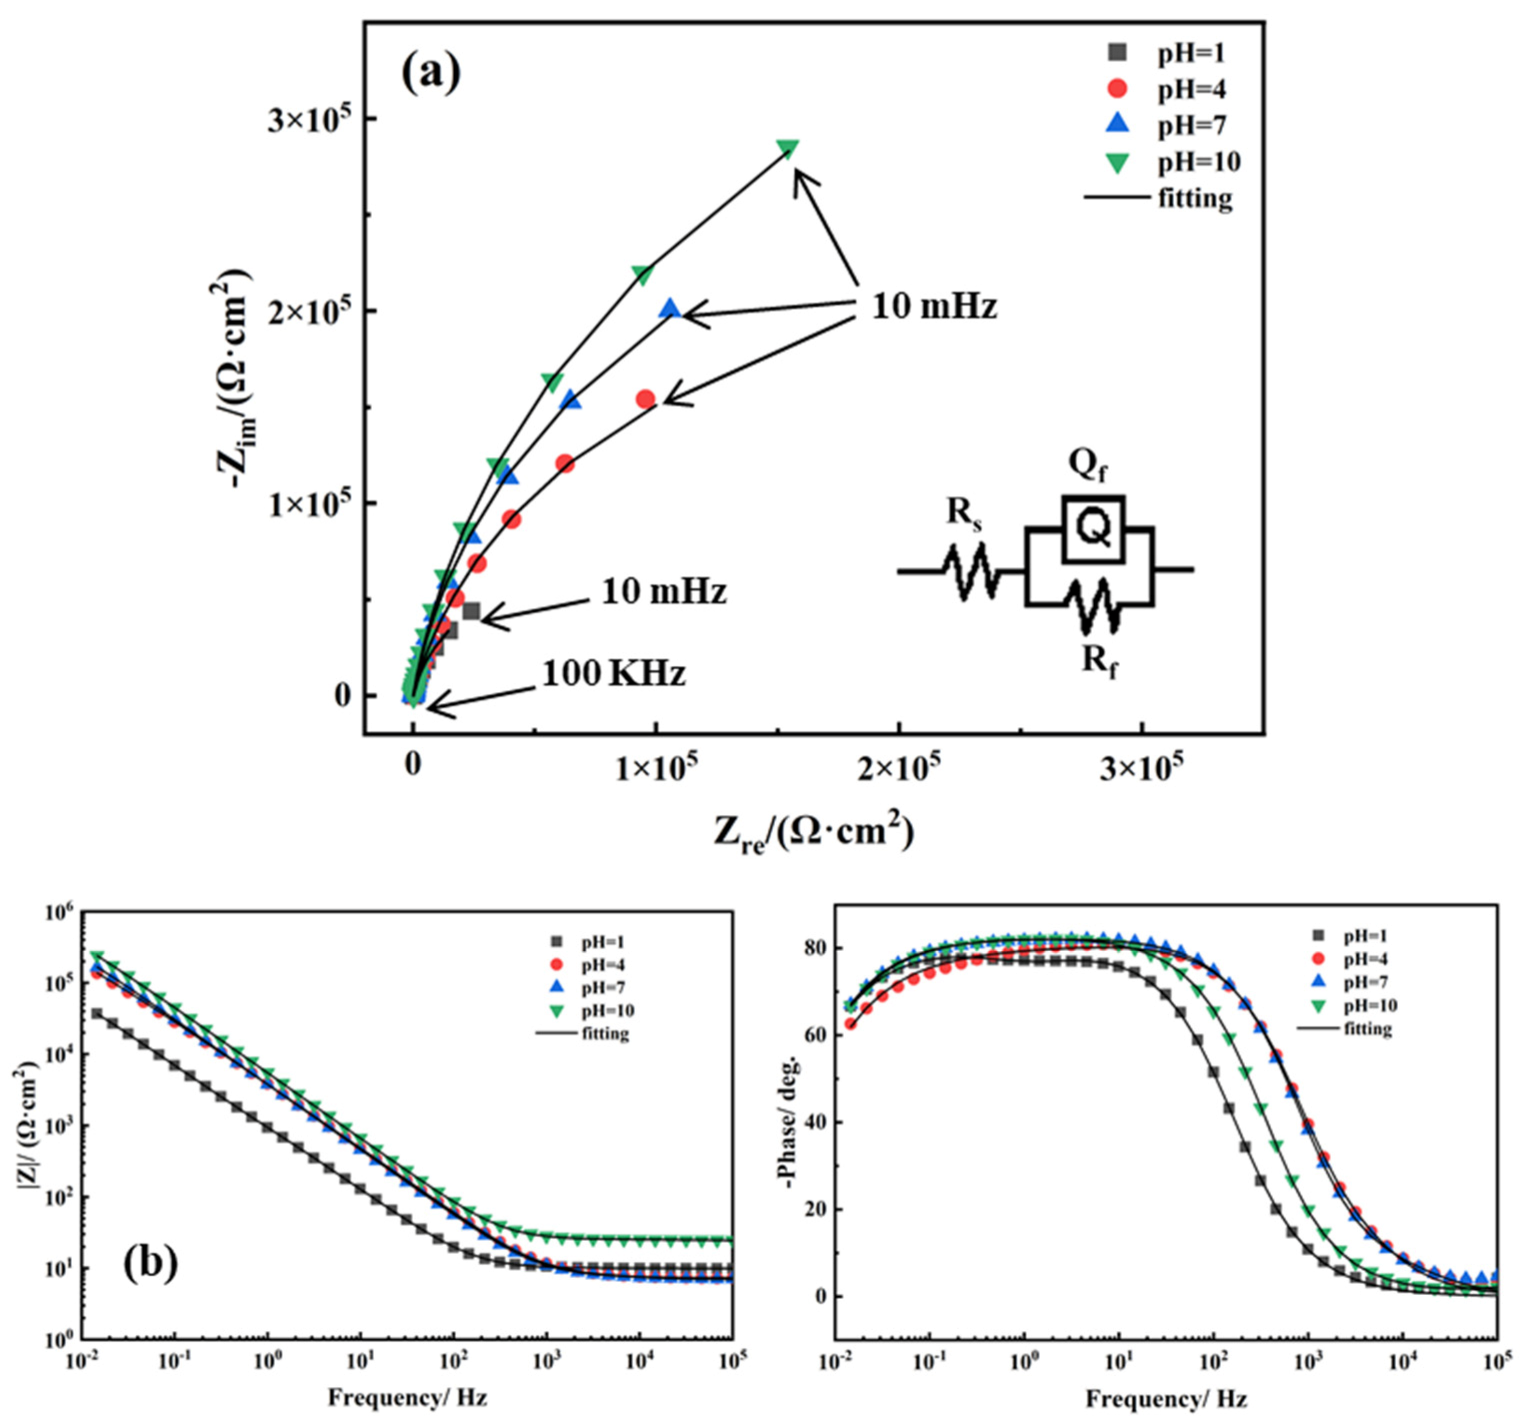
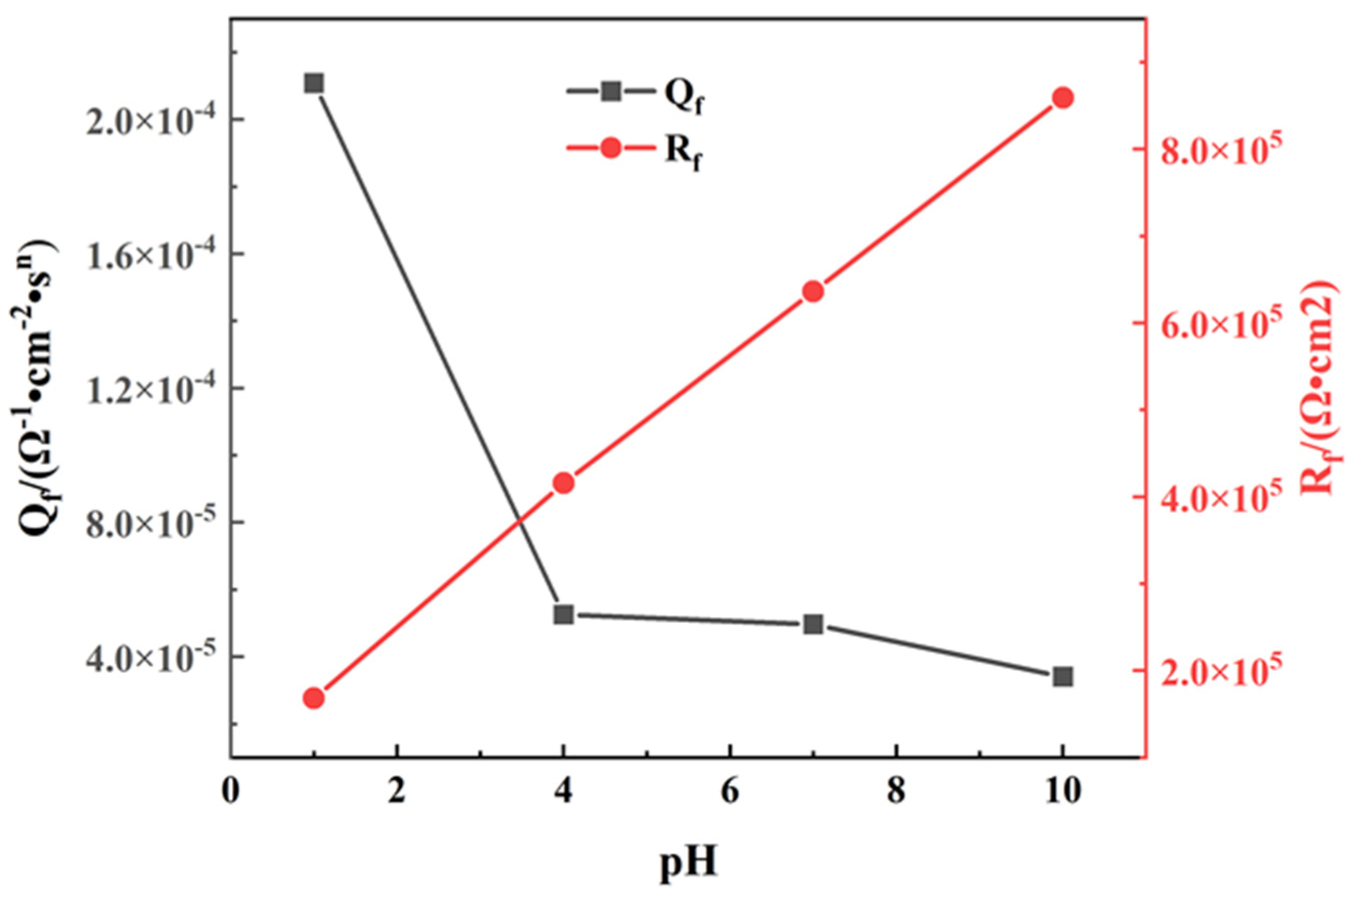
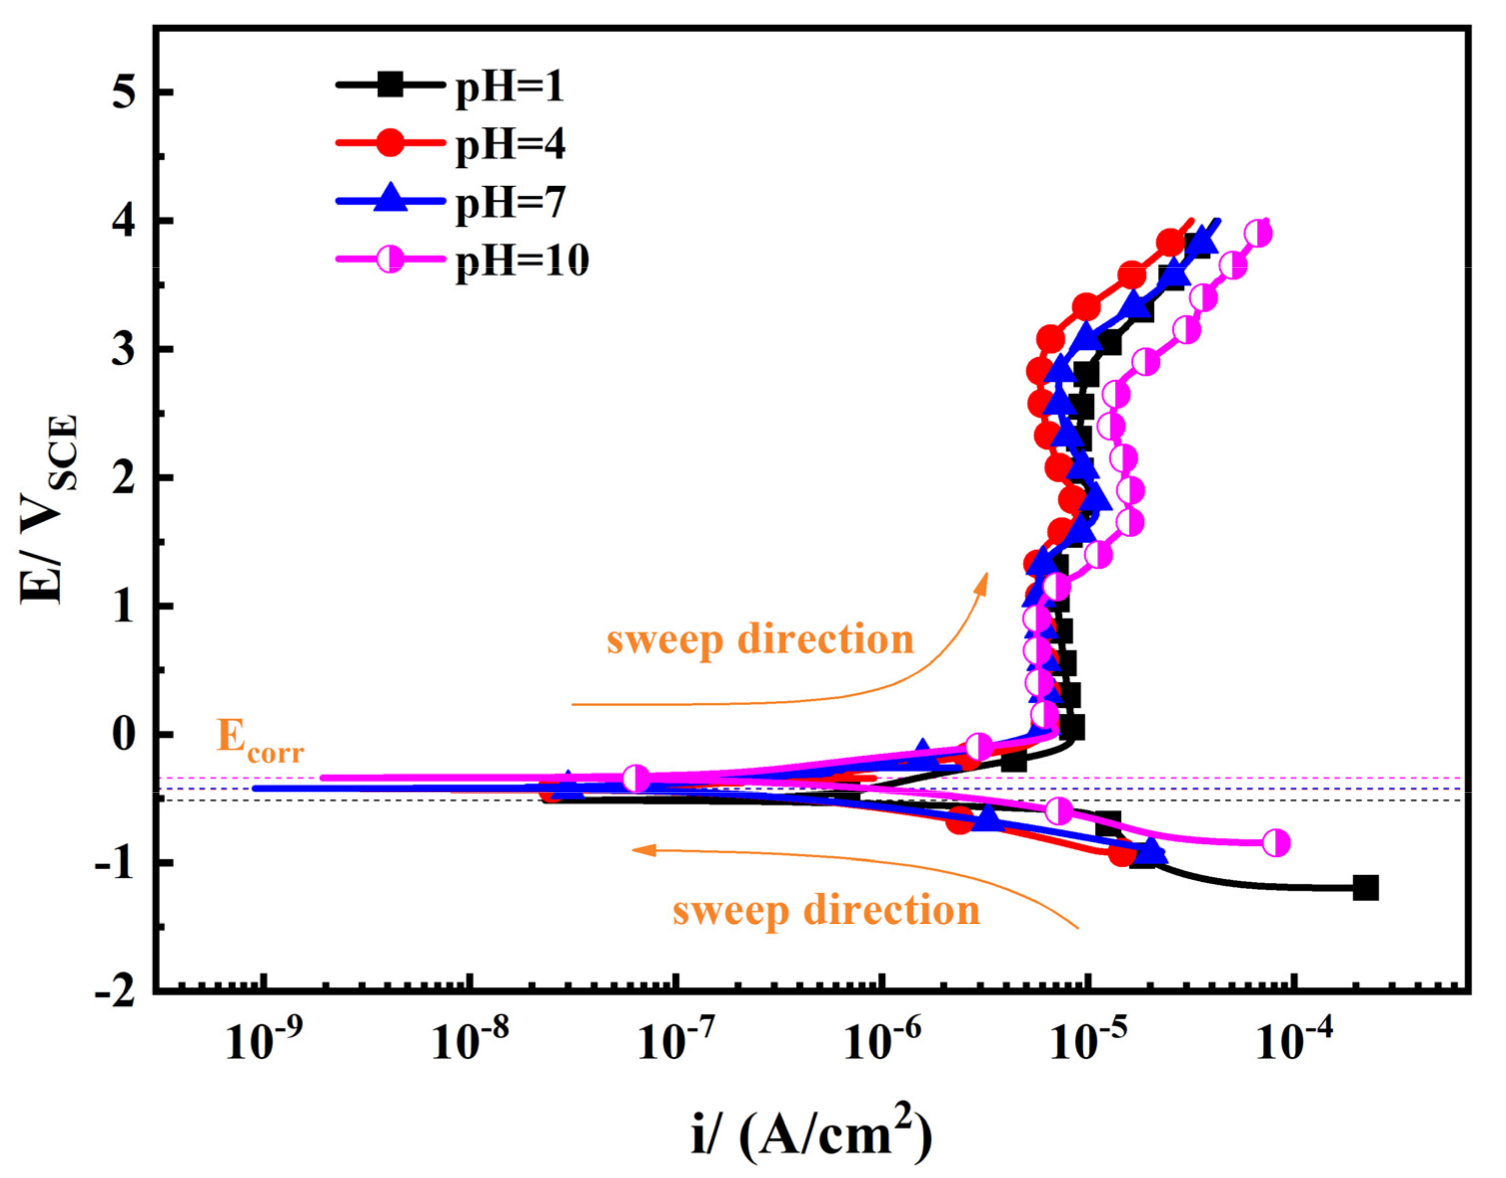
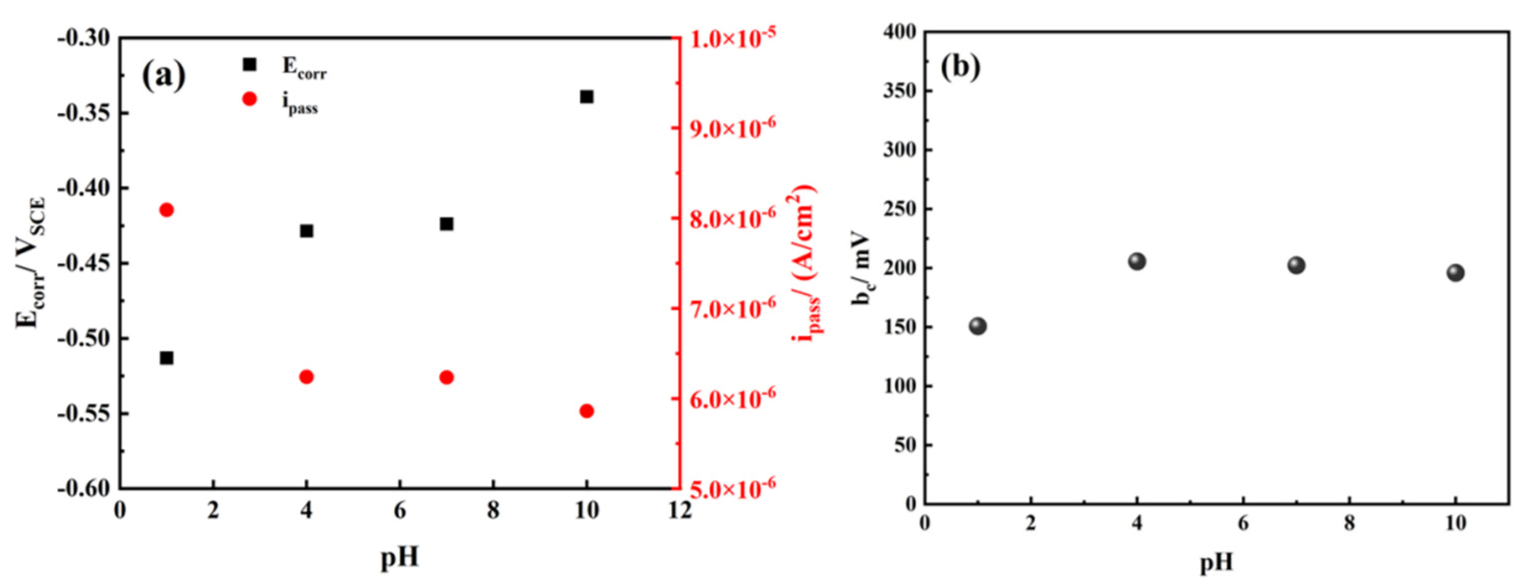
3.1. Electrochemical Characteristics
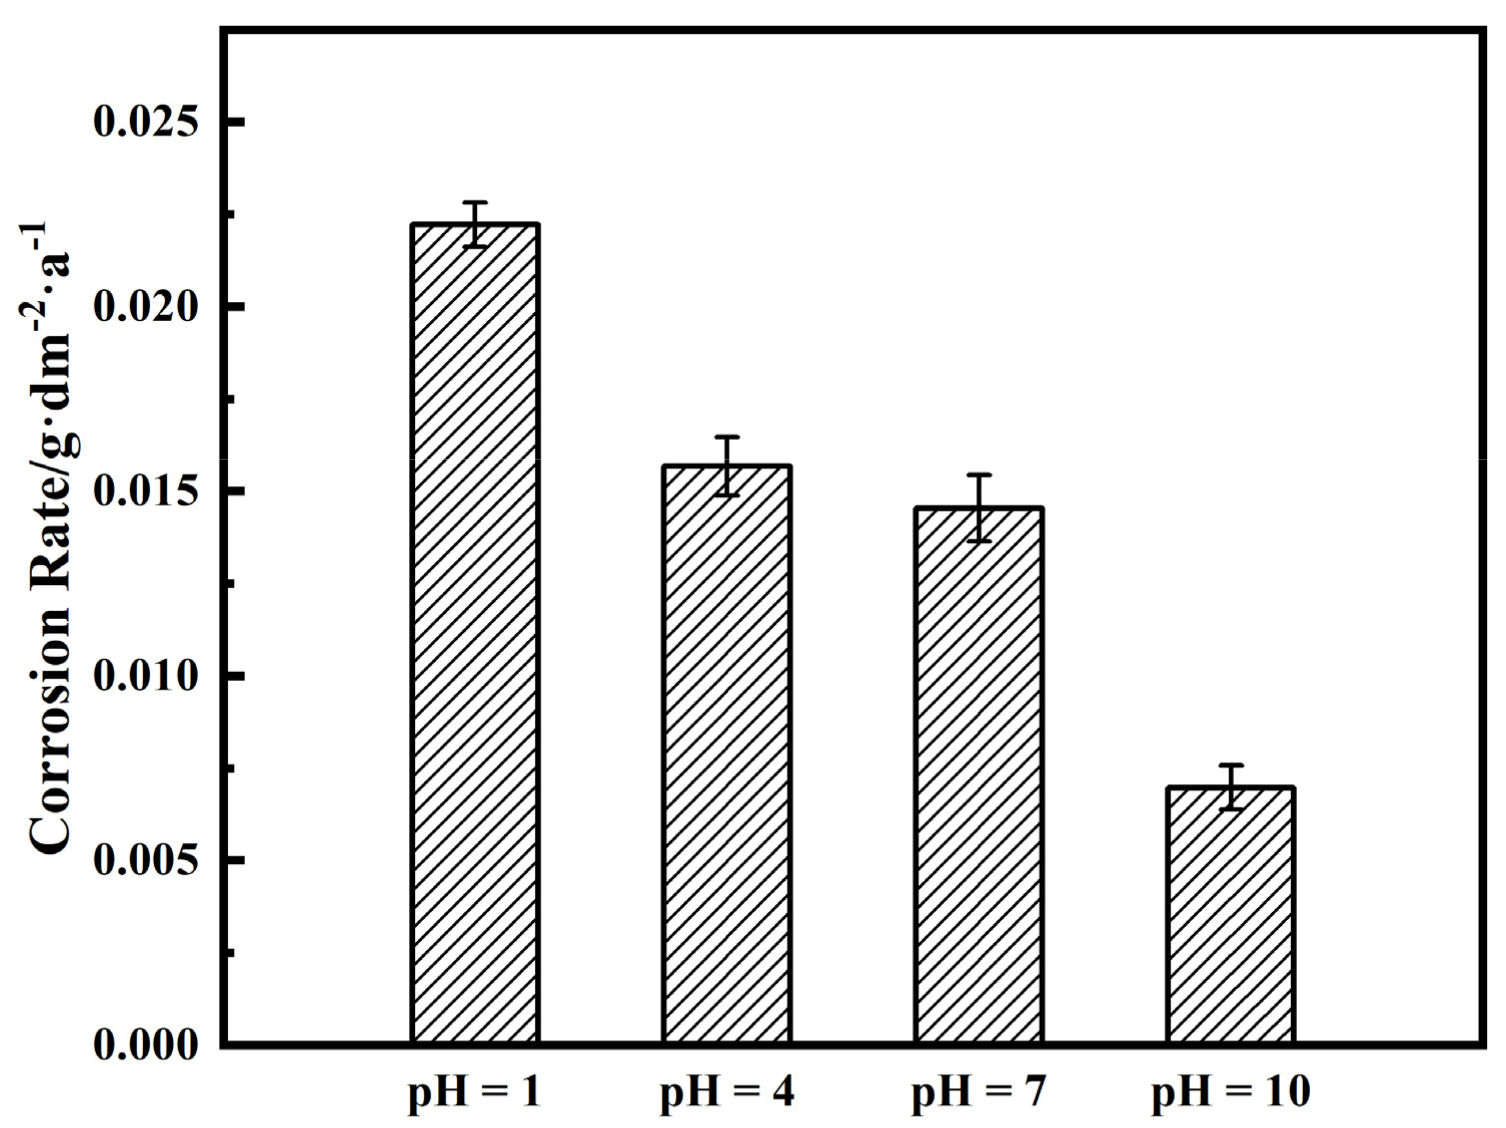
3.2. Immersion Tests
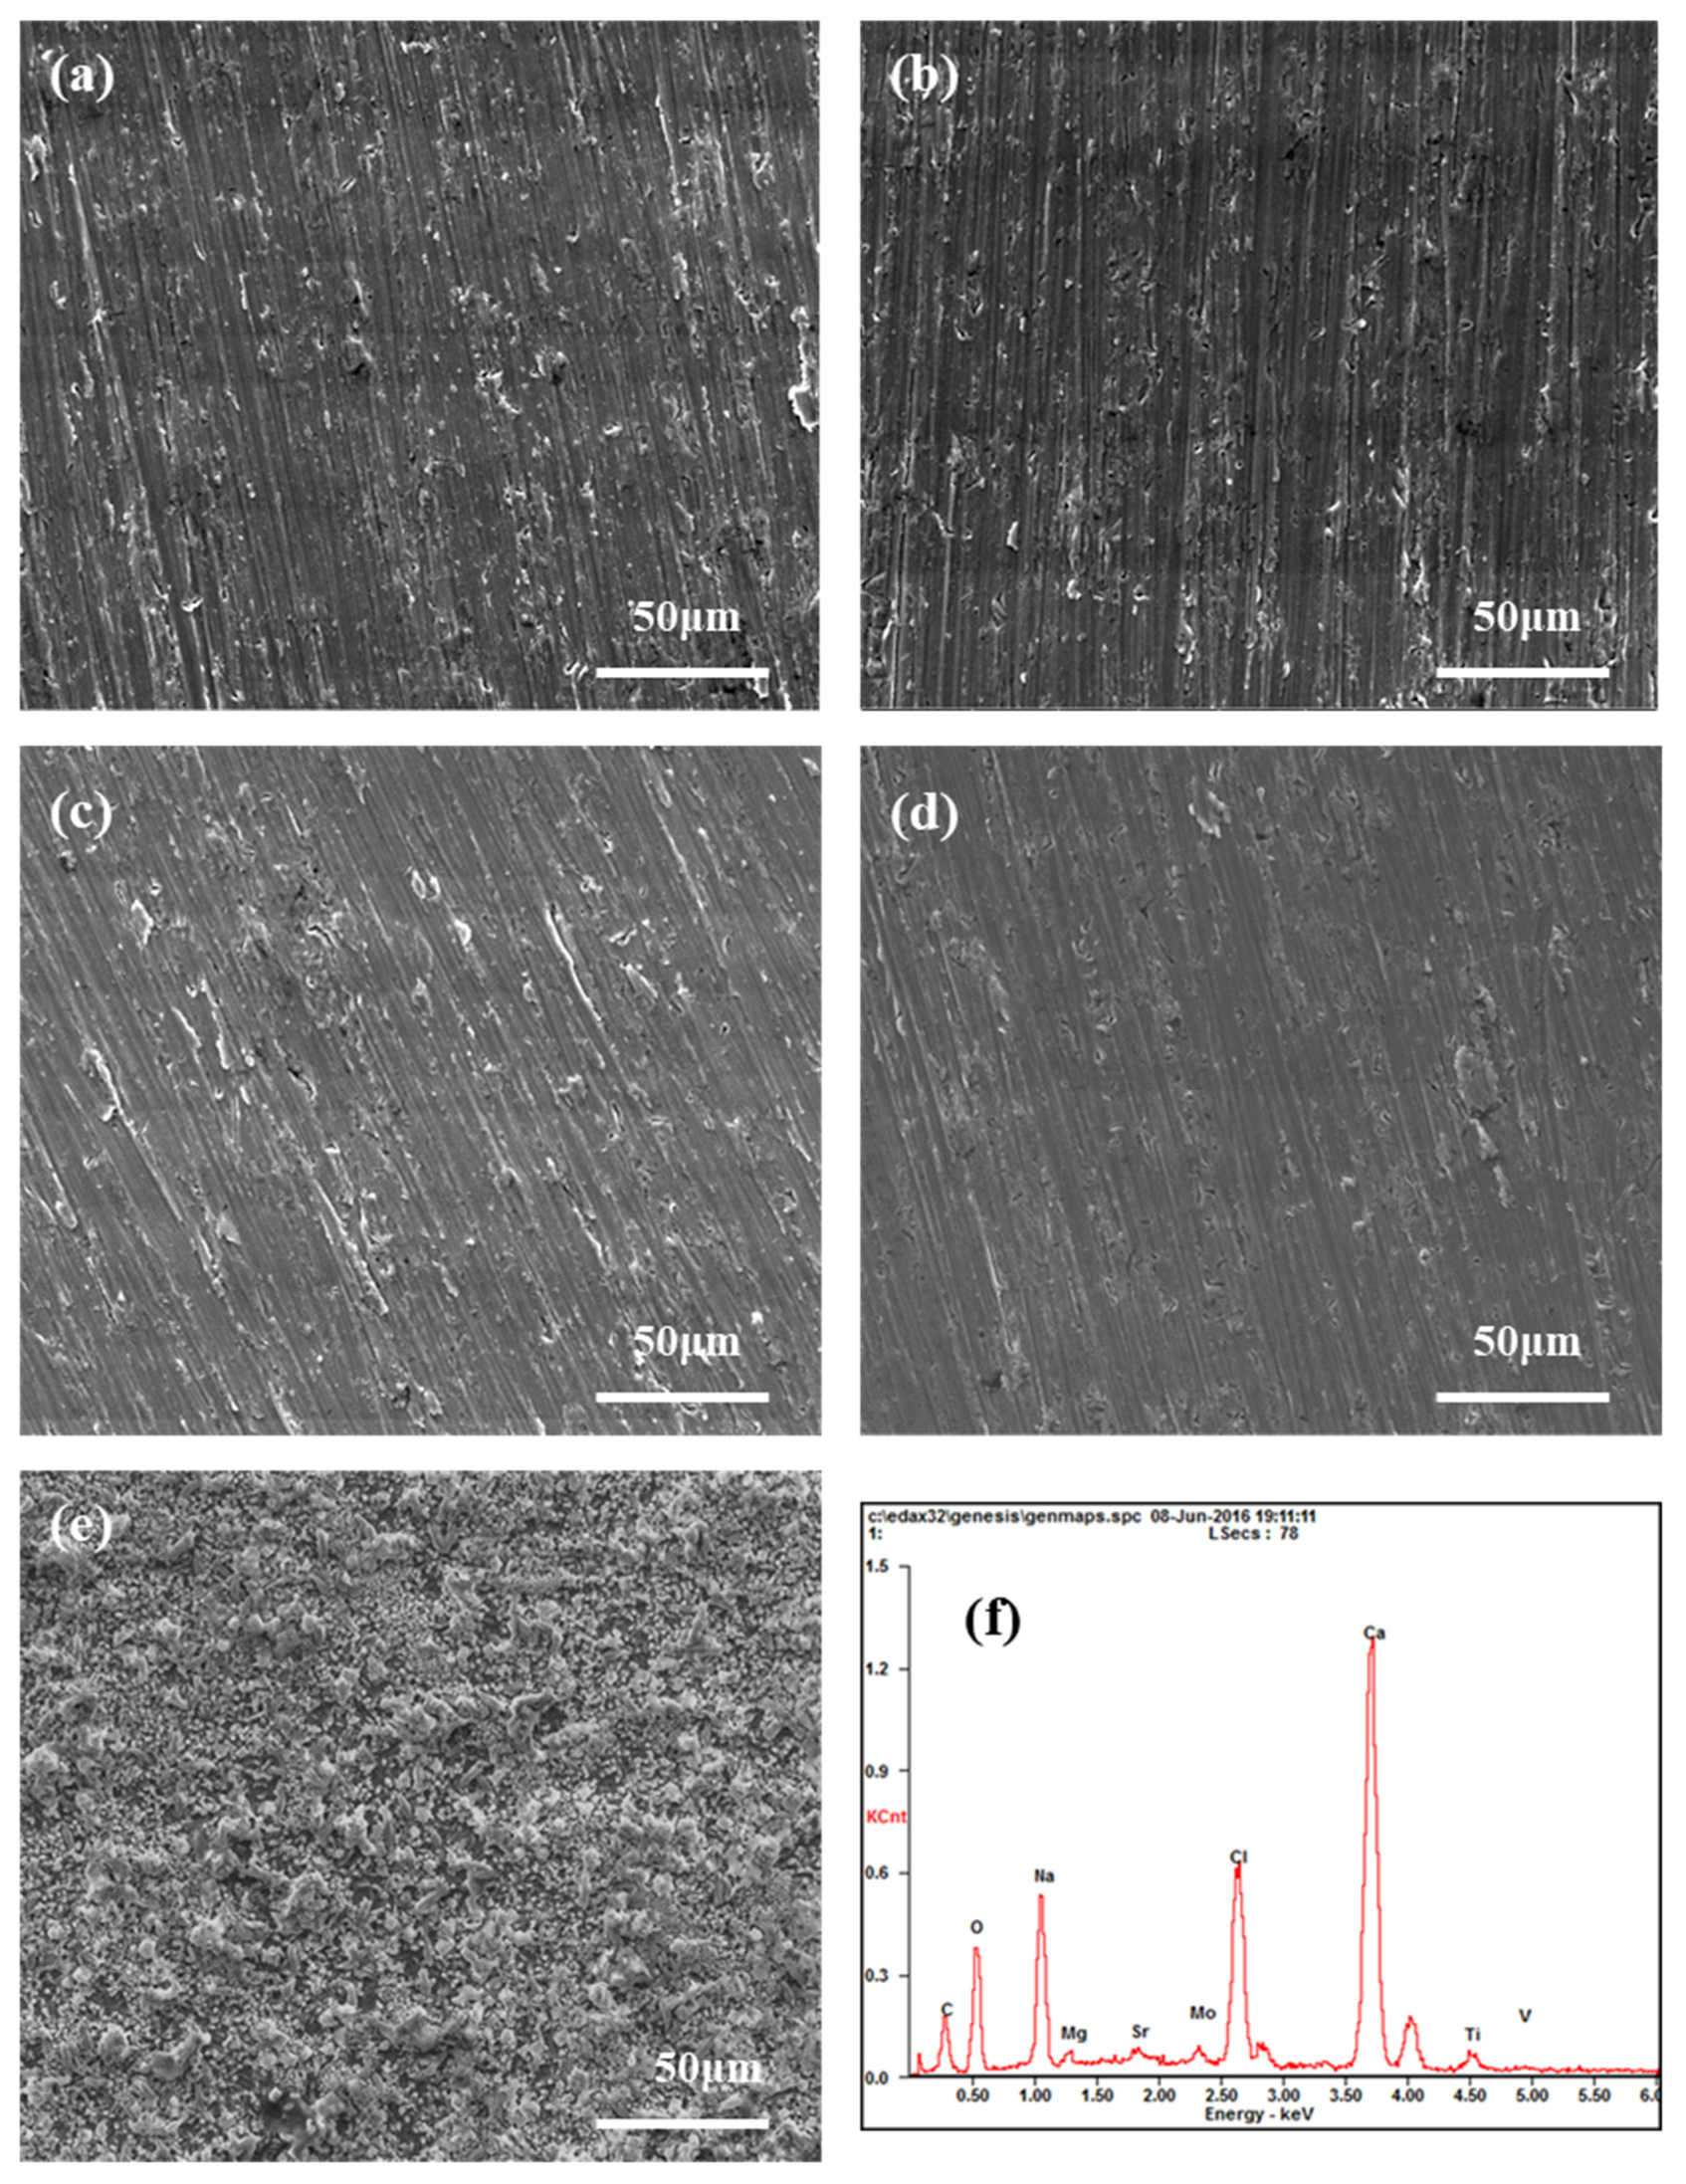
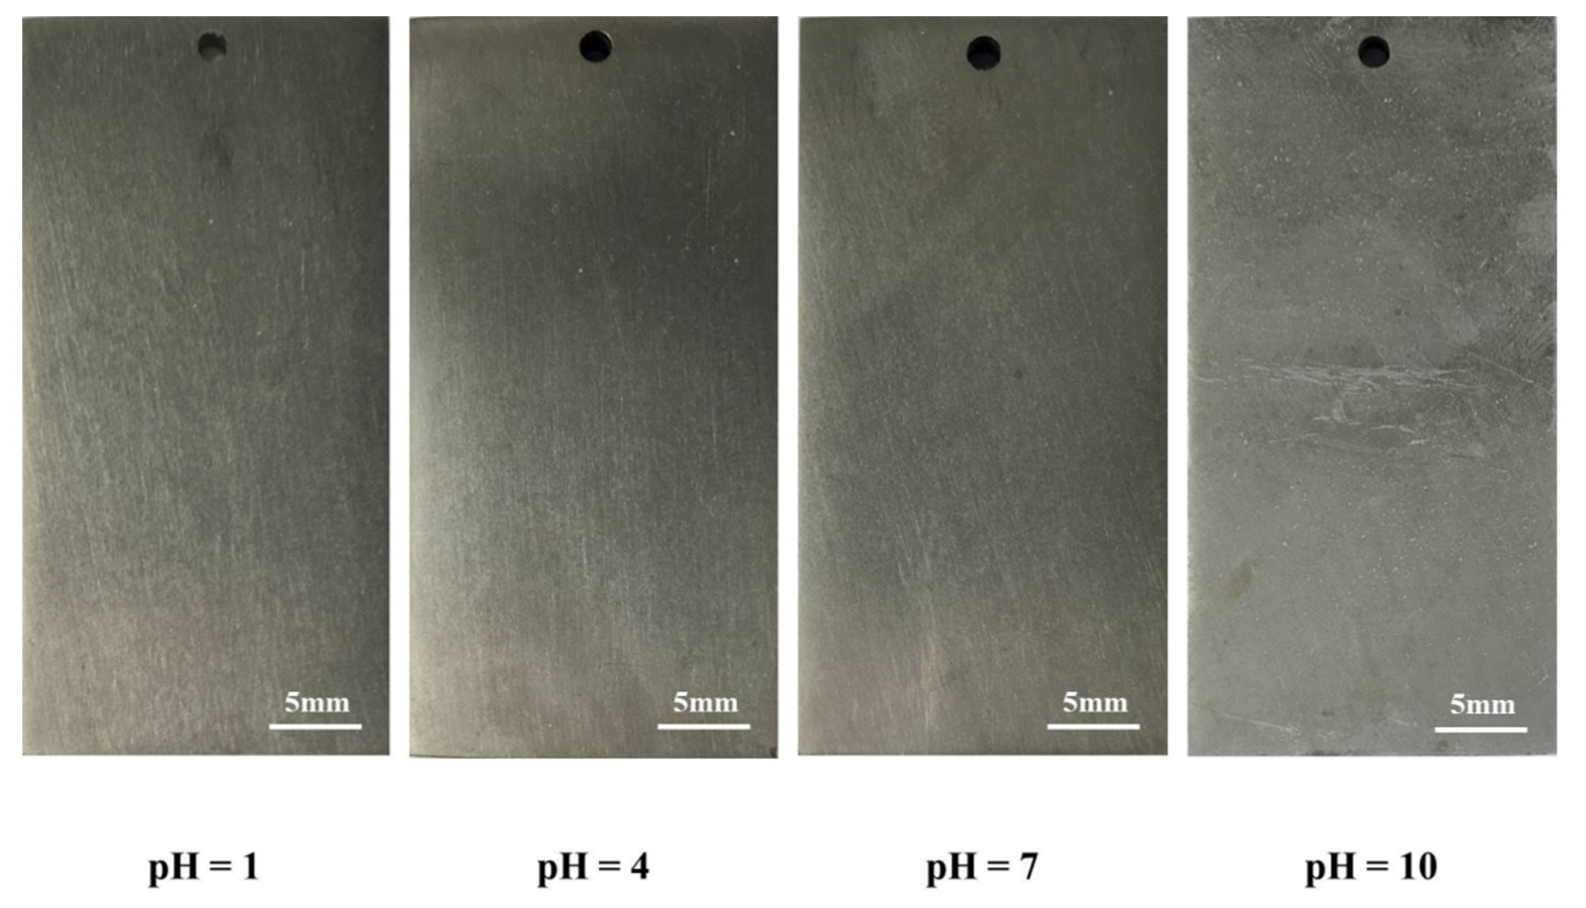
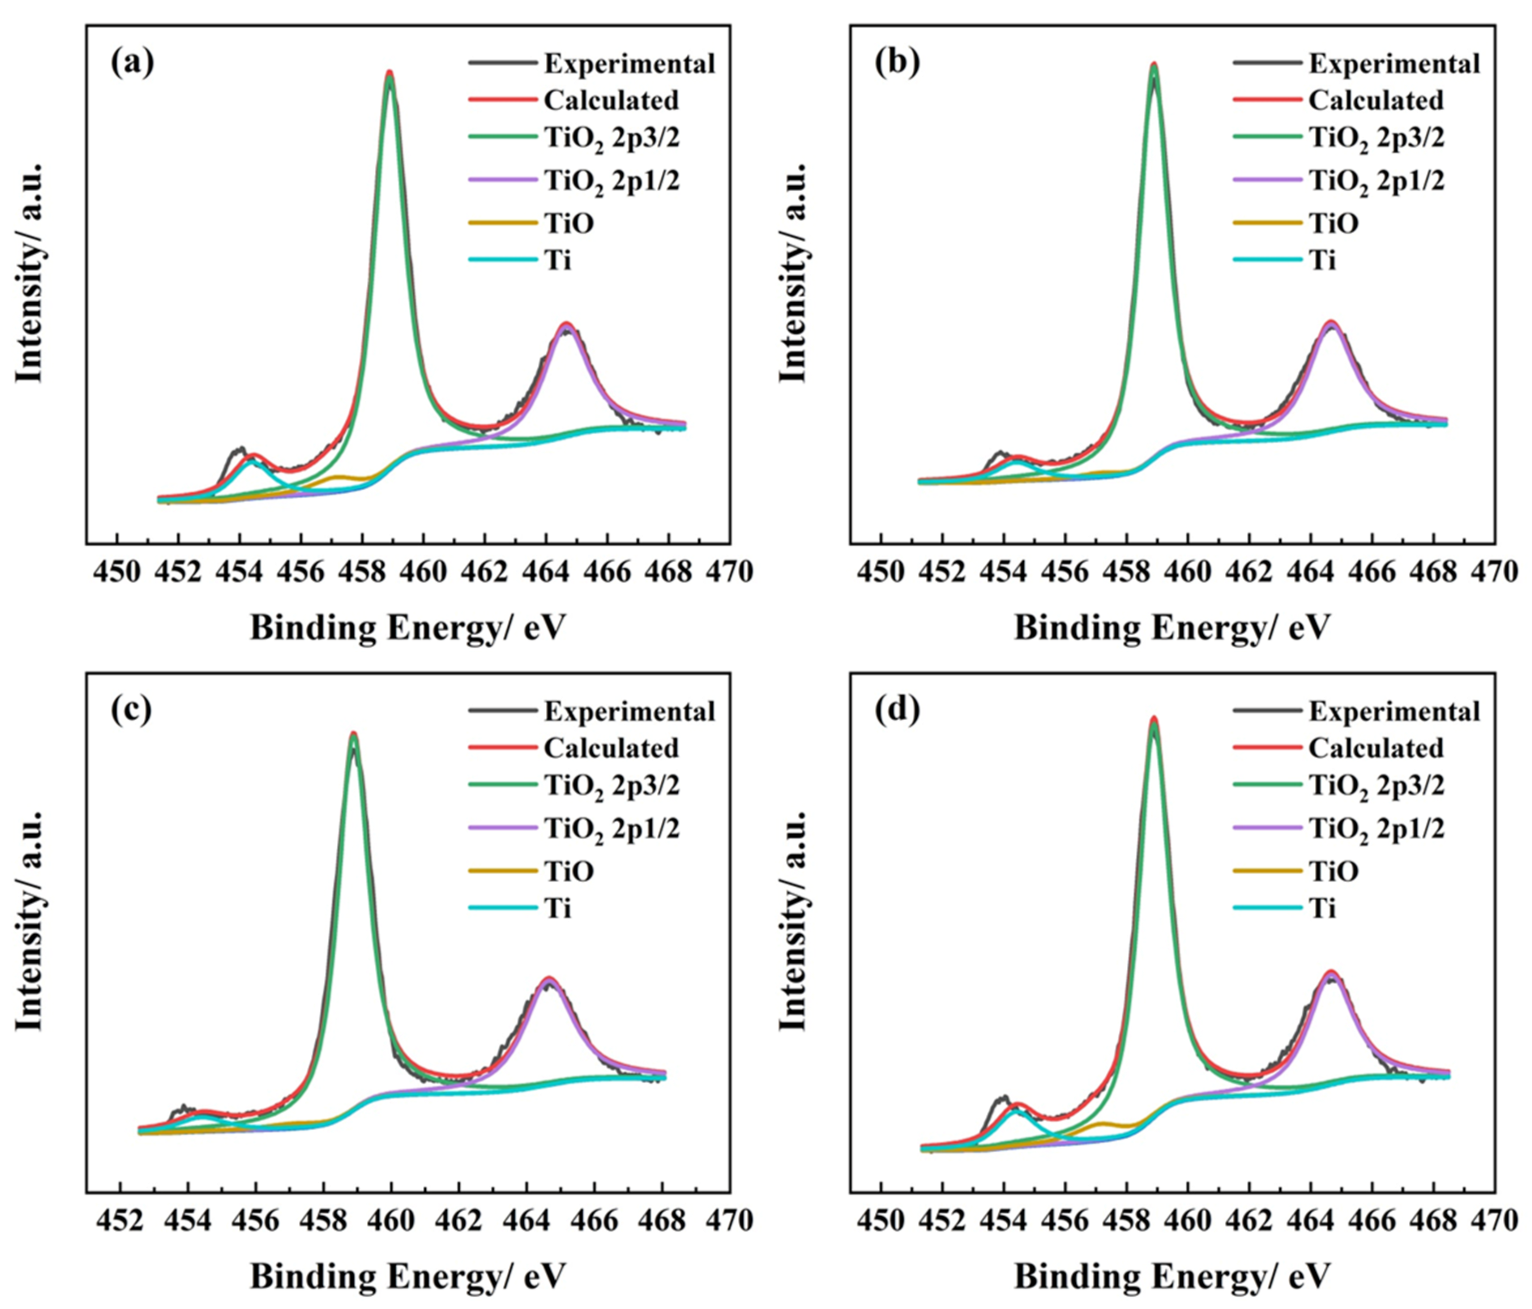
3.3. Morphology Observation and Composition Analysis
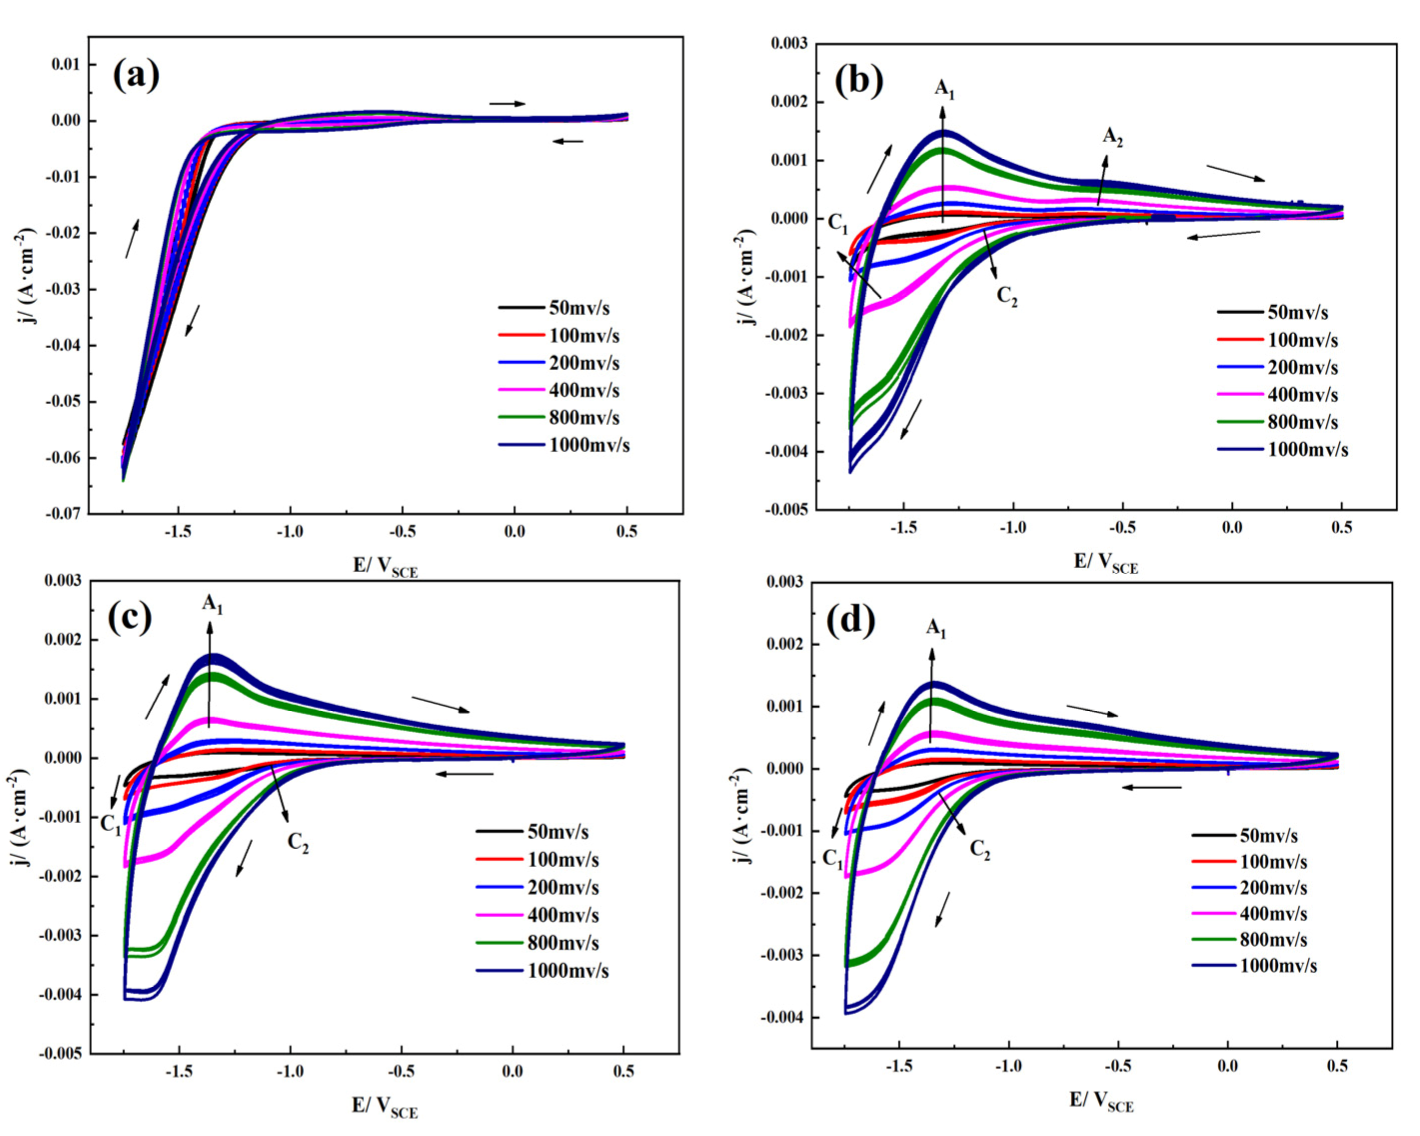
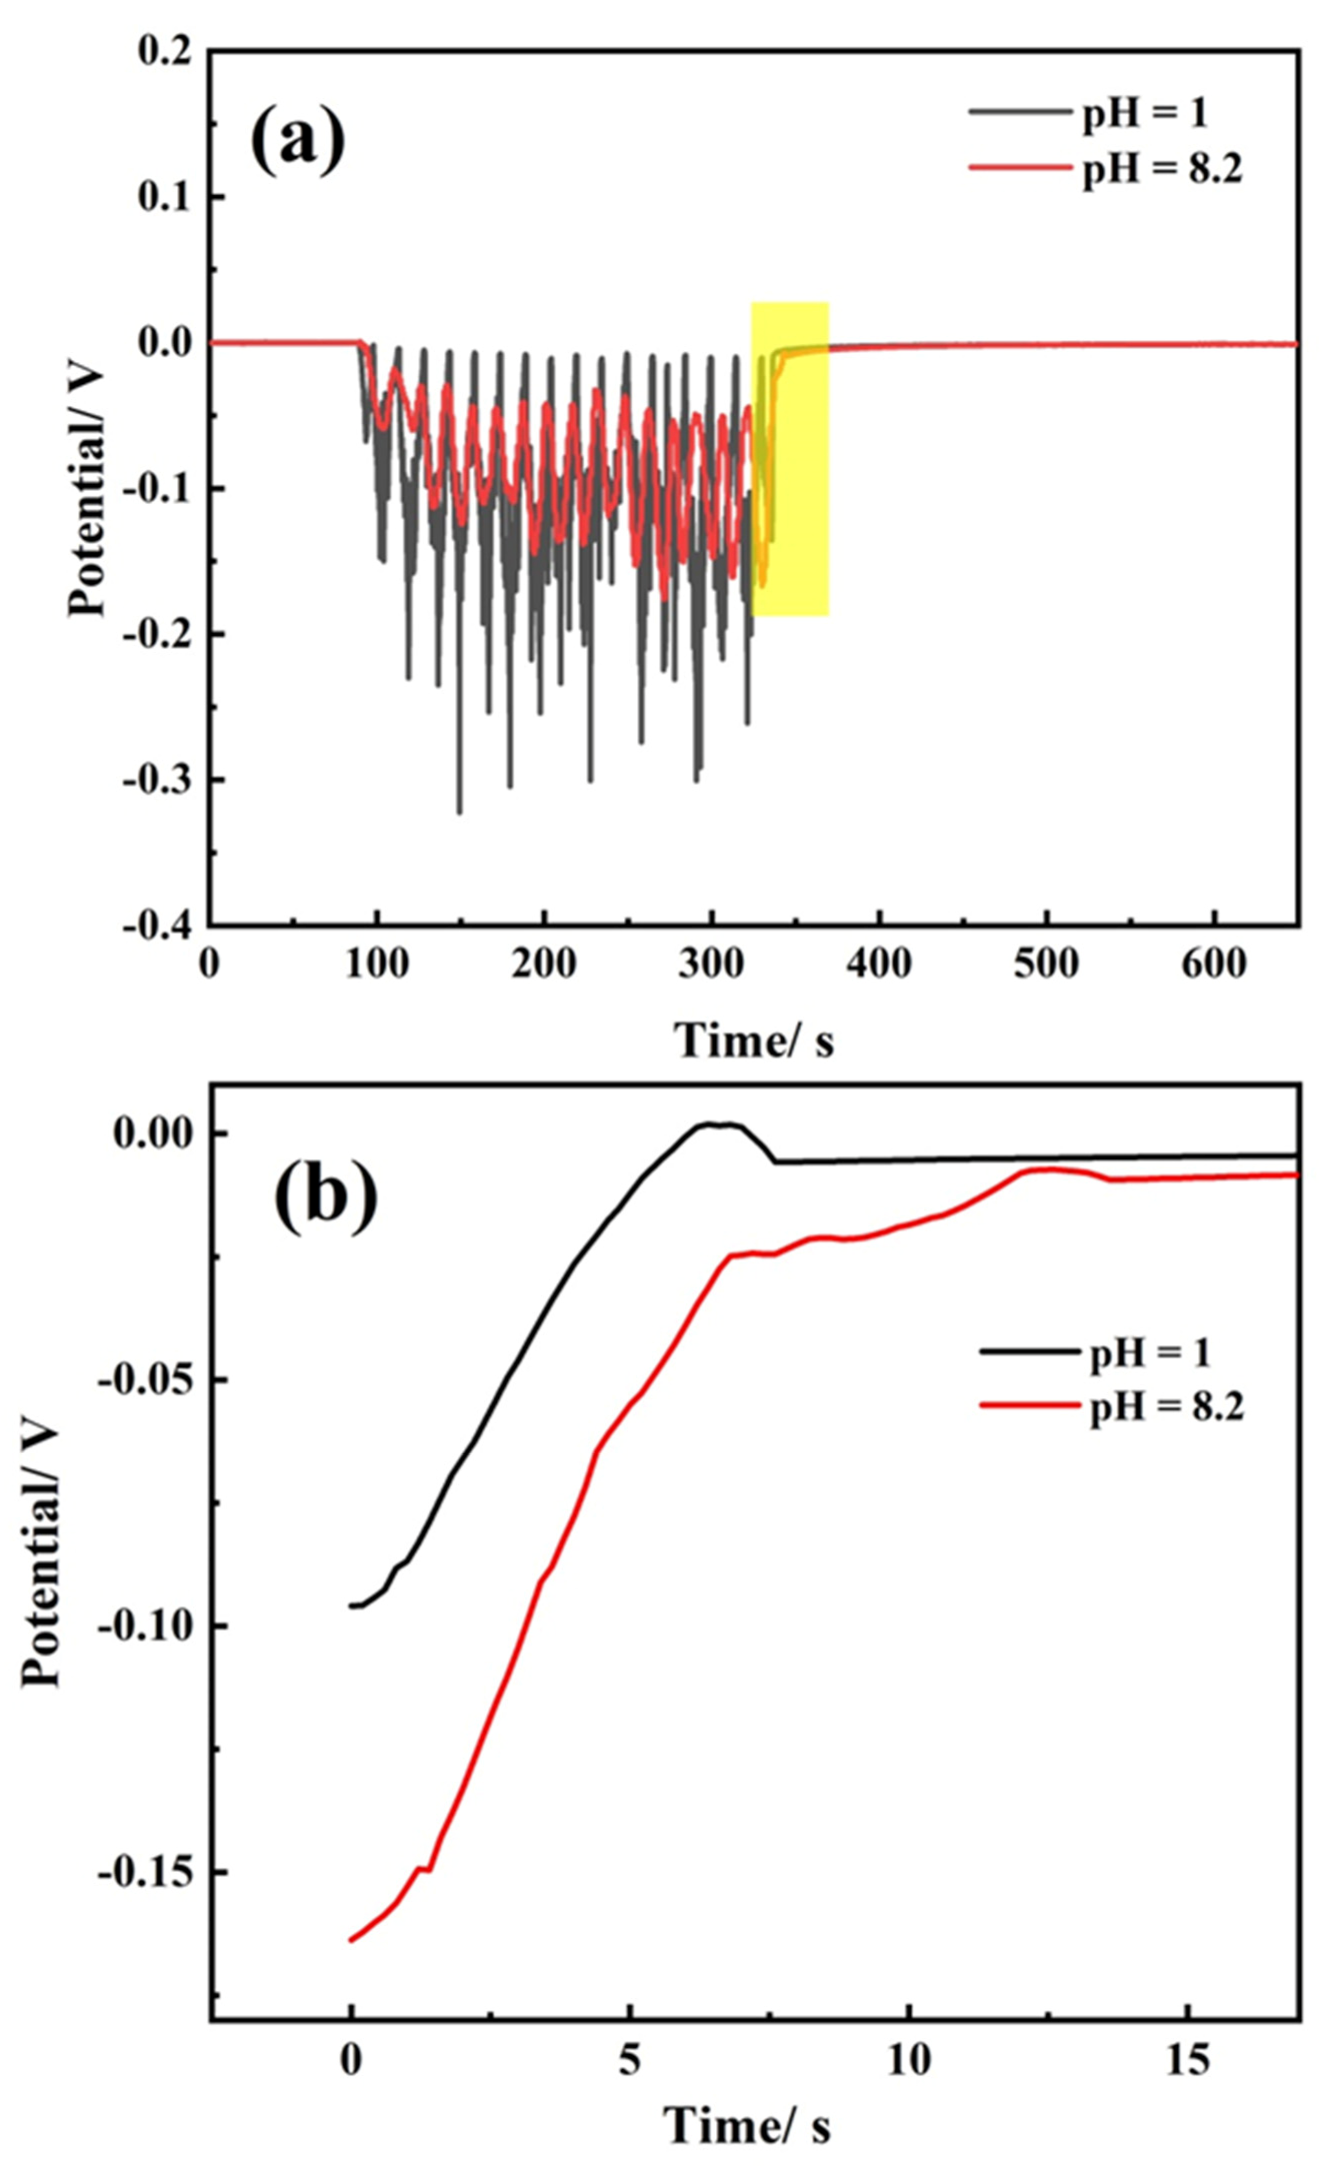
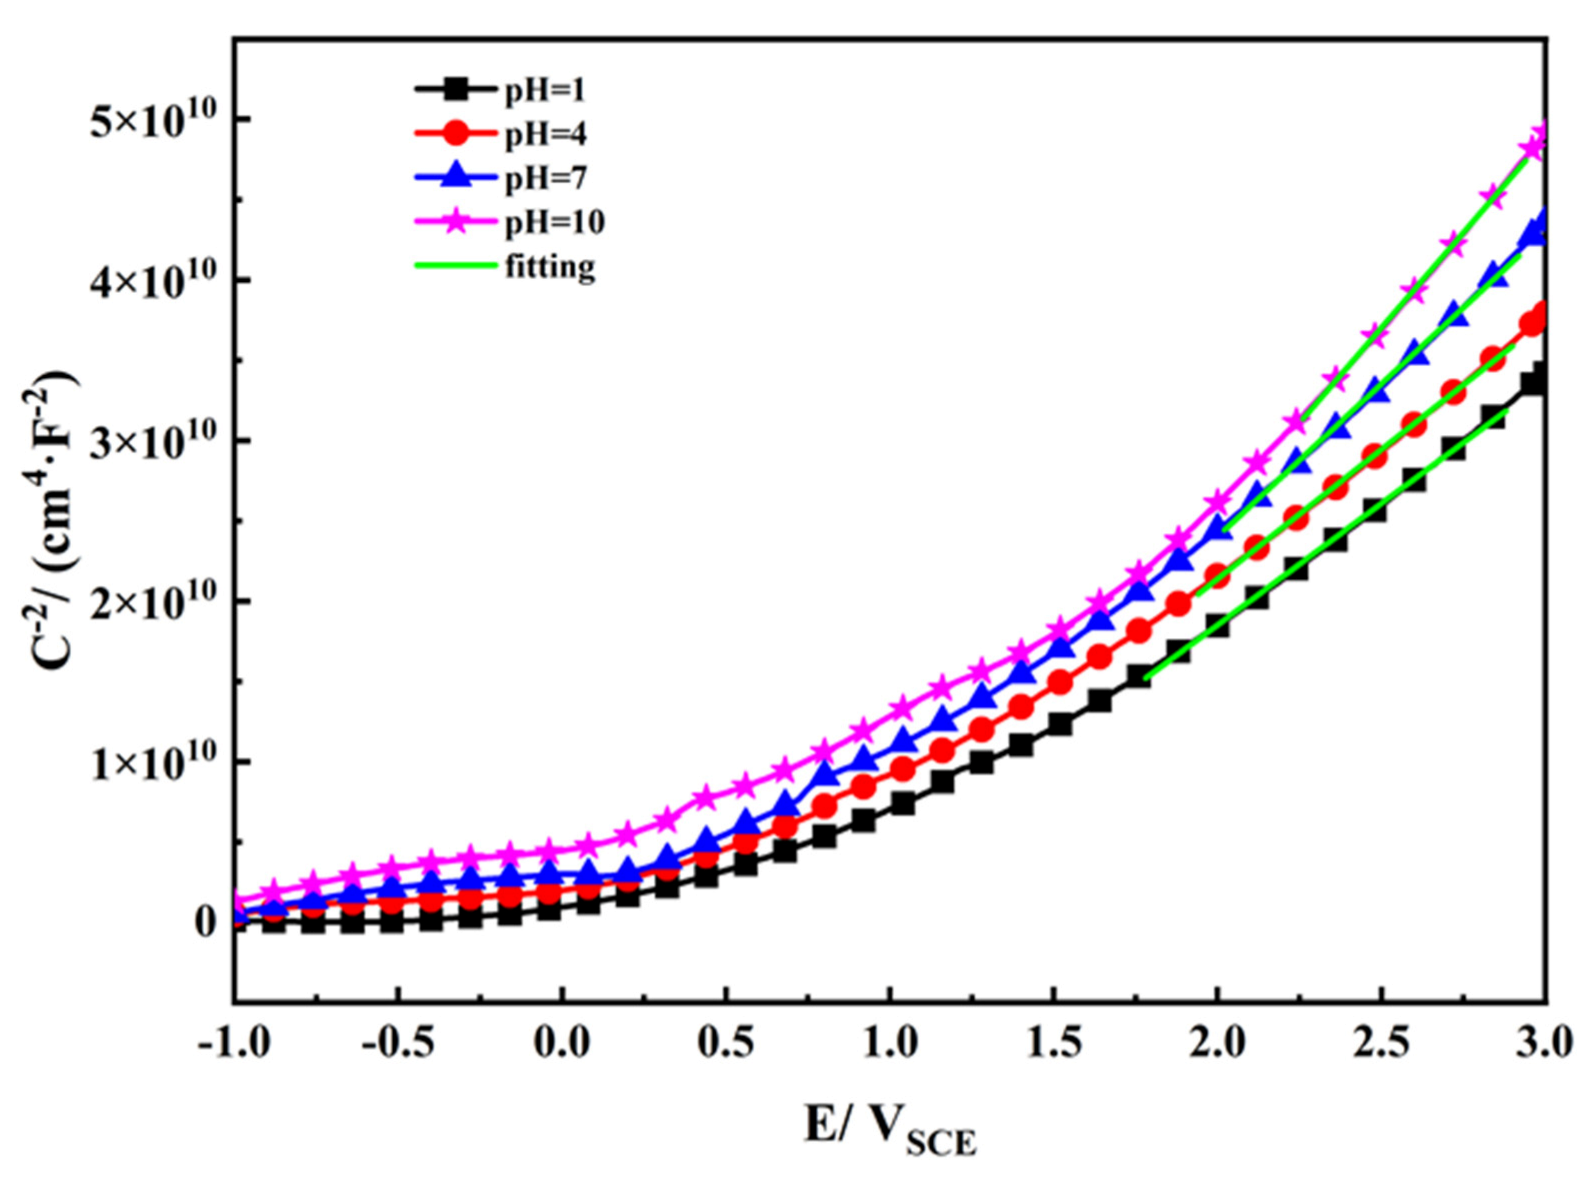
3.4. Repassivation Kinetics
4. Discussion
4.1. Effect of pH on TA2 Corrosion Resistance
4.2. Effect of pH on the Repassivation Behavior of TA2
5. Conclusions
Author Contributions
Funding
Institutional Review Board Statement
Informed Consent Statement
Data Availability Statement
Acknowledgments
Conflicts of Interest
References
- Wen, X.; Bai, P.; Luo, B.; Zheng, S.; Chen, C. Review of recent progress in the study of corrosion products of steels in a hydrogen sulphide environment. Corros. Sci. 2018, 139, 124–140. [Google Scholar] [CrossRef]
- Kong, F.Y.; Hu, G.J.; Li, X. In Stress corrosion cracking of SPV50Q steel in H2S-containing sour environment. Adv. Mater. Res. 2011, 314–316, 1087–1091. [Google Scholar] [CrossRef]
- Pang, J.; Blackwood, D.J. Corrosion of titanium alloys in high temperature near anaerobic seawater. Corros. Sci. 2016, 105, 17–24. [Google Scholar] [CrossRef]
- Wang, L.; Zhang, L.-C. Development and Application of Biomedical Titanium Alloys; Bentham Science Publishers: Sharjah, United Arab Emirates, 2018. [Google Scholar]
- Wang, C.; Wang, H.; Ruan, G.; Wang, S.; Xiao, Y.; Jiang, L. Applications and prospects of titanium and its alloys in seawater desalination industry. In IOP Conference Series: Materials Science and Engineering; IOP Publishing: Bristol, UK, 2019; p. 33036. [Google Scholar]
- Zhang, Y.; Fan, L.; Liu, Z.; Ma, D.; Luo, H.; Yang, X.; Song, L.; Li, X.J.J. Effect of Alternating Magnetic Field on Electrochemical Behavior of 316L and TA2 in Simulated Seawater. J. Mater. Eng. Perform. 2021. Available online: https://link.springer.com/article/10.1007/s11665-021-06131-2 (accessed on 19 August 2021).
- Yang, X.; Du, C.; Wan, H.; Liu, Z.; Li, X.J.A.S.S. Influence of sulfides on the passivation behavior of titanium alloy TA2 in simulated seawater environments. Appl. Surf. Sci. 2018, 458, 198–209. [Google Scholar] [CrossRef]
- Hwang, M.J.; Park, E.J.; Moon, W.J.; Song, H.J.; Park, Y.J. Characterization of passive layers formed on Ti–10 wt% (Ag, Au, Pd, or Pt) binary alloys and their effects on galvanic corrosion. Corros. Sci. 2015, 96, 152–159. [Google Scholar] [CrossRef]
- Liu, Z.; Hou, Q.; Li, C.; Li, X.; Shao, J. Correlation between grain boundaries, carbides and stress corrosion cracking of Alloy 690TT in a high temperature caustic solution with lead. Corros. Sci. 2018, 144, 97–106. [Google Scholar] [CrossRef]
- Bai, Y.; Li, S.J.; Prima, F.; Hao, Y.L.; Yang, R.J.A.S.S. Electrochemical corrosion behavior of Ti-24Nb-4Zr-8Sn alloy in a simulated physiological environment. Appl. Surf. Sci. 2012, 258, 4035–4040. [Google Scholar] [CrossRef]
- Thomas, S.; Birbilis, N.; Venkatraman, M.S.; Cole, I.S. Self-repairing oxides to protect zinc: Review, discussion and prospects. Corros. Sci. 2013, 69, 11–22. [Google Scholar] [CrossRef]
- Gurrappa, I.; Reddy, D.V. Characterisation of titanium alloy, IMI-834 for corrosion resistance under different environmental conditions. J. Alloys Compd. 2005, 390, 270–274. [Google Scholar] [CrossRef]
- Li, D.G.; Wang, J.D.; Chen, D.R.; Liang, P. Influences of pH value, temperature, chloride ions and sulfide ions on the corrosion behaviors of 316L stainless steel in the simulated cathodic environment of proton exchange membrane fuel cell. J. Power Sour. 2014, 272, 448–456. [Google Scholar] [CrossRef]
- Jg, A.; Ms, B.; Xm, C.; Gt, D.; Yz, A. Effects of temperature and pH value on the morphology and corrosion resistance of titanium-containing conversion coating. Appl. Surf. Sci. Adv. 2021, 3, 100060. Available online: https://www.sciencedirect.com/science/article/pii/S2666523921000064 (accessed on 3 March 2021). [CrossRef]
- Rudd, W.J.; Scully, J.C. The function of the repassivation process in the inhibition of pitting corrosion on aluminium. Corros. Sci. 1980, 20, 611–631. [Google Scholar] [CrossRef]
- Barbosa, M.; Scully, J.C. The role of repassivation kinetics in the measurement of the pitting potential of AISI 304 stainless steel by the scratch method. Corros. Sci. 1982, 22, 1025–1036. [Google Scholar] [CrossRef]
- Burstein, G.T.; Marshall, P.I. Growth of passivating films on scratched 304L stainless steel in alkaline solution. Chem. Inf.-Dienst 1983, 14, 125–137. [Google Scholar] [CrossRef]
- Fernández-Domene, R.; Blasco-Tamarit, E.; García-García, D.; García-Antón, J. Cavitation corrosion and repassivation kinetics of titanium in a heavy brine LiBr solution evaluated by using electrochemical techniques and Confocal Laser Scanning Microscopy. Electrochem. Acta 2011, 58, 264–275. [Google Scholar] [CrossRef]
- Sakairi, M.; Kinjyo, M.; Kikuchi, T. Repassivation behavior of titanium in artificial saliva investigated with a photon rupture method. Electrochem. Acta 2011, 56, 1786–1791. [Google Scholar] [CrossRef]
- Sun, B.; Liu, Z.; He, Y.; Cao, F.; Li, X. A new study for healing pitting defects of 316L stainless steel based on microarc technology. Corros. Sci. 2021, 187, 109505. [Google Scholar] [CrossRef]
- Yang, X.; Shao, J.; Liu, Z.; Zhang, D.; Cui, L.; Du, C.; Li, X. Stress-assisted microbiologically influenced corrosion mechanism of 2205 duplex stainless steel caused by sulfate-reducing bacteria. Corros. Sci. 2020, 173, 108746. [Google Scholar] [CrossRef]
- Zhao, T.; Wang, S.; Liu, Z.; Du, C.; Li, X. Effect of cathodic polarisation on stress corrosion cracking behaviour of a Ni (Fe, Al)-maraging steel in artificial seawater. Corros. Sci. 2021, 179, 109176. [Google Scholar] [CrossRef]
- Li, D.; Wang, J.; Chen, D.; Liang, P. Influence of passive potential on the electronic property of the passive film formed on Ti in 0.1 M HCl solution during ultrasonic cavitation. Ultrason. Sonochem. 2016, 29, 48–54. [Google Scholar] [CrossRef]
- Cvijović-Alagić, I.; Cvijović, Z.; Bajat, J.; Rakin, M. Composition and processing effects on the electrochemical characteristics of biomedical titanium alloys. Corros. Sci. 2014, 83, 245–254. [Google Scholar] [CrossRef]
- Assis, S.; Rogero, S.; Antunes, R.; Padilha, A.; Costa, I. A comparative study of the in vitro corrosion behavior and cytotoxicity of a superferritic stainless steel, a Ti-13Nb-13Zr alloy, and an austenitic stainless steel in Hank’s solution. J. Biomed. Mater. Res. Part B Appl. Biomater. Off. J. Soc. Biomater. Jpn. Soc. Biomater. Aust. Soc. Biomater. Korean Soc. Biomater. 2005, 73, 109–116. [Google Scholar] [CrossRef]
- Wang, Z.; Hu, H.; Zheng, Y. Determination and explanation of the pH-related critical fluoride concentration of pure titanium in acidic solutions using electrochemical methods. Electrochem. Acta 2015, 170, 300–310. [Google Scholar] [CrossRef]
- Bai, Y.; Gai, X.; Li, S.; Zhang, L.-C.; Liu, Y.; Hao, Y.; Zhang, X.; Yang, R.; Gao, Y. Improved corrosion behaviour of electron beam melted Ti-6Al–4V alloy in phosphate buffered saline. Corros. Sci. 2017, 123, 289–296. [Google Scholar] [CrossRef]
- Lu, Z.; Macdonald, D.D. Transient growth and thinning of the barrier oxide layer on iron measured by real-time spectroscopic ellipsometry. Electrochem. Acta 2008, 53, 7696–7702. [Google Scholar] [CrossRef]
- González, J.; Santana, A.; Mirza-Rosca, J.C. Effect of bacterial biofilm on 316 SS corrosion in natural seawater by eis. Corros. Sci. 1998, 40, 2141–2154. [Google Scholar] [CrossRef]
- Boissy, C.; Alemany-Dumont, C.; Normand, B. EIS evaluation of steady-state characteristic of 316L stainless steel passive film grown in acidic solution. Electrochem. Commun. 2013, 26, 10–12. [Google Scholar] [CrossRef]
- Jorcin, J.B.; Orazem, M.E.; Pébère, N.; Tribollet, B. CPE analysis by local electrochemical impedance spectroscopy. Electrochem. Acta 2006, 51, 1473–1479. [Google Scholar] [CrossRef]
- Ahmad, H.; Ghosh, S.; Dutta, G.; Maddaus, A.G.; Song, E.J.T.J. The Effects of Impurities on the Electrochemical Characterization of Liquid Phase Exfoliated Niobium Diselenide Nanosheets. J. Phys. Chem. C 2019, 123, 8671–8680. [Google Scholar] [CrossRef]
- He, D.; Li, G.; Shen, D.; Guo, C.; Ma, H.; Cai, J.J.V. Effect mechanism of ultrasound on growth of micro-arc oxidation coatings on A96061 aluminum alloy. Vacuum 2014, 107, 99–102. [Google Scholar] [CrossRef]
- Kaseem, M.; Min, J.H.; Ko, Y.G. Compounds, Corrosion behavior of Al-1wt% Mg-0.85wt%Si alloy coated by micro-arc-oxidation using TiO 2 and Na 2 MoO 4 additives: Role of current density. J. Alloys Compd. 2017, 723, 448–455. [Google Scholar] [CrossRef]
- Yao, Z.; Jiang, Z.; Xin, S.; Sun, X.; Wu, X.J.E.A. Electrochemical impedance spectroscopy of ceramic coatings on Ti–6Al–4V by micro-plasma oxidation. Electrochem. Acta 2005, 50, 3273–3279. [Google Scholar] [CrossRef]
- Cui, Z.; Chen, S.; Dou, Y.; Han, S.; Li, X.J.C.S. Passivation behavior and surface chemistry of 2507 super duplex stainless steel in artificial seawater: Influence of dissolved oxygen and pH. Corros. Sci. 2019, 150, 218–234. [Google Scholar] [CrossRef]
- Kong, D.; Dong, C.; Zhao, M.; Ni, X.; Man, C.; Li, X. Effect of chloride concentration on passive film properties on copper. Corros. Eng. Sci. Technol. 2018, 53, 122–130. [Google Scholar] [CrossRef]
- Macdonald, D.D. The history of the point defect model for the passive state: A brief review of film growth aspects. Electrochem. Acta 2011, 56, 1761–1772. [Google Scholar] [CrossRef]
- Cui, Z.; Chen, S.; Wang, L.; Man, C.; Liu, Z.; Wu, J.; Wang, X.; Chen, S.; Li, X. Passivation behavior and surface chemistry of 2507 super duplex stainless steel in acidified artificial seawater containing thiosulfate. J. Electrochem. Soc. 2017, 164, C856. [Google Scholar] [CrossRef]
- Wei, L.A.; Ltl, B.; Zxla, B.; Yfw, B.; Hzl, B.; Jjl, C.J.D.; Materials, R. Corrosion resistance and conductivity of amorphous carbon coated SS316L and TA2 bipolar plates in proton-exchange membrane fuel cells. Diam. Relat. Mater. 2021, 118, 108503. Available online: https://www.sciencedirect.com/science/article/abs/pii/S0925963521002661 (accessed on 1 October 2021). [CrossRef]
- Ren, S.; Du, C.; Liu, Z.; Li, X.; Xiong, J.; Li, S.J.A.S.S. Effect of fluoride ions on corrosion behaviour of commercial pure titanium in artificial seawater environment. Appl. Surf. Sci. 2020, 506, 144759. [Google Scholar] [CrossRef]
- Wang, Z.; Hu, H.; Zheng, Y.; Ke, W.; Qiao, Y.J.C.S. Comparison of the corrosion behavior of pure titanium and its alloys in fluoride-containing sulfuric acid. Corros. Sci. 2016, 103, 50–65. [Google Scholar] [CrossRef]
- Wei, W.; Jing, L.; Liu, Z.; Cui, L.; Du, C.; Li, X. Surface characterization of the commercially pure titanium after hydrogen charging and its electrochemical characteristics in artificial seawater. J. Electroanal. Chem. 2018, 822, 23–32. [Google Scholar]
- Kocijan, A.; Donik, Č.; Jenko, M. Electrochemical and XPS studies of the passive film formed on stainless steels in borate buffer and chloride solutions. Corros. Sci. 2007, 49, 2083–2098. [Google Scholar] [CrossRef]
- Feng, Z.; Cheng, X.; Dong, C.; Xu, L.; Li, X. Passivity of 316L stainless steel in borate buffer solution studied by Mott–Schottky analysis, atomic absorption spectrometry and X-ray photoelectron spectroscopy. Corros. Sci. 2010, 52, 3646–3653. [Google Scholar] [CrossRef]
- Cho, E.-A.; Kim, C.-K.; Kim, J.-S.; Kwon, H.-S. Quantitative analysis of repassivation kinetics of ferritic stainless steels based on the high field ion conduction model. Electrochem. Acta 2000, 45, 1933–1942. [Google Scholar] [CrossRef]
- Liu, Z.; Hao, W.; Wu, W.; Luo, H.; Li, X. Fundamental investigation of stress corrosion cracking of E690 steel in simulated marine thin electrolyte layer. Corros. Sci. 2019, 148, 388–396. [Google Scholar] [CrossRef]


| pH | 1 | 4 | 7 | 10 |
|---|---|---|---|---|
| Ecorr/mVSCE | −0.5131 | −0.4285 | −0.4239 | −0.3392 |
| Ipass/μA·cm−2 | 8.09 | 6.24 | 6.23 | 5.86 |
| bc/mV | 150 | 205 | 202 | 196 |
| Rs/(Ω·cm2) | Qf/(10−5Ω−1·cm−2·sn) | n | Rf/(105 Ω·cm2) | Ceff/(10−5 F·cm−2) | |
|---|---|---|---|---|---|
| pH = 1 | 9.873 | 20.1089 | 0.88 | 1.681 | 8.61 |
| pH = 4 | 7.374 | 5.259 | 0.89 | 4.157 | 1.99 |
| pH = 7 | 7.295 | 4.969 | 0.91 | 6.362 | 2.27 |
| pH = 10 | 24.95 | 3.411 | 0.92 | 8.594 | 1.84 |
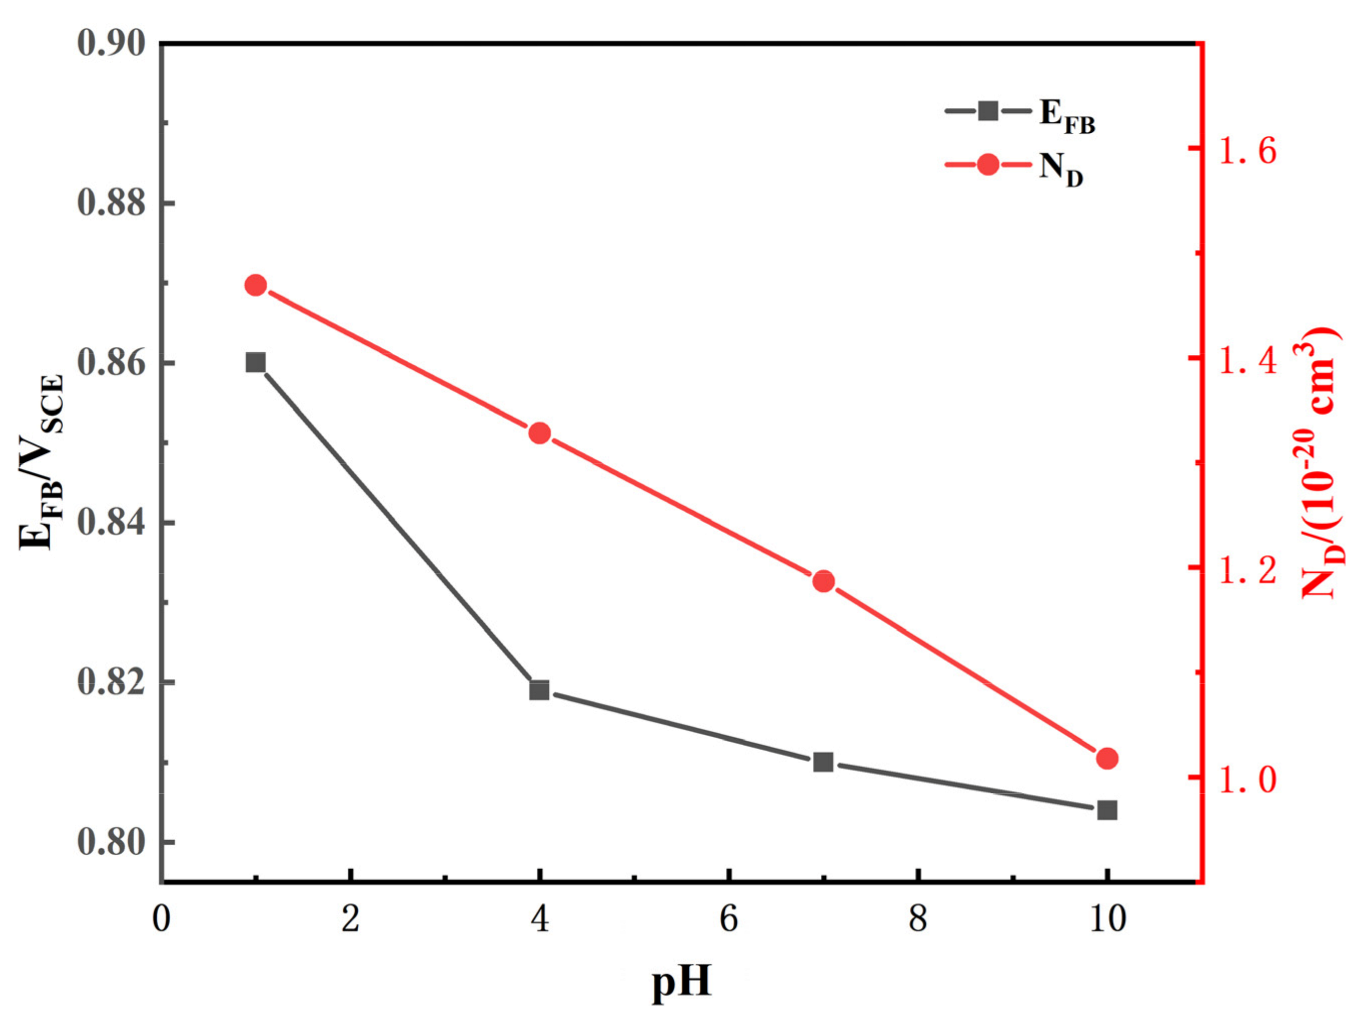
| pH | 1 | 4 | 7 | 10 |
|---|---|---|---|---|
| EFB/VSCE | 0.860 | 0.819 | 0.810 | 0.804 |
| ND/(10−20 cm3) | 1.469 | 1.328 | 1.187 | 1.018 |
| Composition | pH = 1 | pH = 4 | pH = 7 | pH = 10 |
|---|---|---|---|---|
| TiO2 | 88.62% | 94.28% | 94.31% | 88.11% |
| TiO | 3.89% | 1.17% | 1.73% | 4.42% |
| Ti | 7.48% | 4.55% | 3.96% | 7.46% |
| pH = 8.2 | Error | pH = 1 | Error | |
|---|---|---|---|---|
| a | −0.1375 | 0.00822 | −0.1228 | 0.00847 |
| b | 0.0532 | 0.00342 | 0.0519 | 0.00347 |
| c | −1.241 | 0.01684 | −1.420 | 0.02109 |
Publisher’s Note: MDPI stays neutral with regard to jurisdictional claims in published maps and institutional affiliations. |
© 2021 by the authors. Licensee MDPI, Basel, Switzerland. This article is an open access article distributed under the terms and conditions of the Creative Commons Attribution (CC BY) license (https://creativecommons.org/licenses/by/4.0/).
Share and Cite
Zhang, Y.; Yan, T.; Fan, L.; Liu, Z.; Song, L.; Li, X. Effect of pH on the Corrosion and Repassivation Behavior of TA2 in Simulated Seawater. Materials 2021, 14, 6764. https://doi.org/10.3390/ma14226764
Zhang Y, Yan T, Fan L, Liu Z, Song L, Li X. Effect of pH on the Corrosion and Repassivation Behavior of TA2 in Simulated Seawater. Materials. 2021; 14(22):6764. https://doi.org/10.3390/ma14226764
Chicago/Turabian StyleZhang, Yingxiao, Tingting Yan, Lin Fan, Zhiyong Liu, Longfei Song, and Xiaogang Li. 2021. "Effect of pH on the Corrosion and Repassivation Behavior of TA2 in Simulated Seawater" Materials 14, no. 22: 6764. https://doi.org/10.3390/ma14226764
APA StyleZhang, Y., Yan, T., Fan, L., Liu, Z., Song, L., & Li, X. (2021). Effect of pH on the Corrosion and Repassivation Behavior of TA2 in Simulated Seawater. Materials, 14(22), 6764. https://doi.org/10.3390/ma14226764