Article

Effect of CeO2 Size on Microstructure, Synthesis Mechanism and Refining Performance of Al-Ti-C Alloy

1
Technology Center, Jiuquan Iron and Steel (Group) Co., Ltd., Jiayuguan 735100, China
2
School of Materials Science and Engineering, Lanzhou University of Technology, Lanzhou 730050, China
*
Author to whom correspondence should be addressed.
Materials 2021, 14(22), 6739; https://doi.org/10.3390/ma14226739
Submission received: 6 September 2021 / Revised: 22 October 2021 / Accepted: 2 November 2021 / Published: 9 November 2021
(This article belongs to the Special Issue Advances in High-Performance Non-ferrous Materials)

Abstract

:
The effects of CeO2 size on the microstructure and synthesis mechanism of Al-Ti-C alloy were investigated using a quenching experiment method. A scanning calorimetry experiment was used to investigate the synthesis mechanism of TiC, the aluminum melt in situ reaction was carried out to synthesize master alloys and its refining performance was estimated. The results show that the Al-Ti-C-Ce system is mainly composed of α-Al, Al3Ti, TiC and Ti2Al20Ce. The addition of CeO2 obviously speeds up the progress of the reaction, reduces the size of Al3Ti and TiC and lowers the formation temperature of second-phase particles. When the size of CeO2 is 2–4 μm, the promotion effect on the system is most obvious. The smaller the size of CeO2, the smaller the size of Al3Ti and TiC and the lower the formation temperature. Al-Ti-C-Ce master alloy has a significant refinement effect on commercial pure aluminum. When the CeO2 size is 2–4 μm, the grain size of commercial pure aluminum is refined to 227 μm by Al-Ti-C-Ce master alloy.

1. Introduction

A number of studies show that grain refiner for aluminum and its alloys can significantly improve the mechanical properties, casting properties, deformation processing properties and surface quality of materials [1,2].
Al-Ti-B master alloy has been the most widely used grain refiner and has been applied commercially [3]. However, many defects have been found in the application of Al-Ti-B master alloy thus limiting its development, i.e., a larger aggregation tendency of TiB2 in the melt, large size, and the possibility of Zr and Si poisoning [4,5]. In order to obtain a good refining efficiency, a series of novel master alloys have emerged, such as Al-Ti-C, Al-Ti-B-C and Al-Ti-C/B-RE master alloy [6,7,8,9]. Al-Ti-C master alloy especially has been extensively studied by researchers, and it has been found that it can be remedy certain defects of Al-Ti-B master alloy [10,11]. Unfortunately, the refining efficiency of Al-Ti-C is unstable, and the possible reasons for this are that the active of TiC is insufficient, TiC in the melt aggregates easily and the morphology of Al3Ti and TiC is easily affected by preparation conditions. For the most part, the wetting between Al and C is poor, and the formation of TiC is therefore difficult [12].
Ao et al. [13] found that La2O3 added to the Al-Ti-C-CuO system could promote the wettability of C and Al melt. The results of thermodynamic analysis from differential scanning calorimetry (DSC) experiments showed that La2O3 could promote metastable phase transfer into stable phases. Furthermore, the even distribution of TiC can directly influence the refining efficiency of Al-Ti-C. Wang L. D. et al. [14] analyzed the thermodynamics of the Al-Ti-C-Ce system using DSC experiments, and the result showed that rare earth oxide promoted the reaction and made the distribution of TiC even, forming a new Ti2Al20Ce phase. Moreover, CeO2 has a catalytic effect and can promote the reaction. Korotcenkov et al. [15] considered that the catalytic activity of CeO2 is closely related to its structure, morphology and size. The research of Auffan et al. [16] and Liu et al. [17] shows that CeO2 nanoparticles have a high specific surface area, and the smaller the size of CeO2 nanoparticles, the higher the specific surface area and the greater the activity. Preliminary studies have shown that when the content of CeO2 was 4 wt.%, it had a significant promoting effect on the Al-Ti-C system [18]. On this basis, it is necessary to further study the effect of CeO2 particle size on phase transition and microstructure transformation of Al-Ti-C system.
In this study, the aluminum melt in situ reaction was carried out to prepare Al-Ti-C-Ce master alloys. The influence of the size of CeO2 on the thermodynamic process, reaction products and microstructures of the prepared Al-Ti-C-Ce system were studied in detail through quenching experiments, and the reaction mechanism of the Al-Ti-C-Ce system is summarized in this paper. The goal of the abovementioned studies was to determine the influence mechanism on the microstructure and phase transformation with different sizes of CeO2 in the Al-Ti-C-Ce system based on thermodynamic analysis and DSC experiments.

2. Experiment

2.1. Quenching Experiments

Al powders (99.0 wt.%, 80–100 µm), Ti powders (99.0 wt.%, 45–65 µm) and C powders (99.0 wt.%, 10–20 µm) were prepared with Al/Ti/C = 5:2:1 (molar ratio) and 4 wt.% CeO2 powder (99.0 wt.%, with different average sizes, i.e., 30 nm, 50 nm, 1 μm, 2–4 μm). The mixture was evenly mixed in a PULVERISETTE-5 high-speed planetary ball mill with a ball-to-material ratio = 3:1. The rotation speed and the total milling time were 350 r/min and 3 h, respectively. Then, 50 g of the mixture was cold-pressed into a cylindrical prefabricated block of Φ 25 mm × 50 mm on an AG-10TA universal test stretching machine (Shimadzu Corporation, Kyoto, Japan) and dried in a drying oven at 200 °C for 2 h.
Simultaneously, commercial pure aluminum (99.7 wt.%, A 99.7) was melted in alumina crucible by using a SG-7.5–10 type crucible furnace (Zhonghuan Experimental Furnace Corporation, Tianjin, China). After the temperature was raised to 800 °C, the prefabricated block was added to the melt through the graphite bell jar. According to the previously determined typical sampling time (8, 50, 60, 80 and 90 s), the reaction block was quickly removed at each time point and subjected to high pressure ice brine flow quenching to obtain quenched samples.
The specimens with a size of 10 mm3 taken from the quenched samples were electrolytically polished by a reagent (10 vol.% HClO4 + 90 vol.% absolute ethanol, voltage is 20 V and the time is about 10~30 s) after mechanical grinding and polishing. The phase constituents of specimens were analyzed using a D8 advance X-ray diffractometer (XRD, Shimadzu Corporation, Kyoto, Japan). The microstructure was examined using a JSM-6700F scanning electron microscope (SEM) equipped with an energy dispersive spectrometer (EDS, Shimadzu Corporation, Kyoto, Japan). In addition, DSC analysis of the Al-Ti-C-Ce system was conducted with a NETZSCH STA 449F3 instrument (NETZSCH, Hanau, Germany) with a heating rate of 20 K/min and samples weighing less than 10 mg.

2.2. Grain Refinement Experiments

To evaluate the grain refining effect of Al-Ti-C master alloy after adding CeO2, the different master alloys were prepared using the aluminum melt in situ reaction method, and then master alloys were used to refine A 99.7. The specific experimental process is as follows:
Firstly, A 99.7 ingots were melted and heated up to 800 °C in an alumina crucible by using a SG-7.5–10 type crucible furnace (Zhonghuan Experimental Furnace Corporation, Tianjin, China). A proper quality of prefabricated block was then added to the melt after preheating at 200 °C for 2 h. After being held at 800 °C for 15 min, the melt was finally poured into a steel die with an inner diameter of 45 mm, a diameter of 70 mm and a height of 70 mm. By adjusting the size and addition of CeO2, Al-Ti-C and Al-Ti-C-Ce master alloys were obtained. The specific experimental parameters and numbers of master alloys are shown in Table 1.
Thereafter, an appropriate amount of A 99.7 was melted in a crucible electrical resistance furnace at about 730 °C. The 0.3 wt.% master alloys were sectioned at the position of 10 mm from the bottom on #1~#5 alloys and then added to the melt. After that, the melt was held for 10 min and finally poured into the steel mold. By solidification, the refined samples were obtained. For comparison, standard A 99.7 was treated in the same process. A specimen with a thickness of 10 mm was cut along the bottom of the refined sample. A cross profile of the specimen was etched using Keller’s reagent (25 vol.% H2O + 15 vol.% HNO3 + 15 vol.% HF + 45 vol.% HCl). The grain structures of specimens were taken by a camera, and the average grain sizes were calculated using the linear intercept method.

3. Results and Discussion

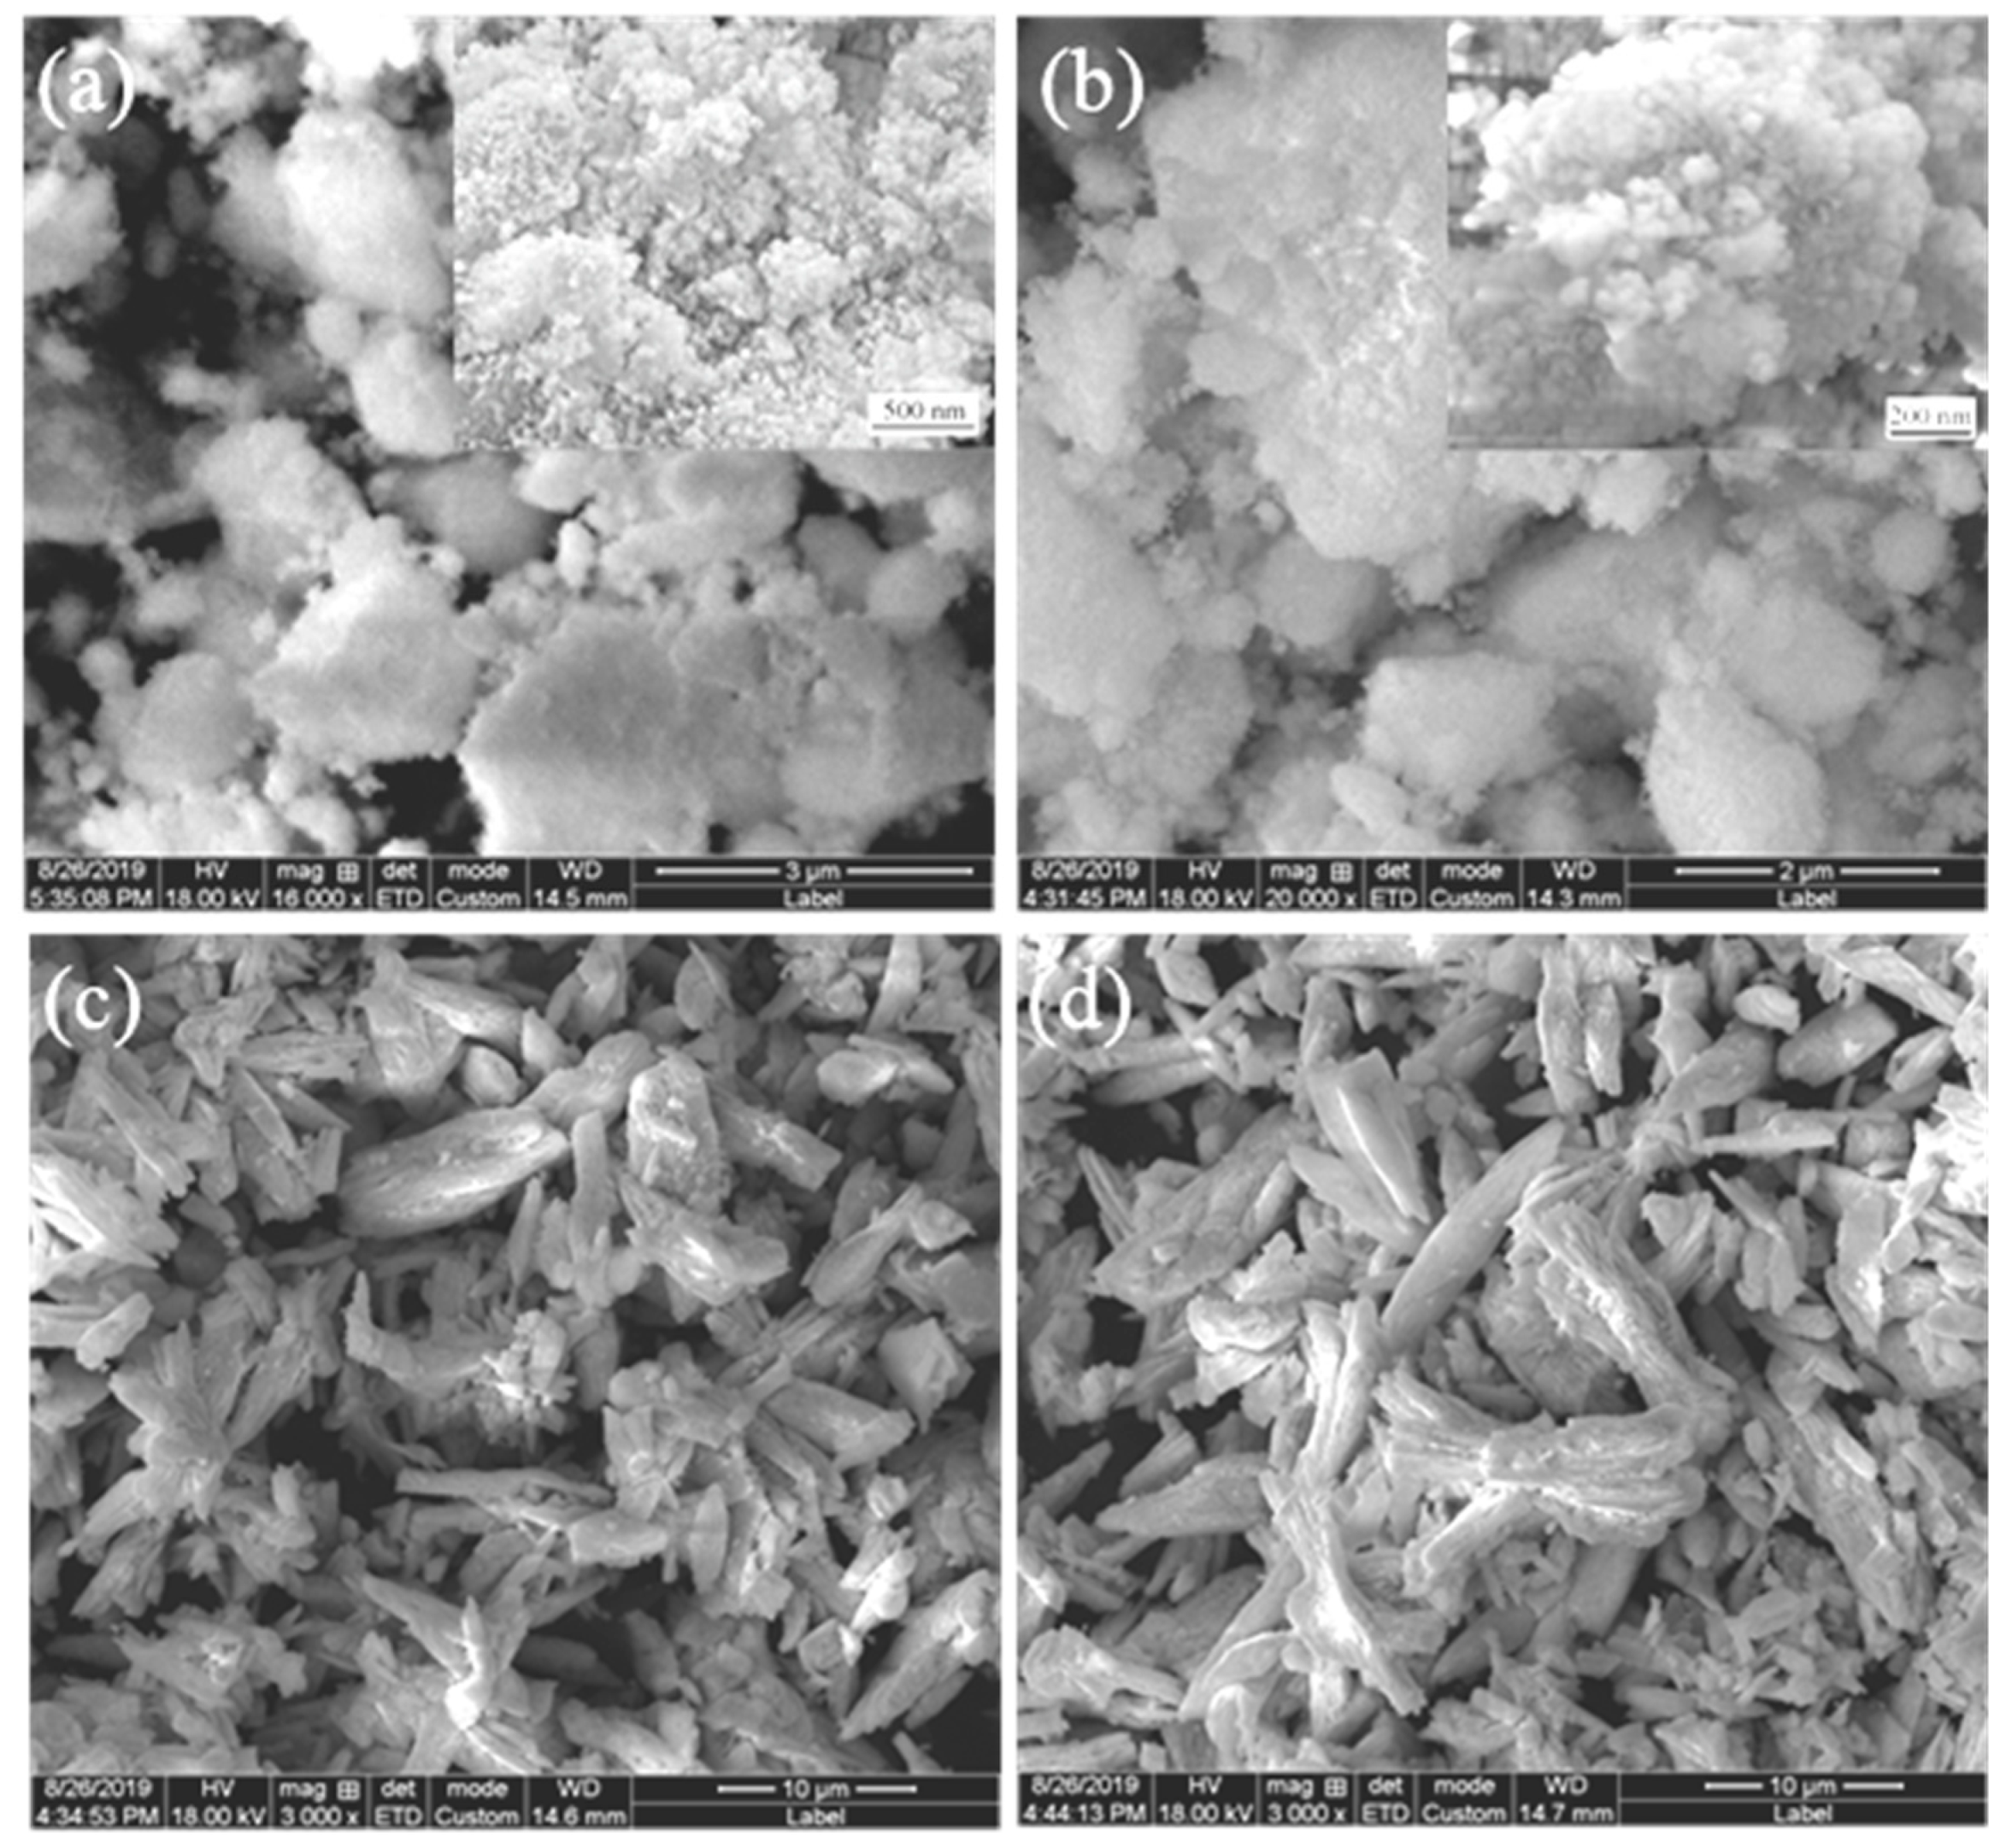
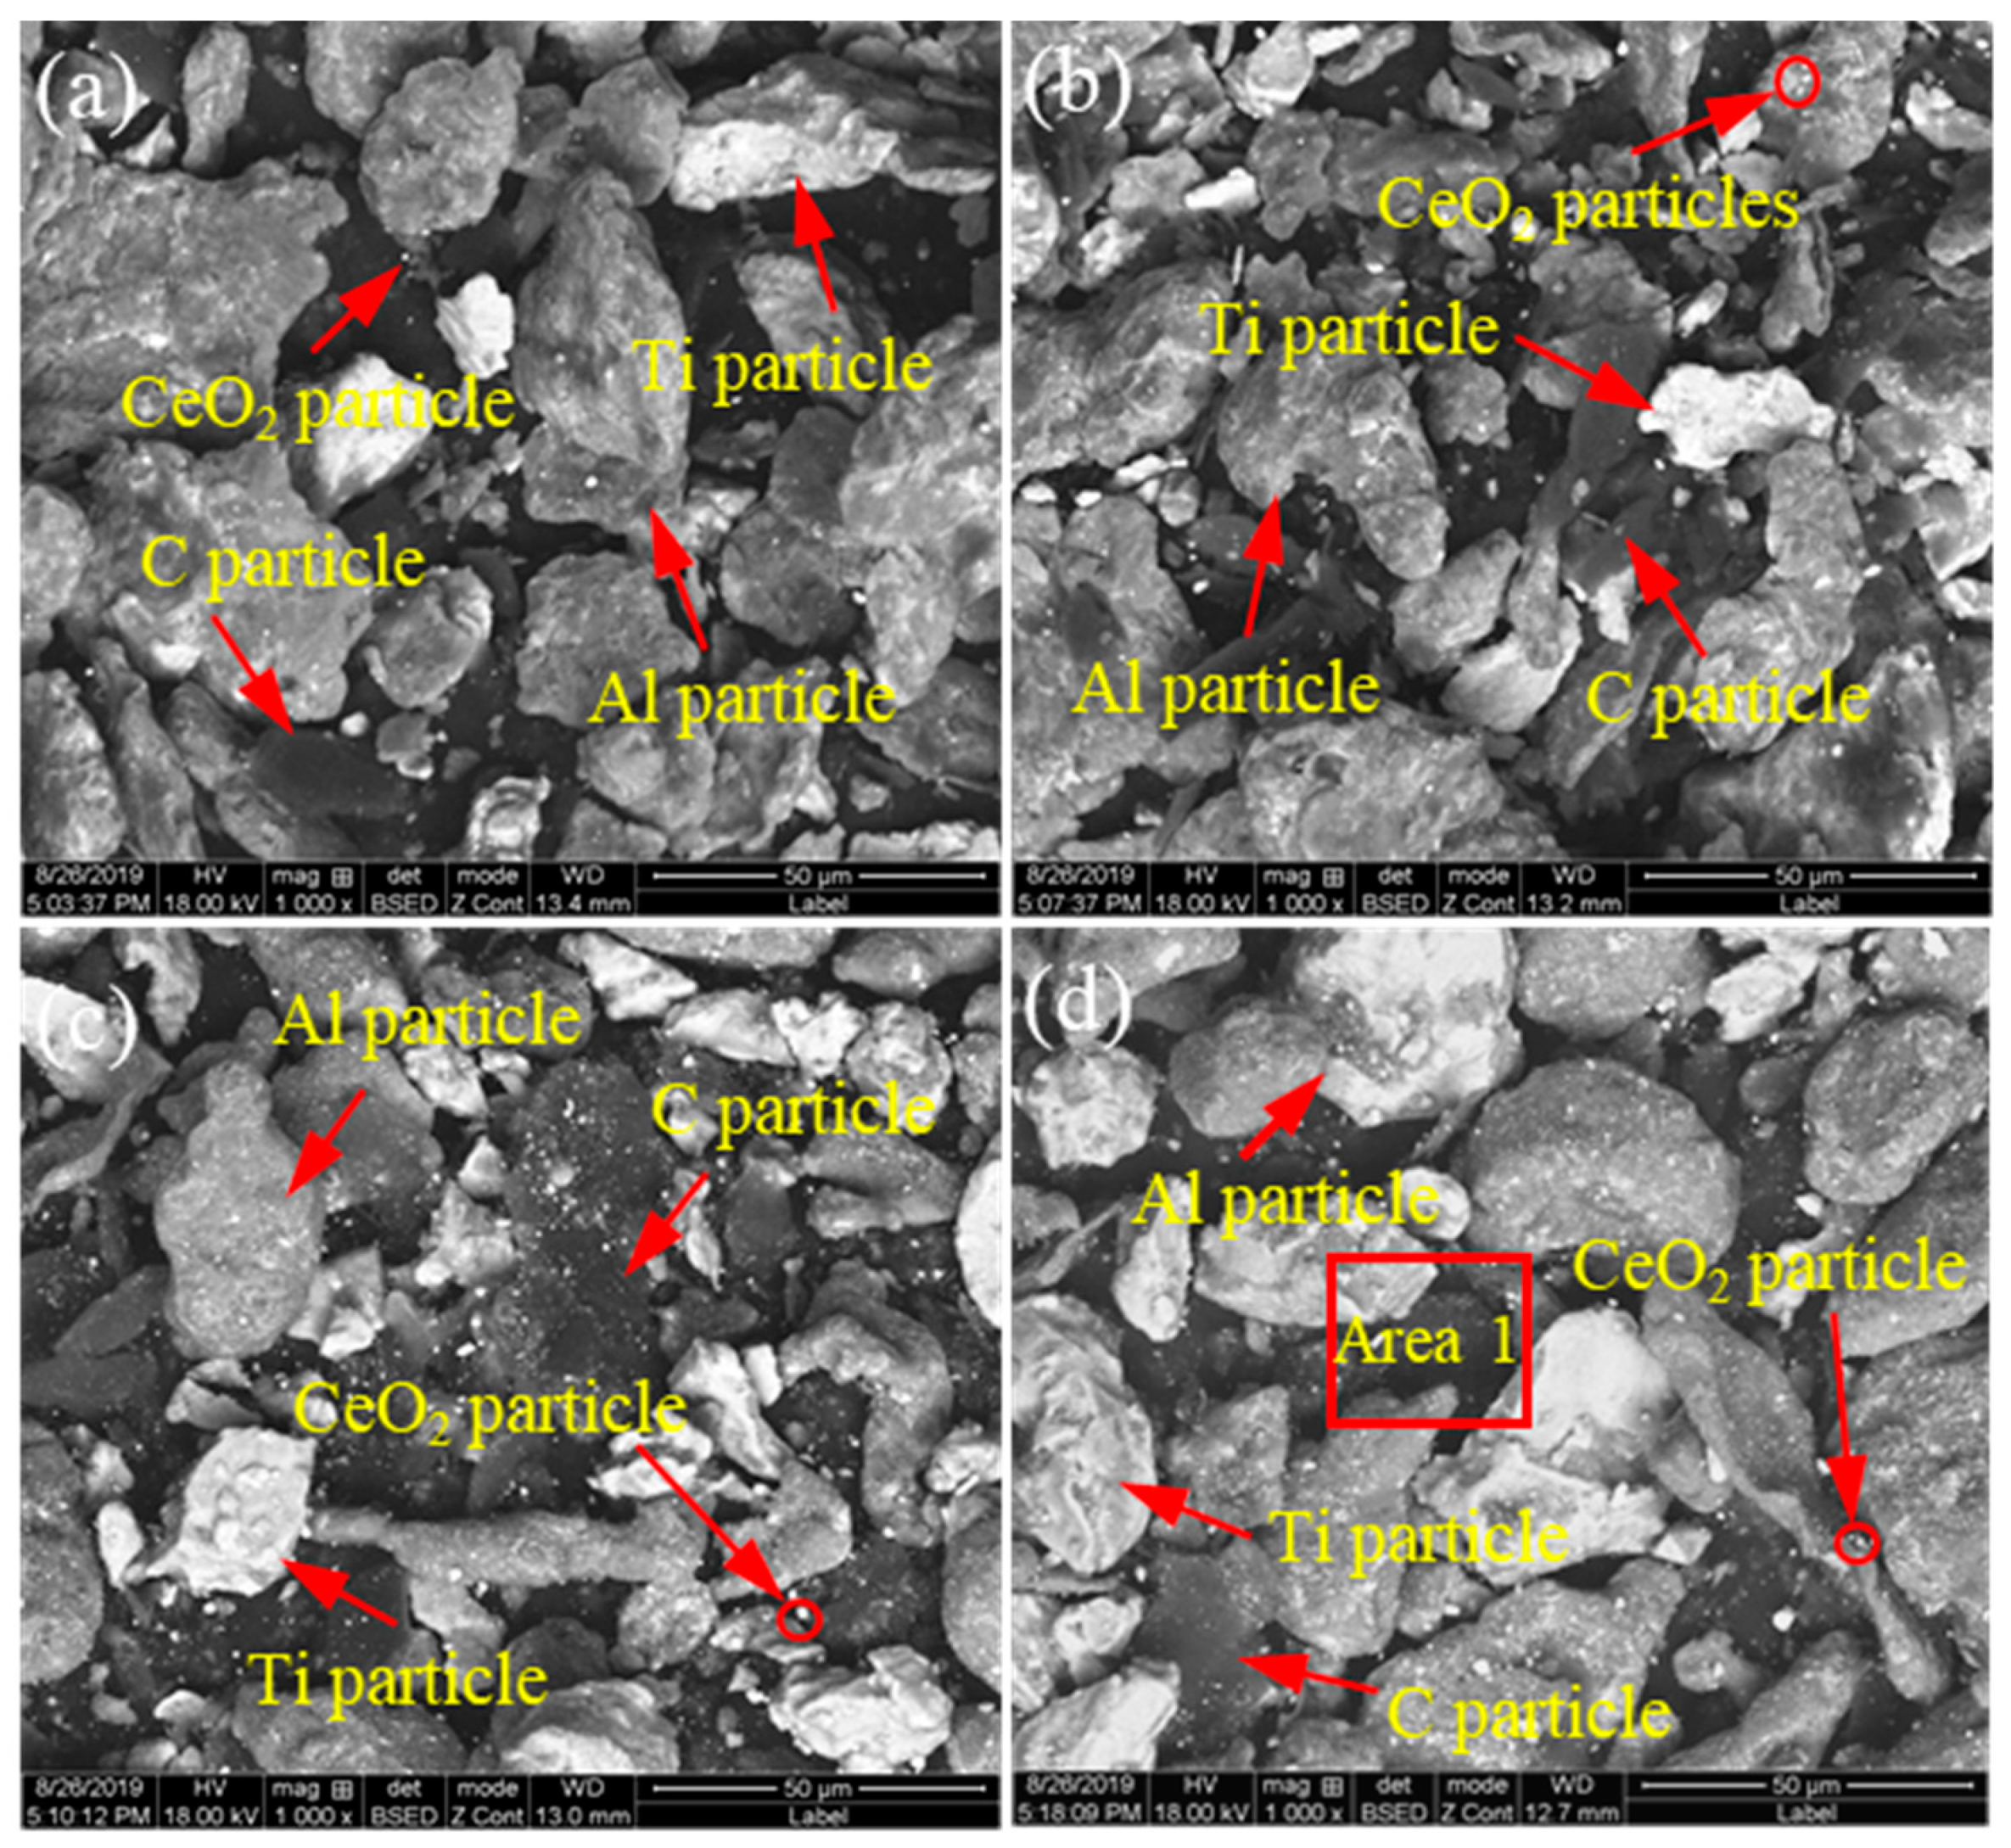
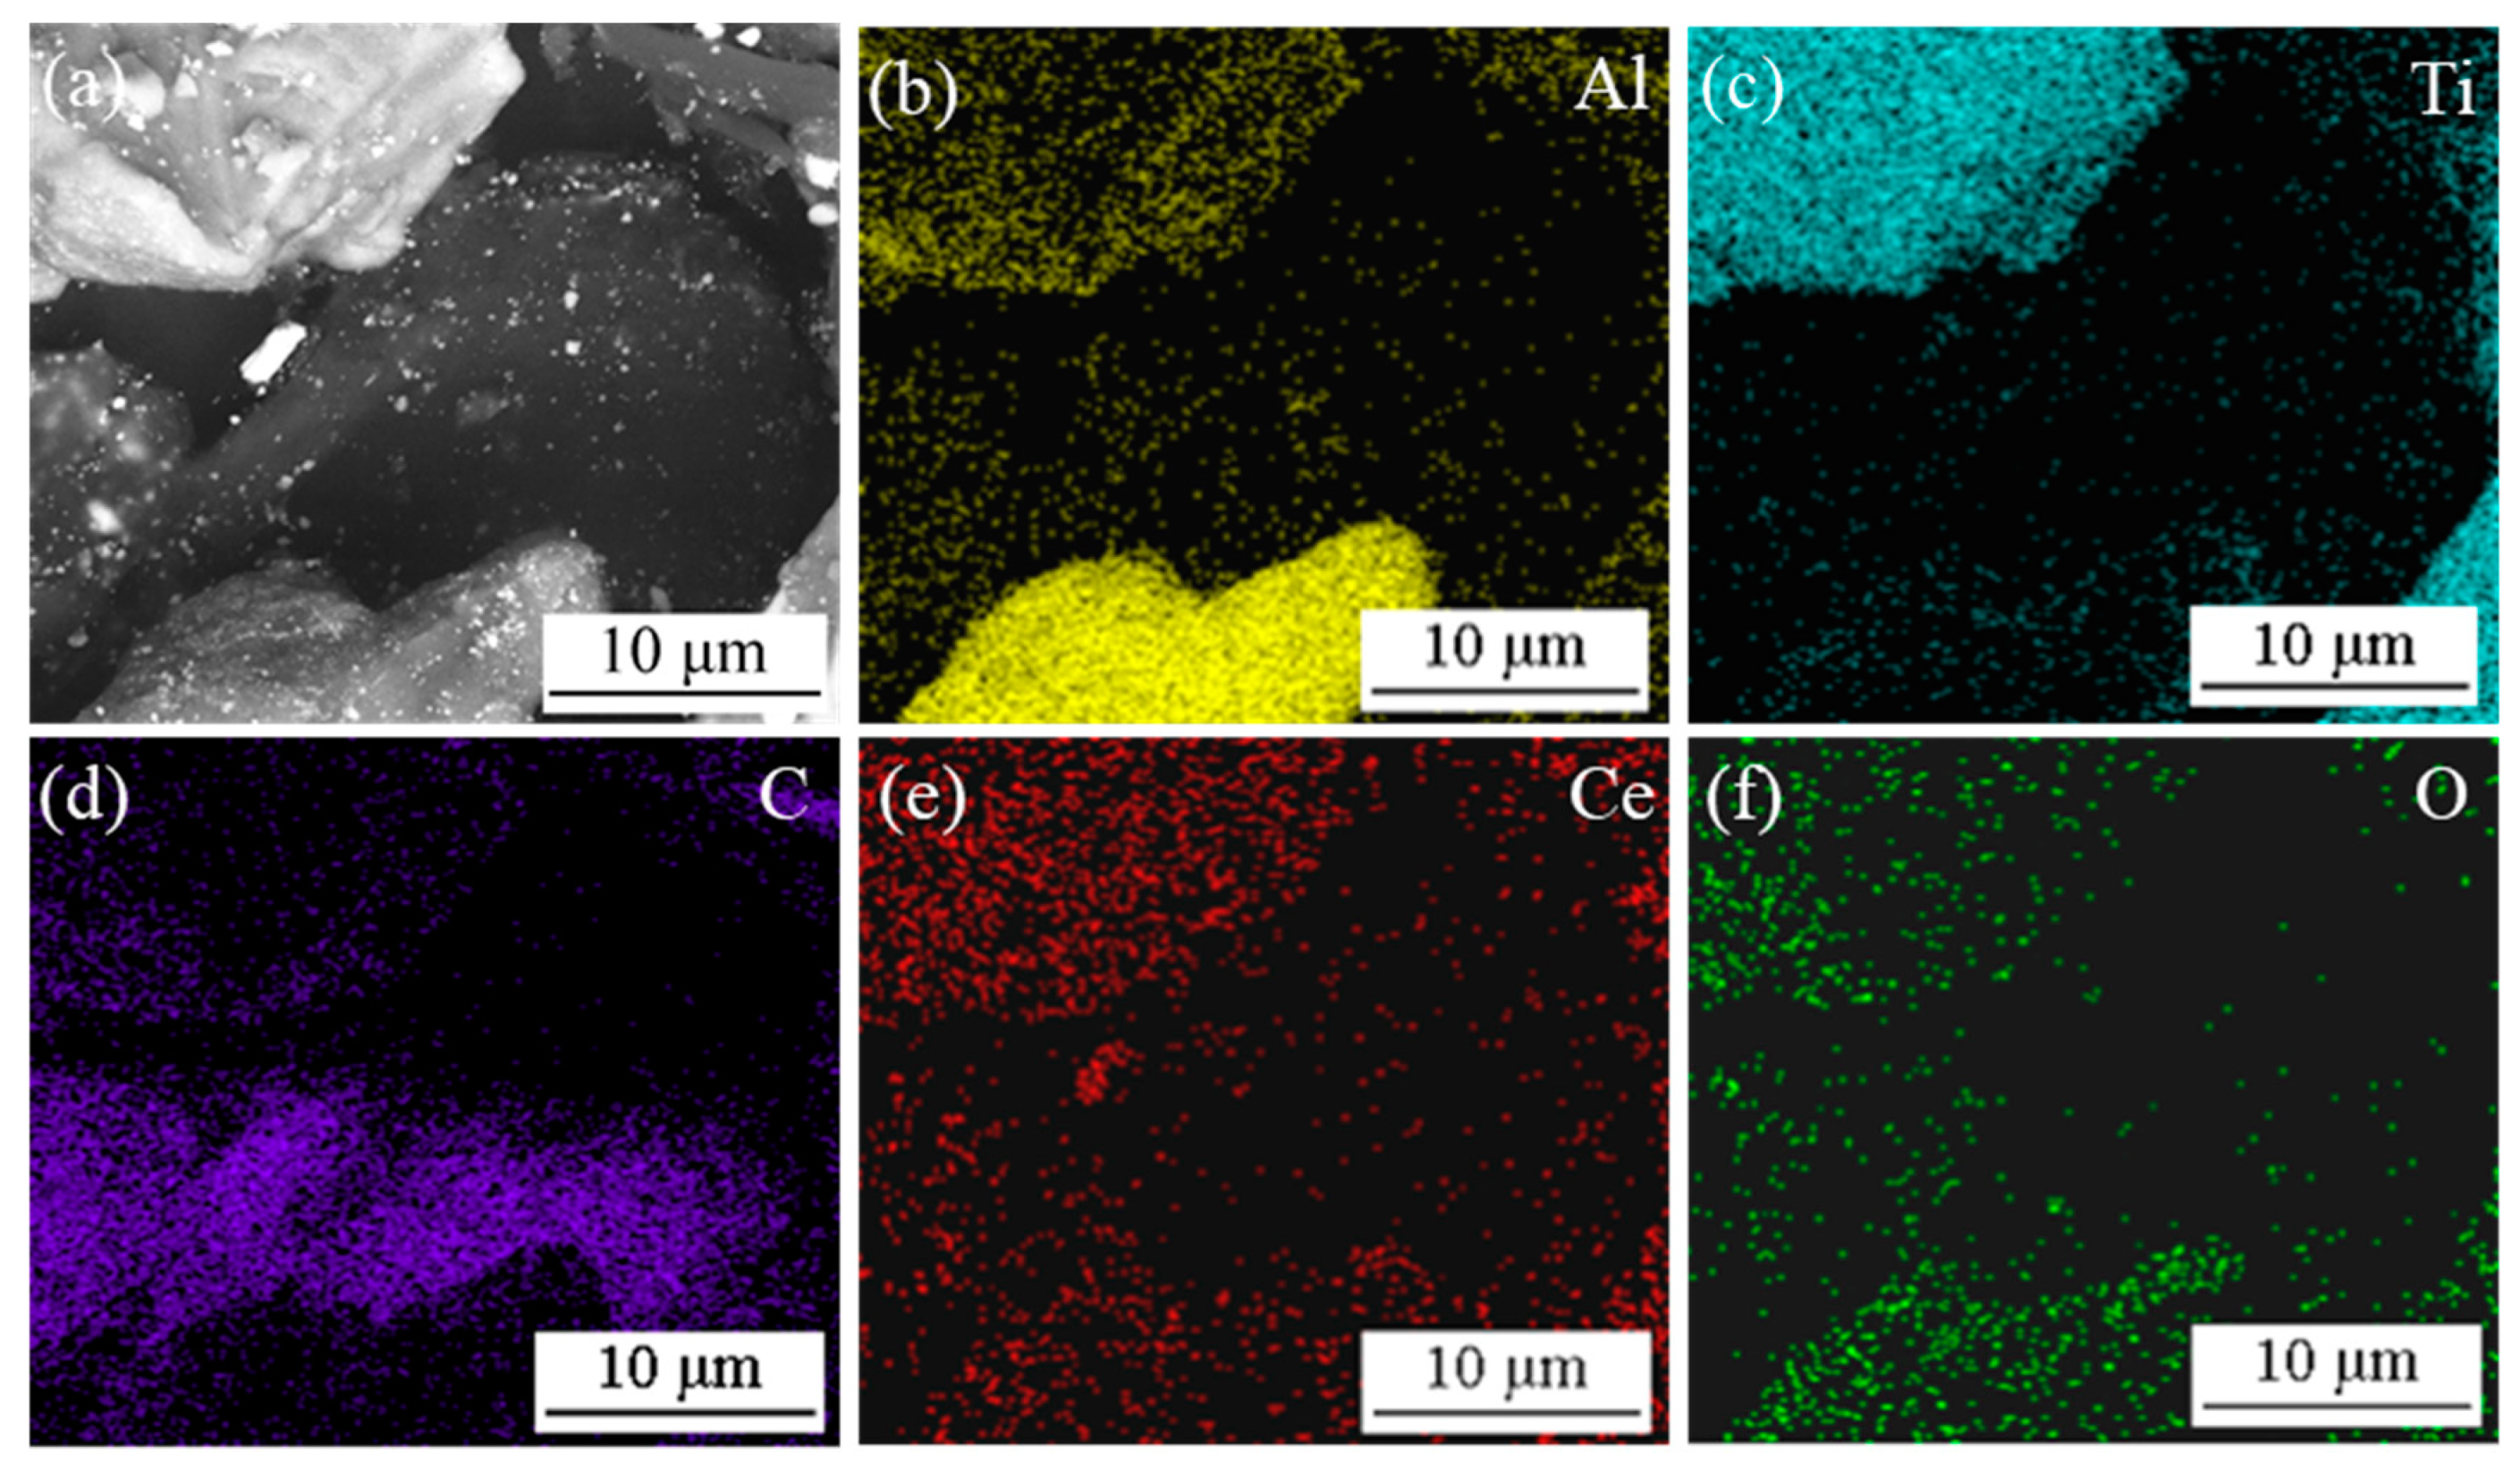
3.1. The Raw Materials of CeO2 and the Mixed Particles

The raw materials of different CeO2 size are presented in Figure 1. From Figure 1a,b, it can be seen that the morphology of CeO2 with a size of 30 and 50 nm is spherical nanoparticles. In contrast, the 1 and 2–4 μm sized CeO2 gathered together in a short rod shape and small block shape, as shown in Figure 1c,d.
Figure 2 and Figure 3 show the microstructure and EDS results of the mixed powders (Al, Ti, C and CeO2) with different CeO2 size after ball milling. As shown Figure 2, Al, Ti, C and CeO2 powders were evenly mixed after ball milling. Combining the EDS mapping analysis of Al, Ti, C, Ce and O elements as shown in Figure 3, it can be seen that the bright white particles with larger size are Ti, gray particles are Al and black particles are C. The bright white particles with small size are mainly enriched with Ce and O elements, which can be judged as CeO2 particles. As can be observed in Figure 2a,b, for nano-CeO2 particles, ball milling mainly leads to uniform dispersion. However, for the mixed powder of CeO2 with a larger size, ball milling not only contributes to dispersion but also destroys the aggregation between CeO2, breaking the CeO2 into smaller particles. A statistical analysis of the particle size of CeO2 found that after ball milling, the size of 1 μm CeO2 particles was reduced to about 400 nm (see Figure 2c), and the size of 2–4 μm CeO2 particles was reduced to about 200 nm (see Figure 2d).

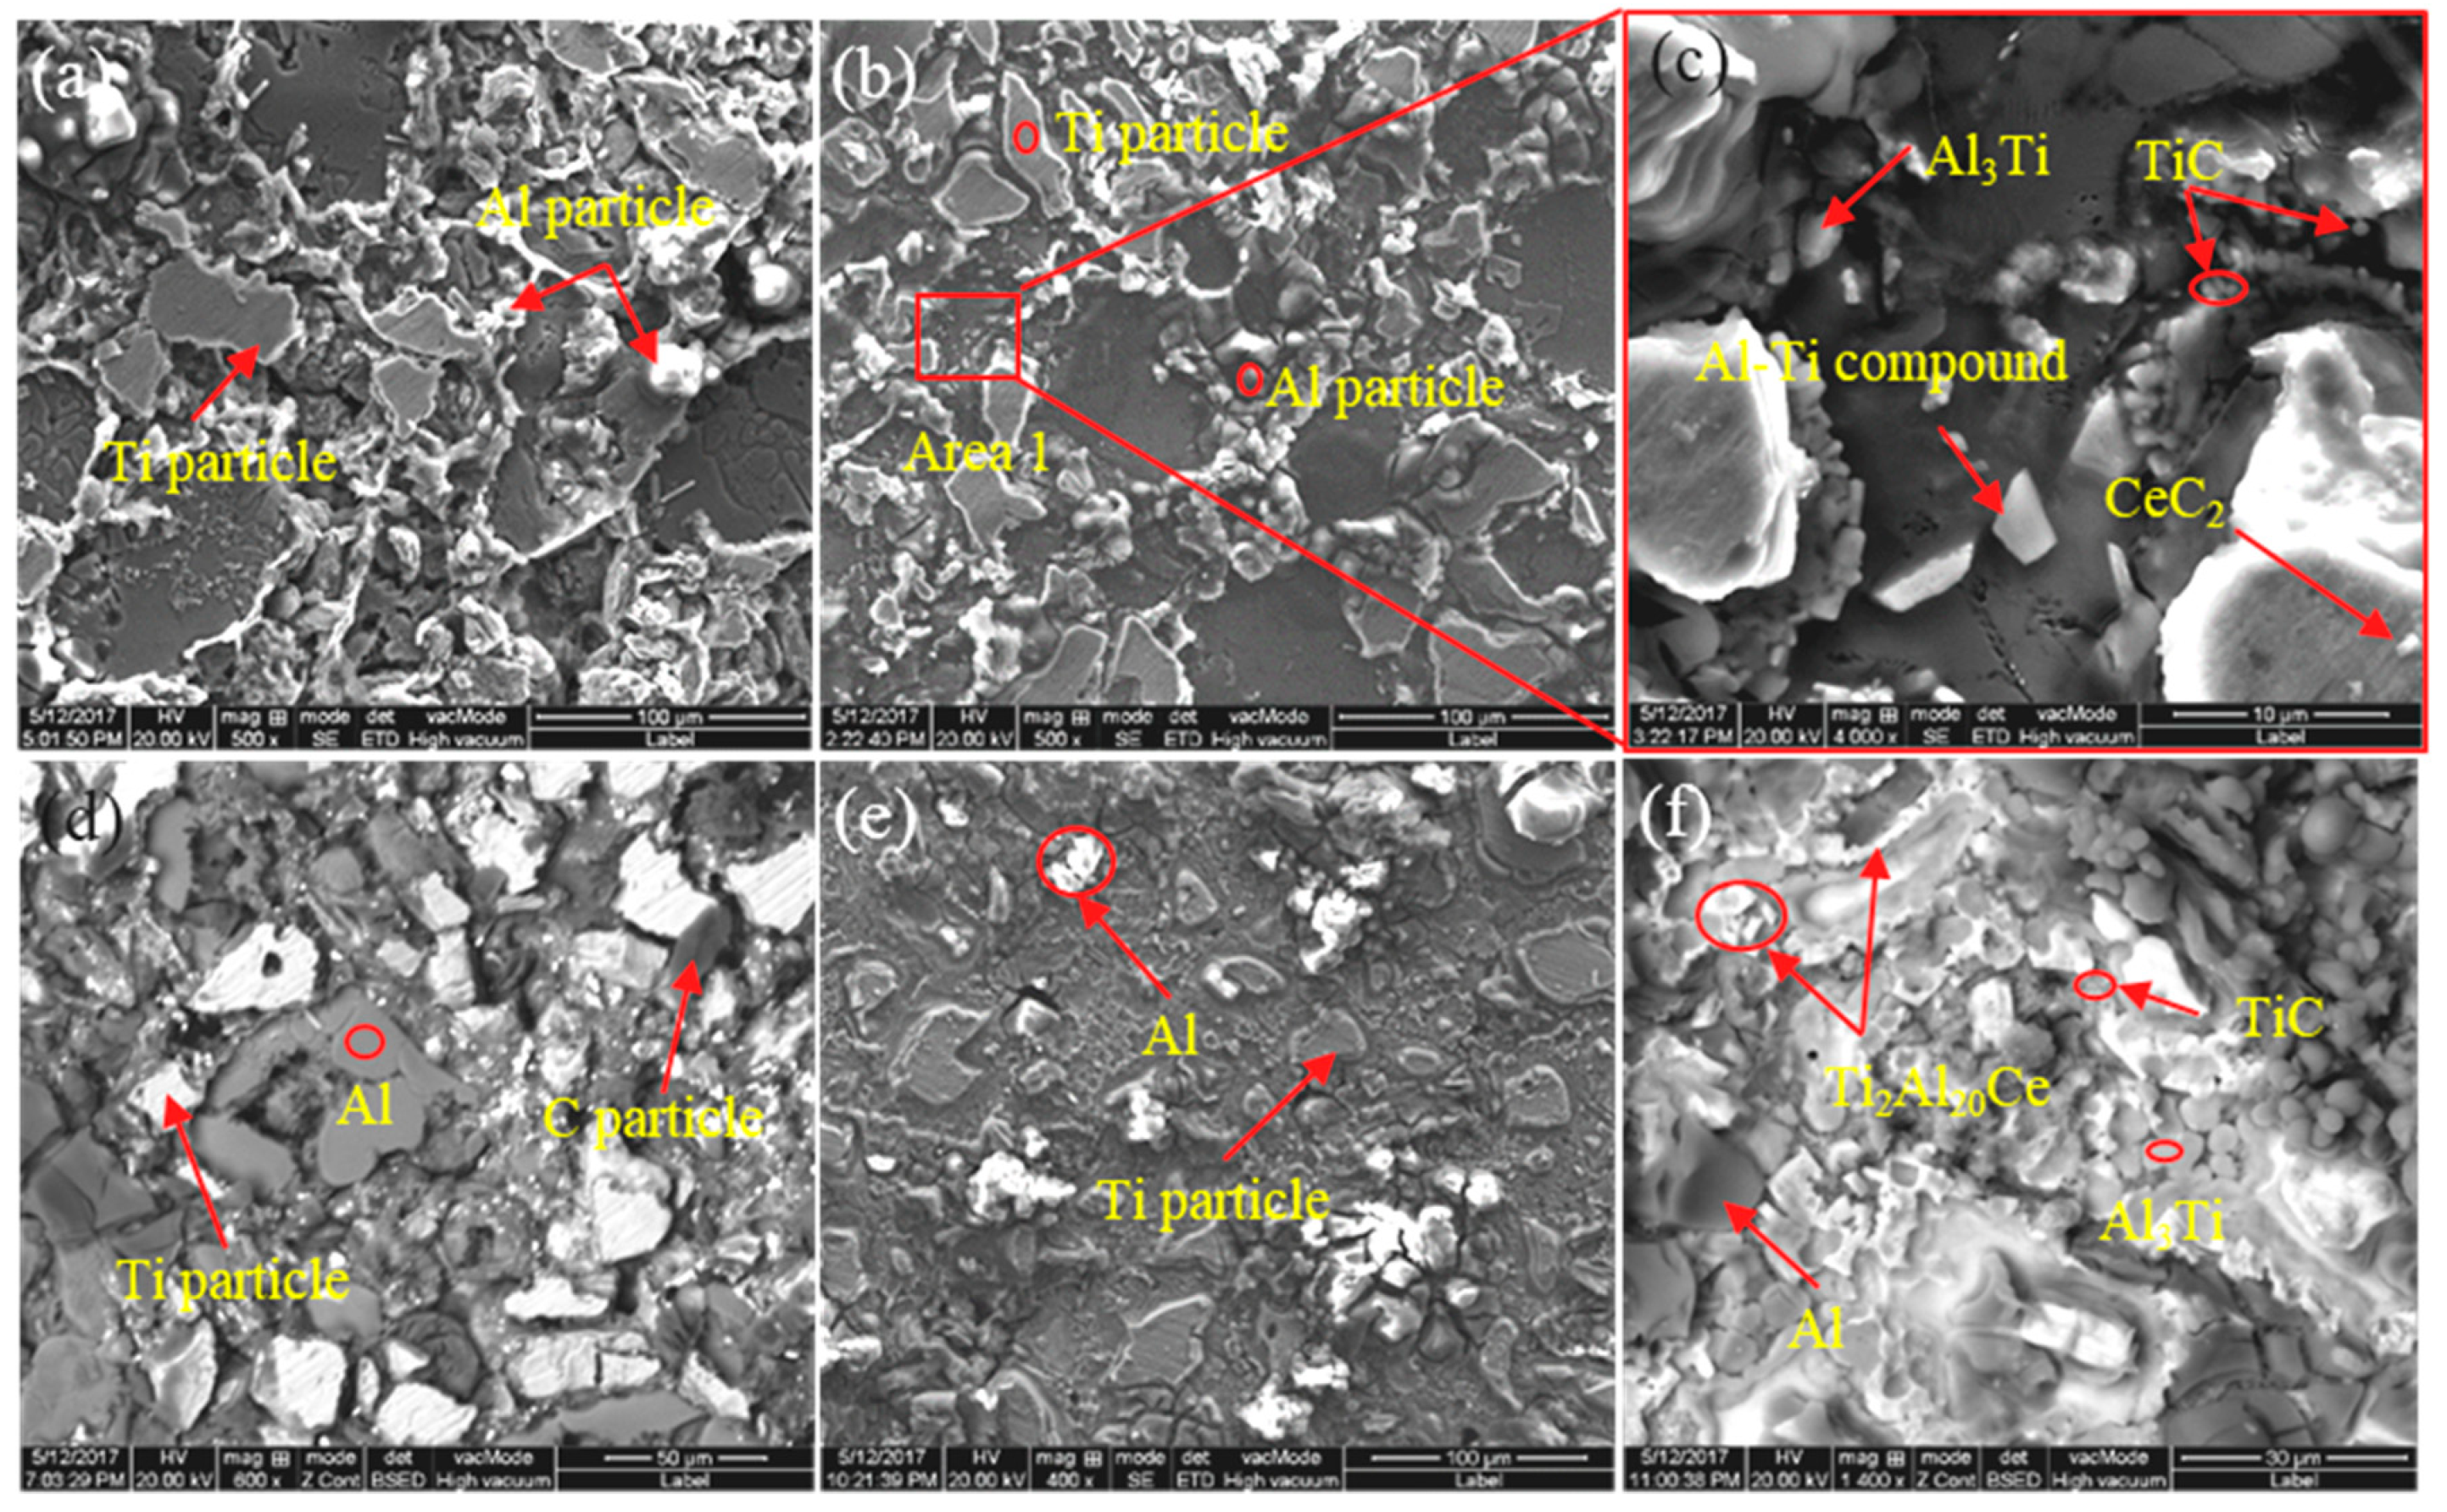
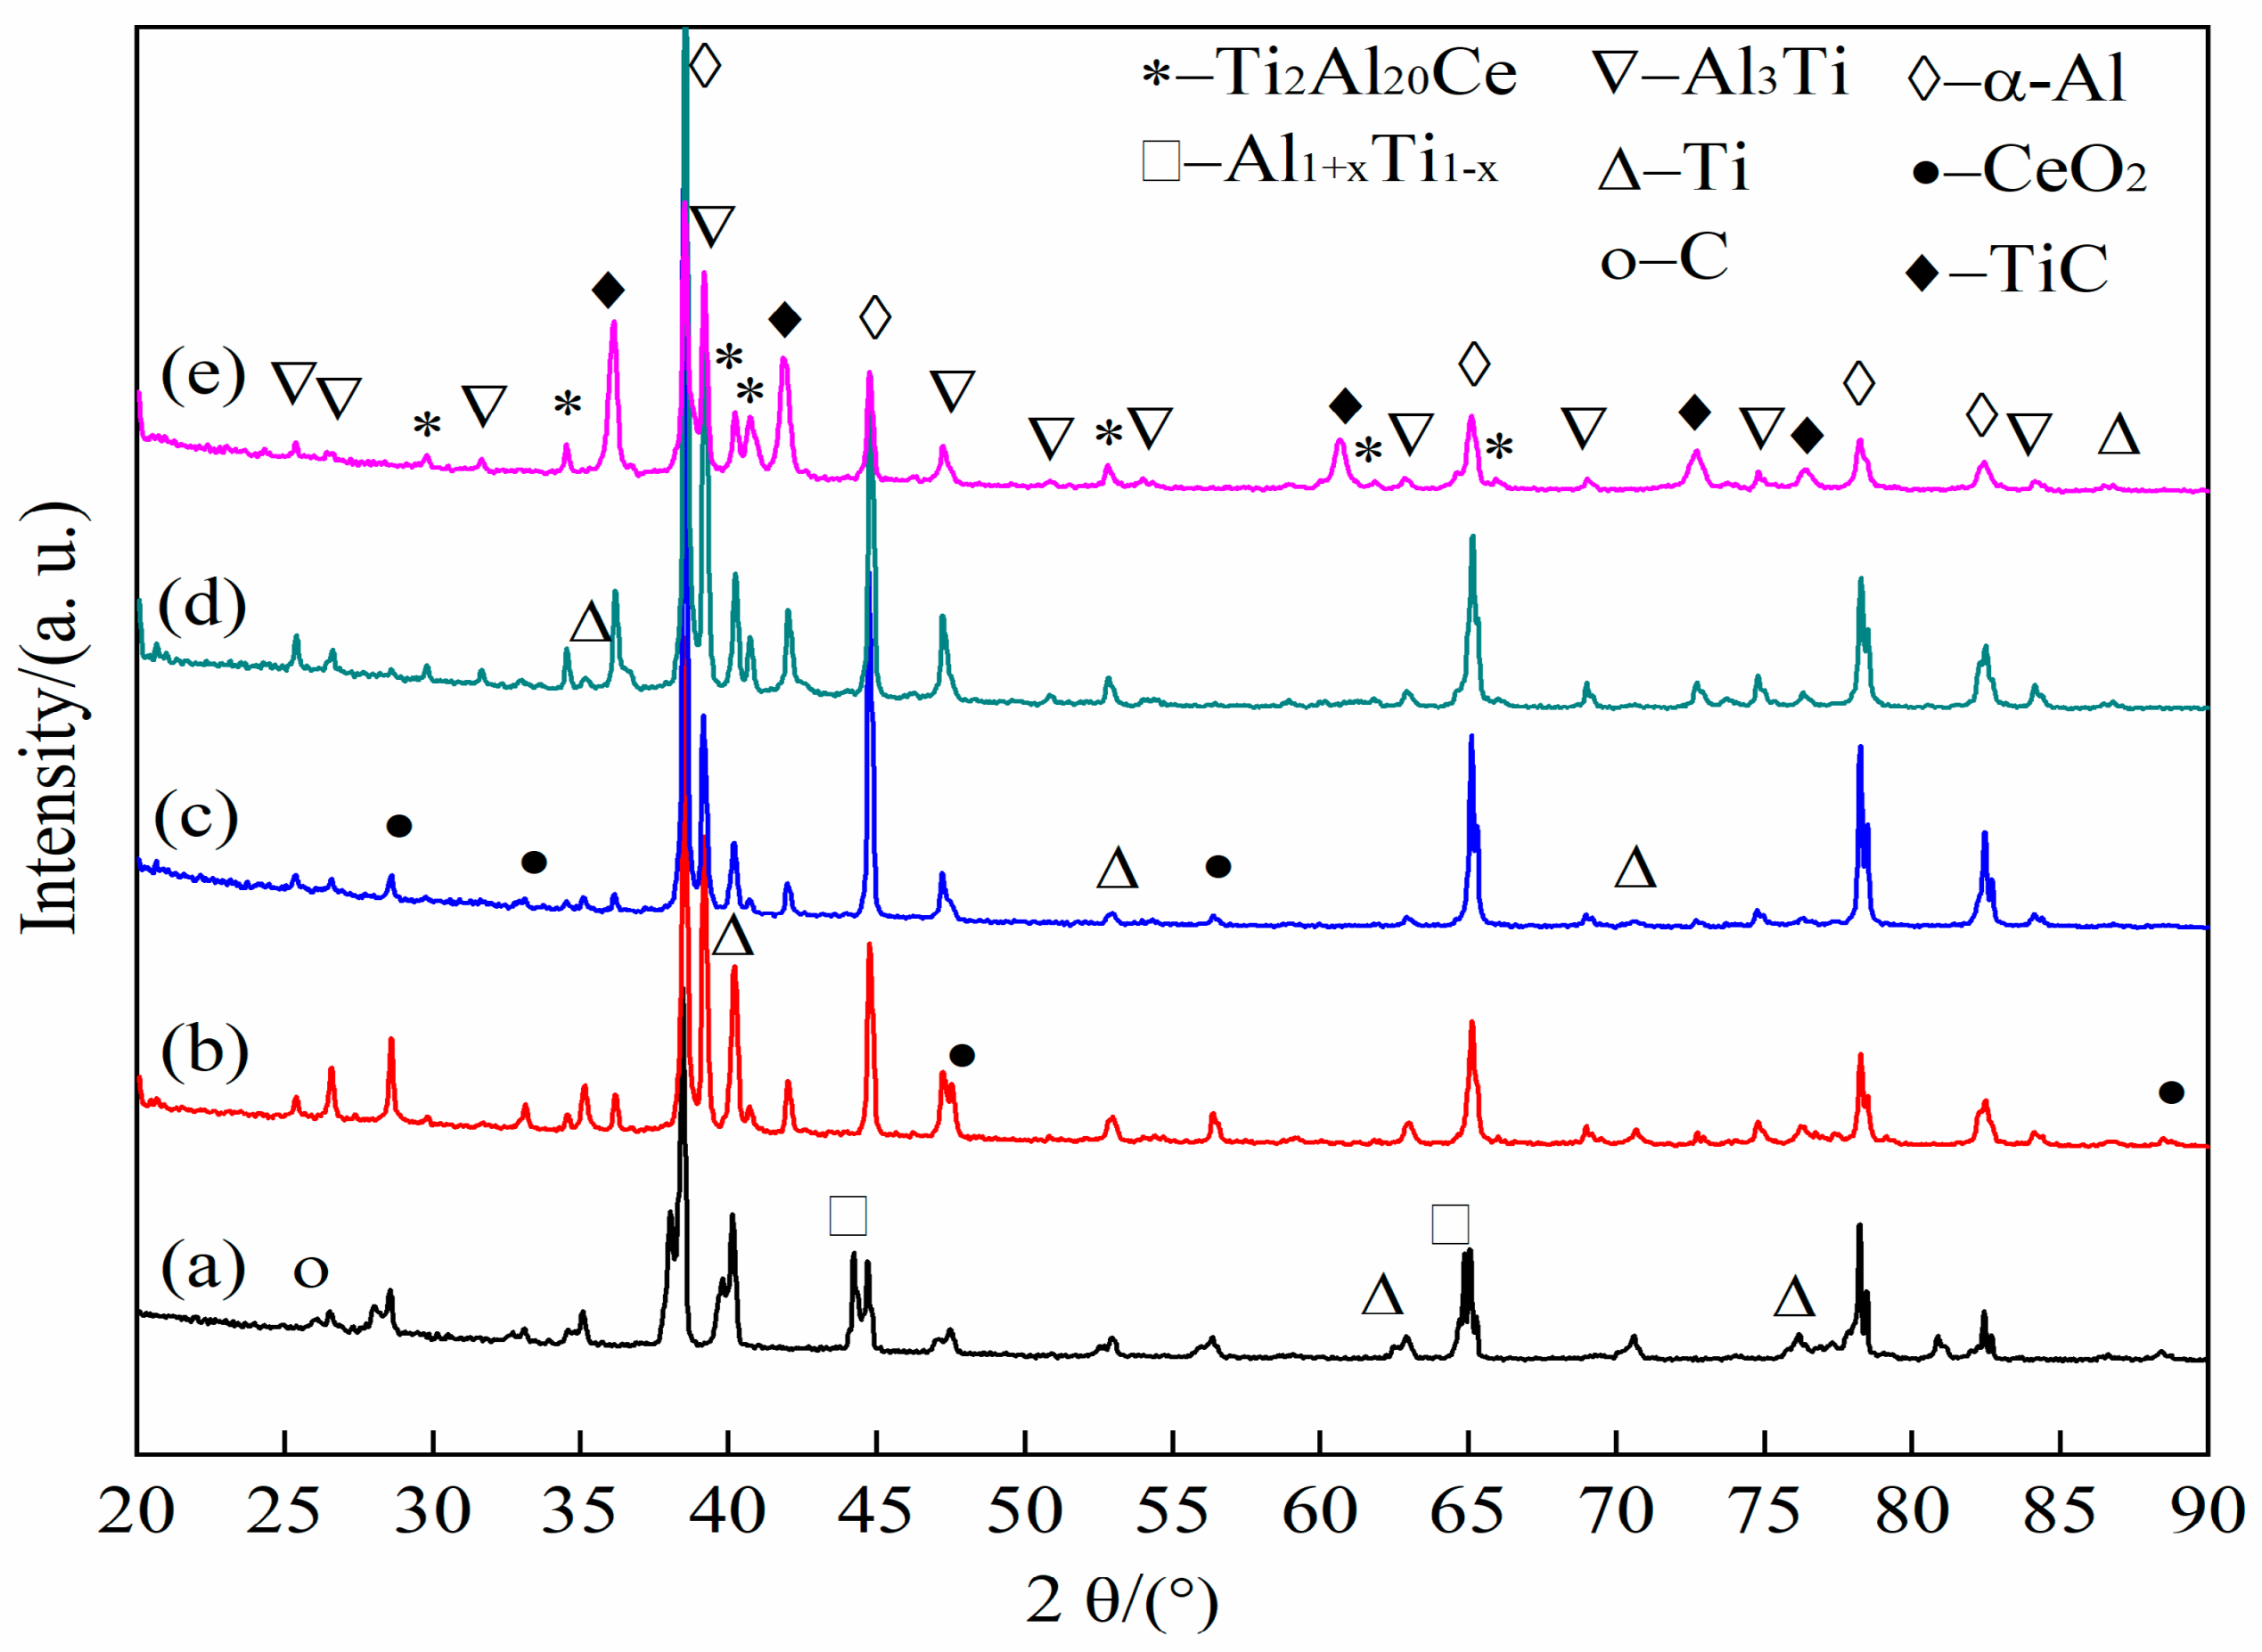
3.2. Effect of CeO2 Particle Size on Phase Transformation and Microstructure Transformation of Al-Ti-C Master Alloy during Preparation

In order to study the influence of CeO2 size on the microstructure transformation process of Al-Ti-C system, the microstructure of quenched samples with different CeO2 sizes at the same reaction time (60 s) was analyzed. SEM images and EDS results are shown in Figure 4. Comparing Figure 4a,b, it is found that when the CeO2 size is 30 and 50 nm, it has little effect on the reaction process of the system. As can be seen, the molten Al closely connects Ti particles, and incomplete Ti particles and incomplete melting Al particles were reserved in system after solidification. As can be seen from Figure 4c, a variety of compounds with different sizes and morphologies are formed around the Ti particles, which are Al3Ti, TiC, Al-Ti compounds and CeC2 particles. It can be seen from Figure 4d that when the CeO2 size is 1 μm, there is no close connection between the Ti particles and the aluminum matrix. Otherwise, compared to Figure 4a,b the degree of reaction is low, and there are obvious incompletely reacted Al, Ti and C particles in the system. When CeO2 with a size of 2–4 μm is added to the system, as shown in Figure 4e,f, it can be seen that the size of the Ti particles is reduced, the reaction intensity is enhanced, the density of the system is increased and the particles are closely connected. Especially, A large number of TiC, Al3Ti and Ti2Al20Ce phases are formed in the Al matrix.
This difference in response is because the larger the CeO2 particles, the larger the specific surface area and the stronger the catalytic effect, which obviously accelerates the progress of the reaction. For micron-sized CeO2 particles, due to the crushing of CeO2 particles during ball milling, more active sites are provided, and the larger the particle size, the more severe the degree of crushing, the more active sites and the greater the promotion of the reaction.
The microstructure of the quenched samples with different CeO2 sizes added under complete reaction was observed. The phase, microstructure characteristics and the average grain size of the second phase particles of the quenched samples were analyzed, as shown in Figure 5, Figure 6 and Figure 7.
Figure 5 shows XRD patterns of prefabricated blocks with different CeO2 size under complete reaction. As can be seen from Figure 5, under complete reaction, the main phases in the sample are α-Al, Al3Ti, TiC and Ti2Al20Ce. When the CeO2 particle size is 30 nm and 2–4 μm, the diffraction peak intensity of TiC (2θ = 41.7°) is higher than 50 nm and 1 μm, and the diffraction peak intensity of Al3Ti, TiC and Ti2Al20Ce showed a weakening trend with the increase in CeO2 size.
Figure 6 shows SEM images of the quenching samples of prefabricated block with different CeO2 size under complete reaction. Comparing Figure 6a–d, it is found that the size of CeO2 particles has a great influence on the quantity, morphology and distribution of Al3Ti and TiC. When the size of CeO2 is 30 nm and 2–4 μm, the amount of TiC and Al3Ti is large and the size is relatively uniform, the distribution is dispersed in the matrix. When the size of CeO2 is 50 nm, TiC and Al3Ti adhere to each other in an irregular shape, and the size is not uniform. When the size is 1 μm, the number of TiC particles is small, and Al3Ti is evenly distributed in the matrix.
Figure 7 shows the statistics chart of the second phase particles in prefabricated block with different CeO2 size under complete reaction. It can be seen from Figure 7 that the particle size of CeO2 mainly affects the size of TiC particles, and has little effect on the size of Al3Ti. When the size of CeO2 is 30 nm, the average size of Al3Ti and TiC is the smallest at 4.0 and 1.1 μm, respectively. With the increase in CeO2 particle size, the average size of TiC gradually increases, the average size of Al3Ti increases first and then tends to be flat and CeO2 particle size is 2–4 μm. The average size of Al3Ti in the quenched samples is 6 μm, and the average size of TiC is about 2.2 μm.
From the above analysis, it can be seen that the content and size of CeO2 have a significant effect on the formation, distribution, size, number and morphology of phases in the Al-Ti-C system. In order to further study the formation and transformation process of various phases, the pre-fabricated blocks with CeO2 size of 2–4 μm and 4 wt.% were taken as the research objects to study the reaction products and microstructures of the Al-Ti-C-Ce system at different stages. The XRD pattern and microstructure are shown in Figure 8, Figure 9 and Figure 10.
As can be seen from Figure 8a, in the initial stage of the reaction (8 s), the main detection phases in the system are Ti, C, CeO2 and a small amount of Al1+xTi1-x, indicating that there is a weak solid–solid diffusion process between solid Al and solid Ti at this stage. When the reaction time reaches 50 s, TiC, Al3Ti and trace Ti2Al20Ce are formed, as shown in Figure 8b. As the reaction progresses, the intensity of the diffraction peaks of Al3Ti and TiC decreases first and then increases. The intensity of the diffraction peaks of Ti2Al20Ce continues to increase. When the reaction reaches 90 s, a large amount of TiC, Al3Ti and Ti2Al20Ce are synthesized in the system; only weak incomplete reaction Ti peaks were detected in Figure 8c–e.
As can be seen from Figure 9a, the system basically maintains the original particle state. Figure 9b shows that when the reaction reaches 50 s, the molten Al in the system spreads on the surface of the Ti particles, and a small amount of Al1+xTi1-x is formed under the solid–liquid diffusion reaction [19,20] and then transformed into Ti2Al20Ce under the action. In addition, around 3 μm Al3Ti and 1 μm TiC were formed around the Ti particles, and unreacted Ti particles and CeO2 also existed in the system. Figure 9c shows that there is a size of about 5 μm Al3Ti, and bulk Ti2Al20Ce are speculated to be caused by the enrichment of the Al element and the Ce element around the Ti element. In addition, solid C reacts with Ti to form a large number of TiC particles, and the whole system reacts to form a wrapped structure of Ti/Al-Ti/Al3Ti/Ti2Al20Ce [21,22]. The results of Figure 9d and its surface scanning energy spectrum (see Figure 10) show that rare earth elements are mainly enriched with the surface of C element and around the Ti element, and some rare earth elements react with dissolved Ti atoms and liquid Al to form Al3Ti and Ti2Al20Ce. The other part reacts with solid C to form CeC2 and then reacts with dissolved Ti atoms to generate TiC. At the same time, because the affinity between Ti atoms and C atoms is greater than that of Al and C, dissolved Ti atoms directly generate TiC particles with dissolved C atoms. As time goes on, TiC particles grow up, and the encapsulated structure gradually disappears. Al3Ti particles are free from the encapsulated structure and freely distributed in the matrix, and the rare earth Ce element continues to enrich around Al3Ti, which hinders the growth of Al3Ti particles. The aspect reacts with it to generate Ti2Al20Ce and grows up by combining [22,23], as shown in Figure 9e. In Figure 9e, TiC particles with an average size of about 2 μm, small bulk Al3Ti with an average size of about 6 μm and irregular bulk Ti2Al20Ce with an average size of about 35 μm were formed in the late stage of the reaction.
In order to further explore the specific reaction process of the Al-Ti-C-Ce system, the influence of CeO2 on the TiC synthesis method of Al-Ti-C system was studied. Combined with the DSC curve of the Al-Ti-C system in the previous research report [24], differential scanning calorimetry analysis was performed on the preforms with CeO2 size of 30 nm and 2–4 μm. The DSC curve is shown in Figure 11. The corresponding reaction heat changes are shown in Table 2. From the curve, an obvious endothermic peak and two exothermic peaks can be seen. The first endothermic peaks at temperatures of 670.5 and 671.2 °C represented the melting of aluminum, and the corresponding reaction endotherms were 173.5 and 195.5 J/g. Subsequently, the carbothermal reaction of CeO2 with C and oxygen produces CeC2, the reaction of Al with Ti produces Al3Ti and CeC2 reacts with dissolved Ti atoms to produce TiC. These reactions release a lot of heat [14,25]. Combined with literature reports [26,27], in the aluminum-rich melt, Al and Ti first form Al3Ti, and the first exothermic peak can be determined as the formation peak of Al3Ti. The formation temperatures are 783.2 and 791.7 °C, corresponding to the exothermic heat of 168.8 and 137.7 J/g. The second exothermic peak is the peak formed by TiC, the formation temperatures are 926.1 and 933.6 °C, and the corresponding exotherms of the reaction are 92.99 and 198.6 J/g. Compared with the Al-Ti-C system, it is found that the addition of CeO2 does not affect the melting point temperature of aluminum, but it reduces the latent heat of aluminum melting and accelerates the melting of aluminum. The smaller the size of CeO2, the lower the heat required for aluminum melting. Furthermore, the addition of CeO2 reduces the formation temperature and heat release of Al3Ti and TiC. The smaller the size of CeO2, the lower the formation temperature. The lower the heat released, the lower the temperature of the system, which affects the growth rate and growth habit of the second phase particles and is beneficial to obtaining Al3Ti and TiC with smaller size and regular shape.

3.3. Refinement Performance Evaluation

Figure 12 shows the macrographs of A 99.7 with different 0.3% master alloys. Figure 12a indicates that the unrefined pure aluminum is mainly composed of coarse equiaxed crystals in the center and columnar crystals in the middle and edges. From Figure 12b, it can be seen that Al-Ti-C master alloy has a significant refinement effect on A 99.7. After adding it into the melt of A 99.7, the coarse equiaxed crystals are refined into fine equiaxed crystals, while the range of columnar crystals is narrowed and the size is reduced. It can be seen from Figure 12c–f that the refining effect of Al-Ti-C-Ce master alloy is higher than Al-Ti-C master alloy, and the #2 alloy and #5 alloy have a better refining effect than #3 alloy and #4 alloy. Among them, the refining effect of #4 alloy with CeO2 size of 1 μm is the worst.
Figure 13 shows the statistical results of the average grain size of the refined sample in Figure 12. It can be seen from Figure 13 that after 0.3% of Al-5Ti-0.62C, master alloys can refine the A 99.7 grain size from 1430 to 790 μm, while 0.3 wt.% #2 alloy refined the grain size of A 99.7 to 248 μm, and with the increased size of CeO2, grain size of A 99.7 tends to increase first and then decrease. The #5 alloy has a significant refinement effect on A 99.7, which can refine the grain size to 227 μm. The above analysis shows that the addition of CeO2 with a size of 2–4 μm to master alloy can promote its refining effect.

4. Conclusions

(1)
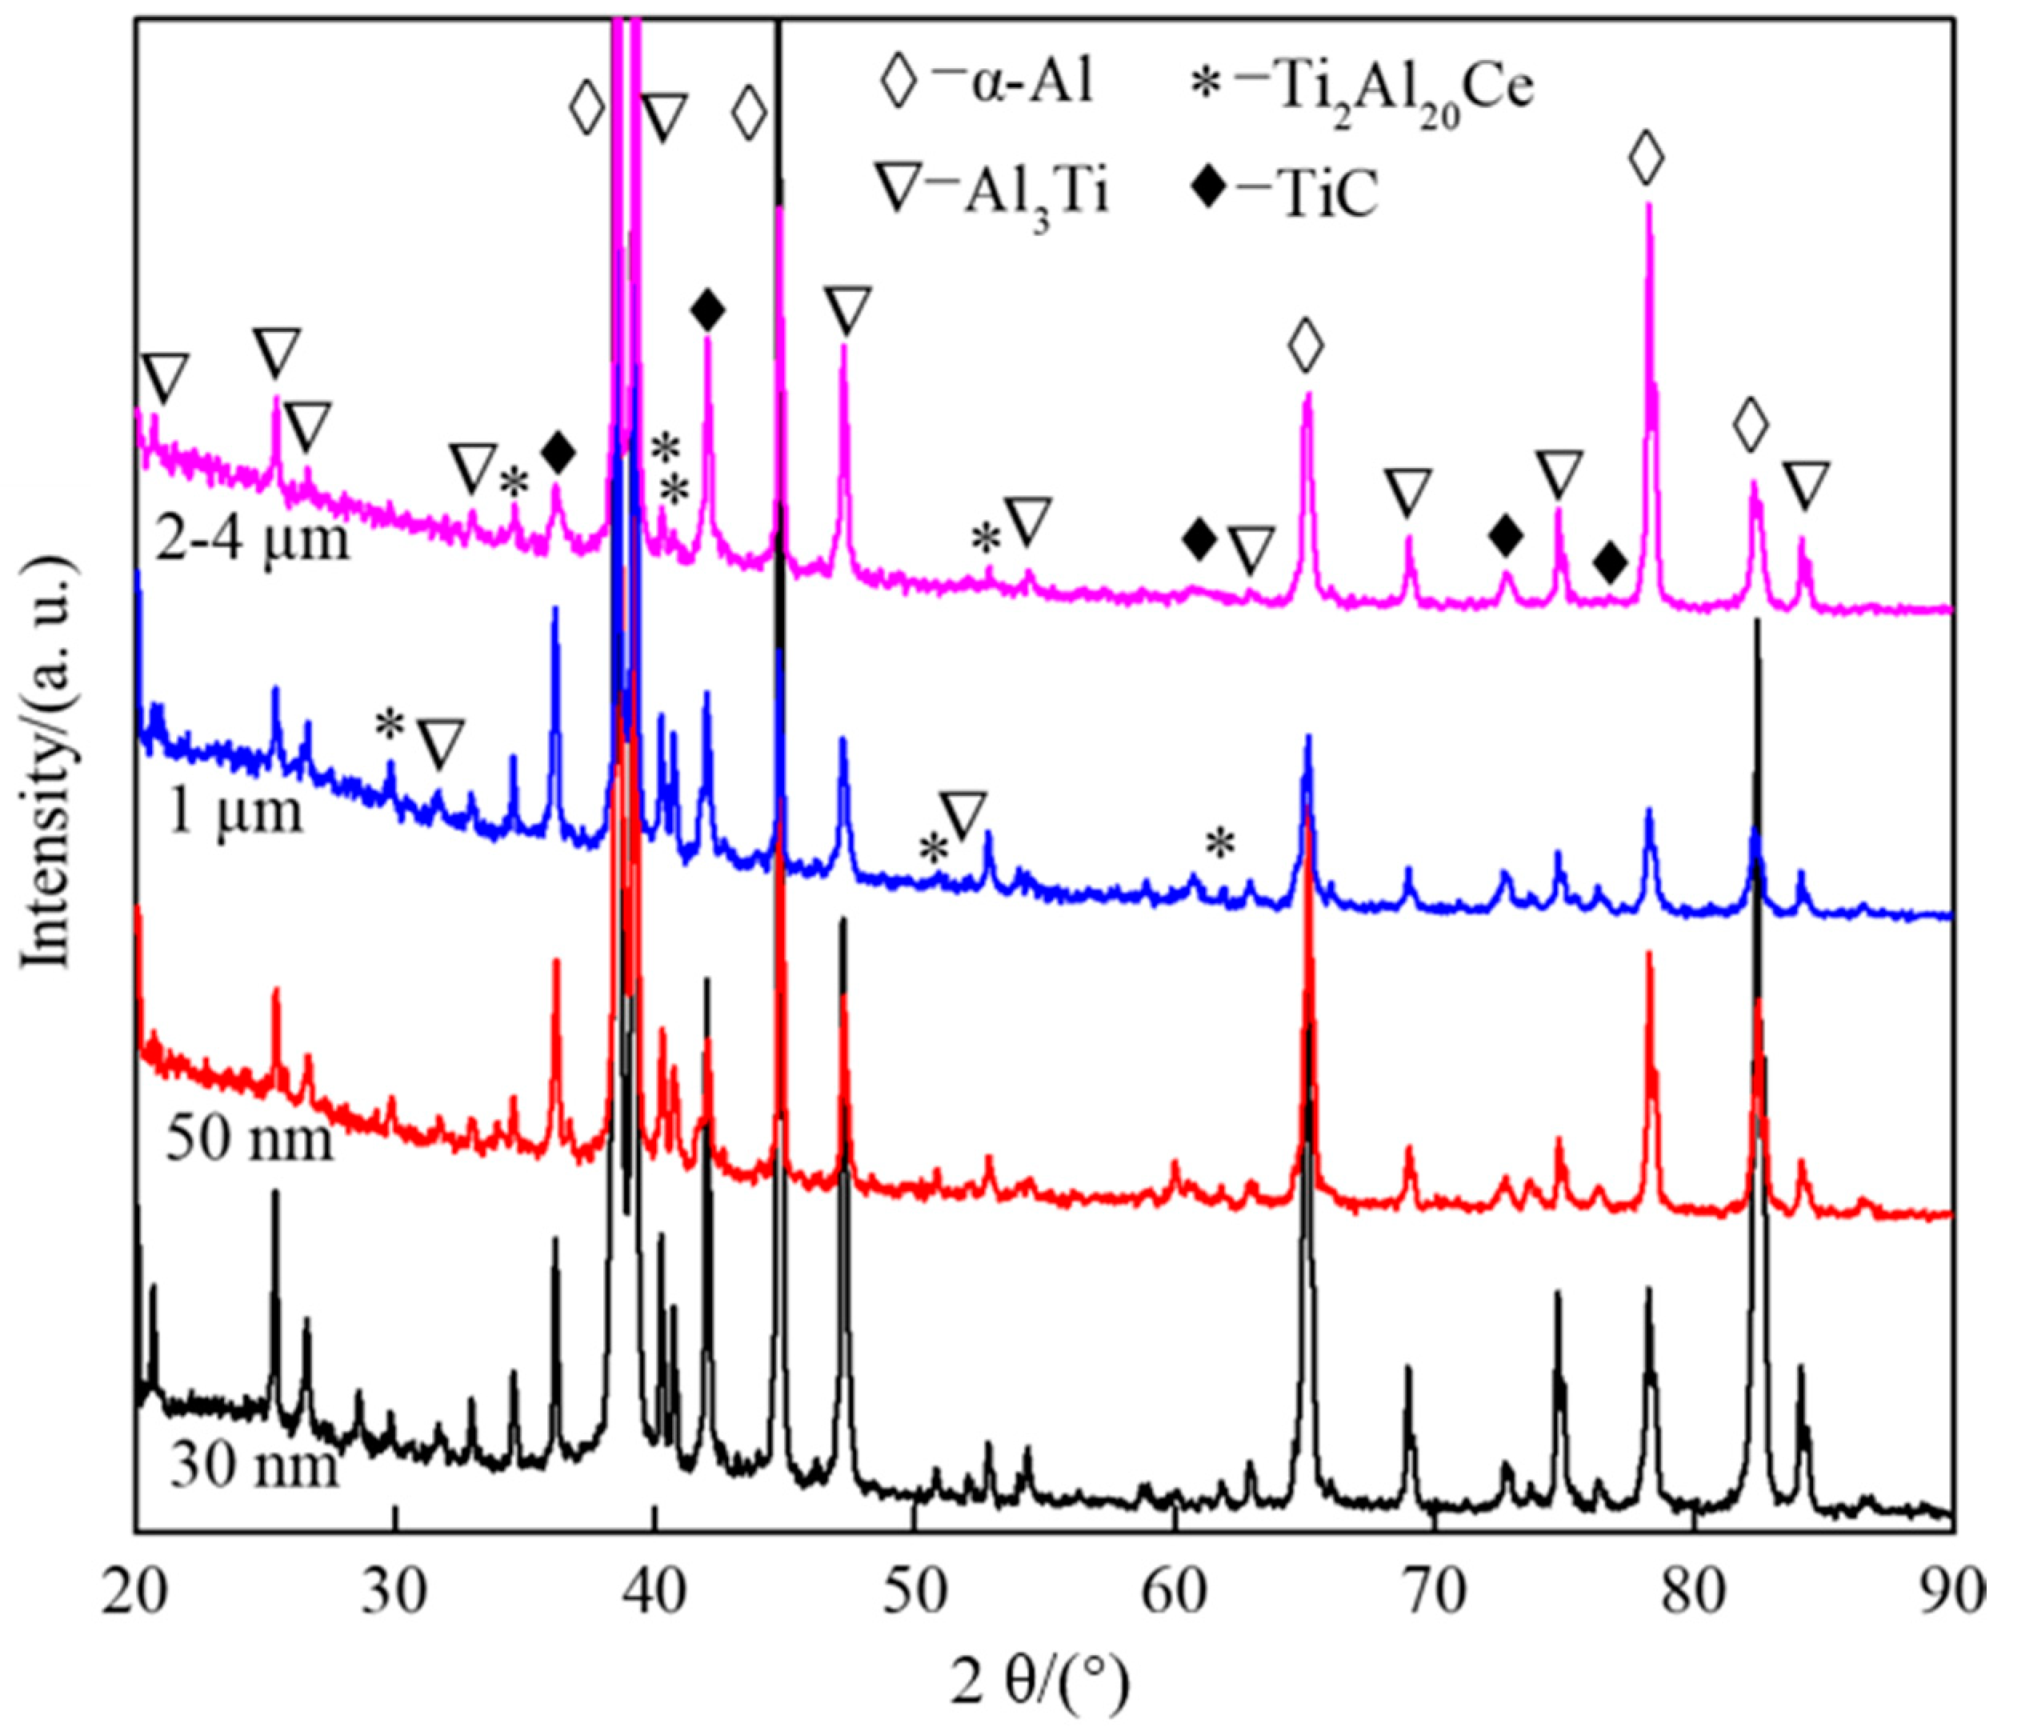
The Al-Ti-C-Ce system is mainly composed of α-Al, Al3Ti, TiC and Ti2Al20Ce. The addition of CeO2 can obviously speed up the progress of the reaction, and the promotion effect of CeO2 size is 2–4 microns.
(2)
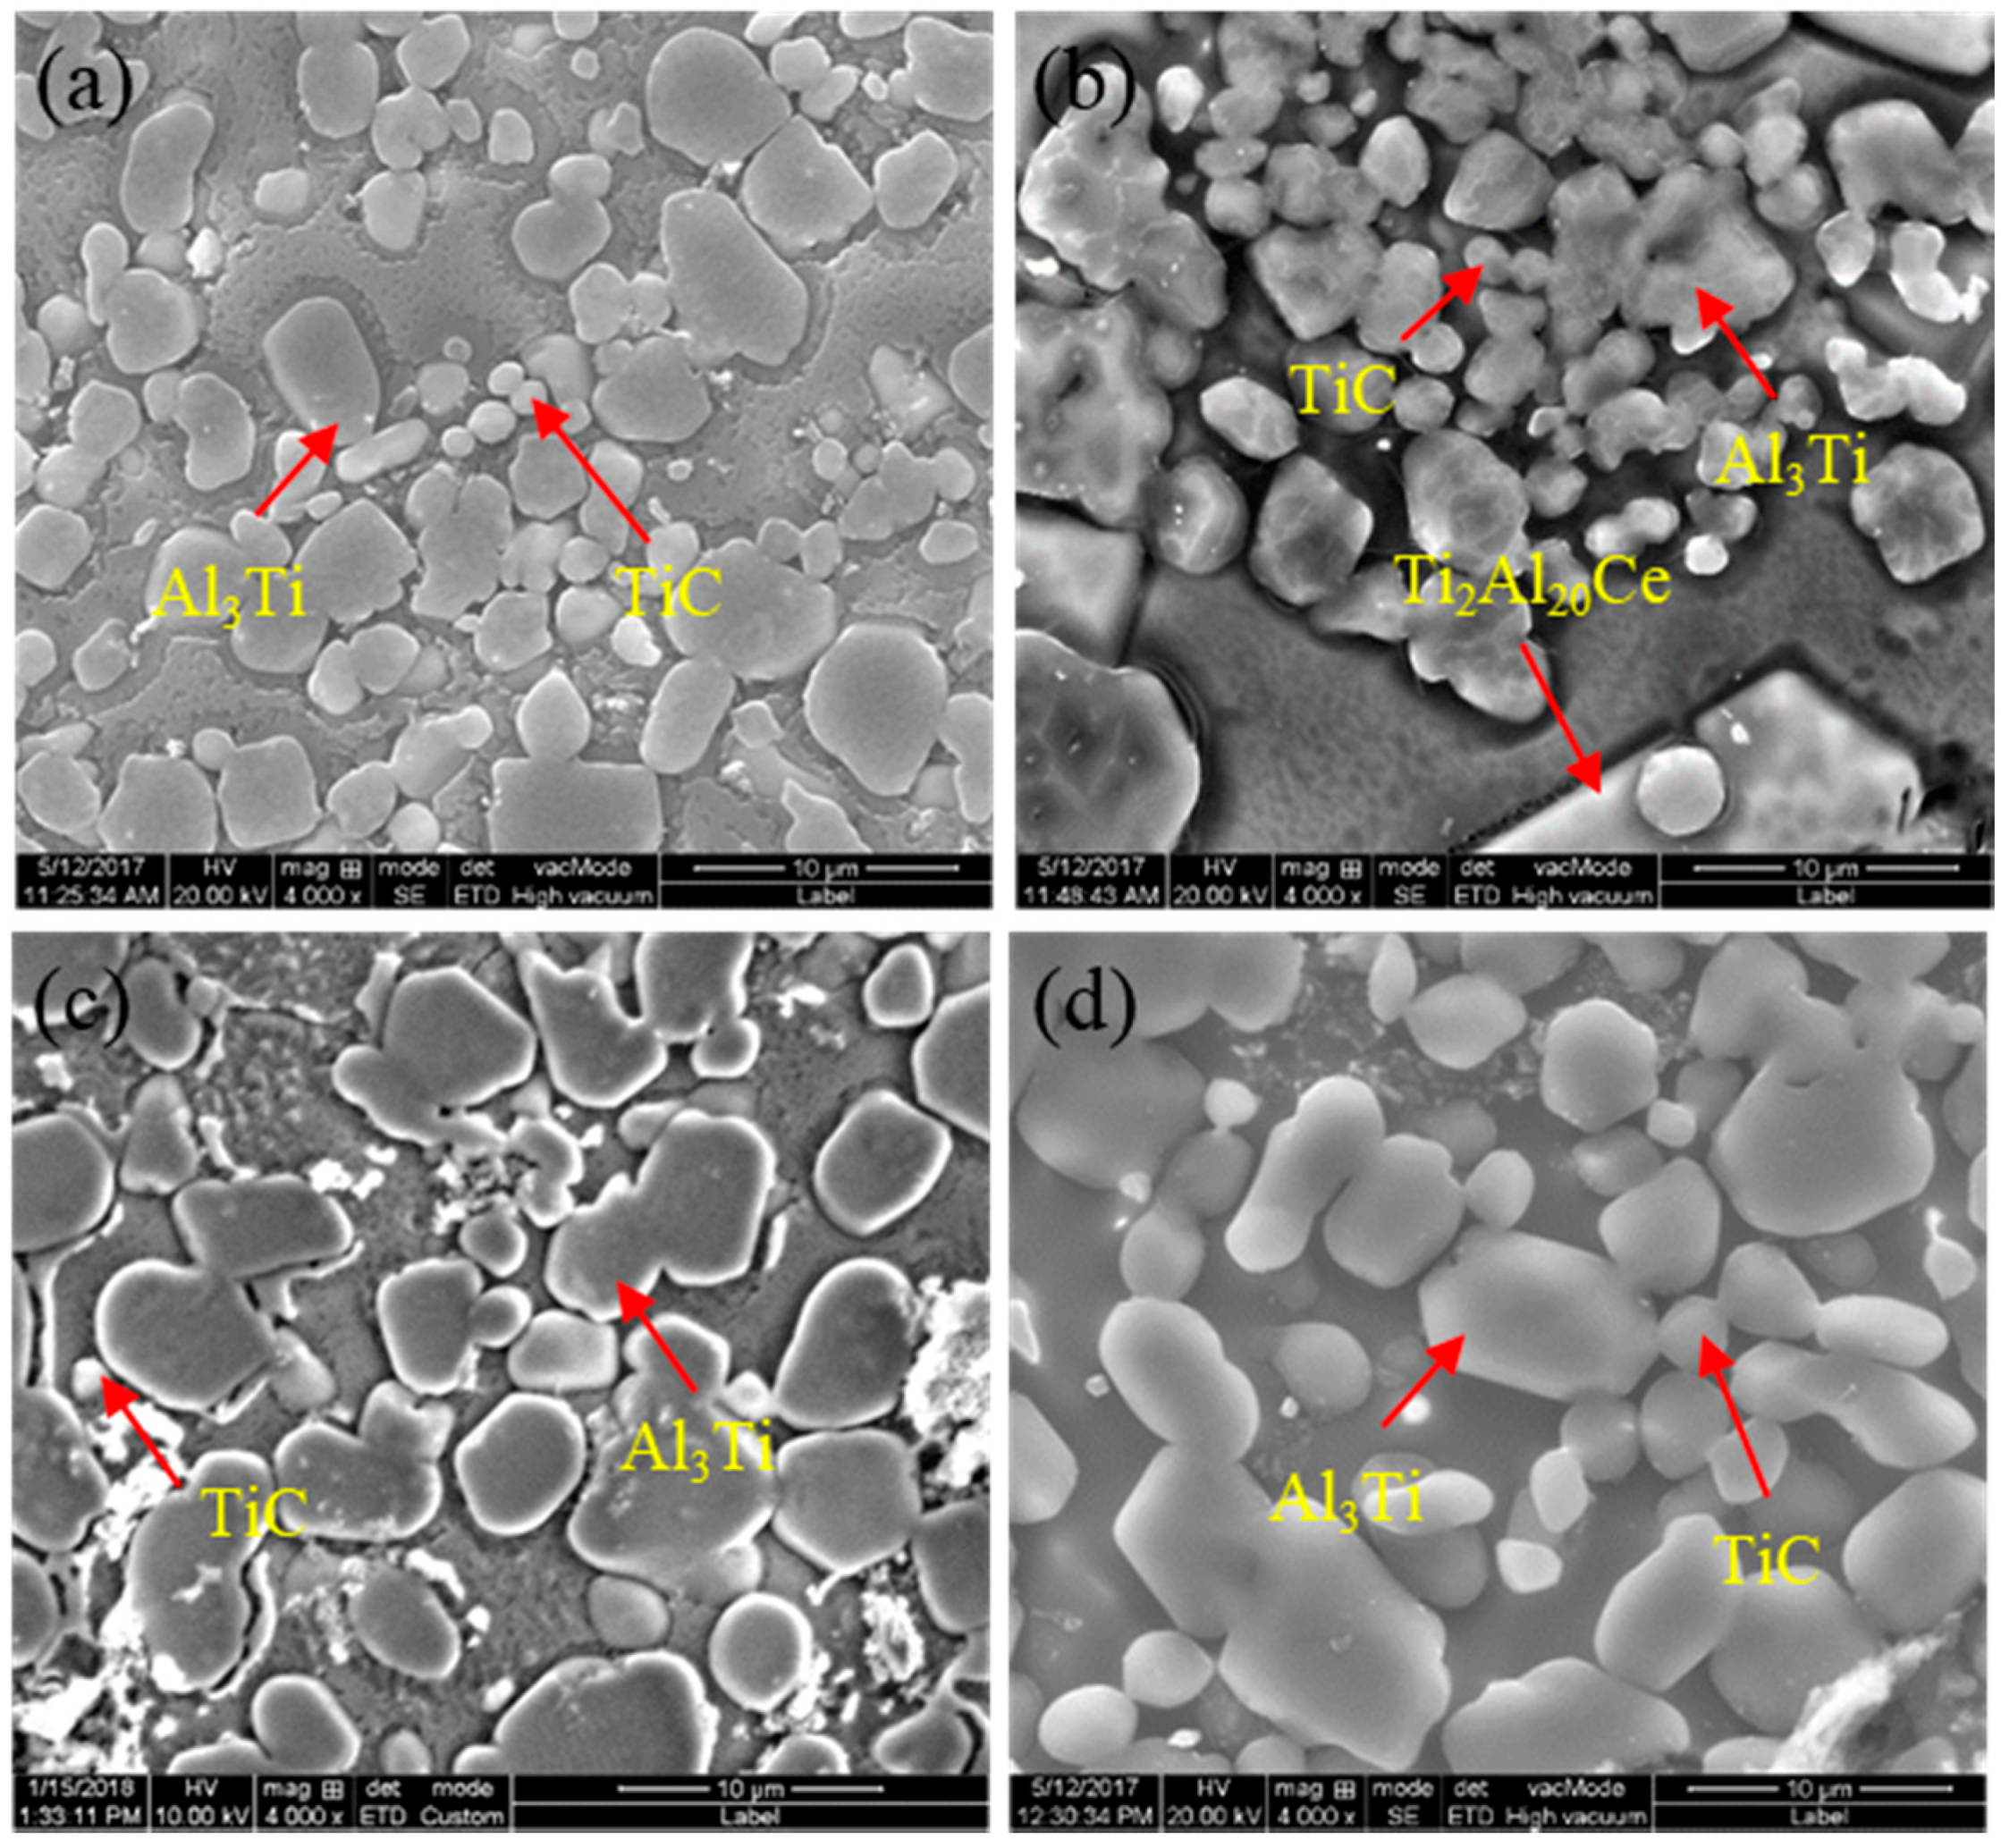
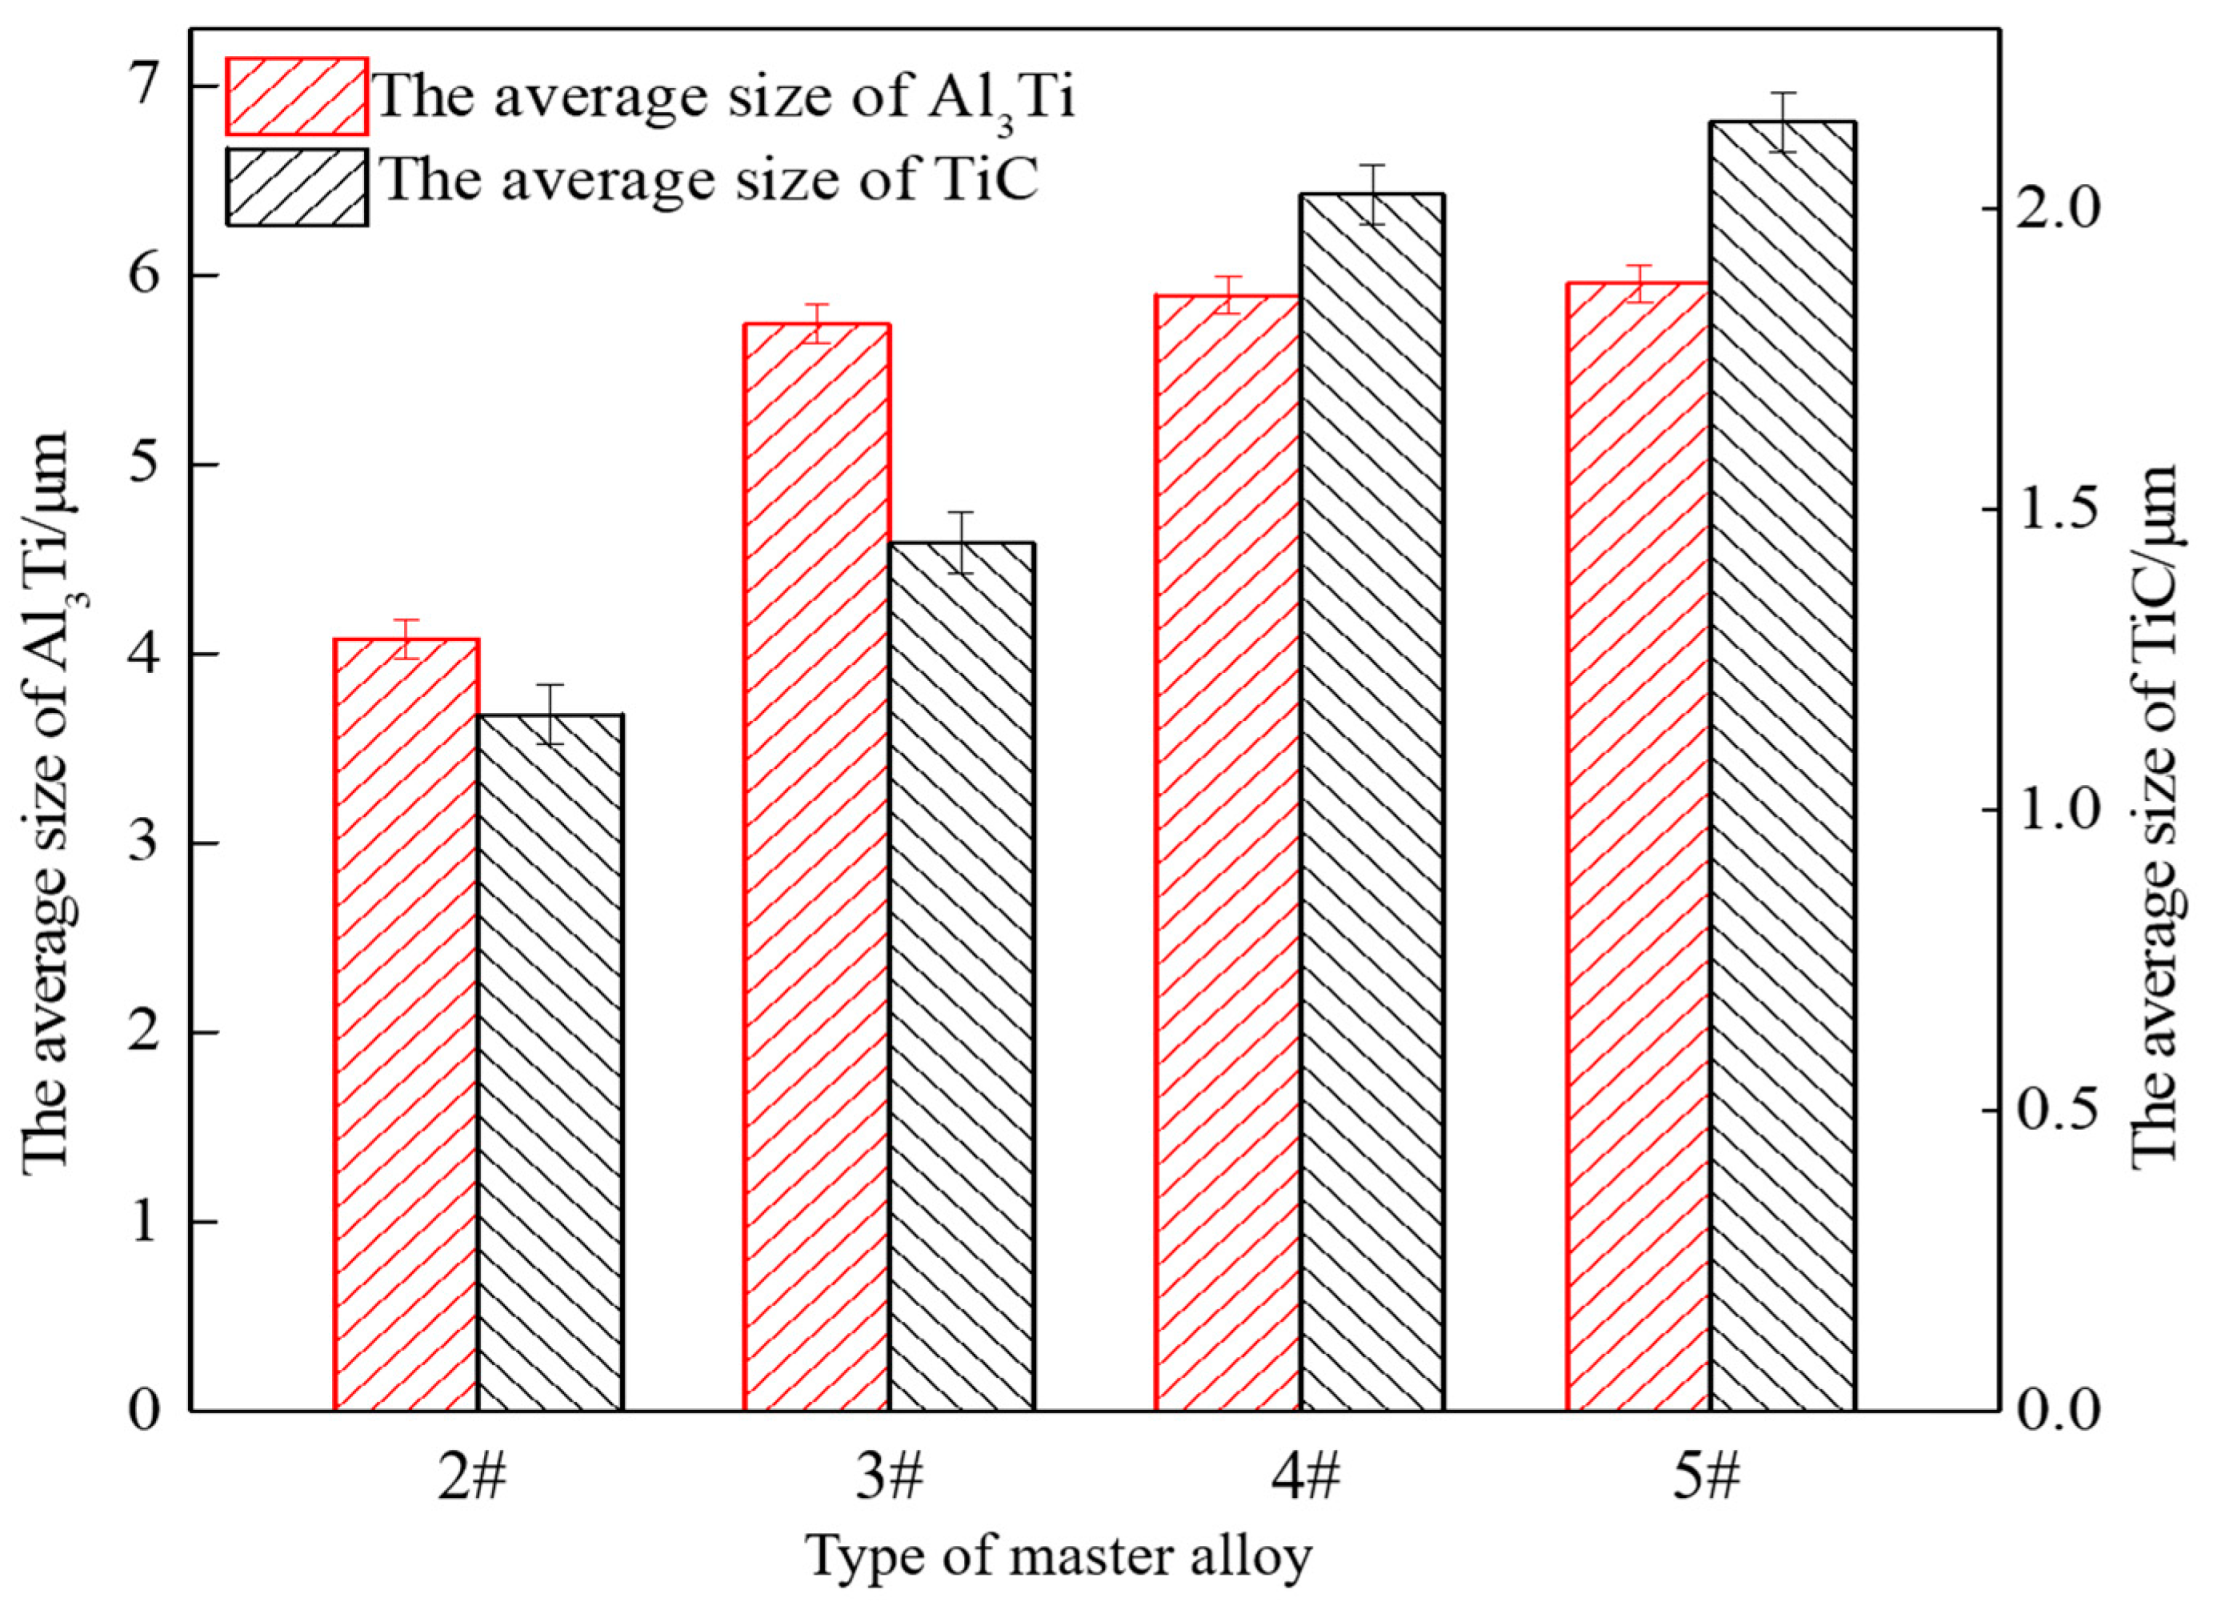
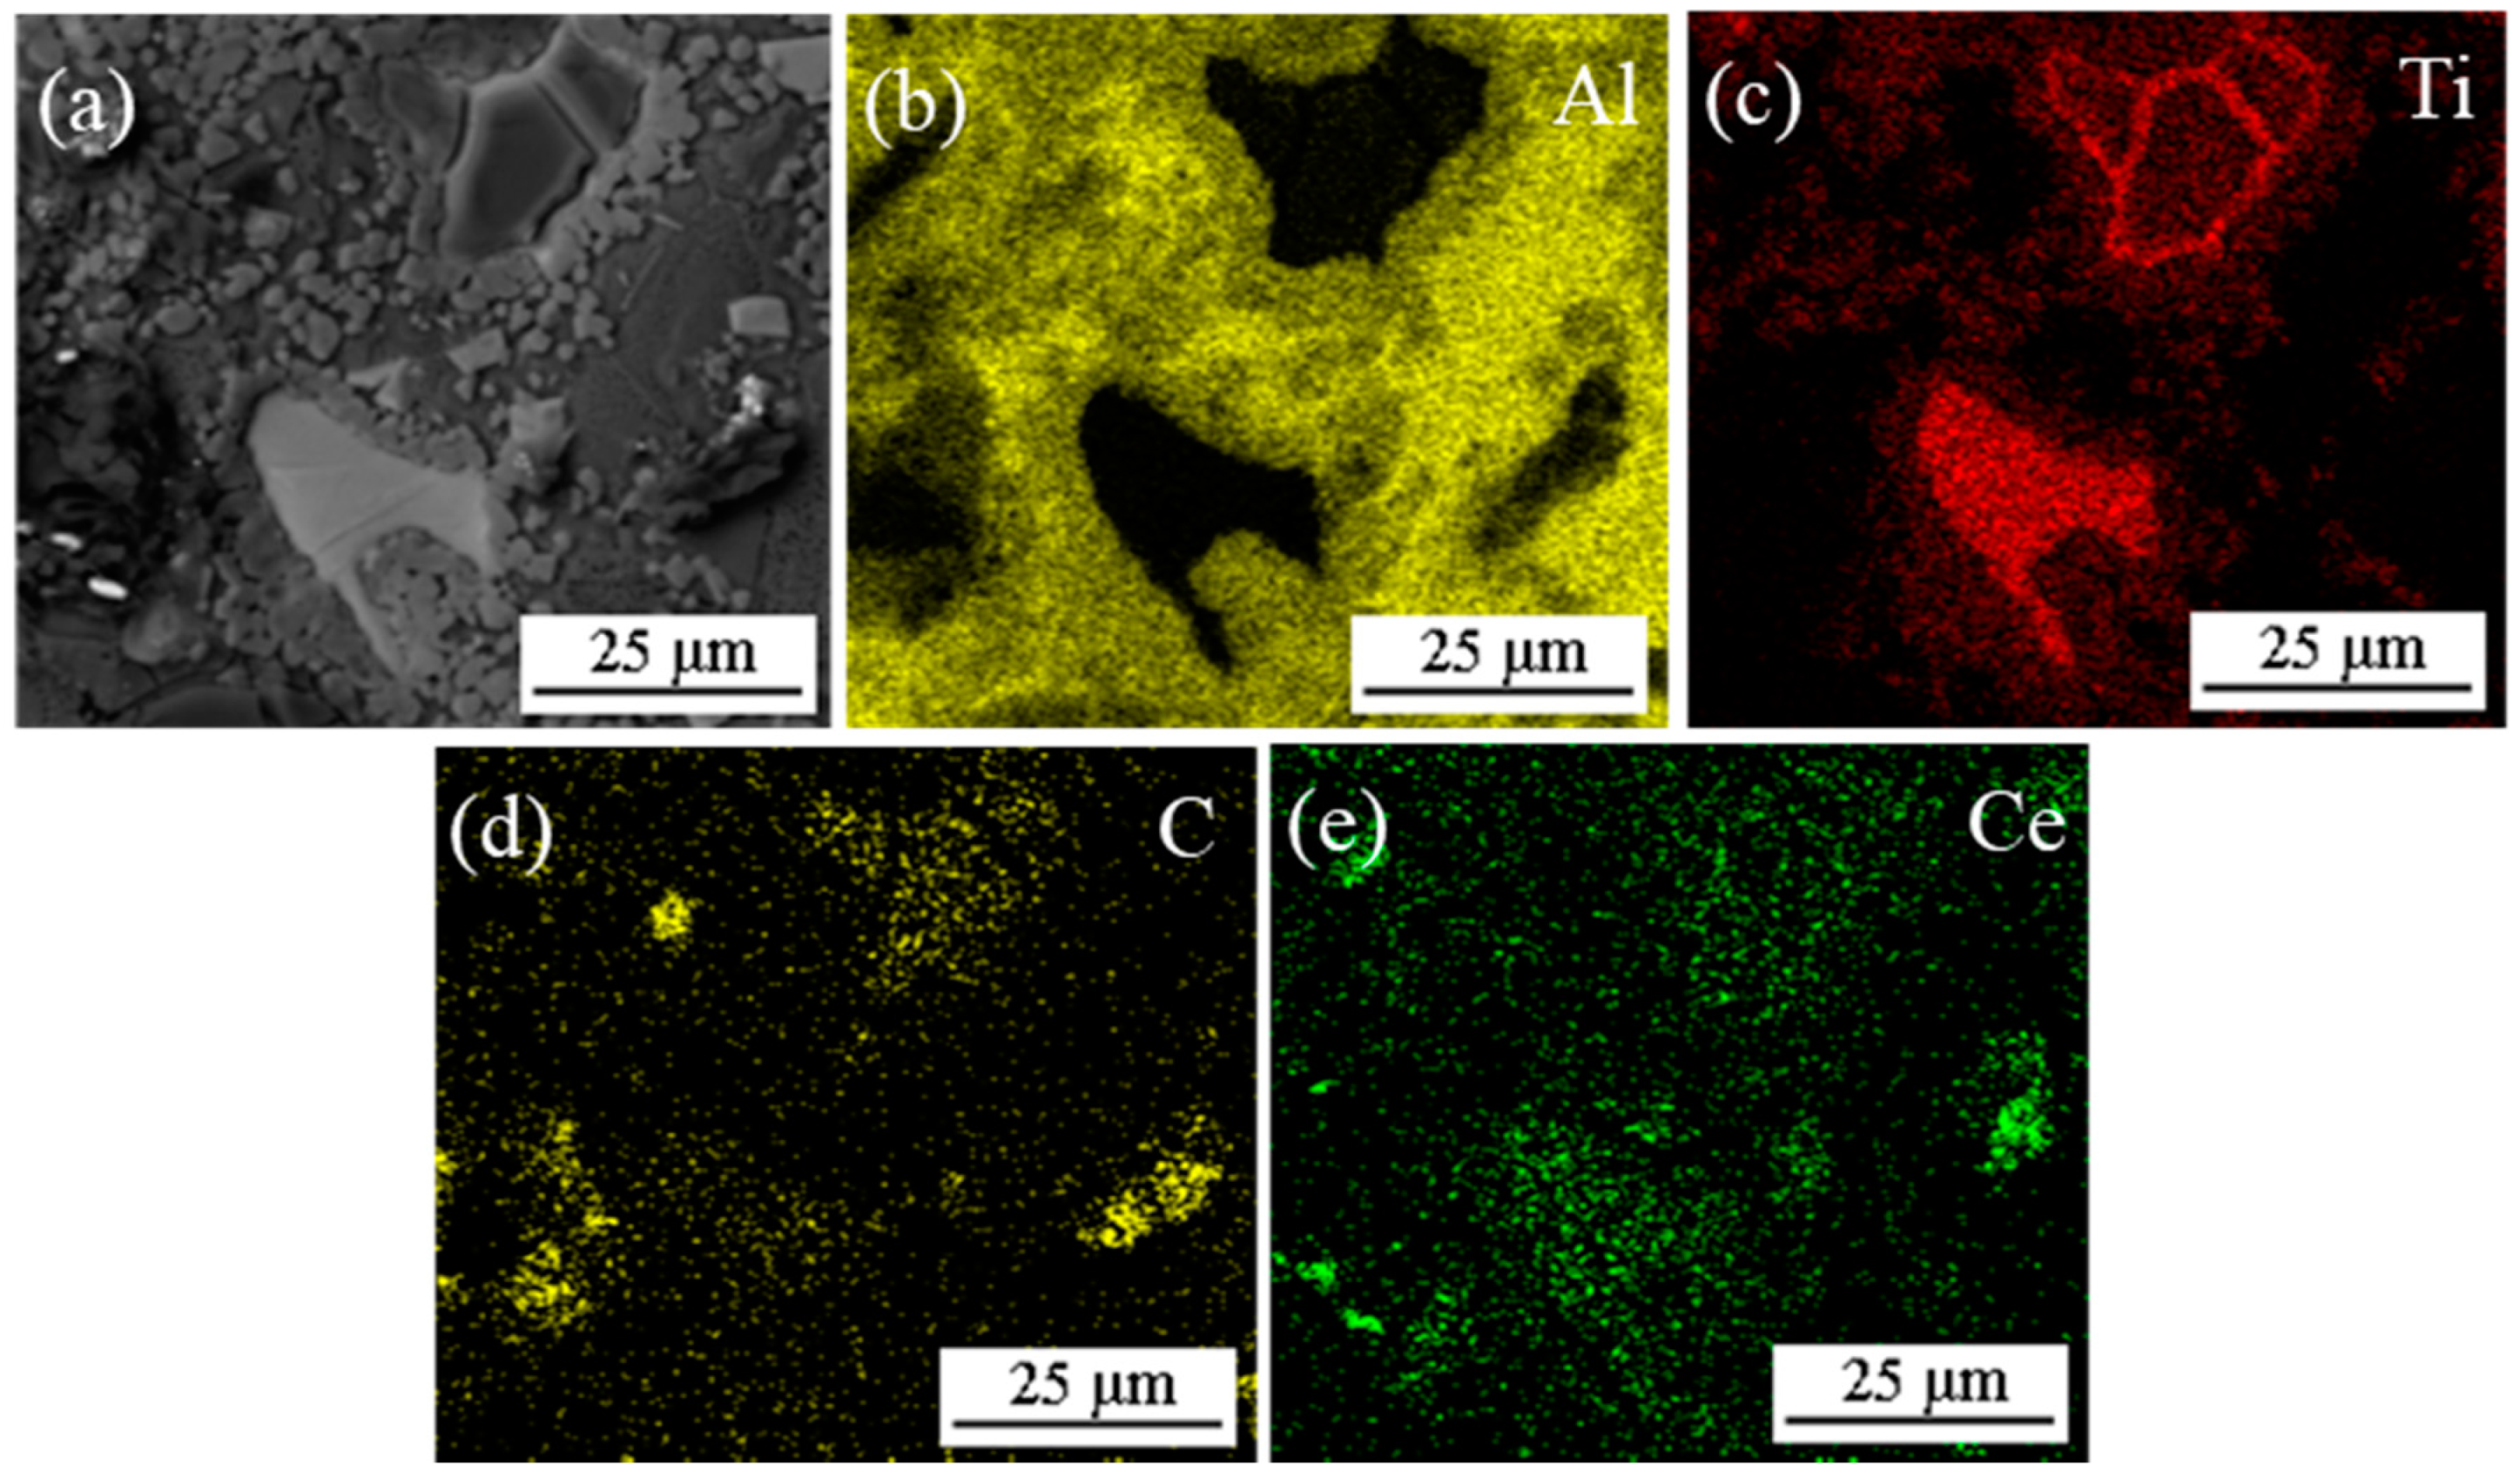
The addition of CeO2 can promote the uniform distribution of Al3Ti and TiC, reduce the size of Al3Ti and TiC, and the smaller the size of CeO2, the smaller the size of Al3Ti and TiC synthesized in the system.
(3)
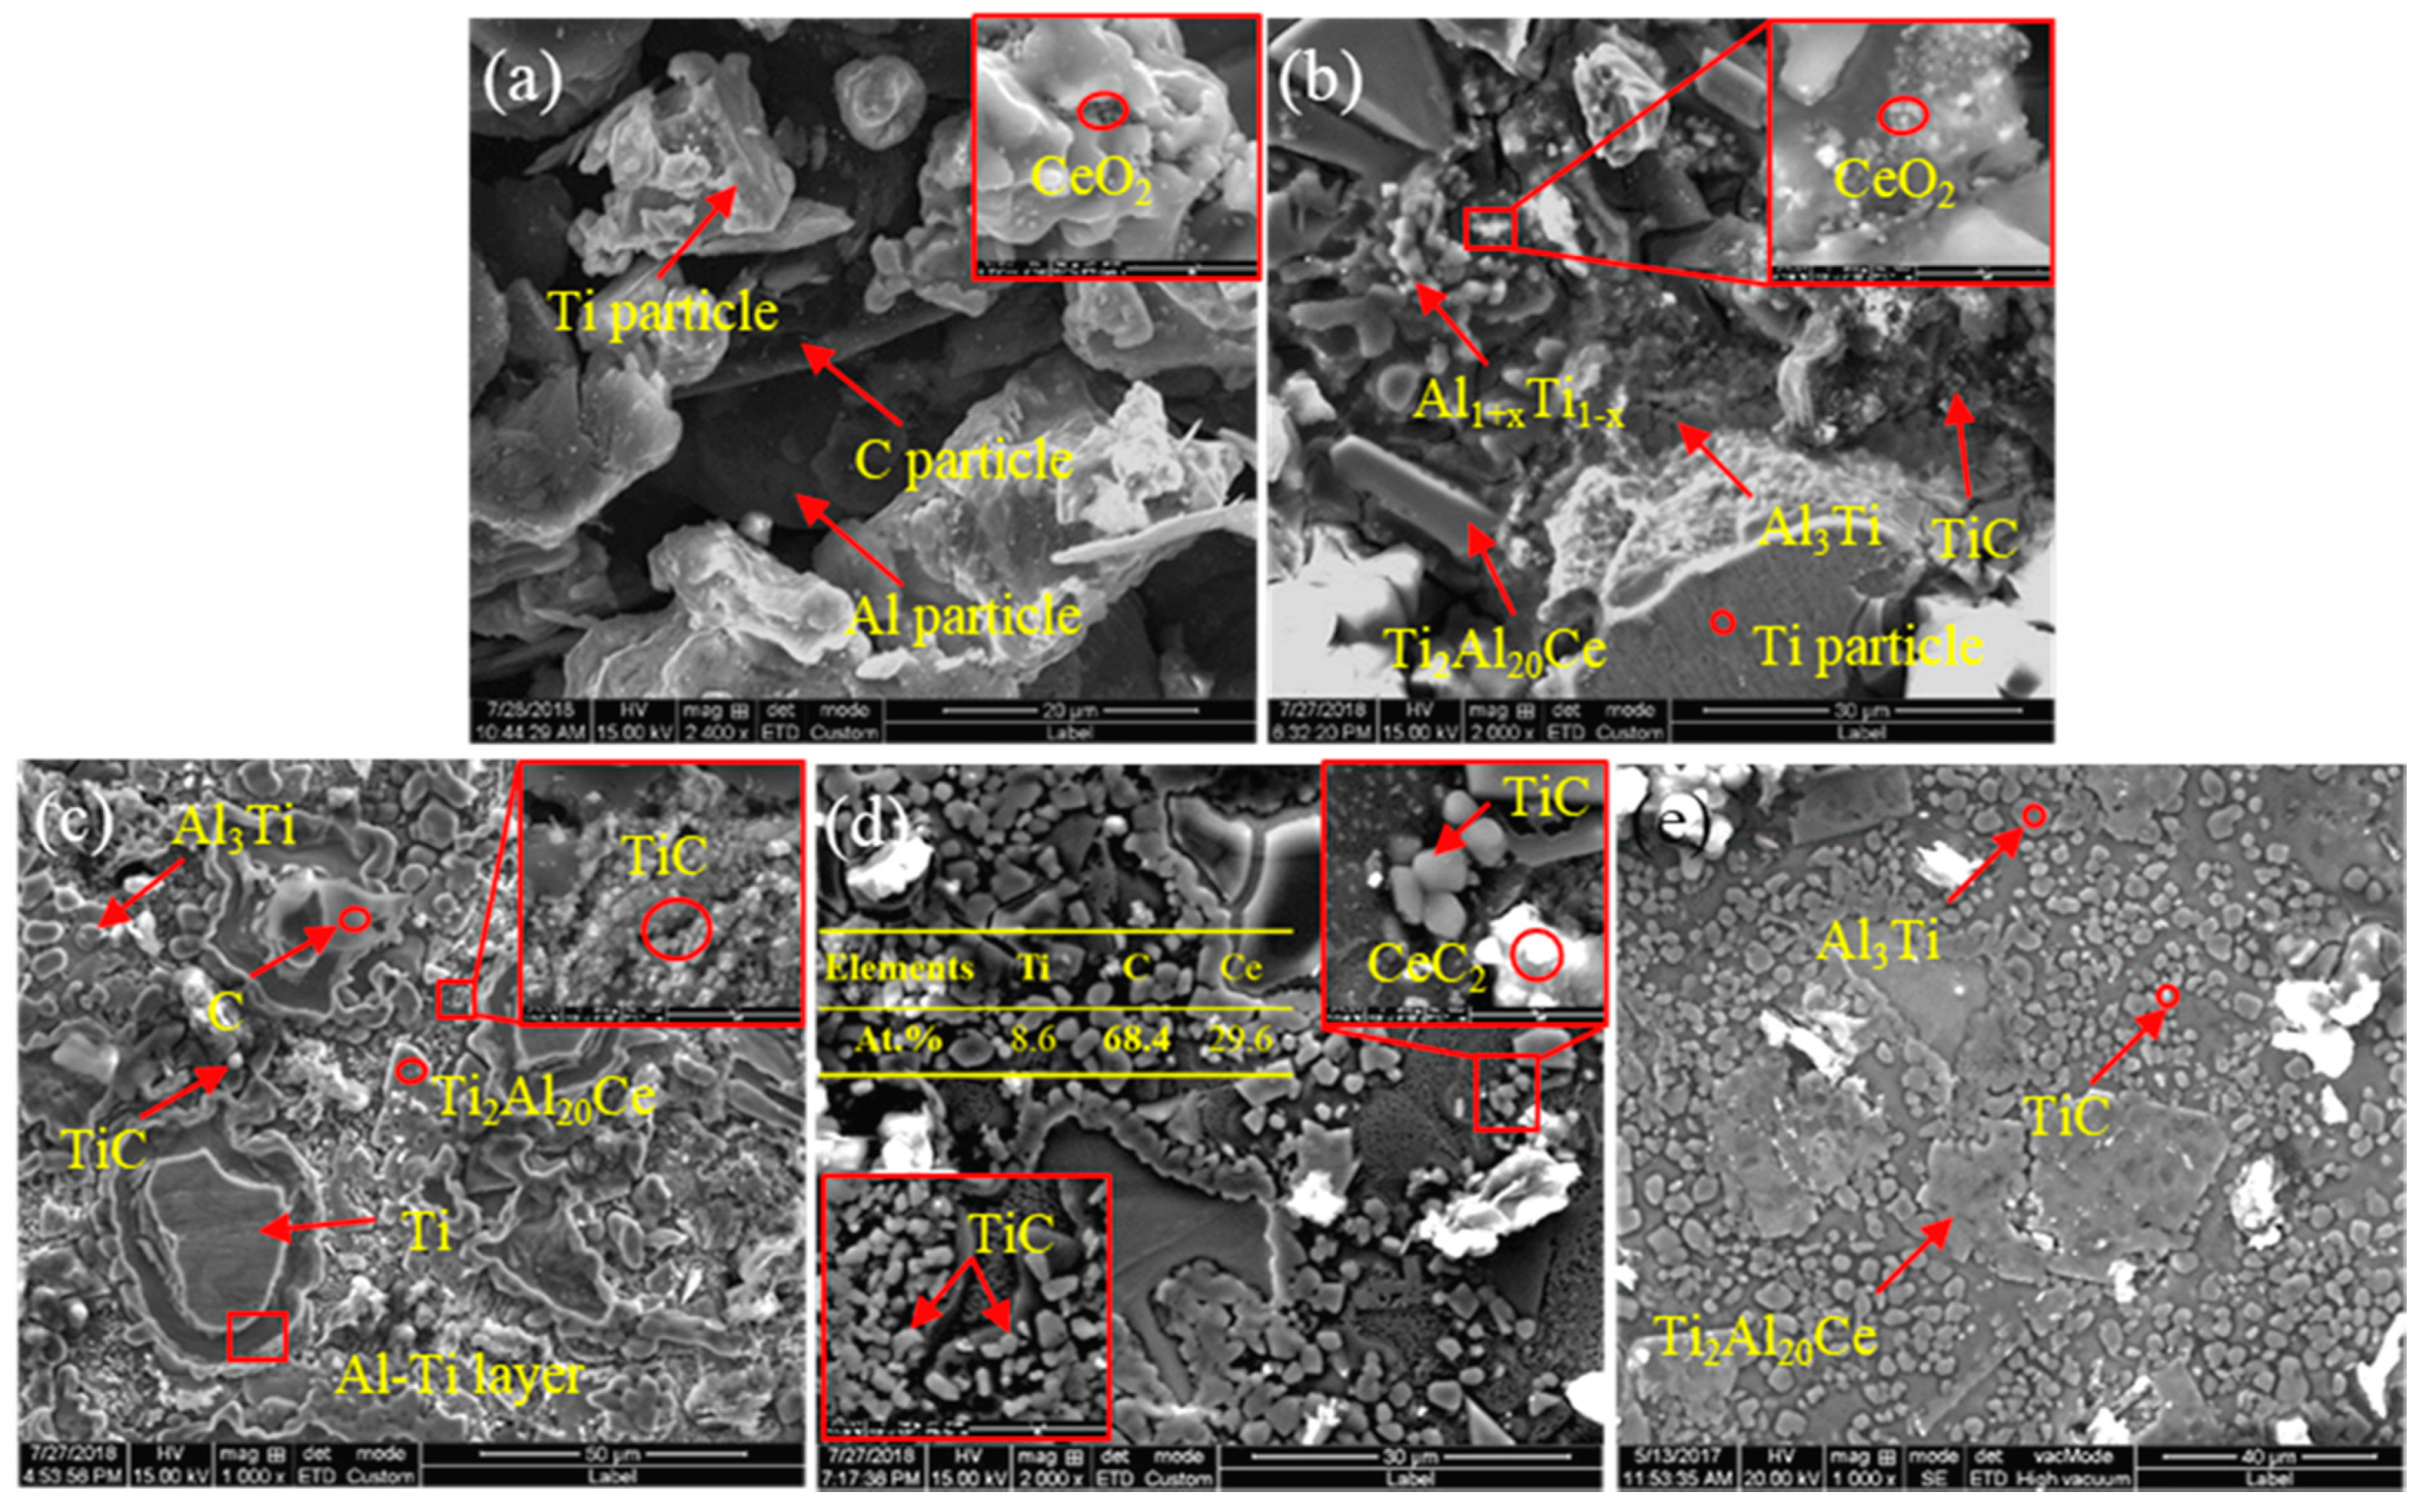
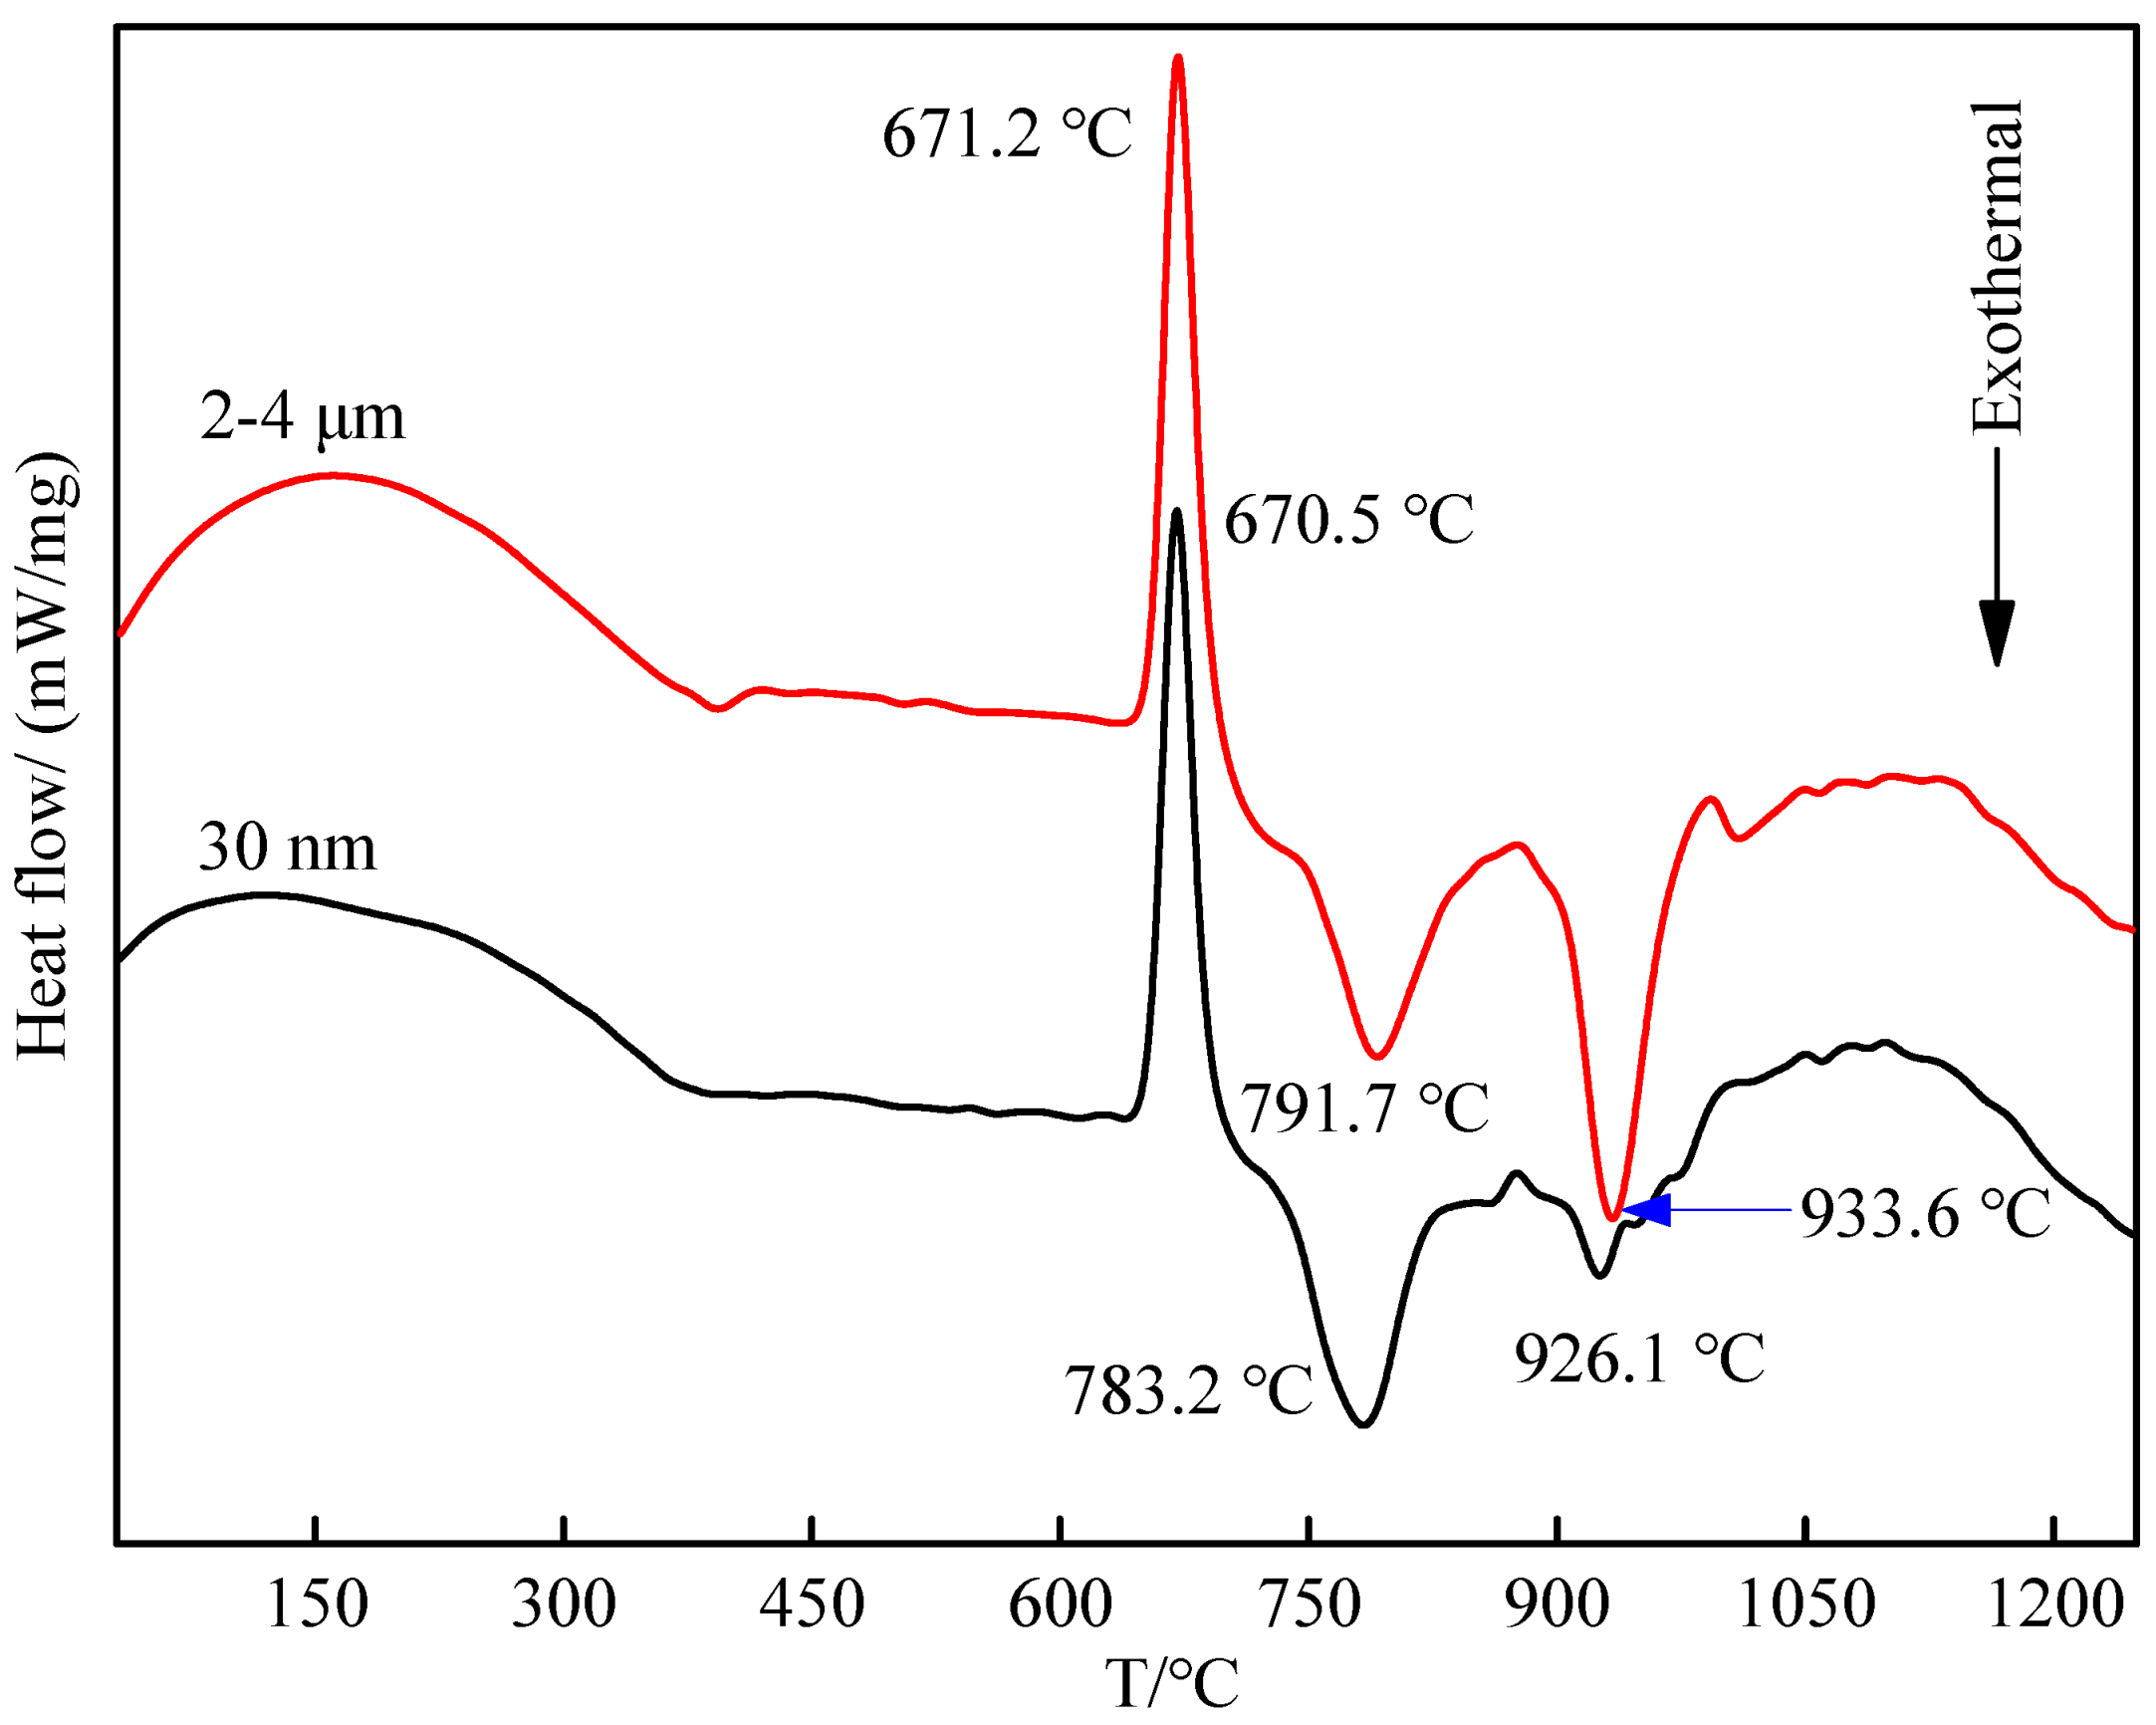
The addition of CeO2 reduces the latent heat of melting of aluminum, accelerates the melting of aluminum, promotes the reaction process and lowers the formation temperature of second-phase particles. The smaller the size of CeO2, the lower the formation temperature of Al3Ti and TiC, and the smaller the heat released by the synthesis of TiC.
(4)
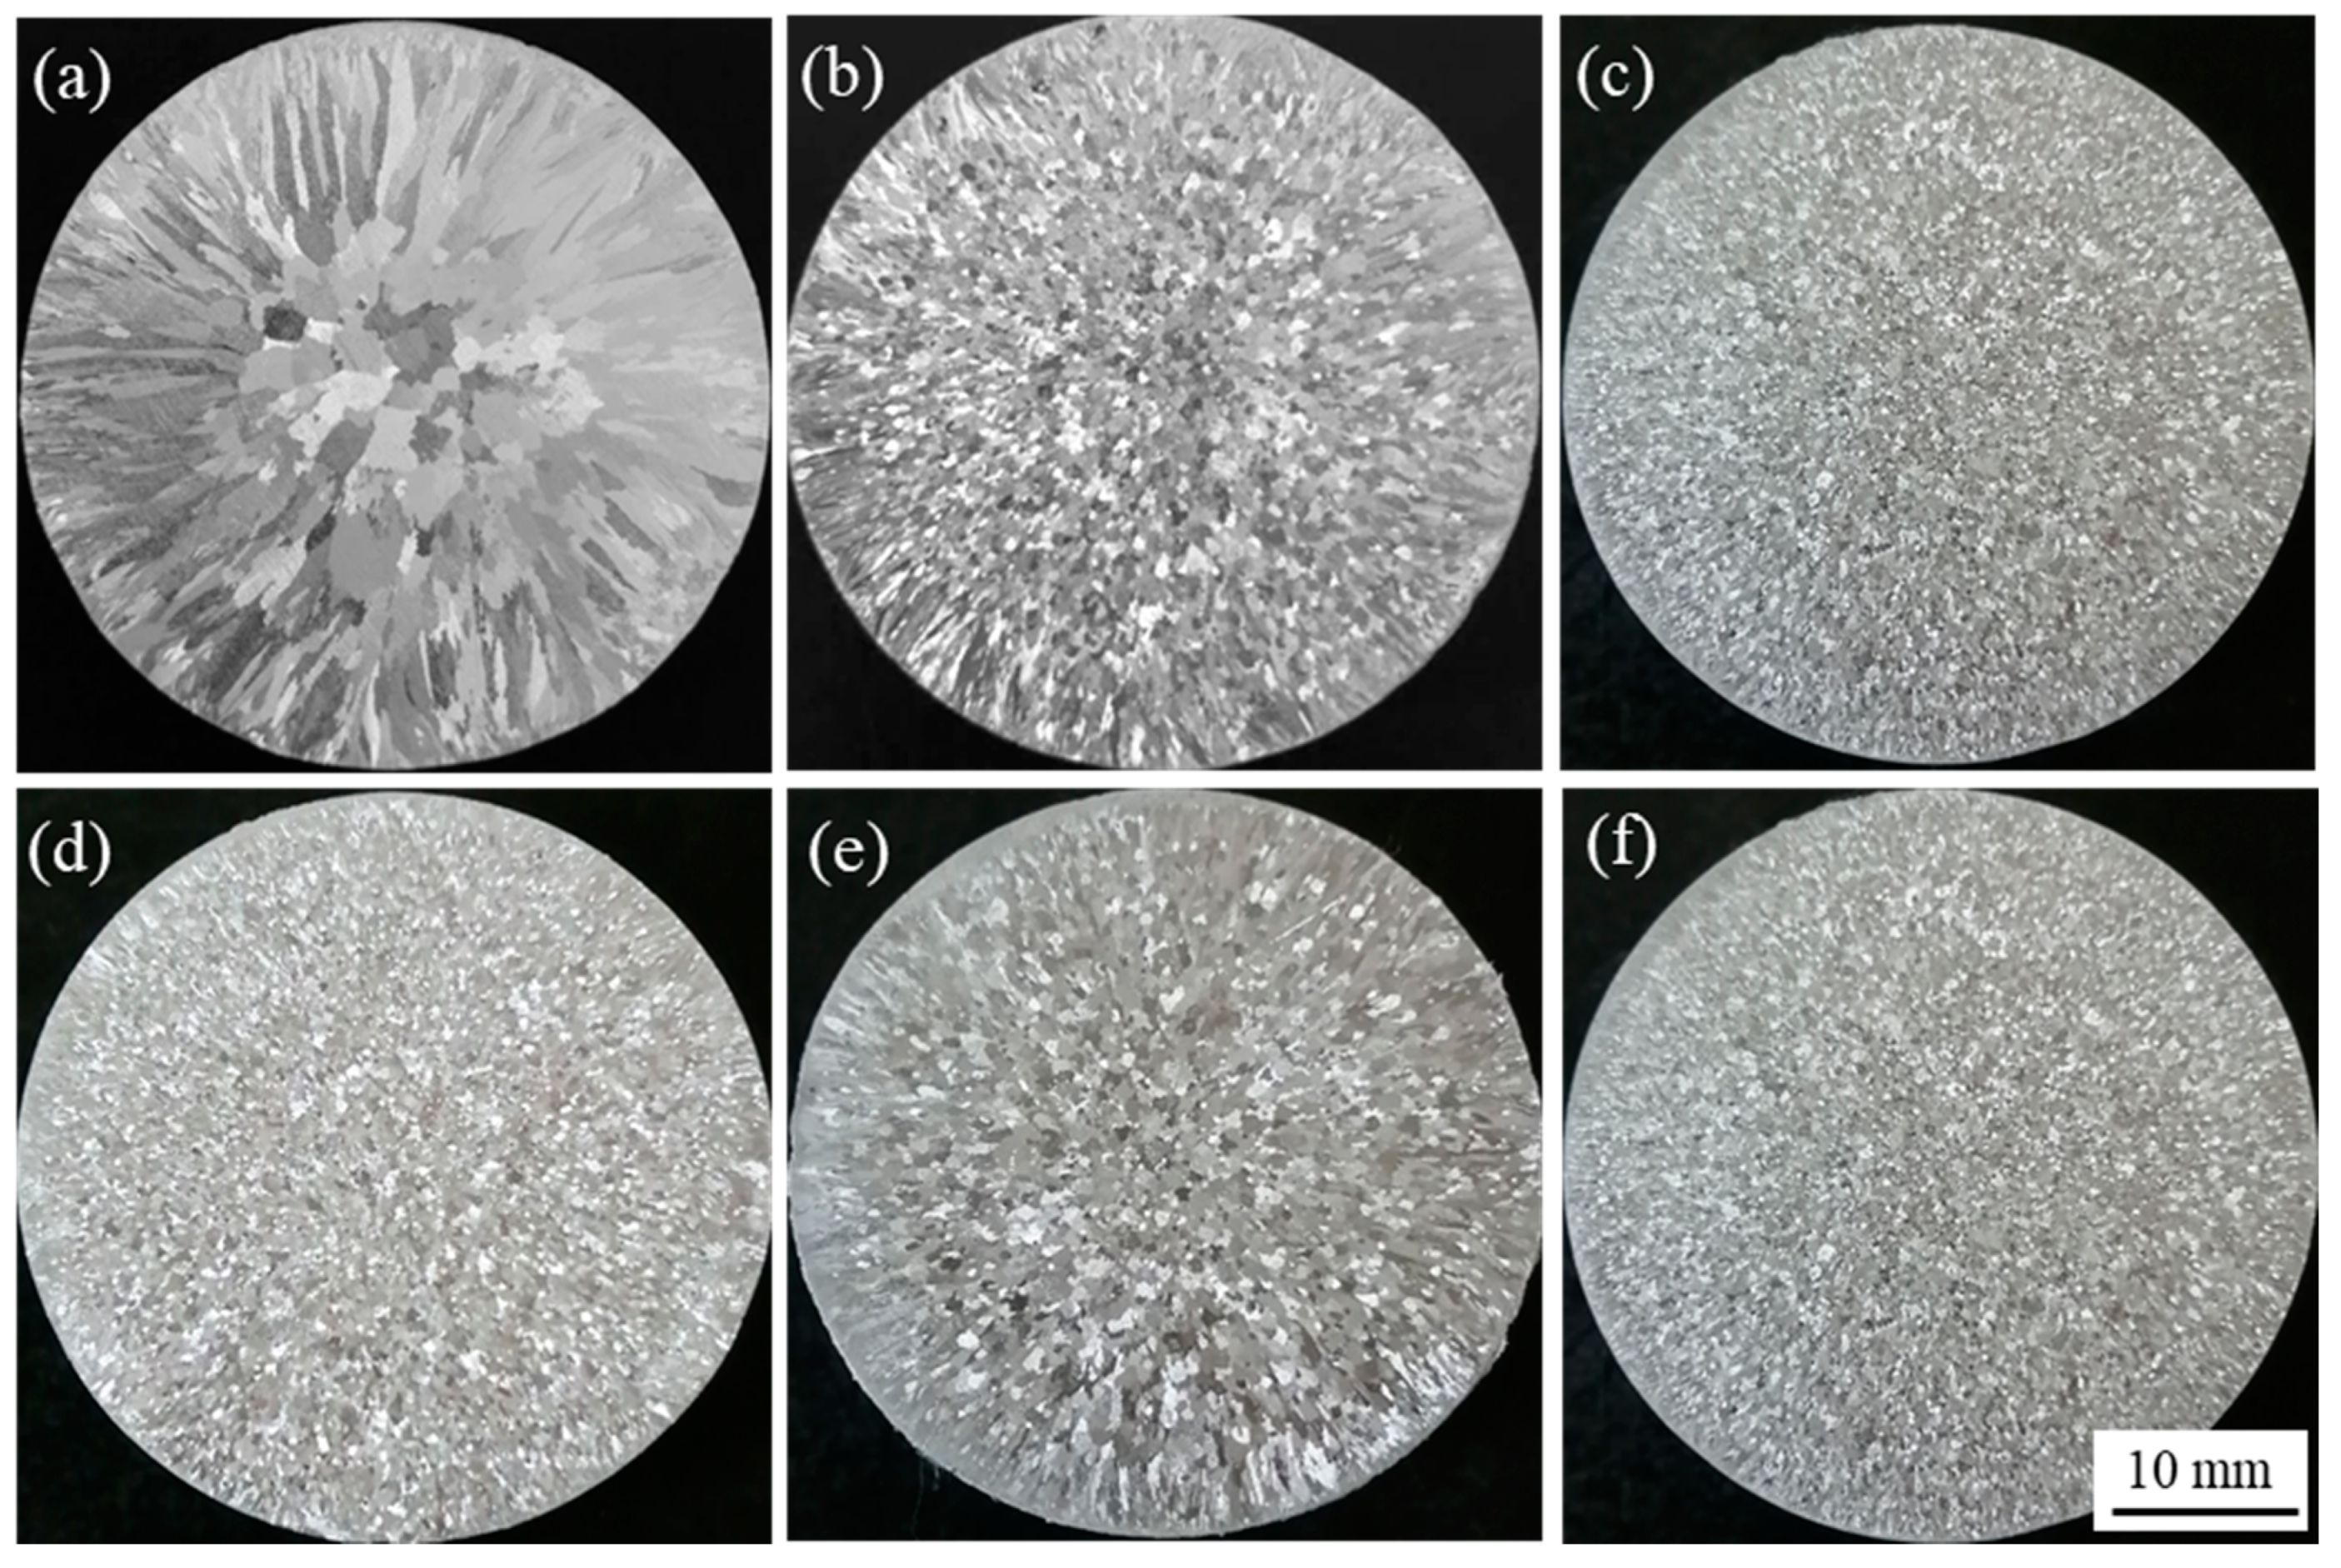
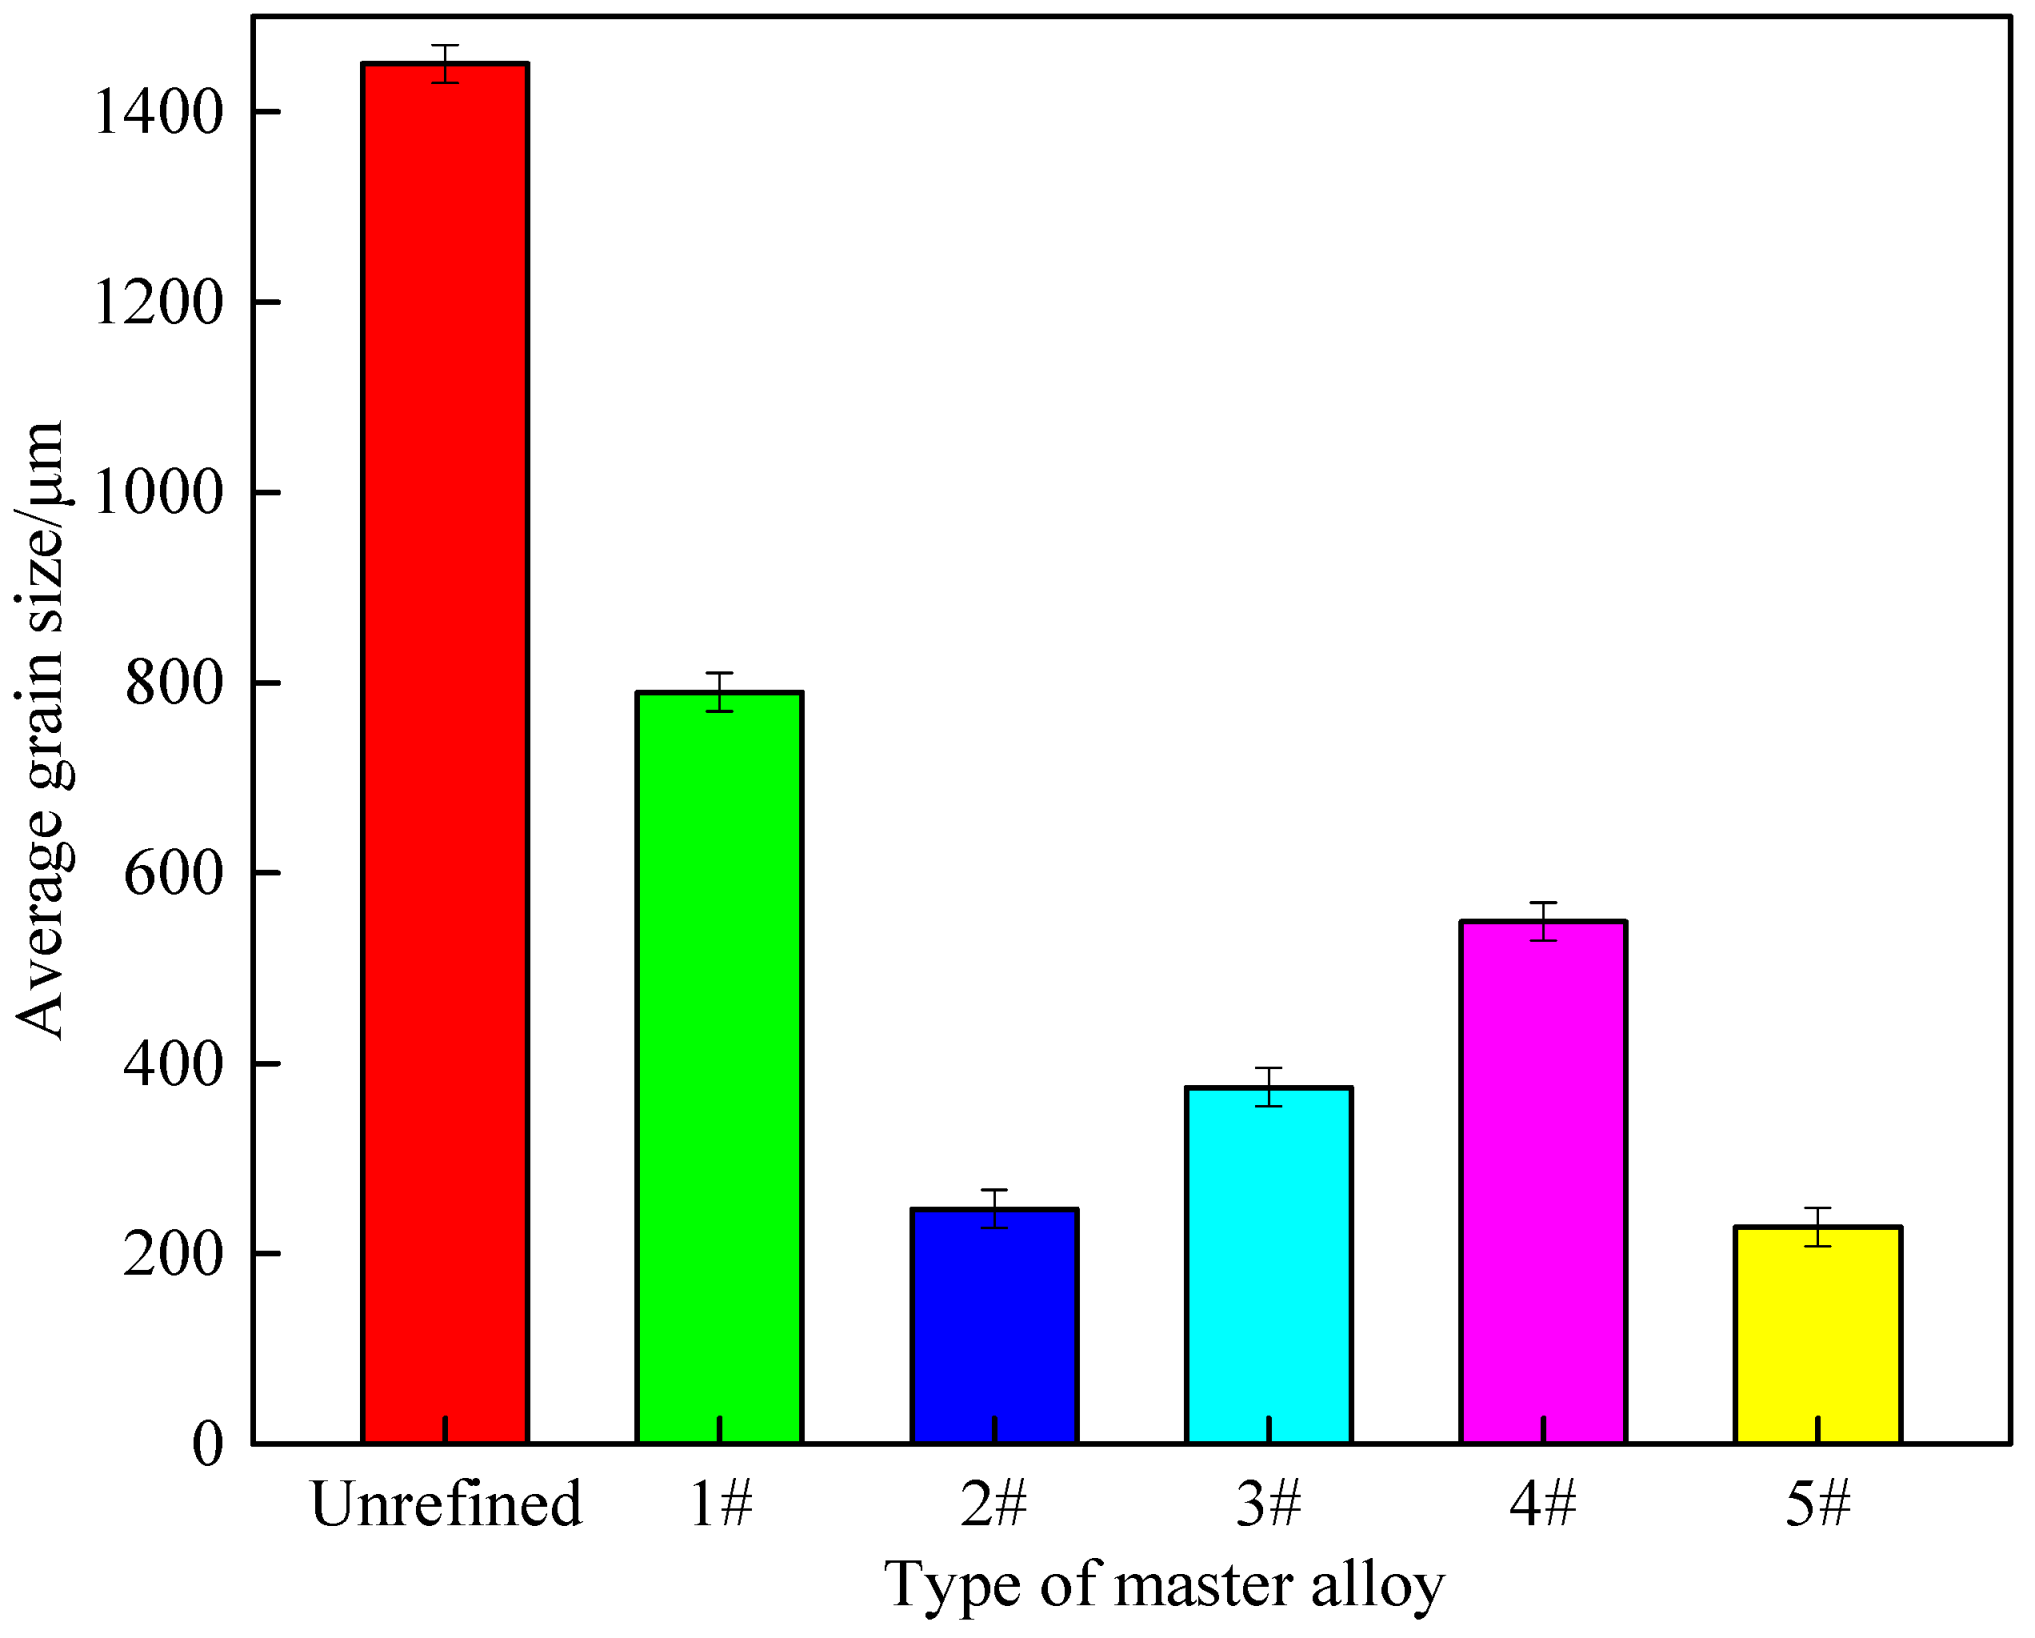
Al-Ti-C-Ce master alloy has a significant refinement effect on A 99.7. With the increase in CeO2 size, the refinement effect tends to increase first and then decrease. When the CeO2 size is 2–4 μm, Al-Ti-C-Ce master alloy has the best refining effect.

Author Contributions

W.D. and T.C. conceived and designed the experiments; Y.M. and T.C. carried out the experiments and data collection; W.D., Y.M., T.C. and L.G. analyzed the data, Y.M. and W.D. contributed reagents/materials/analysis tools: Y.M., T.C. and L.G. wrote the paper. All authors have read and agreed to the published version of the manuscript.

Funding

National Natural Science Foundation of China (grant numbers 52161006 and 51661021) Industrial Support Plan Project of Gansu Provincial Department of Education (2021CYZC-23). China Postdoctoral Science Foundation, 2019M653896XB.

Institutional Review Board Statement

Not applicable.

Informed Consent Statement

Not applicable.

Data Availability Statement

Exclude this statement.

Acknowledgments

This work was supported by the National Natural Science Foundation of China (grant numbers 52161006 and 51661021) and Industrial Support Plan Project of Gansu Provincial Department of Education (2021CYZC-23). The authors would like to acknowledge the China Postdoctoral Science Foundation, 2019M653896XB.

Conflicts of Interest

The authors declare no conflict of interest.

References

  1. Birol, Y. Grain refining efficiency of Al-Ti-C alloys. J. Alloys Compd. 2006, 422, 128–131. [Google Scholar] [CrossRef]
  2. Kumar, G.; Murty, B.S.; Chakraborty, M. Development of A-Ti-C grain refiners and study of their grain refining efficiency on Al and Al-7Si alloy. J. Alloys Compd. 2005, 396, 143–150. [Google Scholar] [CrossRef]
  3. Xxa, B.; Yfa, B.; Hui, F.C.; Qwa, B.; Gda, B.; Gla, B. The grain refinement of 1070 alloy by different Al-Ti-B mater alloys and its influence on the electrical conductivity. Results Phys. 2019, 14, 102482. [Google Scholar]
  4. Wang, Y.; Fang, C.M.; Zhou, L. Mechanism for Zr poisoning of Al-Ti-B based grain refiners. Acta Mater. 2018, 164, 428–439. [Google Scholar] [CrossRef] [Green Version]
  5. Li, Y.; Hu, B.; Liu, B. Insight into Si poisoning on grain refinement of Al-Si/Al-5Ti-B system. Acta Mater. 2020, 187, 51–65. [Google Scholar] [CrossRef]
  6. Peng, T.; Li, W.F.; Wang, K. Effect of Al-Ti-C master alloy addition on microstructures and mechanical properties of cast eutectic Al-Si-Fe-Cu alloy. Mater. Des. 2017, 115, 147–157. [Google Scholar]
  7. Li, P.T.; Liu, S.D.; Zhang, L.L. Grain refinement of A356 alloy by Al-Ti-B-C master alloy and its effect on mechanical properties. Mater. Des. 2013, 47, 522–528. [Google Scholar] [CrossRef]
  8. Wang, H.J.; Xu, J.; Kang, Y.L. Effect of Al-5Ti-1B-1Re on the microstructure and hot crack of as-cast Al-Zn-Mg-Cu alloy. J. Mater. Eng. Perform. 2014, 23, 1165–1172. [Google Scholar] [CrossRef]
  9. Zhou, X.F.; He, Y.D.; Zhang, Y.Q. The Microstructure and Solidification Mechanism of Al-Ti-C-Ce Prepared by Petroleum Coke. Mater. Sci. Forum 2019, 960, 14–20. [Google Scholar] [CrossRef]
  10. Ding, H.M.; Liu, X.F.; Yu, L. Influence of zirconium on grain refining efficiency of Al-Ti-C master alloys. J. Mater. Sci. 2007, 42, 9817–9821. [Google Scholar] [CrossRef]
  11. Doheim, M.A.; Omran, A.M.; Abdel, G.A. Evaluation of Al-Ti-C master alloys as grain refiner for aluminum and its alloys. Metall. Mater. Trans. A 2011, 42, 2862–2867. [Google Scholar] [CrossRef]
  12. Jiang, H.; Sun, Q.; Zhang, L. Al-Ti-C master alloy with nano-sized TiC particles dispersed in the matrix prepared by using carbon nanotubes as C source. J. Alloys Compd. 2018, 748, 774–782. [Google Scholar] [CrossRef]
  13. Ao, M.; Liu, H.; Dong, C. The effect of La2O3 addition on intermetallic-free aluminium matrix composites reinforced with TiC and Al2O3 ceramic particles. Ceram. Int. 2019, 45, 12001–12009. [Google Scholar] [CrossRef]
  14. Wang, L.D.; Wei, Z.L.; Yang, X.B. Thermodynamics analysis of Al-Ti-C-RE prepared by rare earth oxide Ce2O3. Chin. J. Nonferrous Met. 2013, 23, 2928–2935. [Google Scholar]
  15. Korotcenkov, G.; Al-Douri, Y. (Eds.) Metal Oxides: Powder Technologies; Elsevier: Cambridge, MA, USA, 2020. [Google Scholar]
  16. Auffan, M.; Rose, J.; Bottero, J.Y. Towards a definition of inorganic nanoparticles from an environmental, health and safety perspective. Nat. Nanotechnol. 2009, 4, 634. [Google Scholar] [CrossRef] [PubMed]
  17. Liu, H.; Xing, X.; Rao, L. Interface relation between CeO2/TiC in hypereutectic Fe-Cr-C-Ti-CeO2 hardfacing alloy. Mater. Chem. Phys. 2019, 222, 181–192. [Google Scholar] [CrossRef]
  18. Ding, W.W.; Chen, T.L.; Zhao, X.Y. Effect of CeO2 on Microstructure and Synthesis Mechanism of Al-Ti-C Alloy. Materials 2018, 11, 2508. [Google Scholar] [CrossRef] [Green Version]
  19. Liu, X.F.; Bian, X.F. Master Alloys for the Structure Refinement of Aluminium Alloys, 1st ed.; Central South University: Changsha, China, 2012; pp. 7–10, 57–64. ISBN 978-7-5487-0450-8. [Google Scholar]
  20. Liu, X.F.; Wang, Z.Q.; Zhang, Z.G. The relationship between microstructures and refining performances of Al-Ti-C master alloys. Mater. Sci. Eng. A 2002, 332, 70–74. [Google Scholar]
  21. Xu, C.; Xiao, W.L.; Zhao, W.T. Microstructure and formation mechanism of grain-refining particles in Al-Ti-C-RE grain refiners. J. Rare Earths 2015, 33, 553–560. [Google Scholar] [CrossRef]
  22. Wang, K.; Cui, C.X.; Wang, Q. The microstructure and formation mechanism of core-shell-like TiAl3/Ti2Al20Ce in melt-spun Al-Ti-B-Re grain refiner. Mater. Lett. 2012, 85, 153–156. [Google Scholar] [CrossRef]
  23. Jarfors, A.; Fredriksson, H.; Froyen, L. On the thermodynamics and kinetics of carbides in the aluminum-rich corner of the Al-Ti-C system. Mater. Sci. Eng. A 1991, 135, 119–123. [Google Scholar] [CrossRef]
  24. Ding, W.W.; Chen, T.L.; Zhao, X.Y. Investigation of Microstructure of Al-5Ti-0.62C System and Synthesis Mechanism of TiC. Materials 2020, 13, 310. [Google Scholar] [CrossRef] [PubMed] [Green Version]
  25. Nie, B.X.; Liu, H.M.; Qu, Y.; H, Q.L. Effect of La2O3 on the in-situ reaction products in Al-CuO-Ti-C system. Mater. Res. Express 2019, 6, 046555. [Google Scholar] [CrossRef]
  26. Dong, K. (Al-) Study on Reaction Mechanism and Mechanical Properties of Copper Matrix Composites Synthesized by In-Situ Reaction of Ti-C-Cu System. Master’s Thesis, Nanjing University of Technology, Nanjing, China, 2016. [Google Scholar]
  27. Wang, P. Thermodynamic Analysis and Kinetic Mechanism of Ti-Al-C System. Ph.D. Thesis, Wuhan University of Technology, Wuhan, China, 2008. [Google Scholar]
Figure 1. Different sizes of CeO2: (a) 30nm; (b) 50nm; (c) 1 μm; (d) 2–4 μm.
Materials 14 06739 g001
Figure 2. The microstructure of the mixed powders (Al, Ti, C and CeO2) with different CeO2 size after ball milling: (a) 30 nm; (b) 50 nm; (c) 1 μm; (d) 2–4 μm.
Materials 14 06739 g002
Figure 3. SEM image and map scanning patterns of Area 1 in Figure 2d: (a) SEM image; (bf) map scanning patterns of Al, Ti, C, Ce and O elements, respectively.
Materials 14 06739 g003
Figure 4. The microstructure of quenching samples with different CeO2 size at 60 s: (a) 30 nm; (b) 50 nm; (c) SEM image of Area 1; (d) 1 μm; (e) low magnification image and (f) high magnification image of samples with CeO2 of the size of 2–4 μm.
Materials 14 06739 g004
Figure 5. XRD patterns of prefabricated blocks with different CeO2 size under complete reaction.
Materials 14 06739 g005
Figure 6. SEM images of the quenching samples of prefabricated block with different CeO2 size under complete reaction: (a) 30 nm; (b) 50 nm; (c) 1 μm and (d) 2–4 μm.
Materials 14 06739 g006
Figure 7. The statistics chart of the second phase particles in prefabricated block with different CeO2 size under complete reaction.
Materials 14 06739 g007
Figure 8. XRD spectra of prefabricated blocks with CeO2 particle size of 2–4 μm at different reaction times: (a) 8, (b) 50, (c) 60, (d) 80, (e) 90 s.
Materials 14 06739 g008
Figure 9. SEM images of #5 quenching samples prepared at different times: (a) 8; (b) 50; (c) 60; (d) 80 and (e) 90 s.
Materials 14 06739 g009
Figure 10. The map scan patterns of Figure 9d: (a) backscattered electron image of Figure 9d; (be) map scanning patterns of Al, Ti, C and Ce elements, respectively.
Materials 14 06739 g010
Figure 11. DSC curves of Al-Ti-C-Ce with different CeO2 size of: 30 nm and 2–4 μm.
Materials 14 06739 g011
Figure 12. The macrographs of A 99.7 with 0.3% different master alloys: (a) unrefined; (b) #1; (c) #2; (d) #3; (e) #4; (f) #5.
Materials 14 06739 g012
Figure 13. Average grain size of the refining samples in Figure 12.
Materials 14 06739 g013
Table 1. The experimental parameters and numbers of master alloys.
Sample No.Composite of Master
Alloy
Size of CeO2Preparation
Temperature/°C
Holding Time/Min
#1Al-Ti-CNone80015
#2Al-Ti-C-Ce30 nm80015
#3Al-Ti-C-Ce50 nm80015
#4Al-Ti-C-Ce1 μm80015
#5Al-Ti-C-Ce2–4 μm80015
Table 2. The corresponding heat change of the reaction.
Type of Alloy△HAl/(J/g)△HAl3Ti/(J/g)△HTiC/(J/g)
Al-Ti-C214.7−163.4−838.8
Al-Ti-C-Ce (30 nm)173.5−168.8−92.99
Al-Ti-C-Ce (2–4 μm)195.5−137.7−198.6
Publisher’s Note: MDPI stays neutral with regard to jurisdictional claims in published maps and institutional affiliations.

