
On the Dynamic Electro-Mechanical Failure Behavior of Automotive High-Voltage Busbars Using a Split Hopkinson Pressure Bar

 ,
,  , and
, and 
Abstract
:1. Introduction
2. Materials and Methods
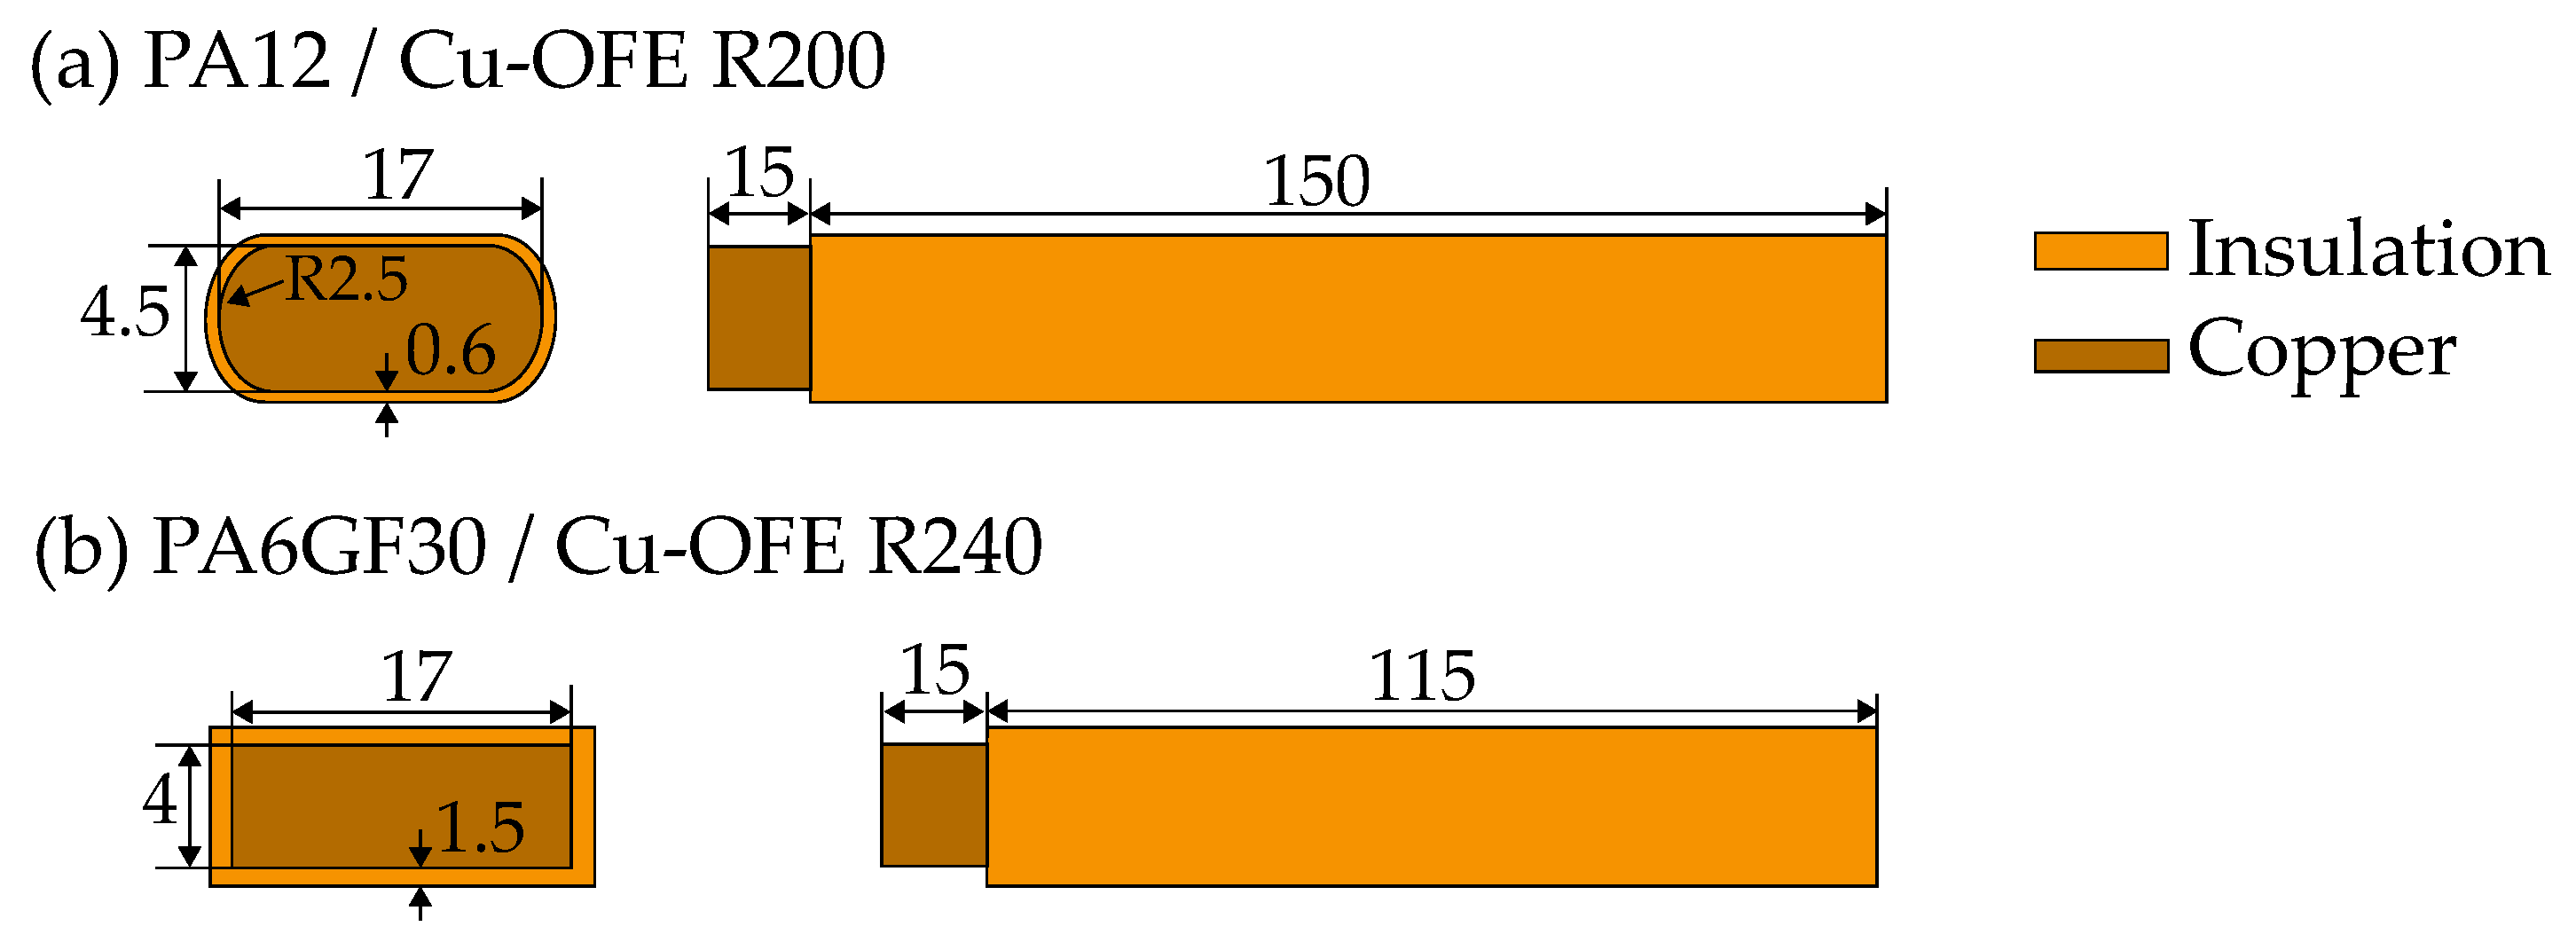
2.1. Materials
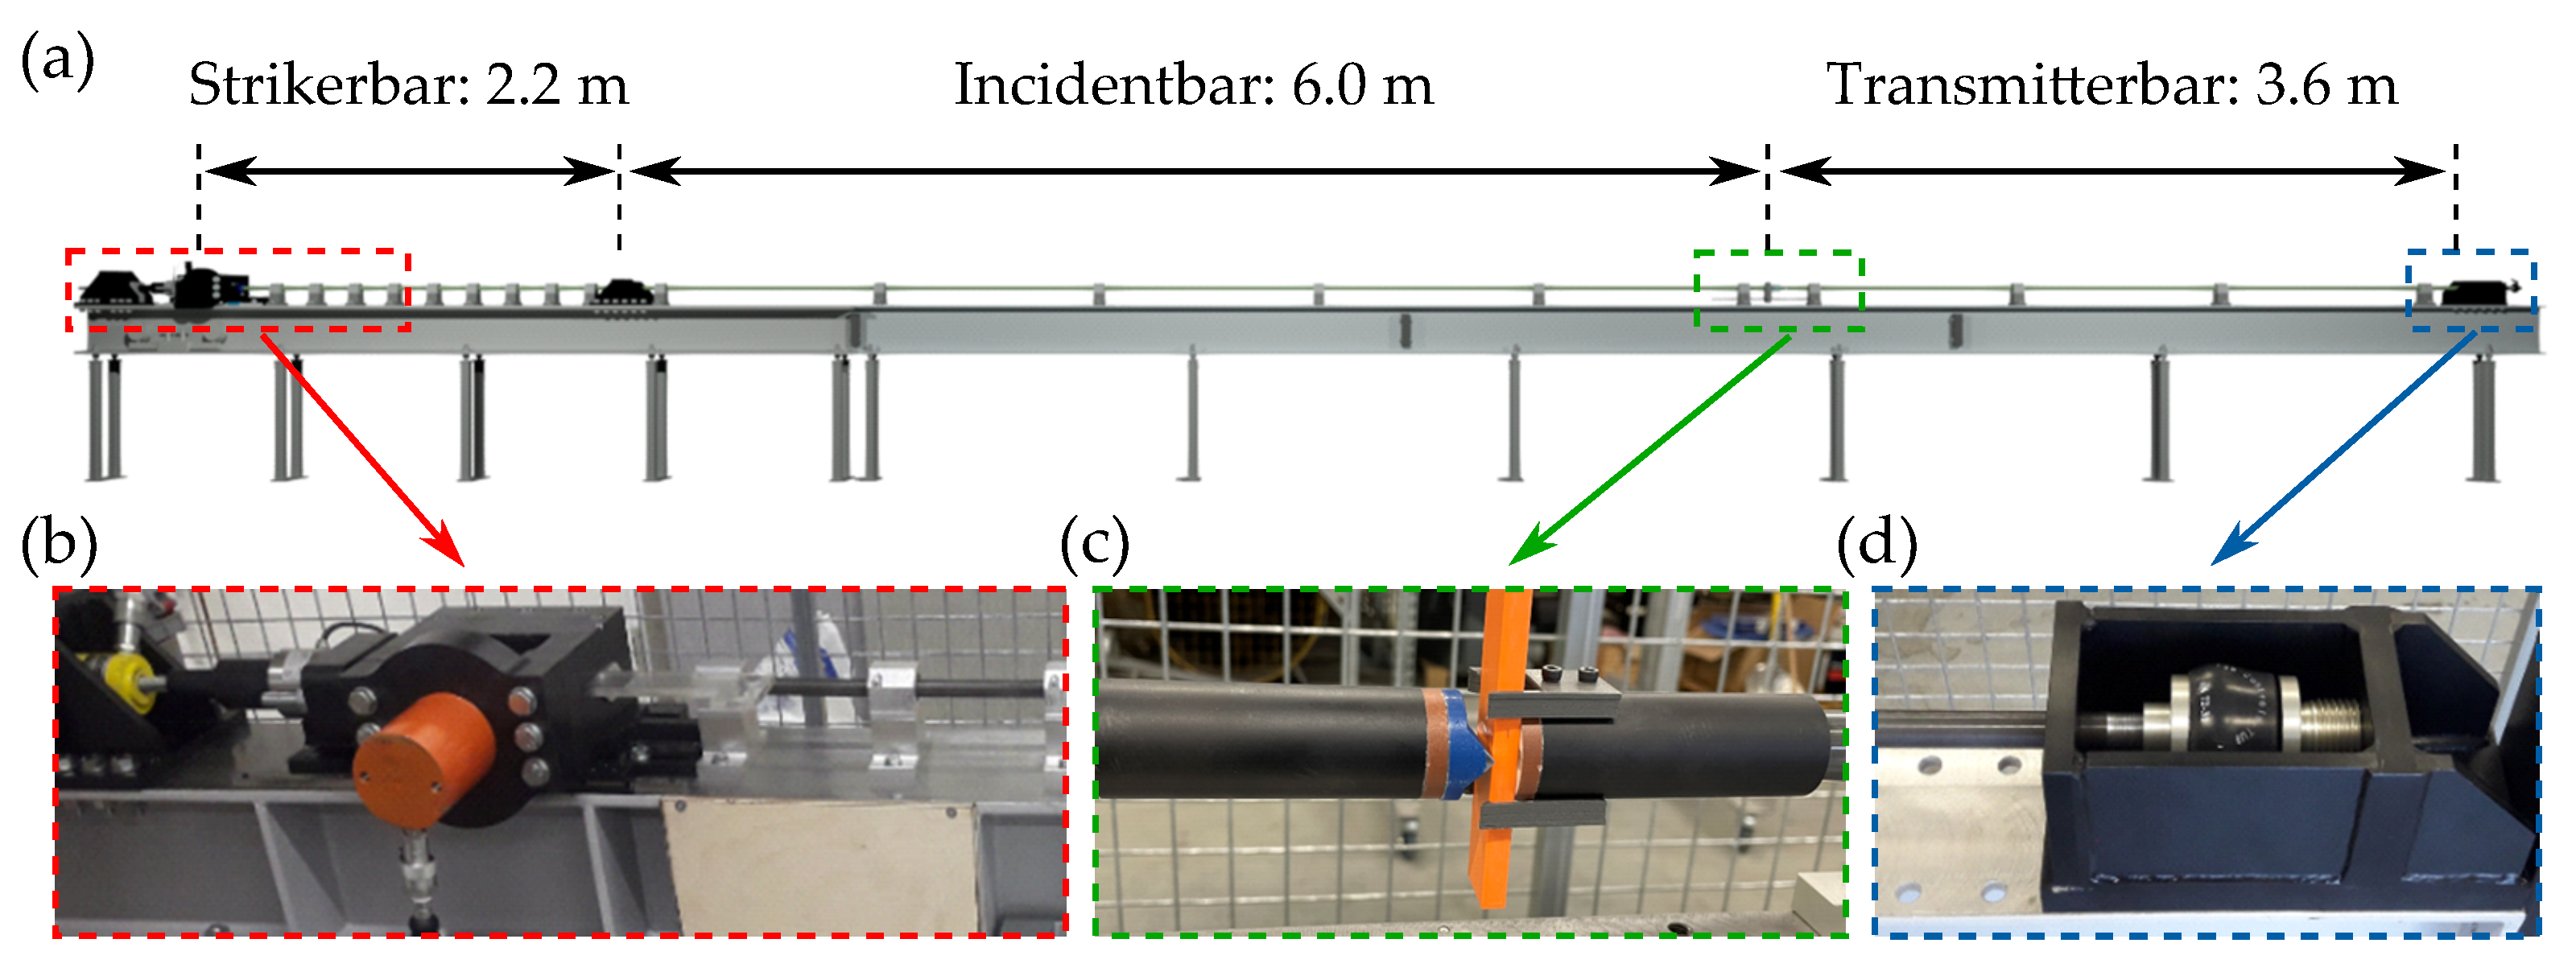
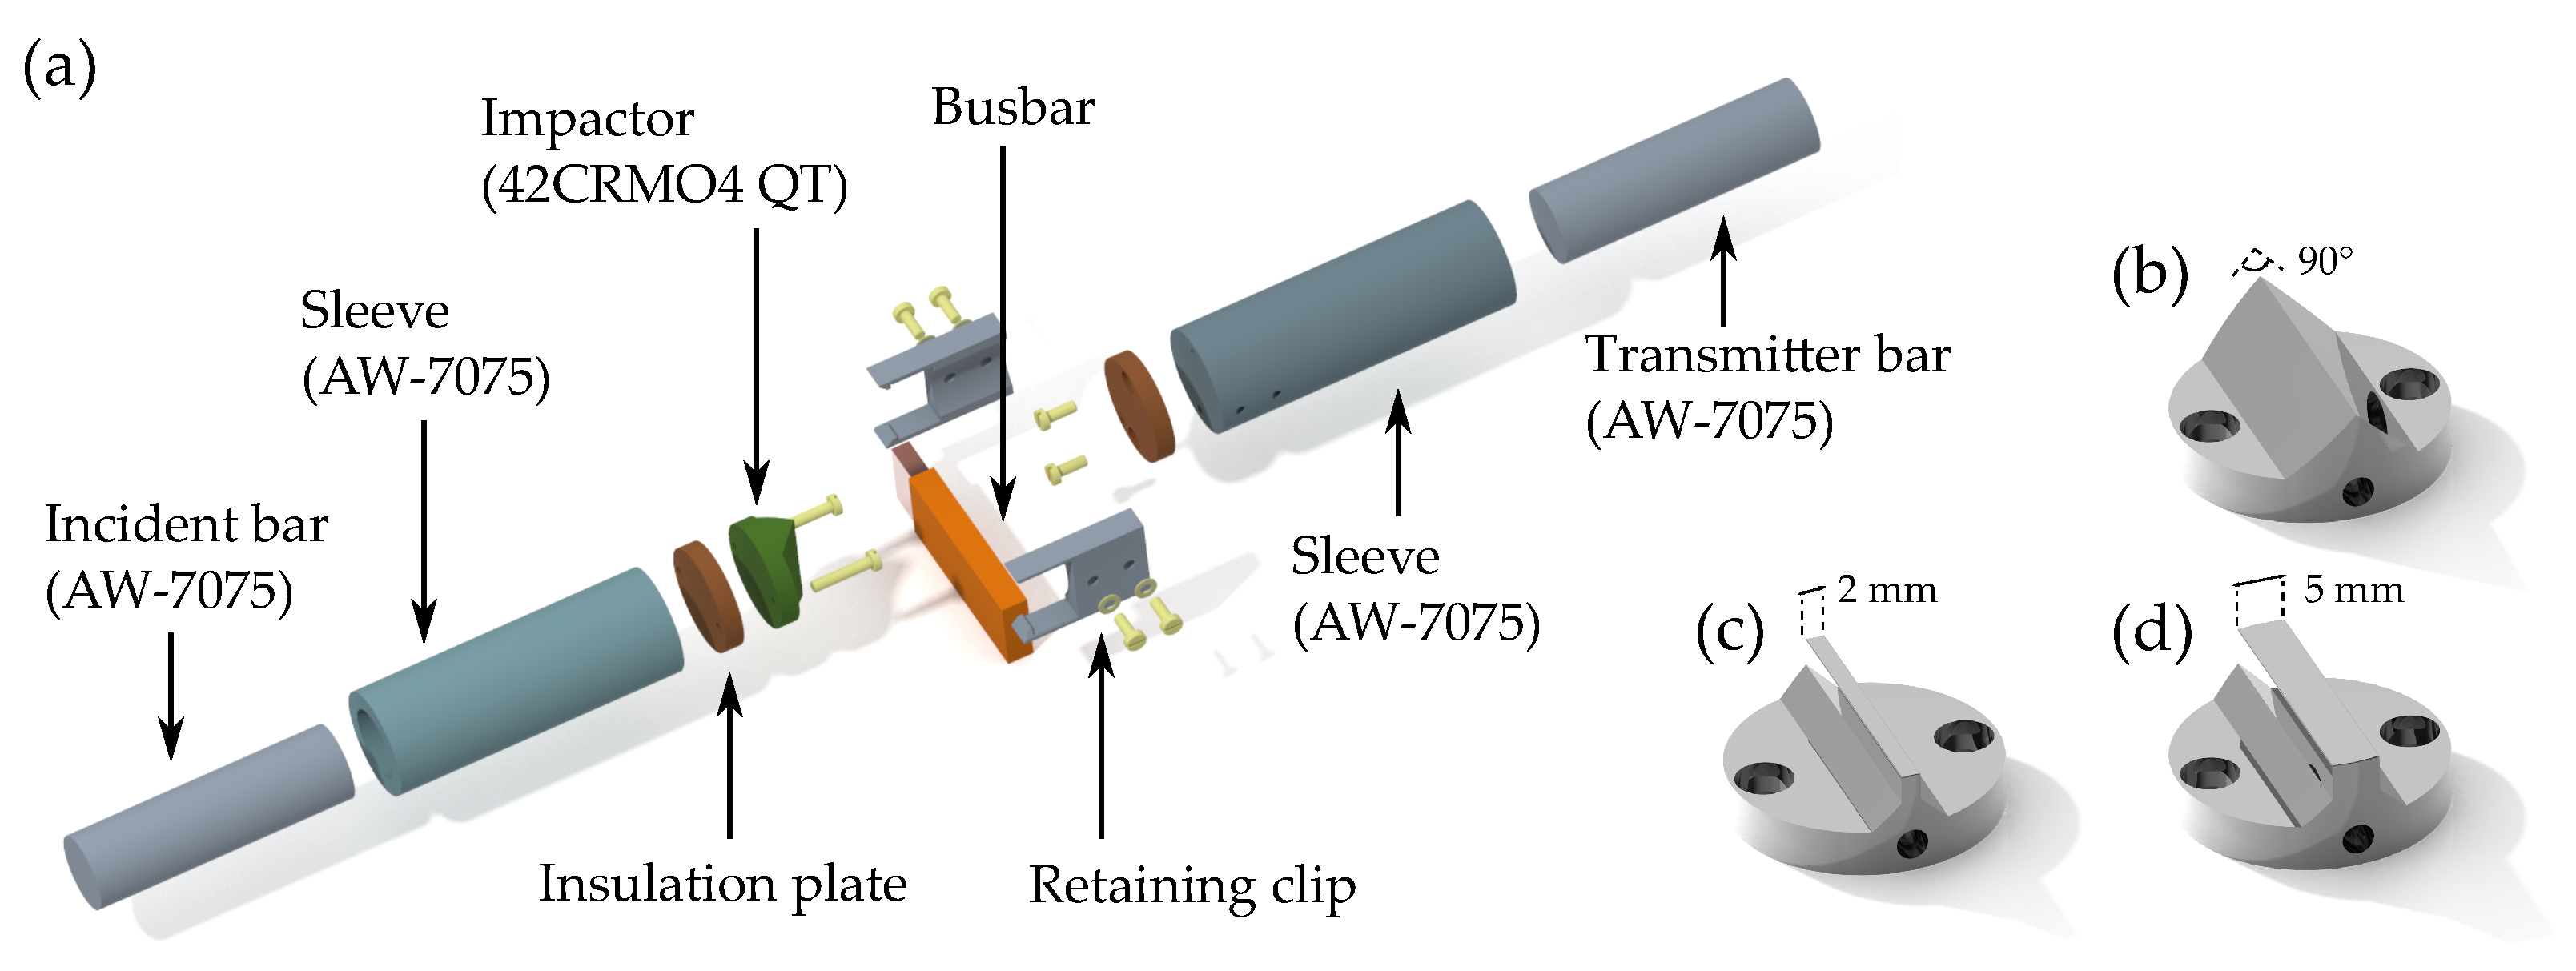
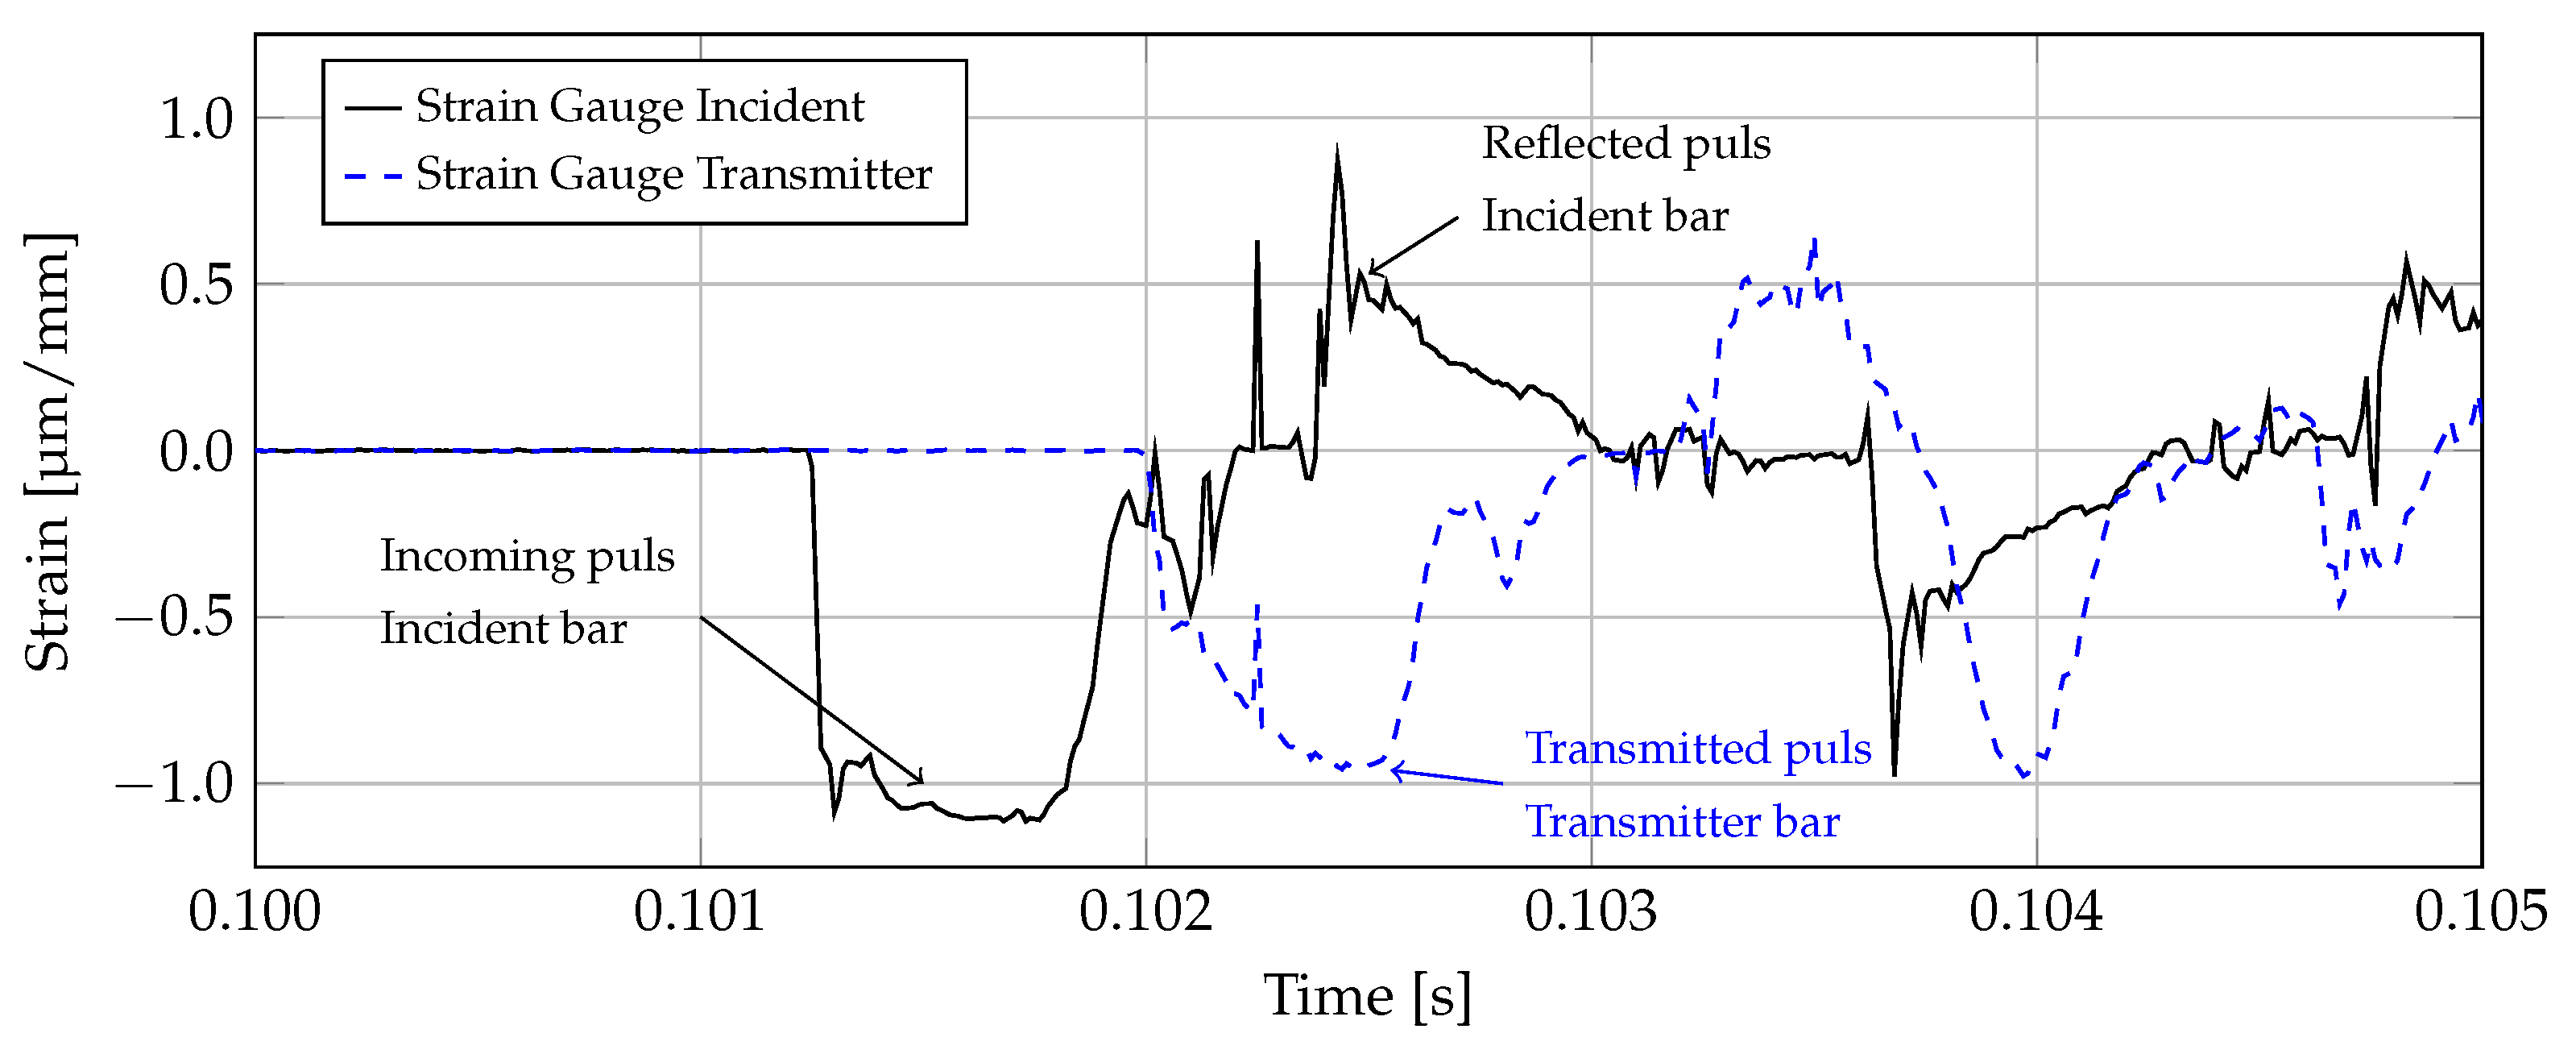
2.2. Experimental Methods
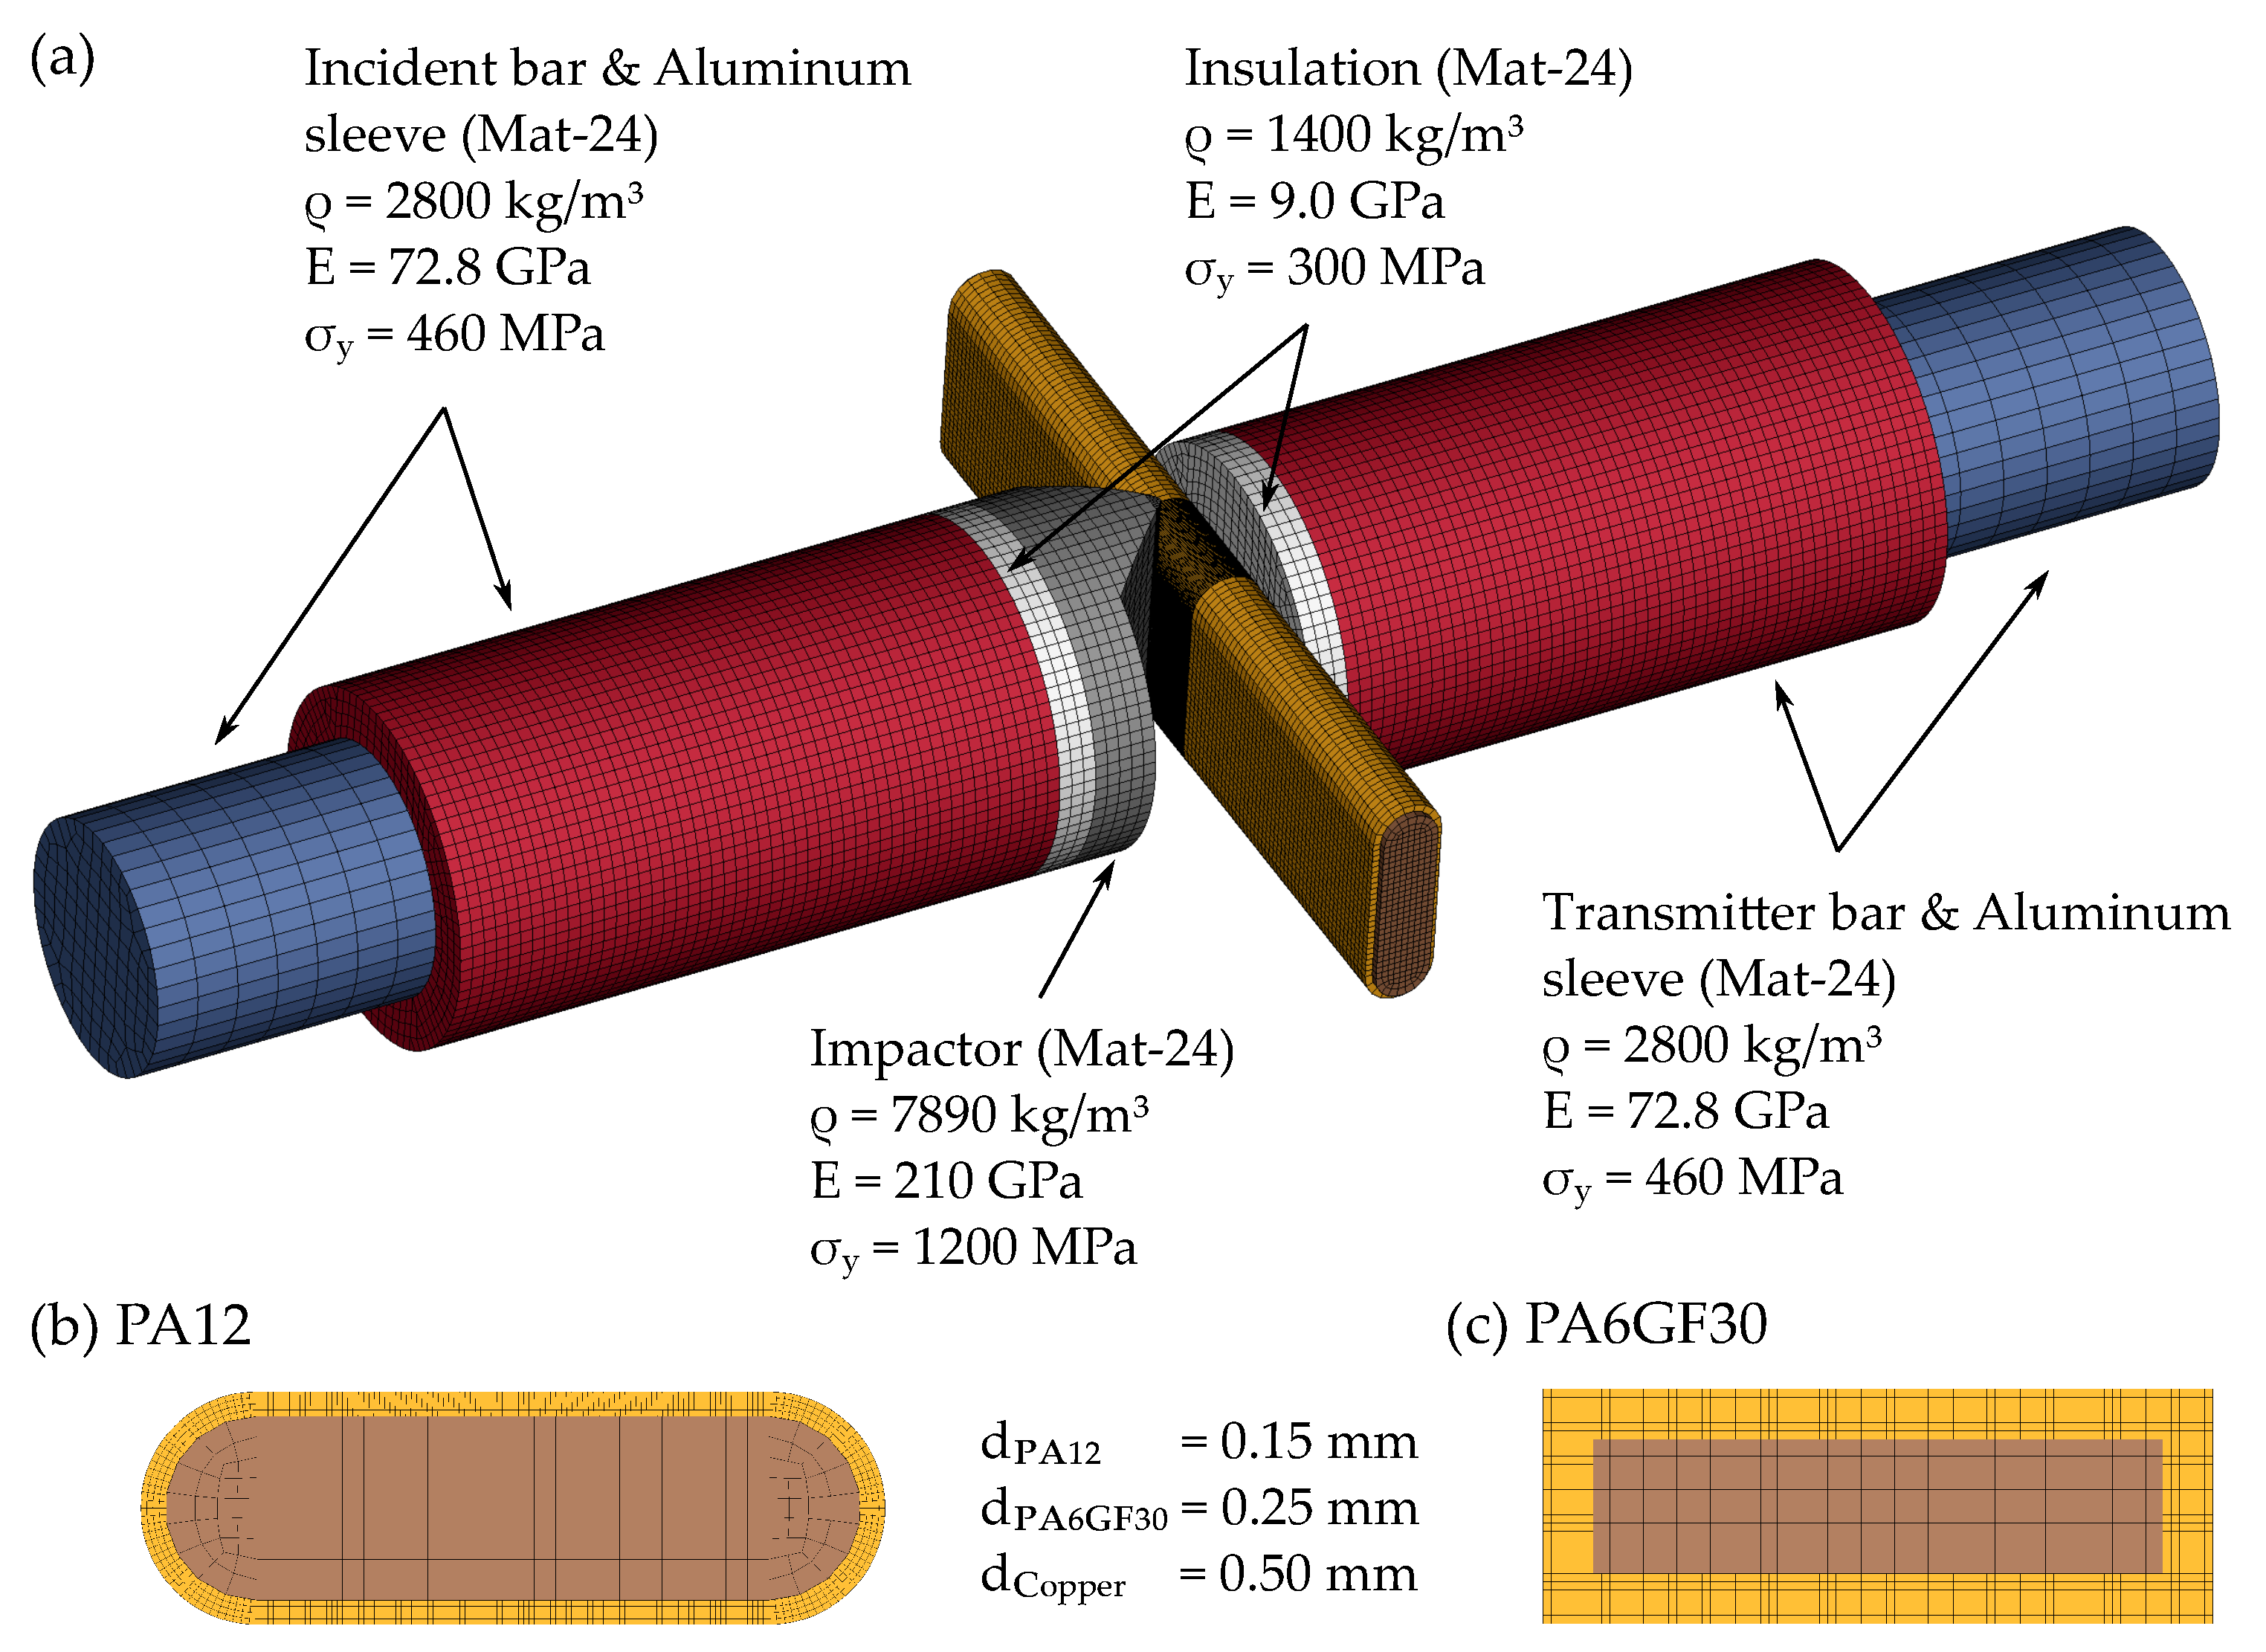
2.3. Numerical Methods
3. Results and Discussion
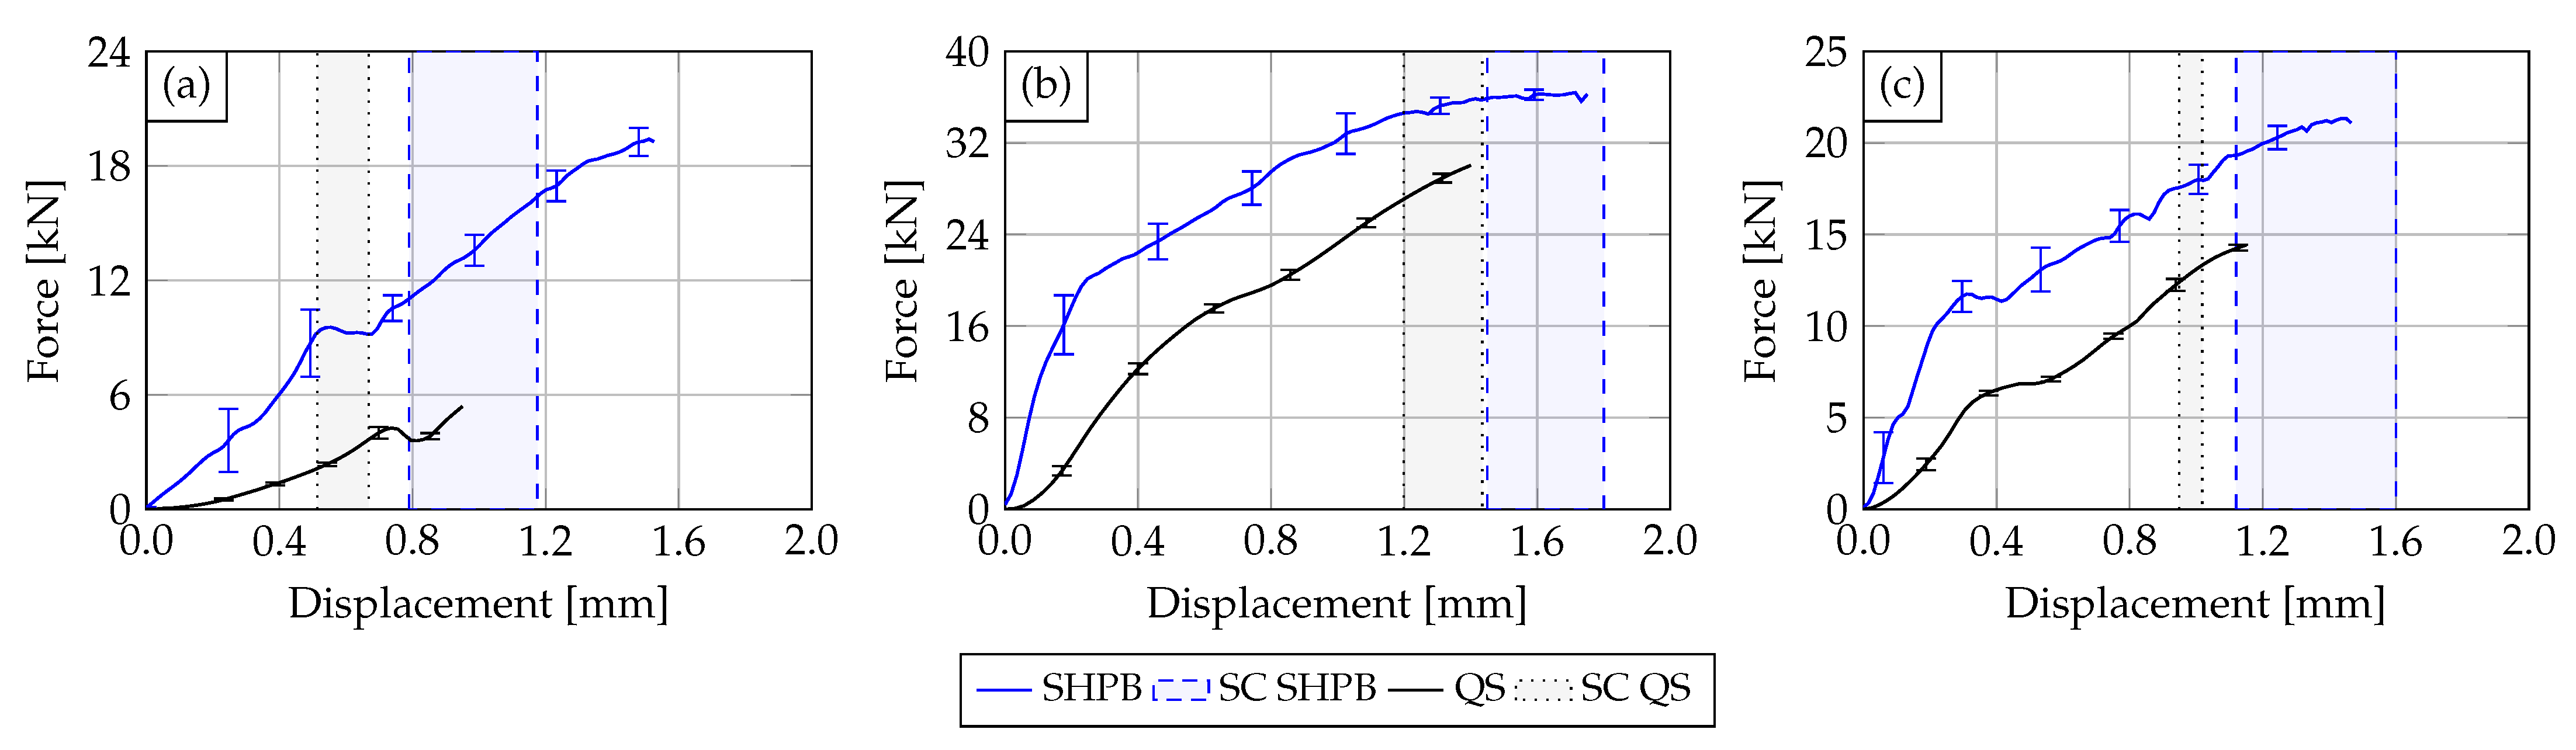
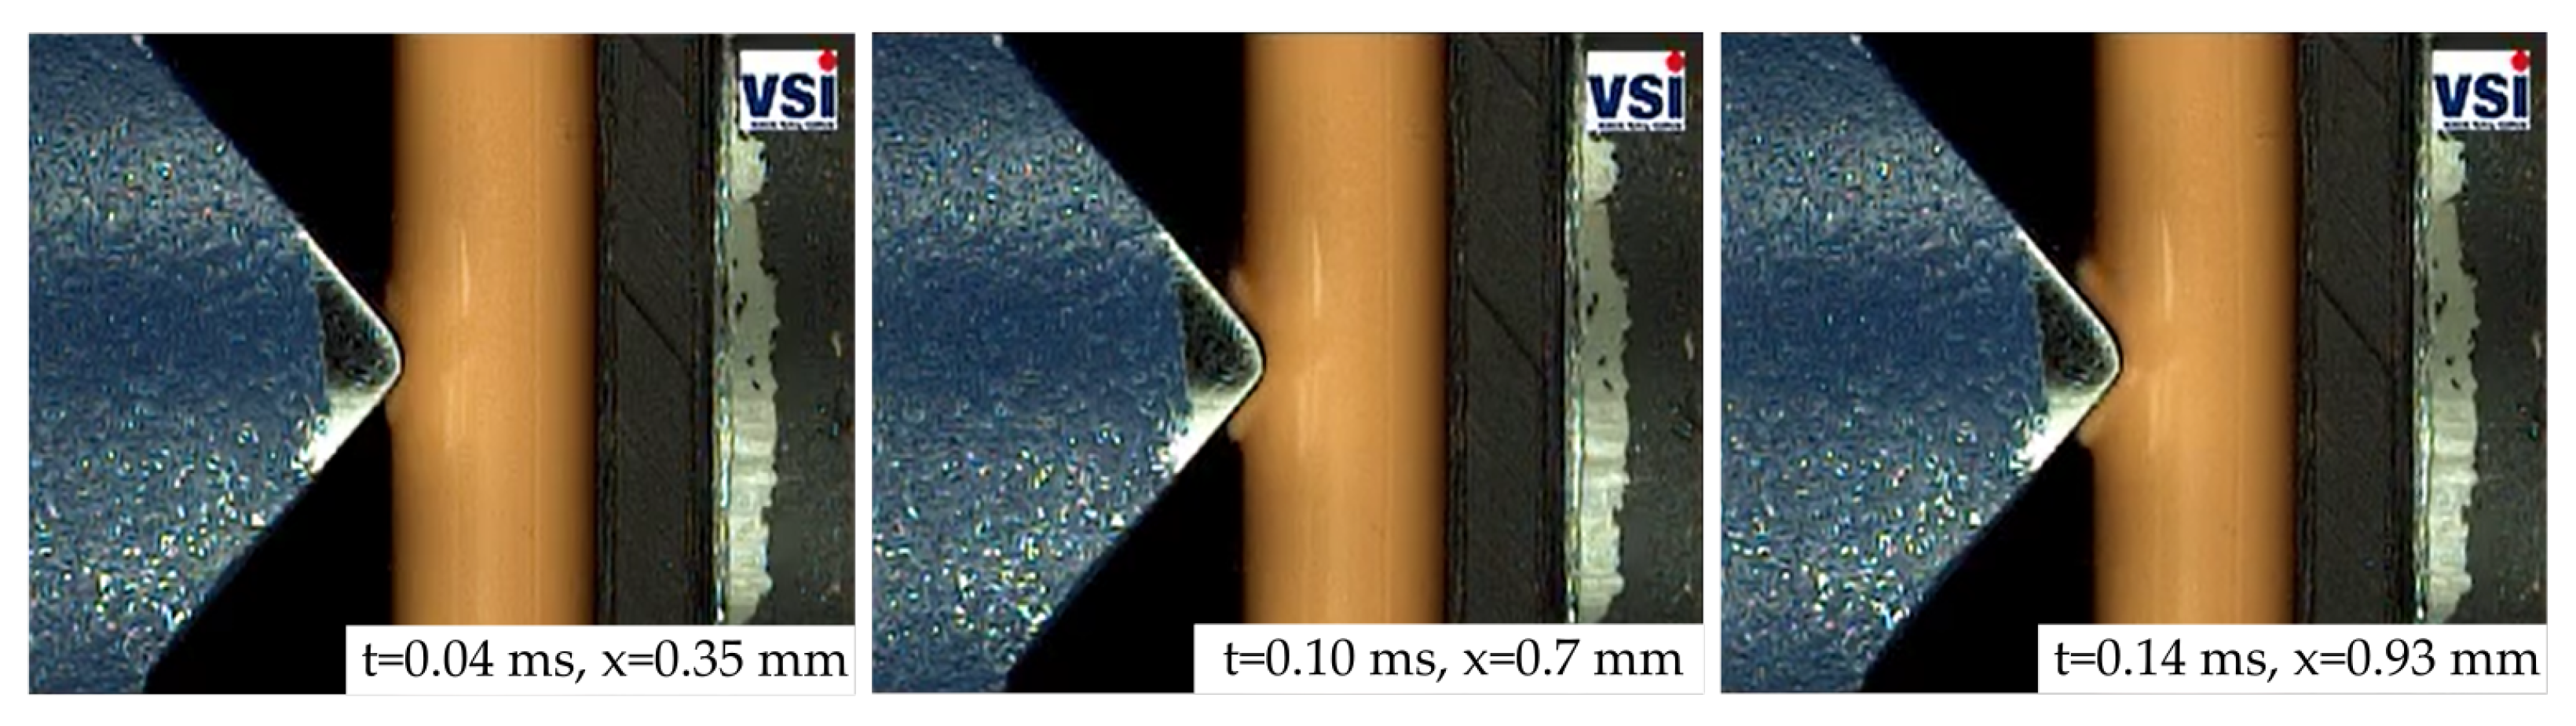
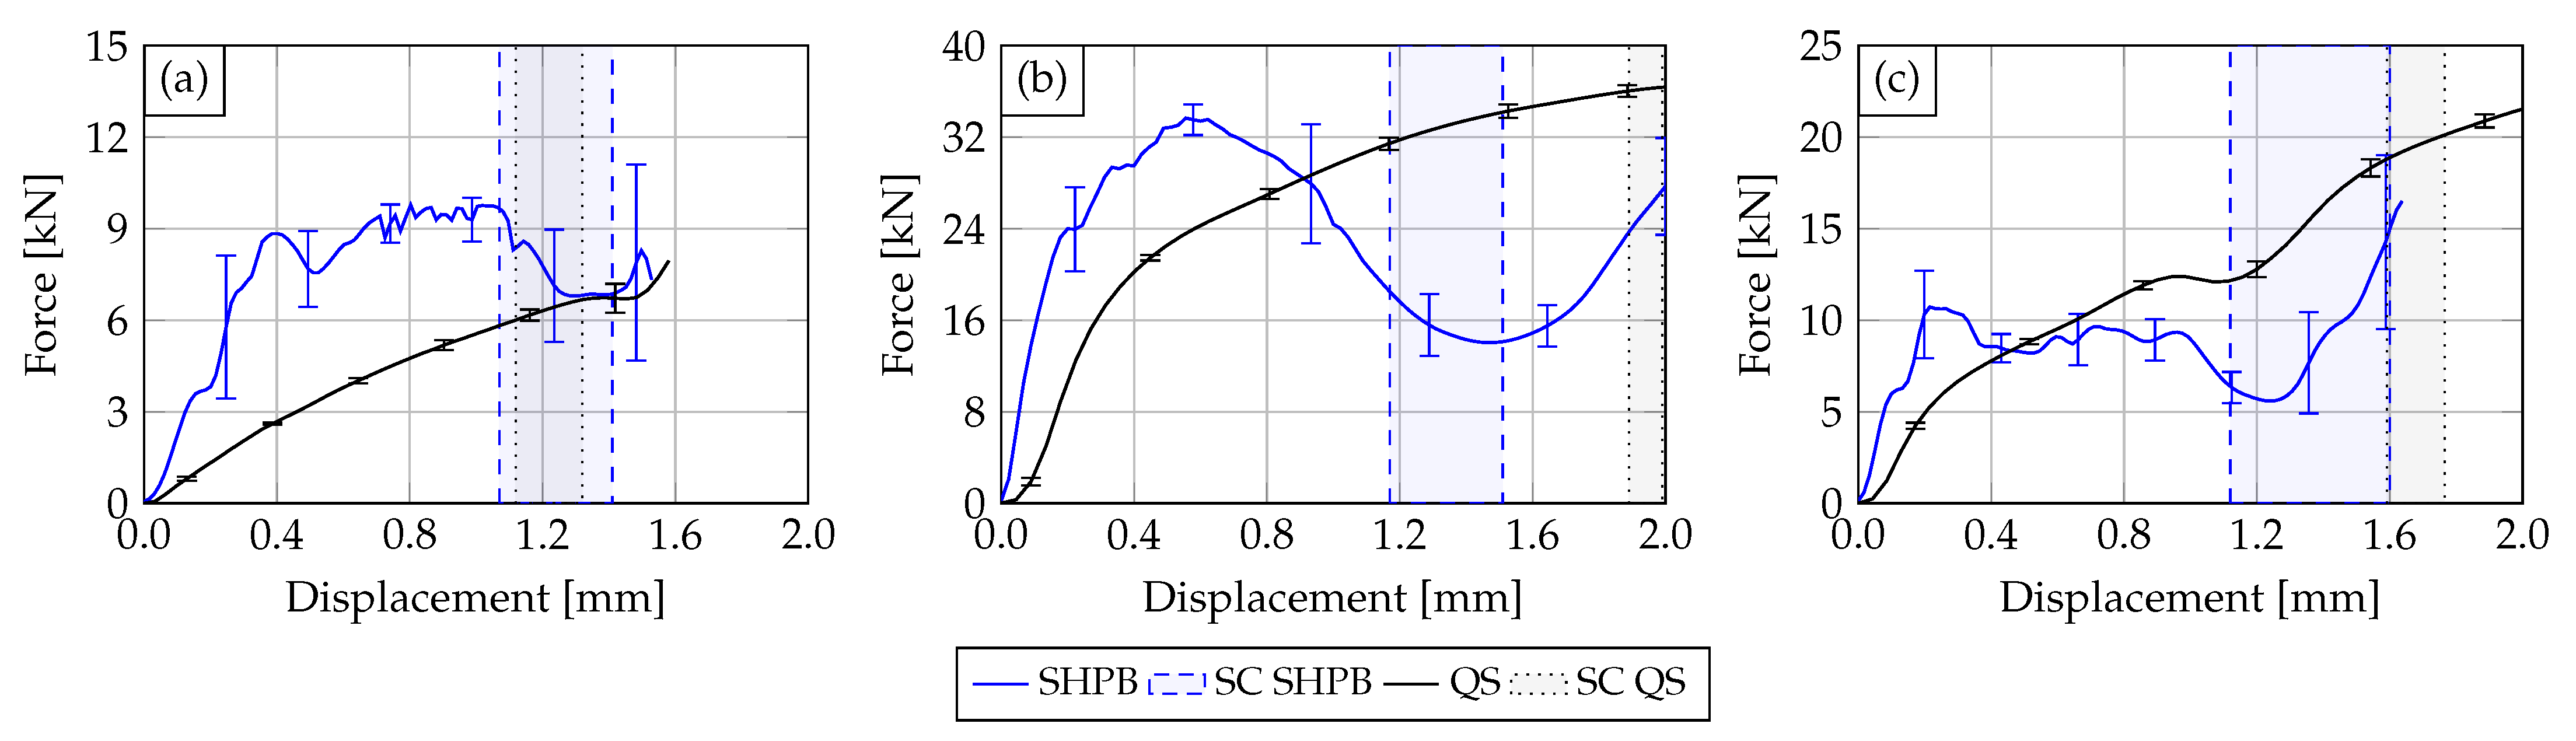
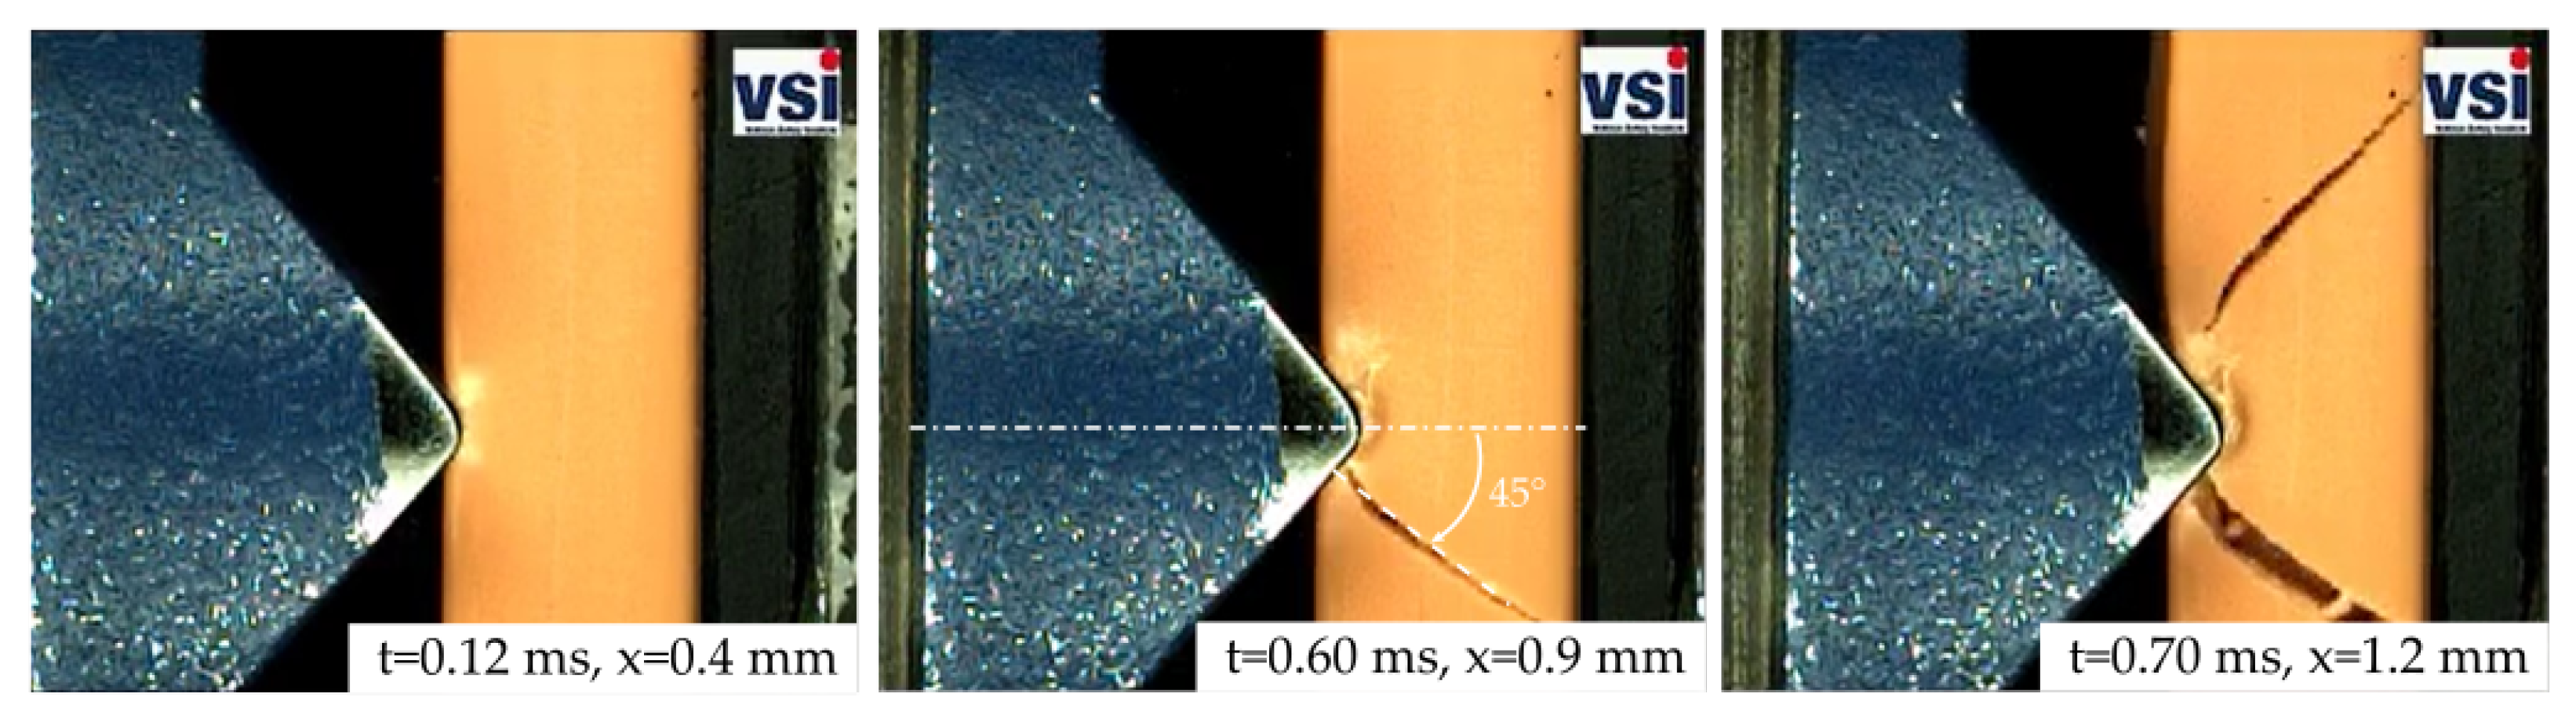
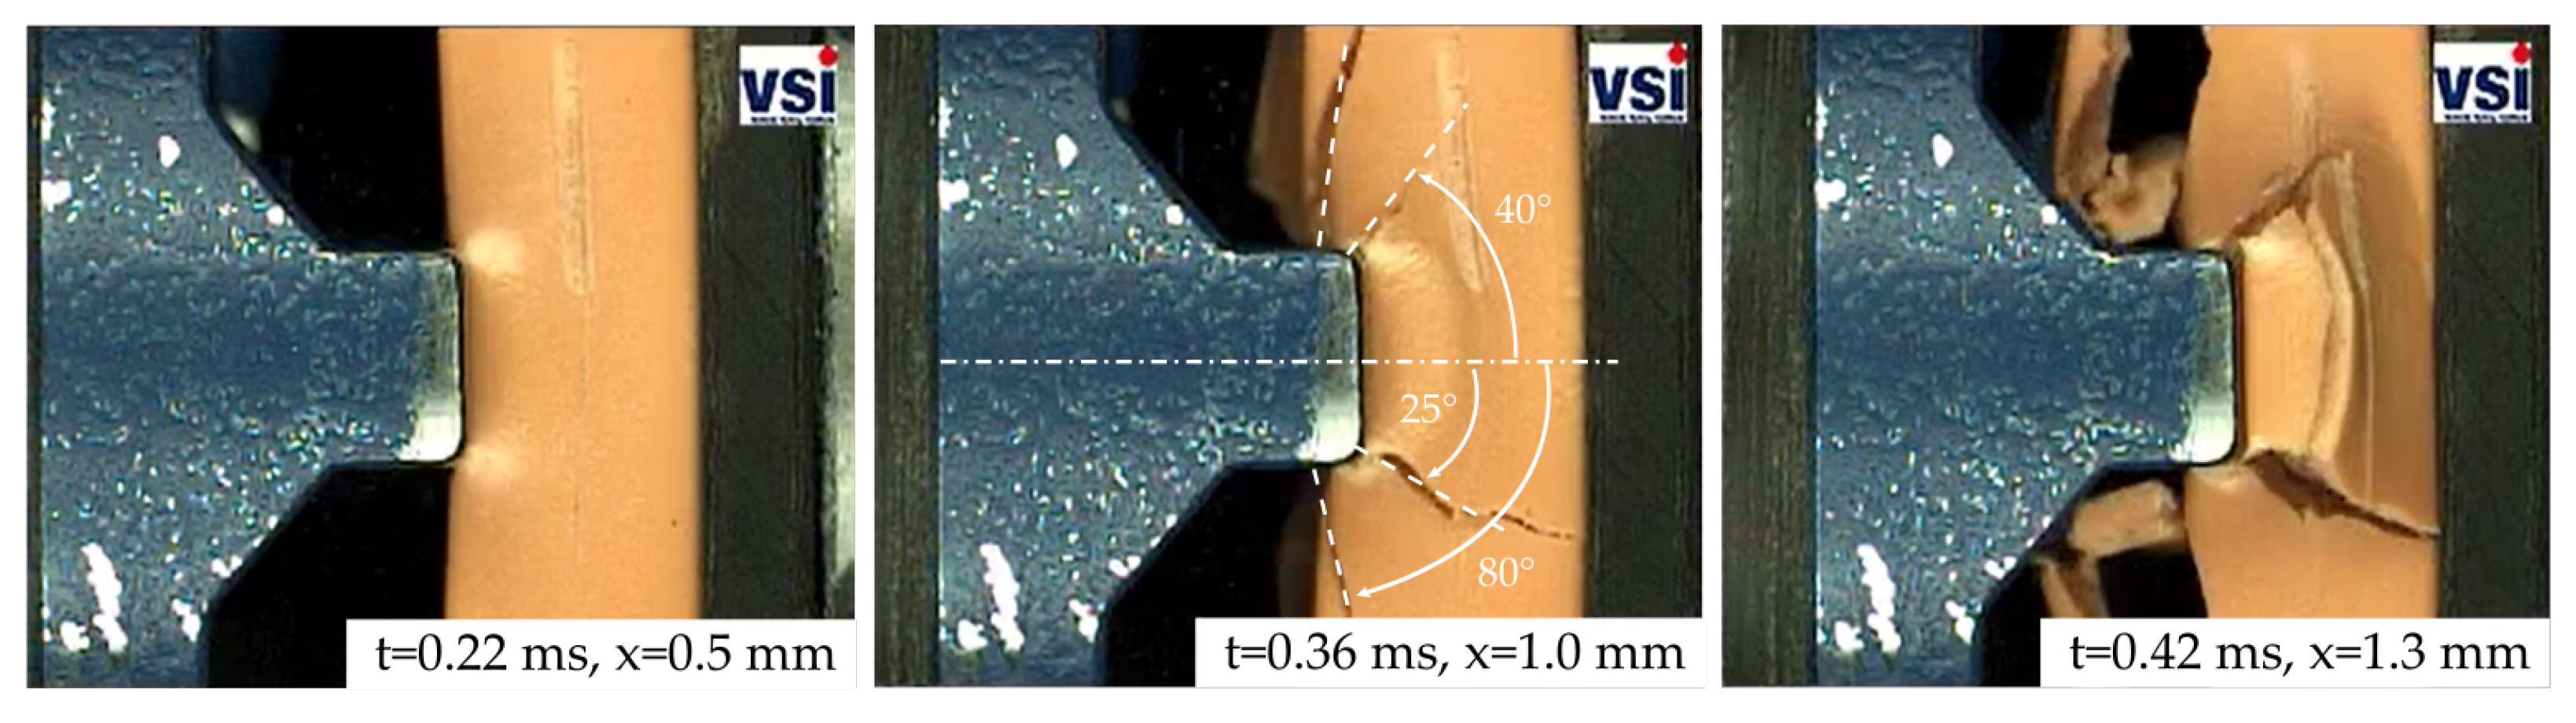
3.1. Experimental
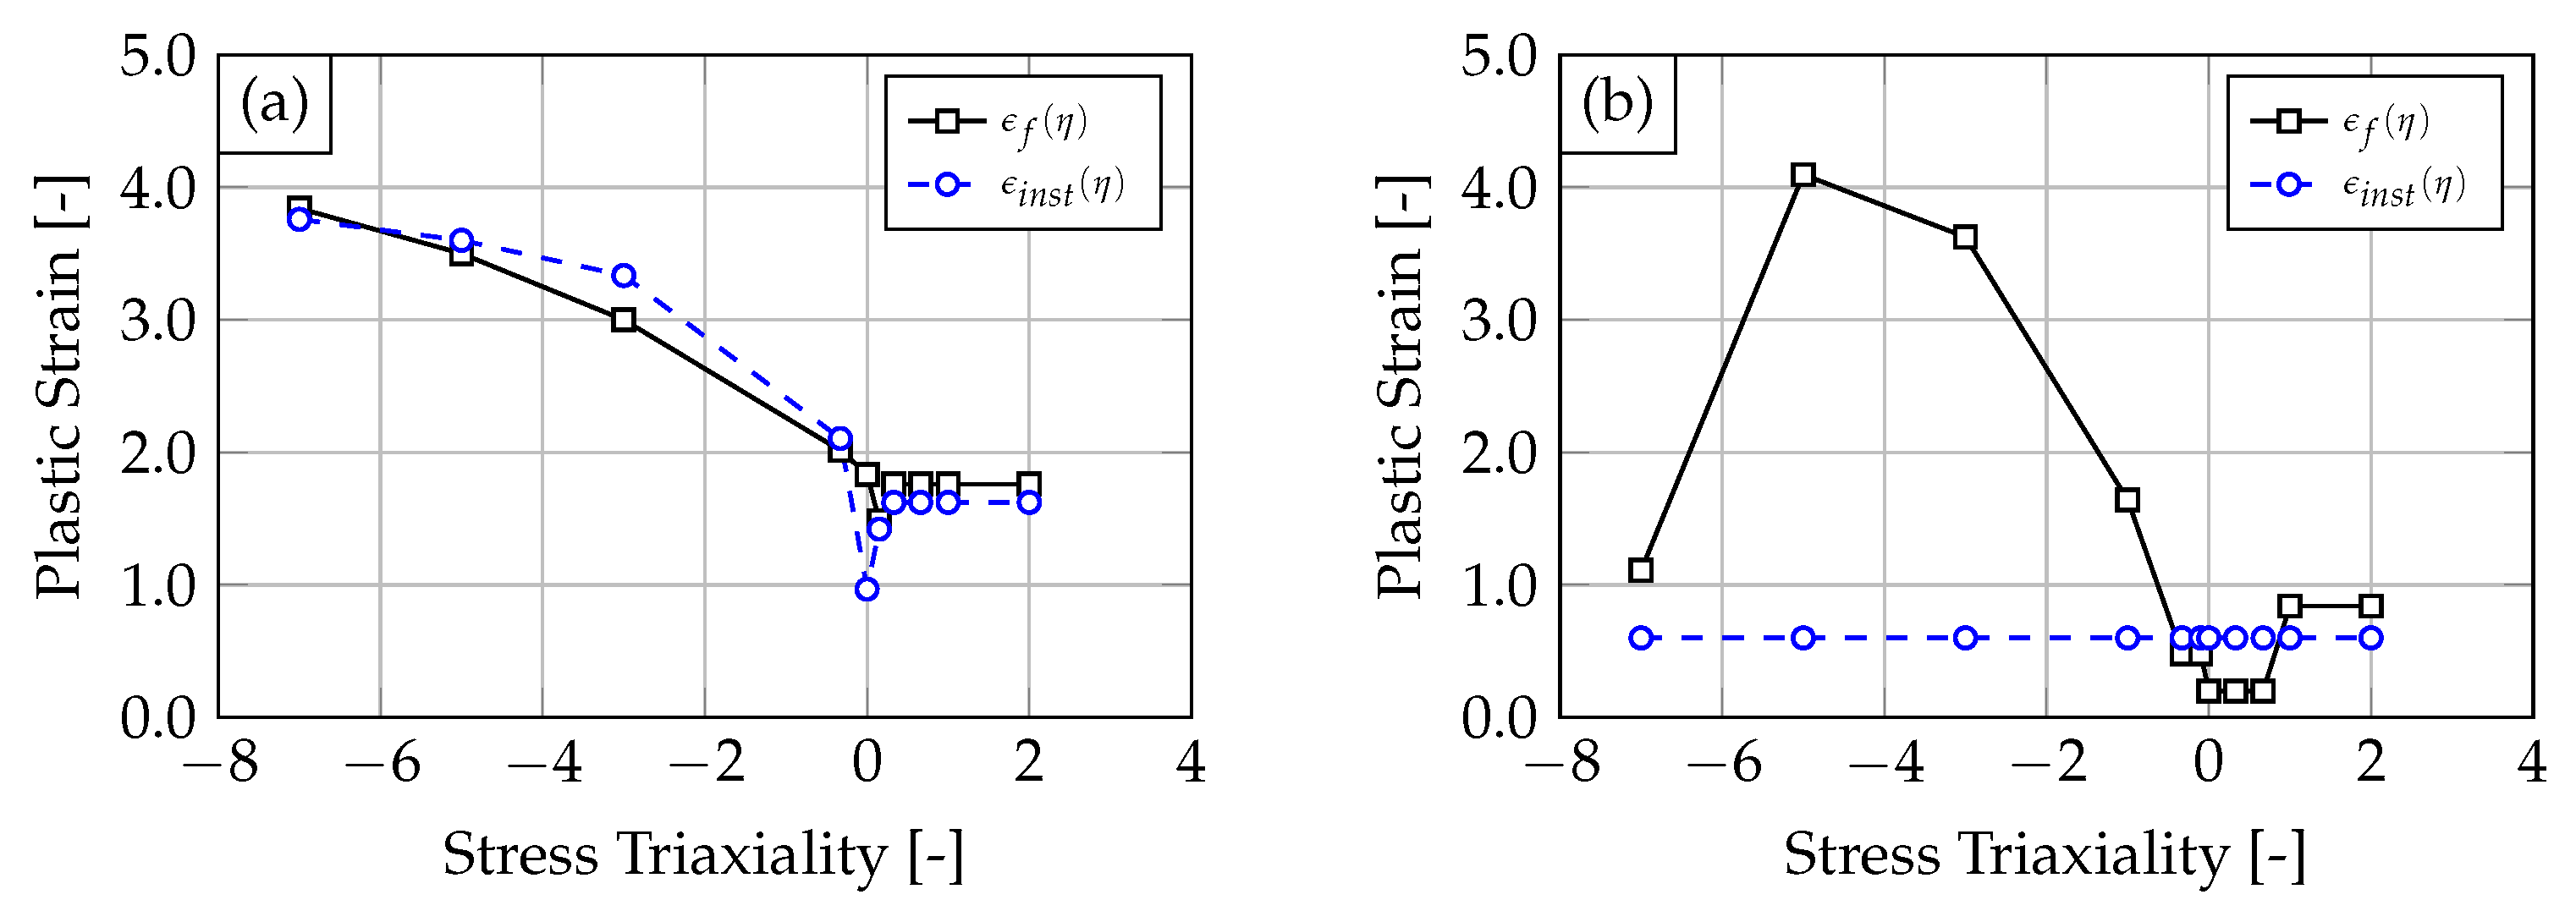
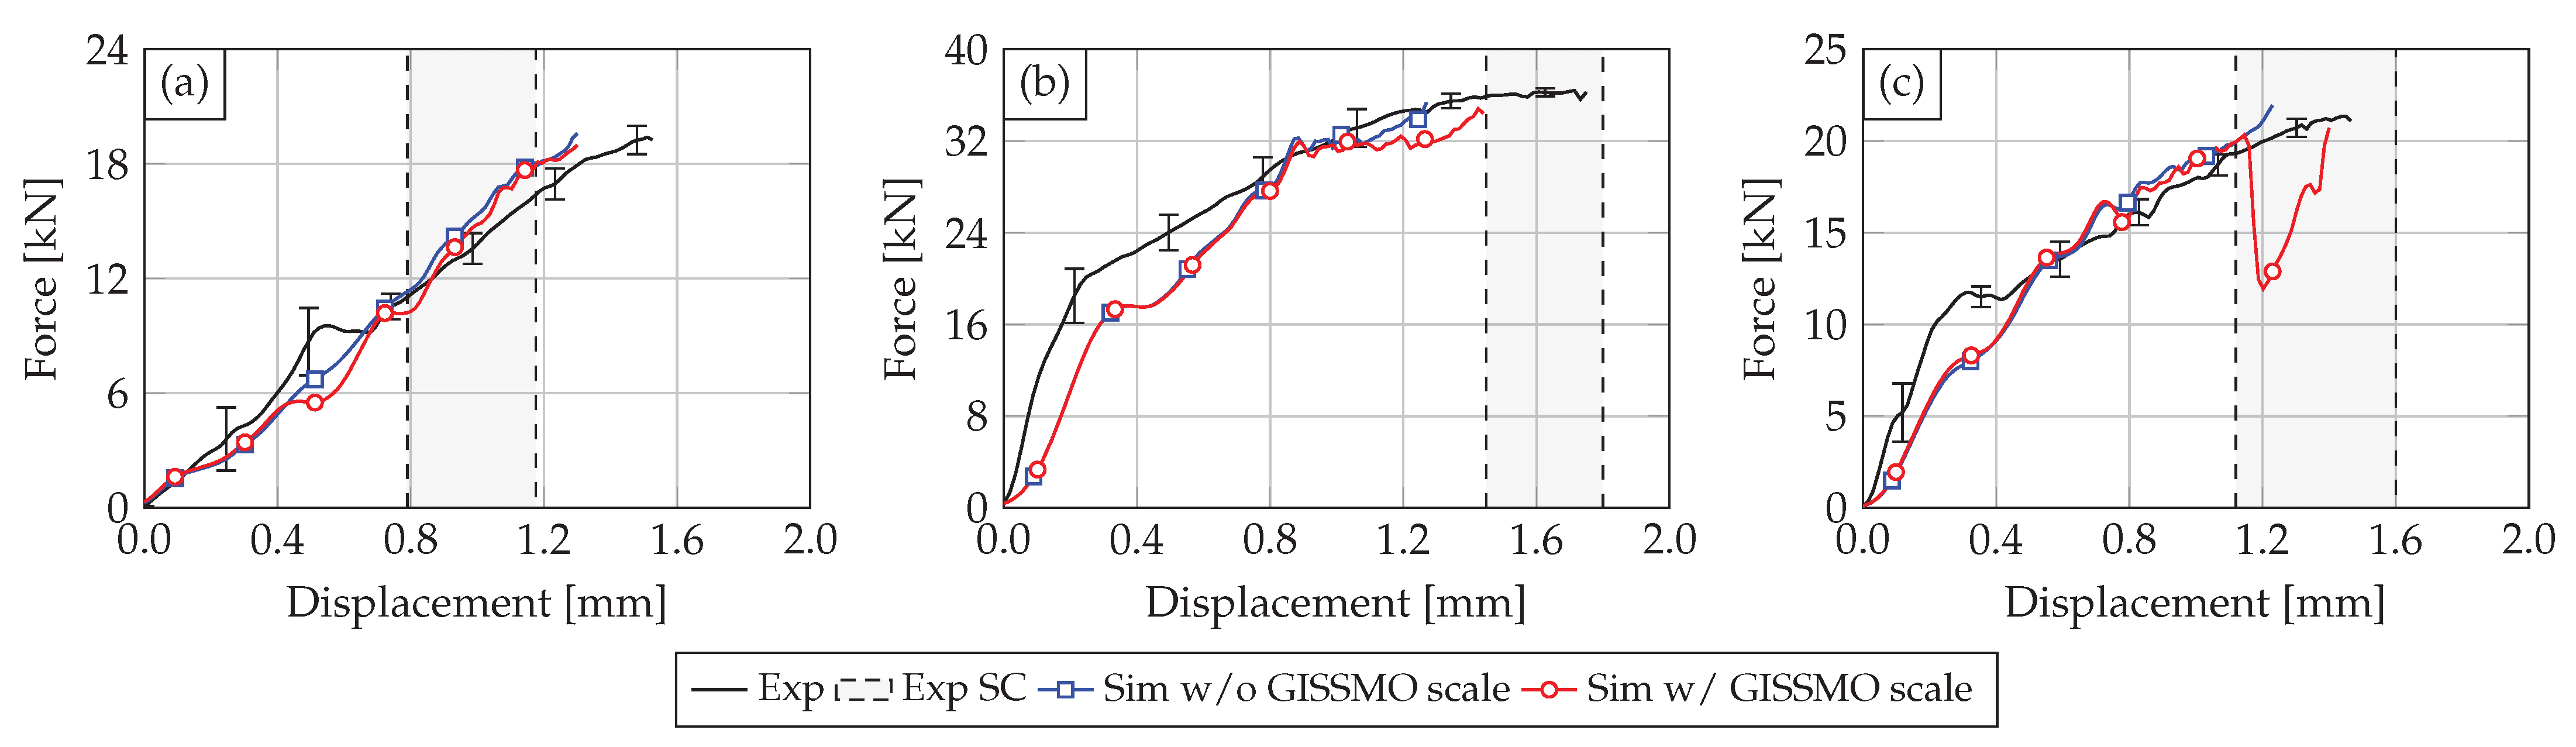
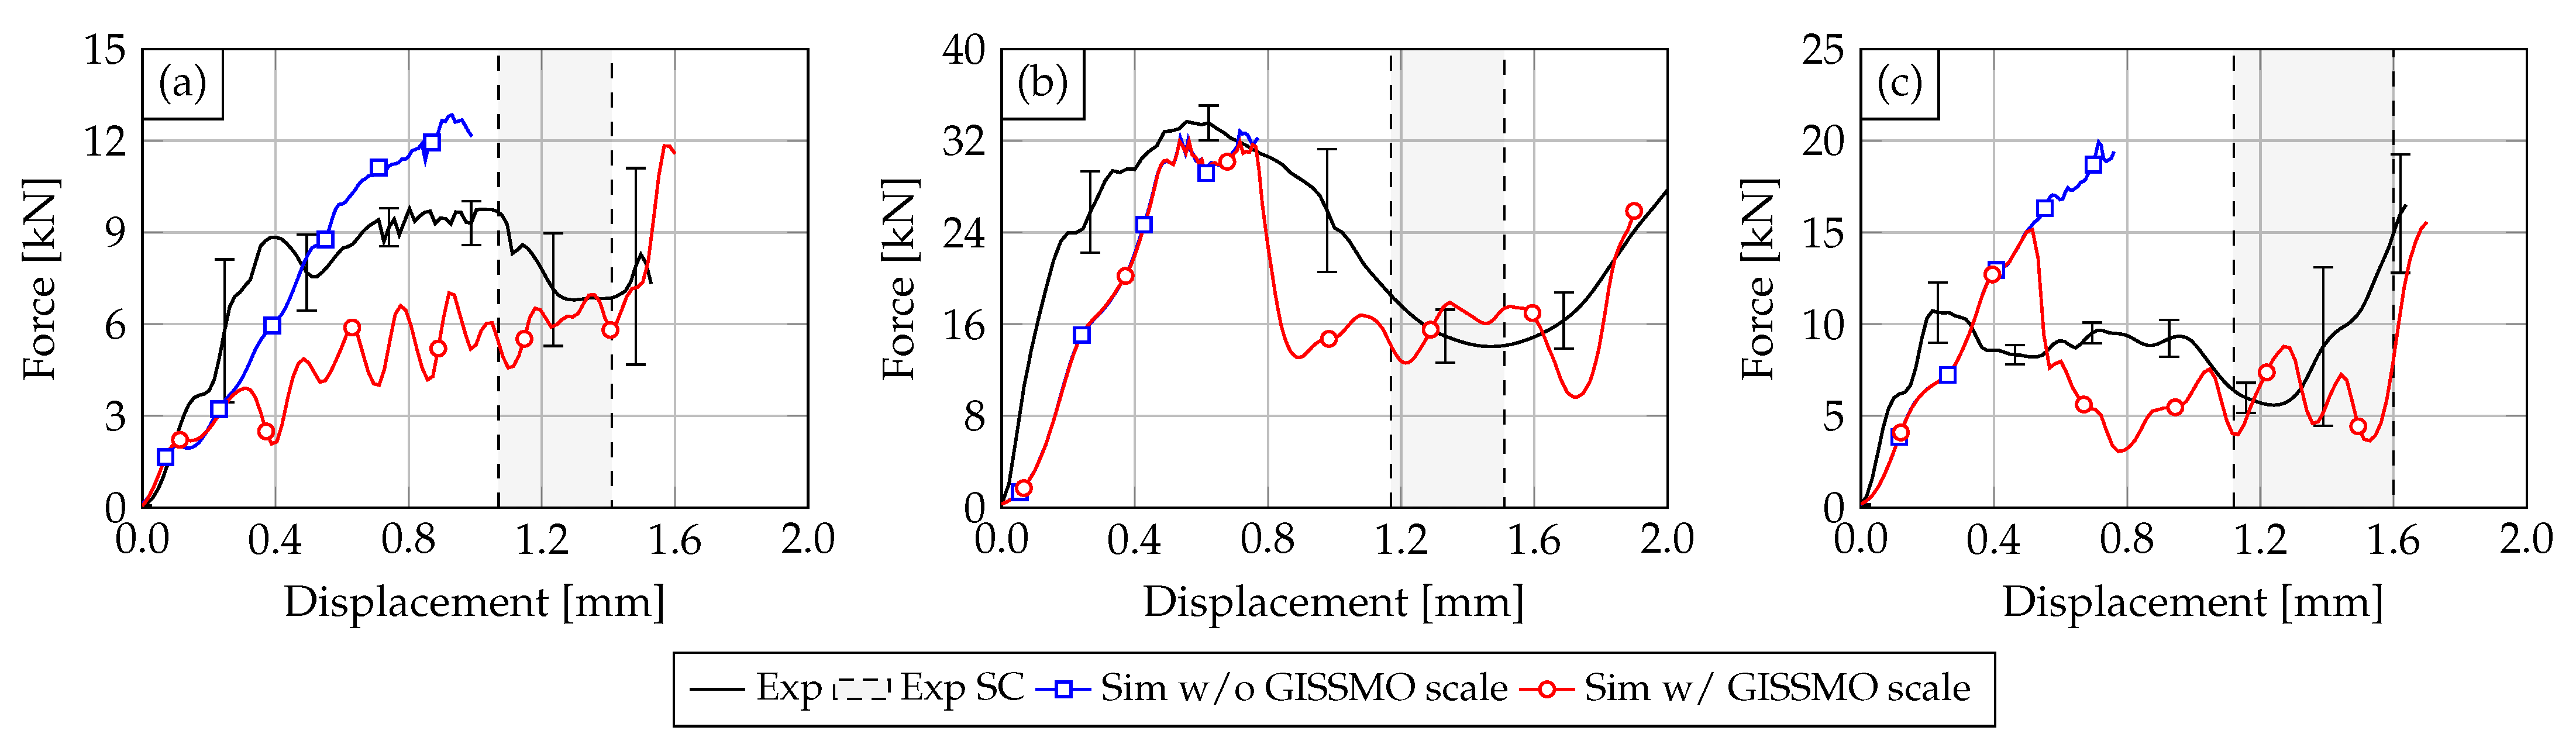
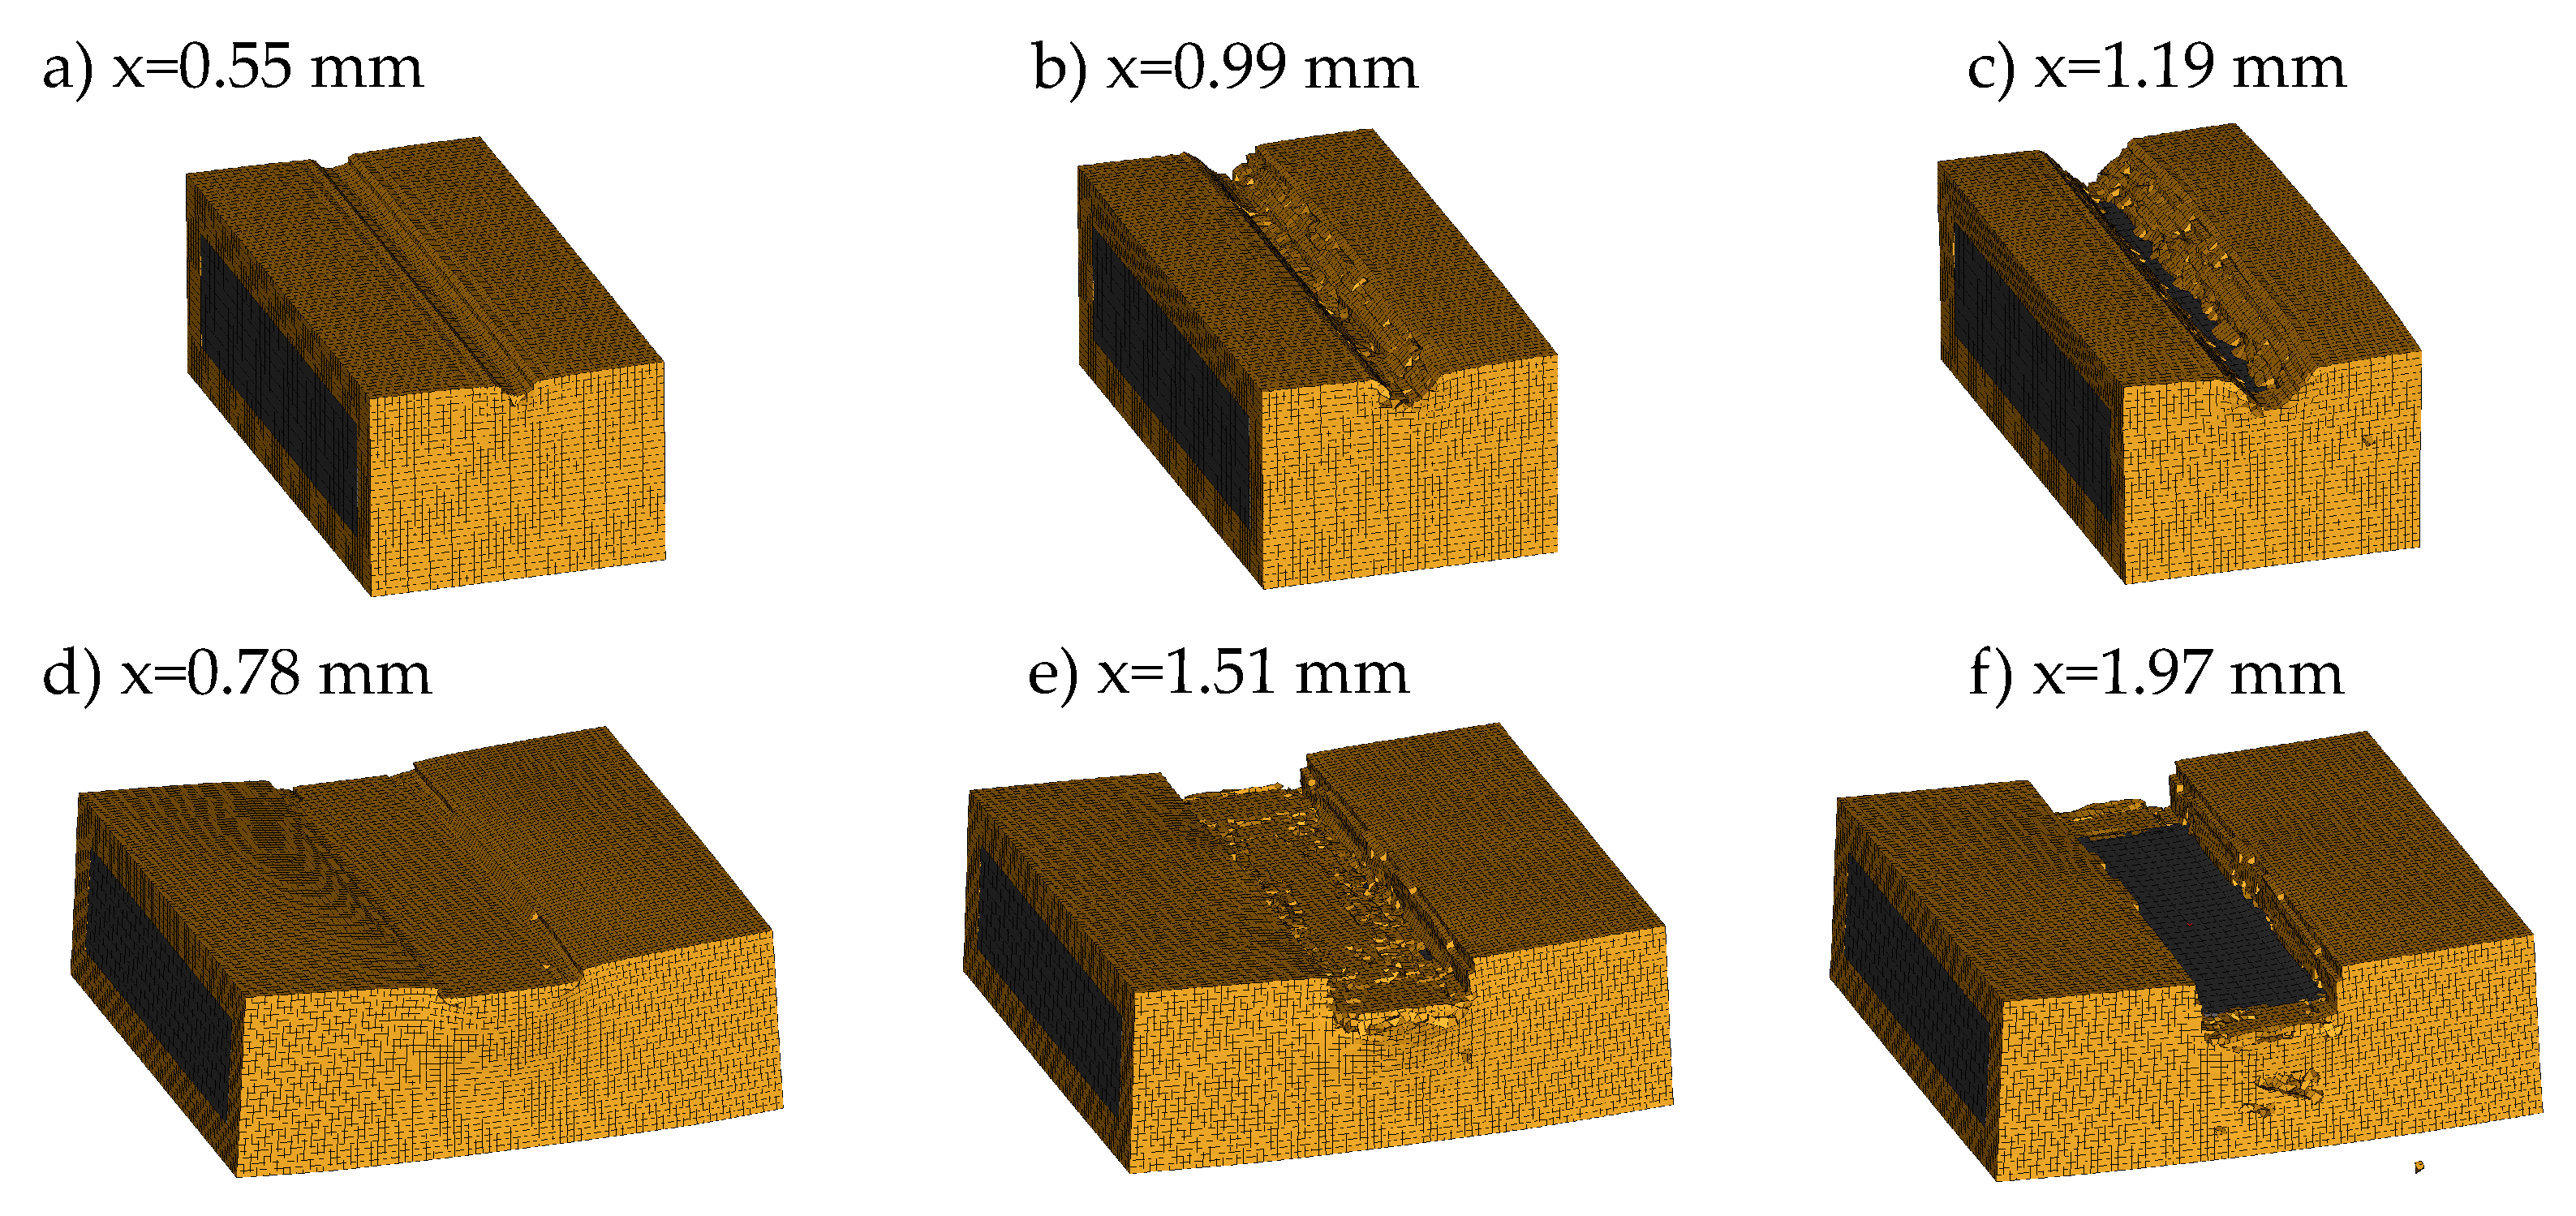
3.2. Numerical
4. Conclusions
Author Contributions
Funding
Institutional Review Board Statement
Informed Consent Statement
Data Availability Statement
Acknowledgments
Conflicts of Interest
Abbreviations
| HVB | High-voltage busbar |
| SHPB | Split Hopkinson pressure bar |
| SC | Short circuit |
| FE | Finite element |
| PLA | Polylactic acid |
| QS | Quasi-static |
Appendix A

References
- Pragana, J.P.M.; Baptista, R.J.S.; Bragança, I.M.F.; Silva, C.M.A.; Alves, L.M.; Martins, P.A.F. Manufacturing hybrid busbars through joining by forming. J. Mater. Process. Technol. 2020, 279, 116574. [Google Scholar] [CrossRef]
- Jung, C. Power Up with 800-V Systems: The benefits of upgrading voltage power for battery-electric passenger vehicles. IEEE Electrif. Mag. 2017, 5, 53–58. [Google Scholar] [CrossRef]
- Liang, J.; Li, F.; Cheng, H.-M. High-capacity lithium ion batteries: Bridging future and current. Energy Storage Mater. 2016, 4, A1–A2. [Google Scholar] [CrossRef]
- Chung, S.H.; Tancogne-Dejean, T.; Zhu, J.; Luo, H.; Wierzbicki, T. Failure in lithium-ion batteries under transverse indentation loading. J. Power Sources 2018, 389, 148–159. [Google Scholar] [CrossRef]
- Greve, L.; Fehrenbach, C. Mechanical testing and macro-mechanical finite element simulation of the deformation, fracture, and short circuit initiation of cylindrical Lithium ion battery cells. J. Power Sources 2012, 214, 377–385. [Google Scholar] [CrossRef]
- Sahraei, E.; Campbell, J.; Wierzbicki, T. Modeling and short circuit detection of 18650 Li-ion cells under mechanical abuse conditions. J. Power Sources 2012, 220, 360–372. [Google Scholar] [CrossRef]
- Xia, Y.; Chen, G.; Zhou, Q.; Shi, X.; Shi, F. Failure behaviours of 100% SOC lithium-ion battery modules under different impact loading conditions. Eng. Fail. Anal. 2017, 82, 149–160. [Google Scholar] [CrossRef]
- Xia, Y.; Wierzbicki, T.; Sahraei, E.; Zhang, X. Damage of cells and battery packs due to ground impact. J. Power Sources 2014, 267, 78–97. [Google Scholar] [CrossRef]
- Zhou, W.; Hao, F.; Fang, D. The effects of elastic stiffening on the evolution of the stress field within a spherical electrode particle of lithium-ion batteries. Int. J. Appl. Mech. 2013, 05, 1350040. [Google Scholar] [CrossRef]
- Zhou, W. Effects of external mechanical loading on stress generation during lithiation in Li-ion battery electrodes. Electrochim. Acta 2015, 185, 28–33. [Google Scholar] [CrossRef] [Green Version]
- Bubbico, R.; Greco, V.; Menale, C. Hazardous scenarios identification for Li-ion secondary batteries. Saf. Sci. 2018, 108, 72–88. [Google Scholar] [CrossRef]
- Werling, T.; Geuting, P.; Höschele, P.; Ellersdorfer, C.; Sinz, W. Investigation of the electro-mechanical behavior of automotive high voltage busbars under combined electrical load with varying indenter geometry and environmental conditions. J. Energy Storage 2020, 32, 101861. [Google Scholar] [CrossRef]
- SAE J1654: High Voltage Primary Cable; SAE International: Warrendale, PA, USA, 2014.
- ISO 14572:2011-10 Road Vehicles—Round, Sheathed, 60 V and 600 V Screened and Unscreened Single- or Multi-Core Cables—Test Methods and Requirements for Basic- and High-Performance Cables; International Organization for Standardization: Geneva, Switzerland, 1986.
- Werling, T.; Sprenger, M.; Ellersdorfer, C.; Sinz, W. Experimental and Numerical Investigation of the Behavior of Automotive Battery Busbars under Varying Mechanical Loads. Energies 2020, 13, 6572. [Google Scholar] [CrossRef]
- Liu, Y.; Xia, Y.; Yu, H.; Shi, F. An Experiment and Simulation Study on Failure of High Voltage Cables under Indentation. In Proceedings of the WCX SAE World Congress Experience; SAE Technical Paper Series; SAE International: Warrendale, PA, USA, 14 April 2020. [Google Scholar]
- Şerban, D.A.; Weber, G.; Marşavina, L.; Silberschmidt, V.V.; Hufenbach, W. Tensile properties of semi-crystalline thermoplastic polymers: Effects of temperature and strain rates. Polym. Test. 2013, 32, 413–425. [Google Scholar] [CrossRef]
- Siviour, C.R.; Jordan, J.L. High Strain Rate Mechanics of Polymers: A Review. J. Dyn. Behav. Mater. 2016, 2, 15–32. [Google Scholar] [CrossRef] [Green Version]
- Meenken, T. Charakterisierung niederimpedanter Werkstoffe unter dynamischen Lasten. In Epsilon—Forschungsergebnisse aus der Kurzzeitdynamik; Thoma, K., Hiermaier, S., Eds.; Fraunhofer-IRB-Verlag: Stuttgart, Germany, 2008. [Google Scholar]
- ISO 1110:2019-09 Plastics—Polyamides—Accelerated Conditioning of Test Specimens; International Organization for Standardization: Geneva, Switzerland, 2019.
- Cu-OFE. Available online: https://www.matthey.ch/fileadmin/user_upload/downloads/fichetechnique/EN/Cu-OFE_C.pdf (accessed on 8 September 2021).
- Grilamid XE 3817. Available online: https://www.campusplastics.com/campus/de/datasheet/Grilamid+XE+3817+black+9992/EMS-GRIVORY/61/c60e4189/SI?pos=10 (accessed on 8 September 2021).
- Grilon BG-30 FR. Available online: https://www.campusplastics.com/campus/de/datasheet/Grilon+BG-30+FR/EMS-GRIVORY/61/2ecee37e/SI?pos=47 (accessed on 8 September 2021).
- Mancini, E.; Sasso, M.; Rossi, M.; Chiappini, G.; Newaz, G.; Amodio, D. Design of an Innovative System for Wave Generation in Direct Tension–Compression Split Hopkinson Bar. J. Dyn. Behav. Mater. 2015, 1, 201–213. [Google Scholar] [CrossRef] [Green Version]
- Chen, W.; Song, B. Split Hopkinson (Kolsky) Bar, 1st ed.; Springer: Boston, MA, USA, 2011. [Google Scholar]
- Hallquist, J. LS-DYNA Theory Manual; Livermore Software Technology Corporation (LSTC): Livermore, CA, USA, 2019. [Google Scholar]
- Neukamm, F.; Feucht, M.; Haufe, A. Considering damage history in crashworthiness simulations. In Proceedings of the 7th European LS-DYNA Conference, Salzburg, Austria, 14–15 May 2009. [Google Scholar]
- Althammer, F.; Moncayo, D.; Middendorf, P. Approach for modelling thermoplastic generative designed parts. In Proceedings of the 12th European LS-DYNA Conference, Koblenz, Germany, 14–16 May 2019. [Google Scholar]
- Tabacu, S.; Ducu, C. Numerical investigations of 3D printed structures under compressive loads using damage and fracture criterion: Experiments, parameter identification, and validation. Extrem. Mech. Lett. 2020, 39, 100775. [Google Scholar] [CrossRef]
- Effelsberg, J.; Haufe, A.; Feucht, M.; Neukamm, F. On parameter identification for the GISSMO damage model. In Proceedings of the 12th International LS-DYNA User Conference, Dearborn, MI, USA, 3–5 June 2012. [Google Scholar]
- Neukamm, F. Lokalisierung und Versagen von Blechstrukturen. Ph.D. Thesis, University of Stuttgart, Stuttgart, Germany, 21 June 2018. [Google Scholar]


| Property | PA12 | PA6GF30 | Cu-OFE R200 | Cu-OFE R240 | |
|---|---|---|---|---|---|
| Density | (g/cm3) | 1.01 | 1.39 | 8.94 | 8.94 |
| Young’s Modulus | (GPa) | 1.2 | 4.5 | 127 | 127 |
| Yield Stress | (MPa) | 40 | 60 | <140 | >180 |
| Tensile Strength | (MPa) | - | - | 200–260 | 240–300 |
| Melting Point | (°C) | 178 | 222 | 1084 | 1084 |
| Moisture Absorption | (%) | 0.7 | 2.5 | - | - |
| Material | Indenter | Force (kN) | Penetration (mm) | Energy (J) | ||||||
|---|---|---|---|---|---|---|---|---|---|---|
| q.s. | dyn. | q.s. | dyn. | q.s. | dyn. | |||||
| V1 | 3.47 | 13.5 | +289% | 0.601 | 0.941 | +56.7% | 0.60 | 6.52 | +987% | |
| PA12 | V4 | 29.9 | 36.3 | +21.4% | 1.286 | 1.613 | +25.5% | 20.0 | 43.9 | +119% |
| V5 | 14.1 | 20.7 | +46.5% | 0.996 | 1.310 | +36.6% | 6.55 | 18.8 | +187% | |
| V1 | 6.68 | 7.06 | +5.7% | 1.223 | 1.264 | +3.32% | 4.35 | 9.30 | +113% | |
| PA6GF30 | V4 | 35.0 | 15.4 | −56.0% | 1.955 | 1.346 | −31.1% | 50.5 | 33.1 | −34.5% |
| V5 | 19.4 | 6.50 | −66.5% | 1.657 | 1.390 | −16.1% | 17.8 | 11.0 | −38.2% | |
Publisher’s Note: MDPI stays neutral with regard to jurisdictional claims in published maps and institutional affiliations. |
© 2021 by the authors. Licensee MDPI, Basel, Switzerland. This article is an open access article distributed under the terms and conditions of the Creative Commons Attribution (CC BY) license (https://creativecommons.org/licenses/by/4.0/).
Share and Cite
Werling, T.; Baumann, G.; Feist, F.; Sinz, W.; Ellersdorfer, C. On the Dynamic Electro-Mechanical Failure Behavior of Automotive High-Voltage Busbars Using a Split Hopkinson Pressure Bar. Materials 2021, 14, 6320. https://doi.org/10.3390/ma14216320
Werling T, Baumann G, Feist F, Sinz W, Ellersdorfer C. On the Dynamic Electro-Mechanical Failure Behavior of Automotive High-Voltage Busbars Using a Split Hopkinson Pressure Bar. Materials. 2021; 14(21):6320. https://doi.org/10.3390/ma14216320
Chicago/Turabian StyleWerling, Tobias, Georg Baumann, Florian Feist, Wolfgang Sinz, and Christian Ellersdorfer. 2021. "On the Dynamic Electro-Mechanical Failure Behavior of Automotive High-Voltage Busbars Using a Split Hopkinson Pressure Bar" Materials 14, no. 21: 6320. https://doi.org/10.3390/ma14216320
APA StyleWerling, T., Baumann, G., Feist, F., Sinz, W., & Ellersdorfer, C. (2021). On the Dynamic Electro-Mechanical Failure Behavior of Automotive High-Voltage Busbars Using a Split Hopkinson Pressure Bar. Materials, 14(21), 6320. https://doi.org/10.3390/ma14216320