
Electrodeposition of Hybrid Magnetostrictive/Magnetoelectric Layered Systems

 ,
,
Abstract
:1. Introduction
2. Materials and Methods
3. Results and Discussion
4. Conclusions
Supplementary Materials
Author Contributions
Funding
Institutional Review Board Statement
Informed Consent Statement
Data Availability Statement
Acknowledgments
Conflicts of Interest
References
- Spaldin, N.; Cheong, S.-W.; Ramesh, R. Multiferroics: Past, present, and future. Phys. Today 2010, 63, 38–43. [Google Scholar] [CrossRef] [Green Version]
- Amiri, P.K.; Alzate, J.G.; Cai, X.Q.; Ebrahimi, F.; Hu, Q.; Wong, K.; Grezes, C.; Lee, H.; Yu, G.; Li, X.; et al. Electric-Field-Controlled Magnetoelectric RAM: Progress, Challenges, and Scaling. IEEE Trans. Magn. 2015, 51, 1–7. [Google Scholar] [CrossRef]
- Spaldin, N.A.; Ramesh, R. Advances in magnetoelectric multiferroics. Nat. Mater. 2019, 18, 203–212. [Google Scholar] [CrossRef] [PubMed]
- Tado, G.T. Observation and possible mechanisms of magnetoelectric effects in a ferromagnet. Phys. Rev. Lett. 1964, 13, 335–337. [Google Scholar]
- Abrahams, S.C.; Reddy, J.M.; Bernstein, J.L. Crystal Structure of Piezoelectric Ferromagnetic Gallium Iron Oxide. J. Chem. Phys. 1965, 42, 3957–3968. [Google Scholar] [CrossRef]
- Arima, T.; Higashiyama, D.; Kaneko, Y.; He, J.P.; Goto, T.; Miyasaka, S.; Kimura, T.; Oikawa, K.; Kamiyama, T.; Kumai, R.; et al. Structural and magnetoelectric properties ofGa2−xFexO3 single crystals grown by a floating-zone method. Phys. Rev. B 2004, 70, 064426. [Google Scholar] [CrossRef]
- Trassin, M.; Viart, N.; Versini, G.; Barre, S.; Pourroy, G.; Lee, J.; Jo, W.; Dumesnil, K.; Dufour, C.; Robert, S. Room temperature ferrimagnetic thin films of the magnetoelectric Ga2−xFexO3. J. Mater. Chem. 2009, 19, 8876–8880. [Google Scholar] [CrossRef]
- Mukherjee, S.; Roy, A.; Auluck, S.; Prasad, R.; Gupta, R.; Garg, A. Room temperature nanoscale ferroelectricity in magnetoe-lectric GaFeO3 epitaxial thin films. Phys. Rev. Lett. 2013, 111, 087601. [Google Scholar] [CrossRef] [Green Version]
- Oh, S.H.; Lee, J.H.; Shin, R.H.; Shin, Y.; Meny, C.; Jo, W. Room-temperature polarization switching and antiferromagnetic coupling in epitaxial (Ga,Fe)2O3/SrRuO3 heterostructures. Appl. Phys. Lett. 2015, 106, 142902. [Google Scholar] [CrossRef] [Green Version]
- Mohamed, M.B.; Senyshyn, A.; Ehrenberg, H.; Fuess, H. Structural, magnetic, dielectric properties of multiferroic GaFeO3 prepared by solid state reaction and sol–gel methods. J. Alloys Compd. 2010, 492, L20–L27. [Google Scholar] [CrossRef]
- Mishra, M.; Roy, A.; Garg, A.; Gupta, R.; Mukherjee, S. Room temperature multiferroism in polycrystalline thin films of gallium ferrite. J. Alloys Compd. 2017, 721, 593–599. [Google Scholar] [CrossRef] [Green Version]
- Zhang, M.; Yasui, S.; Katayama, T.; Rao, B.N.; Wen, H.; Pan, X.; Tang, M.; Ai, F.; Itoh, M. Epitaxial Growth of Orthorhombic GaFeO3 Thin Films on SrTiO3 (111) Substrates by Simple Sol-Gel Method. Materials 2019, 12, 254. [Google Scholar] [CrossRef] [Green Version]
- Sun, X.; Tiwari, D.; Fermin, D.J. High Interfacial Hole-Transfer Efficiency at GaFeO3 Thin Film Photoanodes. Adv. Energy Mater. 2020, 10, 2002784. [Google Scholar] [CrossRef]
- Roulland, F.; Lefevre, C.; Thomasson, A.; Viart, N. Study of Ga(2−x)FexO3 solid solution: Optimisation of the ceramic processing. J. Eur. Ceram. Soc. 2013, 33, 1029–1035. [Google Scholar] [CrossRef]
- Kundys, B.; Roulland, F.; Lefèvre, C.; Mény, C.; Thomasson, A.; Viart, N. Room temperature polarization in the ferrimagnetic Ga2−xFexO3 ceramics. J. Eur. Ceram. Soc. 2015, 35, 2277–2281. [Google Scholar] [CrossRef] [Green Version]
- Wang, N.; Wen, F.; Li, L.; Lü, Y.; Liu, S.; Liu, Z.; Xu, B.; He, J.; Yu, D.; Tian, Y. Magnetic frustration effect in polycrystalline Ga2−xFexO3. J. Magn. Magn. Mater. 2010, 322, 3595–3600. [Google Scholar] [CrossRef]
- Kim, W.; We, J.H.; Kim, S.J.; Kim, C.-S. Effects of cation distribution for AFeO3 (A = Ga, Al). J. Appl. Phys. 2007, 101, 09M515. [Google Scholar] [CrossRef]
- Roy, S.; Mallesham, B.; Zade, V.B.; Martinez, A.; Shutthanandan, V.; Thevuthasan, S.; Ramana, C.V.; Bandi, M. Correlation between Structure, Chemistry, and Dielectric Properties of Iron-Doped Gallium Oxide (Ga2–xFexO3). J. Phys. Chem. C 2018, 122, 27597–27607. [Google Scholar] [CrossRef]
- Roy, S.; Ramana, C.V. Effect of Thermochemical Synthetic Conditions on the Structure and Dielectric Properties of Ga1.9Fe0.1O3 Compounds. Inorg. Chem. 2018, 57, 1029–1039. [Google Scholar] [CrossRef]
- Trassin, M.; Viart, N.; Versini, G.; Loison, J.-L.; Vola, J.-P.; Schmerber, G.; Cregut, O.; Barre, S.; Pourroy, G.; Lee, J.H.; et al. Epitaxial thin films of multiferroic GaFeO3 on conducting indium tin oxide (001) buffered yttrium-stabilized zirconia (001) by pulsed laser deposition. Appl. Phys. Lett. 2007, 91, 202504. [Google Scholar] [CrossRef]
- Sharma, K.; Reddy, V.R.; Gupta, A.; Choudhary, R.J.; Phase, D.M.; Ganesan, V. Study of site-disorder in epitaxial magneto-electric GaFeO3 thin films. Appl. Phys. Lett. 2013, 102, 212401. [Google Scholar] [CrossRef]
- Zhong, G.; Bitla, Y.; Wang, J.; Zhong, X.; An, F.; Chin, Y.-Y.; Zhang, Y.; Gao, W.; Zhang, Y.; Eshghinejad, A.; et al. Tuning Fe concentration in epitaxial gallium ferrite thin films for room temperature multiferroic properties. Acta Mater. 2018, 145, 488–495. [Google Scholar] [CrossRef]
- Katayama, T.; Yasui, S.; Hamasaki, Y.; Itoh, M. Control of crystal-domain orientation in multiferroic Ga0.6Fe1.4O3 epitaxial thin films. Appl. Phys. Lett. 2017, 110, 212905. [Google Scholar] [CrossRef]
- Prados, A.; Muñoz-Noval, A.; Ranchal, R. Investigation into the electrodeposition of Ga-Fe-O thin films. Thin Solid Film. 2021, 731, 138748. [Google Scholar] [CrossRef]
- Álvarez-Álvarez, P.; Prados, A.; Muñoz-Noval, A.; Ranchal, R. Morphological, structural and magnetic evolution of sputtered Fe70Ga30 thin films upon annealing in oxygen atmosphere. J. Alloys Compd. 2017, 713, 229–235. [Google Scholar] [CrossRef]
- Reddy, K.S.M.; Estrine, E.C.; Lim, D.-H.; Smyrl, W.H.; Stadler, B.J.H. Controlled electrochemical deposition of magneto-strictive Fe1−xGax alloys. Electrochem. Commun. 2012, 18, 127–130. [Google Scholar] [CrossRef]
- Ranchal, R.; Maestre, D. Growth and characterization of Fe1−xGax thin films from citrate-based electrolytes. J. Phys. D Appl. Phys. 2014, 47, 355004. [Google Scholar] [CrossRef]
- Zhou, Z.; Zhao, S.; Gao, Y.; Wang, X.; Nan, T.; Sun, N.X.; Yang, X.; Liu, M. The memory effect of magnetoelectric coupling in FeGaB/NiTi/PMN-PT multiferroic heterostructure. Sci. Rep. 2016, 6, 20450. [Google Scholar] [CrossRef] [Green Version]
- Van Hook, H.J. Thermal Stability of Gallium Orthoferrite in the System Fe2O3-FeO-Ga2O3. J. Am. Ceram. Soc. 1965, 48, 470–472. [Google Scholar] [CrossRef]
- Vequizo, J.J.M.; Ichimura, M. Electrodeposition and characterization of γ-FeOOH thin films from oxygen-bubbled aqueous iron sulfate solutions. Appl. Phys. Express 2013, 6, 125501. [Google Scholar] [CrossRef]
- De Groot, F.M.F.; Fuggle, J.C.; Thole, B.T.; Sawatzky, G.A. 2p x-ray absorption of 3d transition-metal compounds: An atomic multiplet description including the crystal field. Phys. Rev. B 1990, 42, 5459–5468. [Google Scholar] [CrossRef] [PubMed]
- Abbate, M.; de Groot, F.M.F.; Fuggle, J.C.; Fujimori, A.; Tokura, Y.; Fujishima, Y.; Strebel, O.; Domke, M.; Kaindl, G.; van Elp, J.; et al. Soft-x-ray-absorption studies of the location of extra charges induced by substitution in controlled-valence materials. Phys. Rev. B 1991, 44, 5419–5422. [Google Scholar] [CrossRef] [PubMed]
- Ranchal, R.; Fin, S.; Bisero, D. Magnetic microstructures in electrodeposited Fe1-xGax thin films (15 ≤ x ≤ 22 at.%). J. Phys. D Appl. Phys. 2015, 48, 075001. [Google Scholar] [CrossRef]
- Coey, J.M.D.; Chien, C. Half-Metallic Ferromagnetic Oxides. MRS Bull. 2003, 28, 720–724. [Google Scholar] [CrossRef]
- Dekkers, M.J. Magnetic properties of natural Goethite-I. Grain-Size dependence of some low- and high-field related rock-magnetic parameters measured at room temperature. Geophys. J. Intern. 1989, 97, 323–340. [Google Scholar] [CrossRef] [Green Version]
- Garel, T.; Doniach, S. Phase transitions with spontaneous modulation—The dipolar Ising ferromagnet. Phys. Rev. B 1982, 26, 325–329. [Google Scholar] [CrossRef]
- Tacchi, S.; Fin, S.; Carlotti, G.; Gubbiotti, G.; Madami, M.; Barturen, M.; Marangolo, M.; Eddrief, M.; Bisero, D.; Rettori, A.; et al. Rotatable magnetic anisotropy in a Fe0.8Ga0.2thin film with stripe domains: Dynamics versus statics. Phys. Rev. B 2014, 89, 024411. [Google Scholar] [CrossRef]
- Ranchal, R.; Fin, S.; Bisero, D.; Aroca, C. Tailoring the magnetic anisotropy and domain patterns of sputtered TbFeGa alloys. J. Alloys Compd. 2014, 582, 839–843. [Google Scholar] [CrossRef] [Green Version]
- Liu, X.H.; Liu, W.; Dai, Z.M.; Li, S.K.; Wang, T.T.; Cui, W.B.; Li, D.; Komarek, A.C.; Chang, C.-F.; Zhang, Z.D. Direct observation of magnetic domain evolution in the vicinity of Verwey transition in Fe3O4 thin films. Appl. Phys. Lett. 2017, 111, 212401. [Google Scholar] [CrossRef]
- Chichvarina, O.; Herng, T.S.; Xiao, W.; Hong, X.; Ding, J. Magnetic anisotropy modulation of epitaxial Fe3O4 films on MgO substrates. J. Appl. Phys. 2015, 117, 17D722. [Google Scholar] [CrossRef]
- Begué, A.; Proietti, M.G.; Arnaudas, J.I.; Ciria, M. Magnetic ripple domain structure in FeGa/MgO thin films. J. Magn. Magn. Mater. 2020, 498, 166135. [Google Scholar] [CrossRef] [Green Version]
- Bartolomé, P.; Maicas, M.; Ranchal, R. Out of plane component of the magnetization of sputtered Fe72Ga28 layers. J. Magn. Magn. Mater. 2020, 514, 167183. [Google Scholar] [CrossRef]


| Elec. | FeSO4 (mM) | pH | Potential (V) | Fe/Ga Ratio (at. %) |
|---|---|---|---|---|
| I | 35 | 4 | −1.150 | 69/31 |
| −1.100 | 76/24 | |||
| −1.075 | 77/23 | |||
| II | 25 | 4 | −1.150 | 66/34 |
| −1.100 | 70/30 | |||
| −1.075 | 77/23 | |||
| III | 12 | 4 | −1.150 | 64/36 |
| −1.100 | 70/30 | |||
| −1.075 | 76/24 | |||
| IV | 12 | 8 | −1.150 | 58/42 |
| −1.100 | 66/34 | |||
| −1.075 | - |
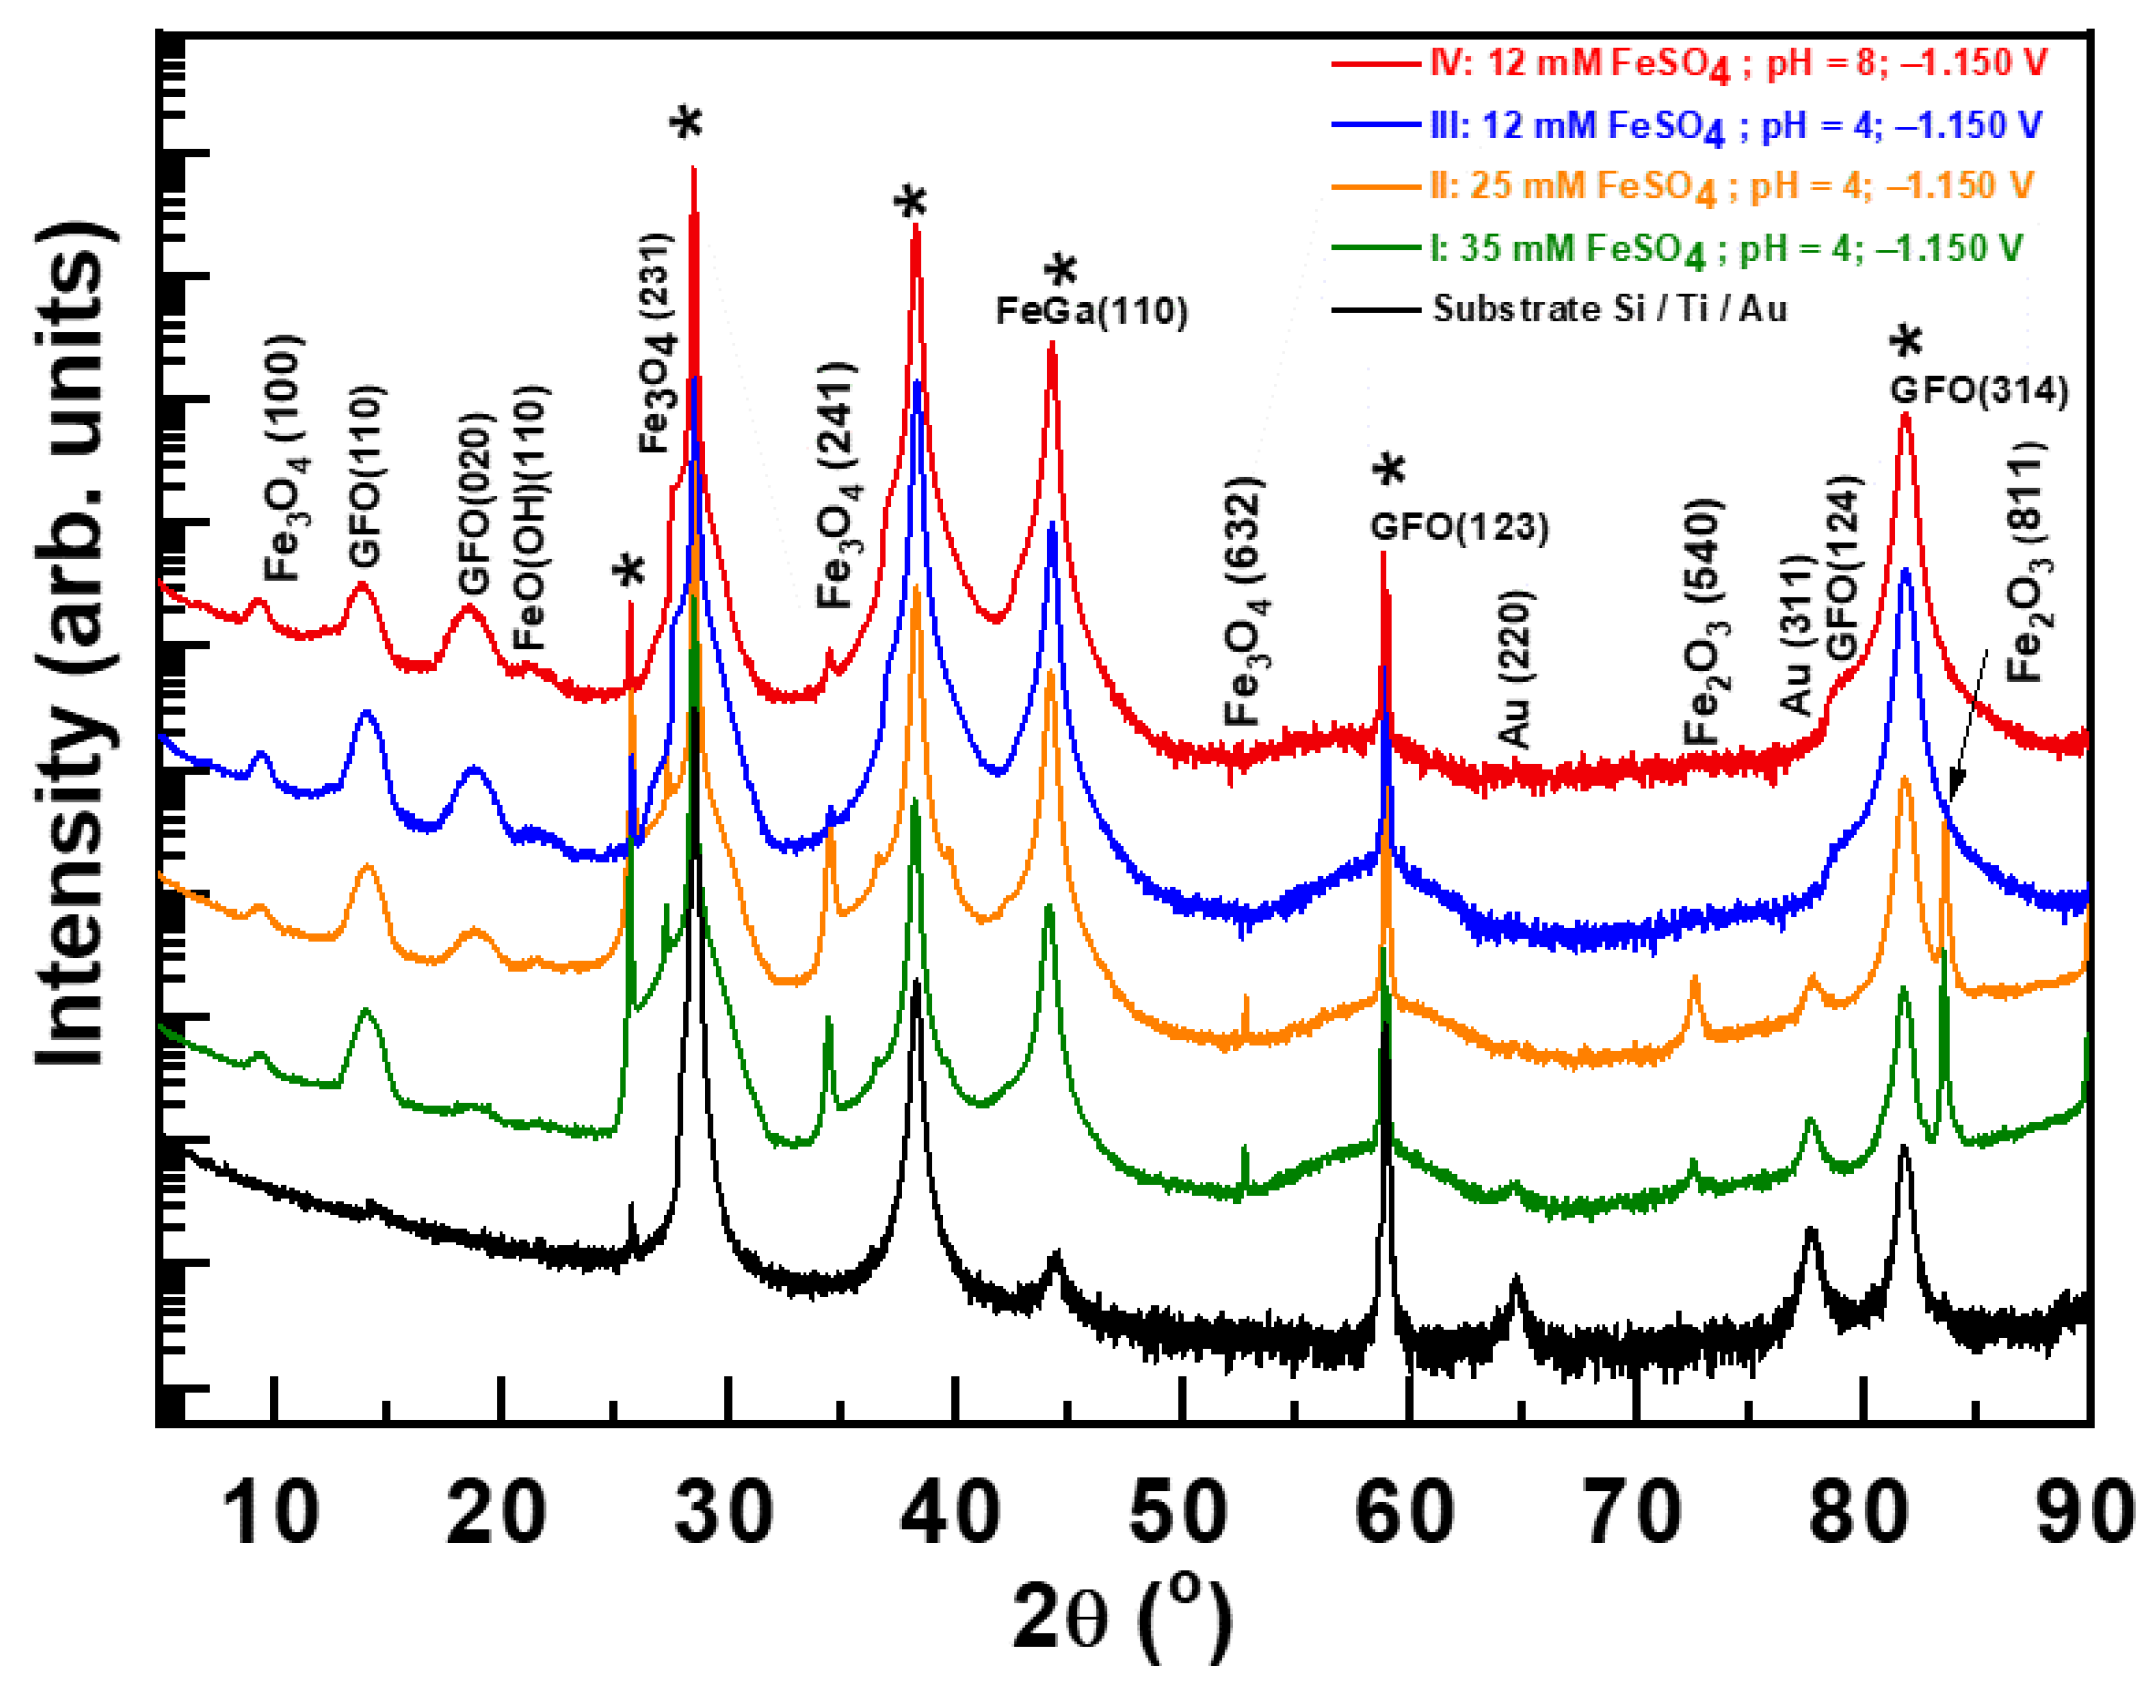
| 2θ | Compound | hkl | Integrated Area | |||
|---|---|---|---|---|---|---|
| I | II | III | IV | |||
| 9.33 | Fe3O4 | 011 | 635 | 476 | 396 | 365 |
| 14.04 | GFO | 110 | 1264 | 1697 | 1793 | 1257 |
| 18.59 | GFO | 020 | 147 | 974 | 1018 | 1160 |
| 21.21 | FeO(OH) | 110 | 0 | 44 | 92 | 117 |
| 27.36 | Fe3O4 | 231 | 1530 | 1667 | 11 | 12 |
| 34.14 | Fe3O4 | 241 | 2795 | 2968 | 24 | 53 |
| 44.30 | FeGa | 110 | 16,206 | 74,219 | 42,129 | 57,530 |
| 52.85 | Fe3O4 | 632 | 25 | 21 | - | - |
| 72.40 | Fe2O3 | 540 | 52 | 175 | - | - |
| 78.86 | GFO | 124 | - | - | 152 | 163 |
| 83.63 | Fe2O3 | 811 | 1939 | 1548 | - | - |
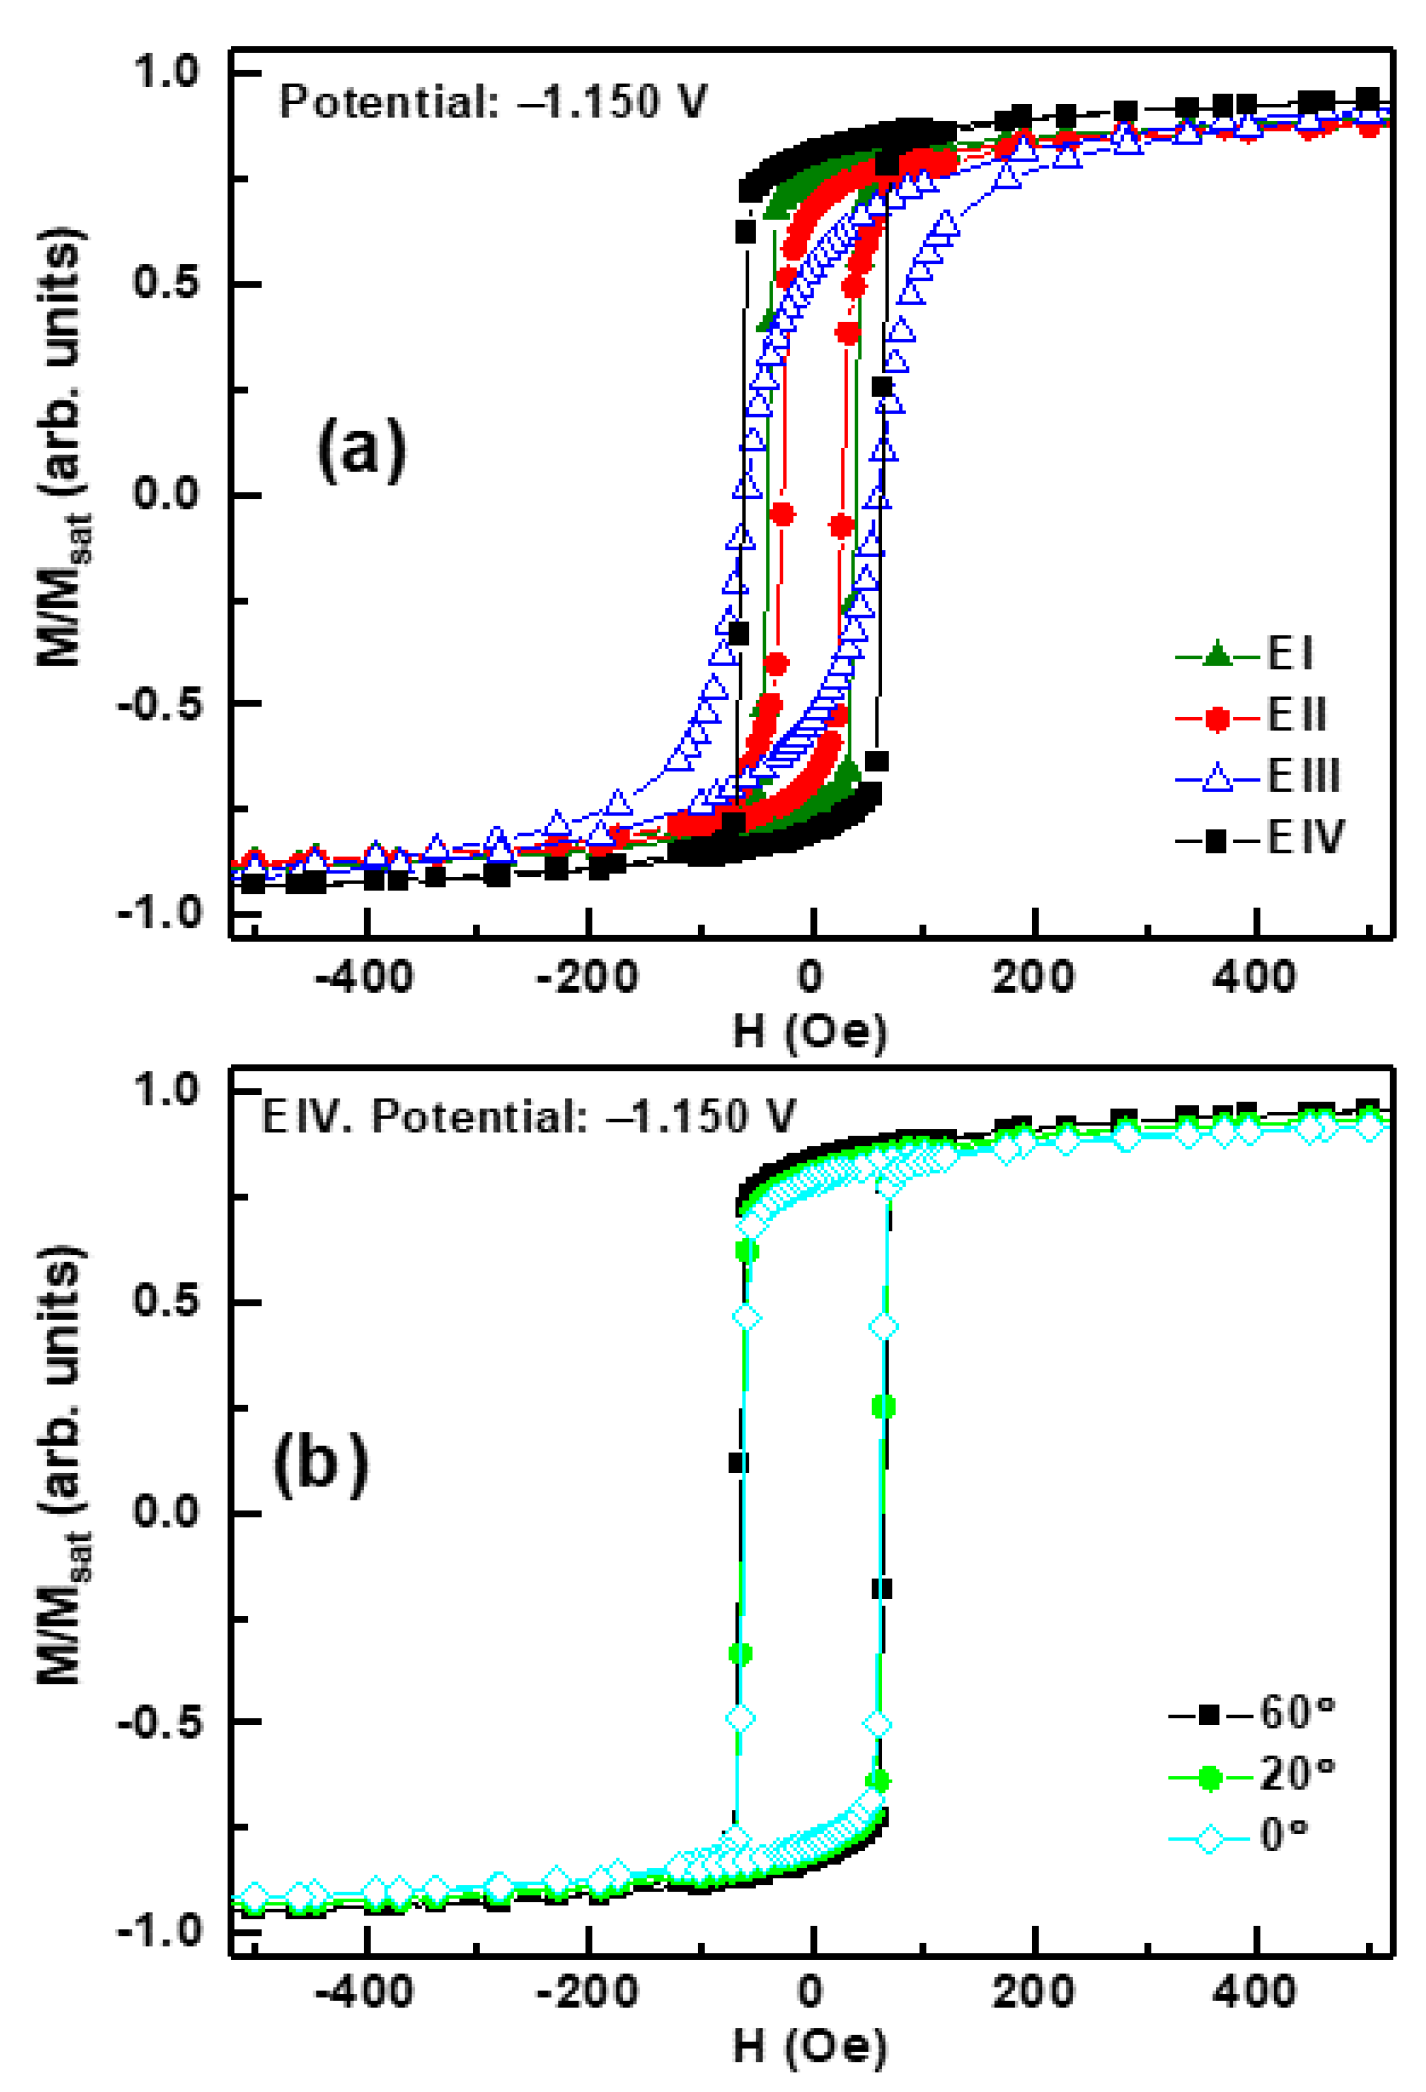
| In Plane | In Plane | Perpendicular | Integrated Area Below Diffraction Peaks | |||||
|---|---|---|---|---|---|---|---|---|
| Elec. | Pot. (V) | Hc (Oe) | Mr/Mmax (arb. units) | Mr,perp/Mmax,perp (arb. units) | FeGa (110) | GFO (110) | GFO (020) | GFO (124) |
| I | −1.150 | 26 | 0.67 | 0.03 | 16,206 | 1264 | 147 | - |
| −1.100 | 26 | 0.70 | 0.08 | 12,420 | 1097 | 974 | - | |
| −1.075 | 19 | 0.65 | 0.13 | 16,795 | 995 | 566 | - | |
| II | −1.150 | 41 | 0.75 | 0.11 | 74,219 | 1697 | 975 | - |
| −1.100 | 30 | 0.60 | 0.08 | 36,783 | 1363 | 1382 | - | |
| −1.075 | 34 | 0.12 | 0.02 | 1624 | 1700 | 970 | - | |
| III | −1.150 | 61 | 0.53 | 0.11 | 42,129 | 1793 | 1018 | 152 |
| −1.100 | 27 | 0.06 | 0.01 | 3136 | 1046 | 1304 | 98 | |
| −1.075 | 49 | 0.05 | 0.01 | 578 | 946 | 897 | 79 | |
| IV | −1.150 | 61 | 0.78 | 0.03 | 57,530 | 1257 | 1160 | 163 |
| −1.100 | 60 | 0.80 | 0.14 | 55,426 | 1251 | 802 | 108 | |
| −1.075 | 163 | 0.25 | 0.08 | 132 | 1243 | 1203 | 87 | |
Publisher’s Note: MDPI stays neutral with regard to jurisdictional claims in published maps and institutional affiliations. |
© 2021 by the authors. Licensee MDPI, Basel, Switzerland. This article is an open access article distributed under the terms and conditions of the Creative Commons Attribution (CC BY) license (https://creativecommons.org/licenses/by/4.0/).
Share and Cite
Abad, S.; Prados, A.; Maicas, M.; Biskup, N.; Varela, M.; Ranchal, R. Electrodeposition of Hybrid Magnetostrictive/Magnetoelectric Layered Systems. Materials 2021, 14, 6304. https://doi.org/10.3390/ma14216304
Abad S, Prados A, Maicas M, Biskup N, Varela M, Ranchal R. Electrodeposition of Hybrid Magnetostrictive/Magnetoelectric Layered Systems. Materials. 2021; 14(21):6304. https://doi.org/10.3390/ma14216304
Chicago/Turabian StyleAbad, Sara, Alicia Prados, Marco Maicas, Neven Biskup, Maria Varela, and Rocio Ranchal. 2021. "Electrodeposition of Hybrid Magnetostrictive/Magnetoelectric Layered Systems" Materials 14, no. 21: 6304. https://doi.org/10.3390/ma14216304
APA StyleAbad, S., Prados, A., Maicas, M., Biskup, N., Varela, M., & Ranchal, R. (2021). Electrodeposition of Hybrid Magnetostrictive/Magnetoelectric Layered Systems. Materials, 14(21), 6304. https://doi.org/10.3390/ma14216304