
Detection and Quantification of Precious Elements in Astrophyllite Mineral by Optical Spectroscopy


 , , ,
, , ,  ,
,  and
and
Abstract
:1. Introduction
2. Methodology
2.1. Study Area, Geology and Sampling
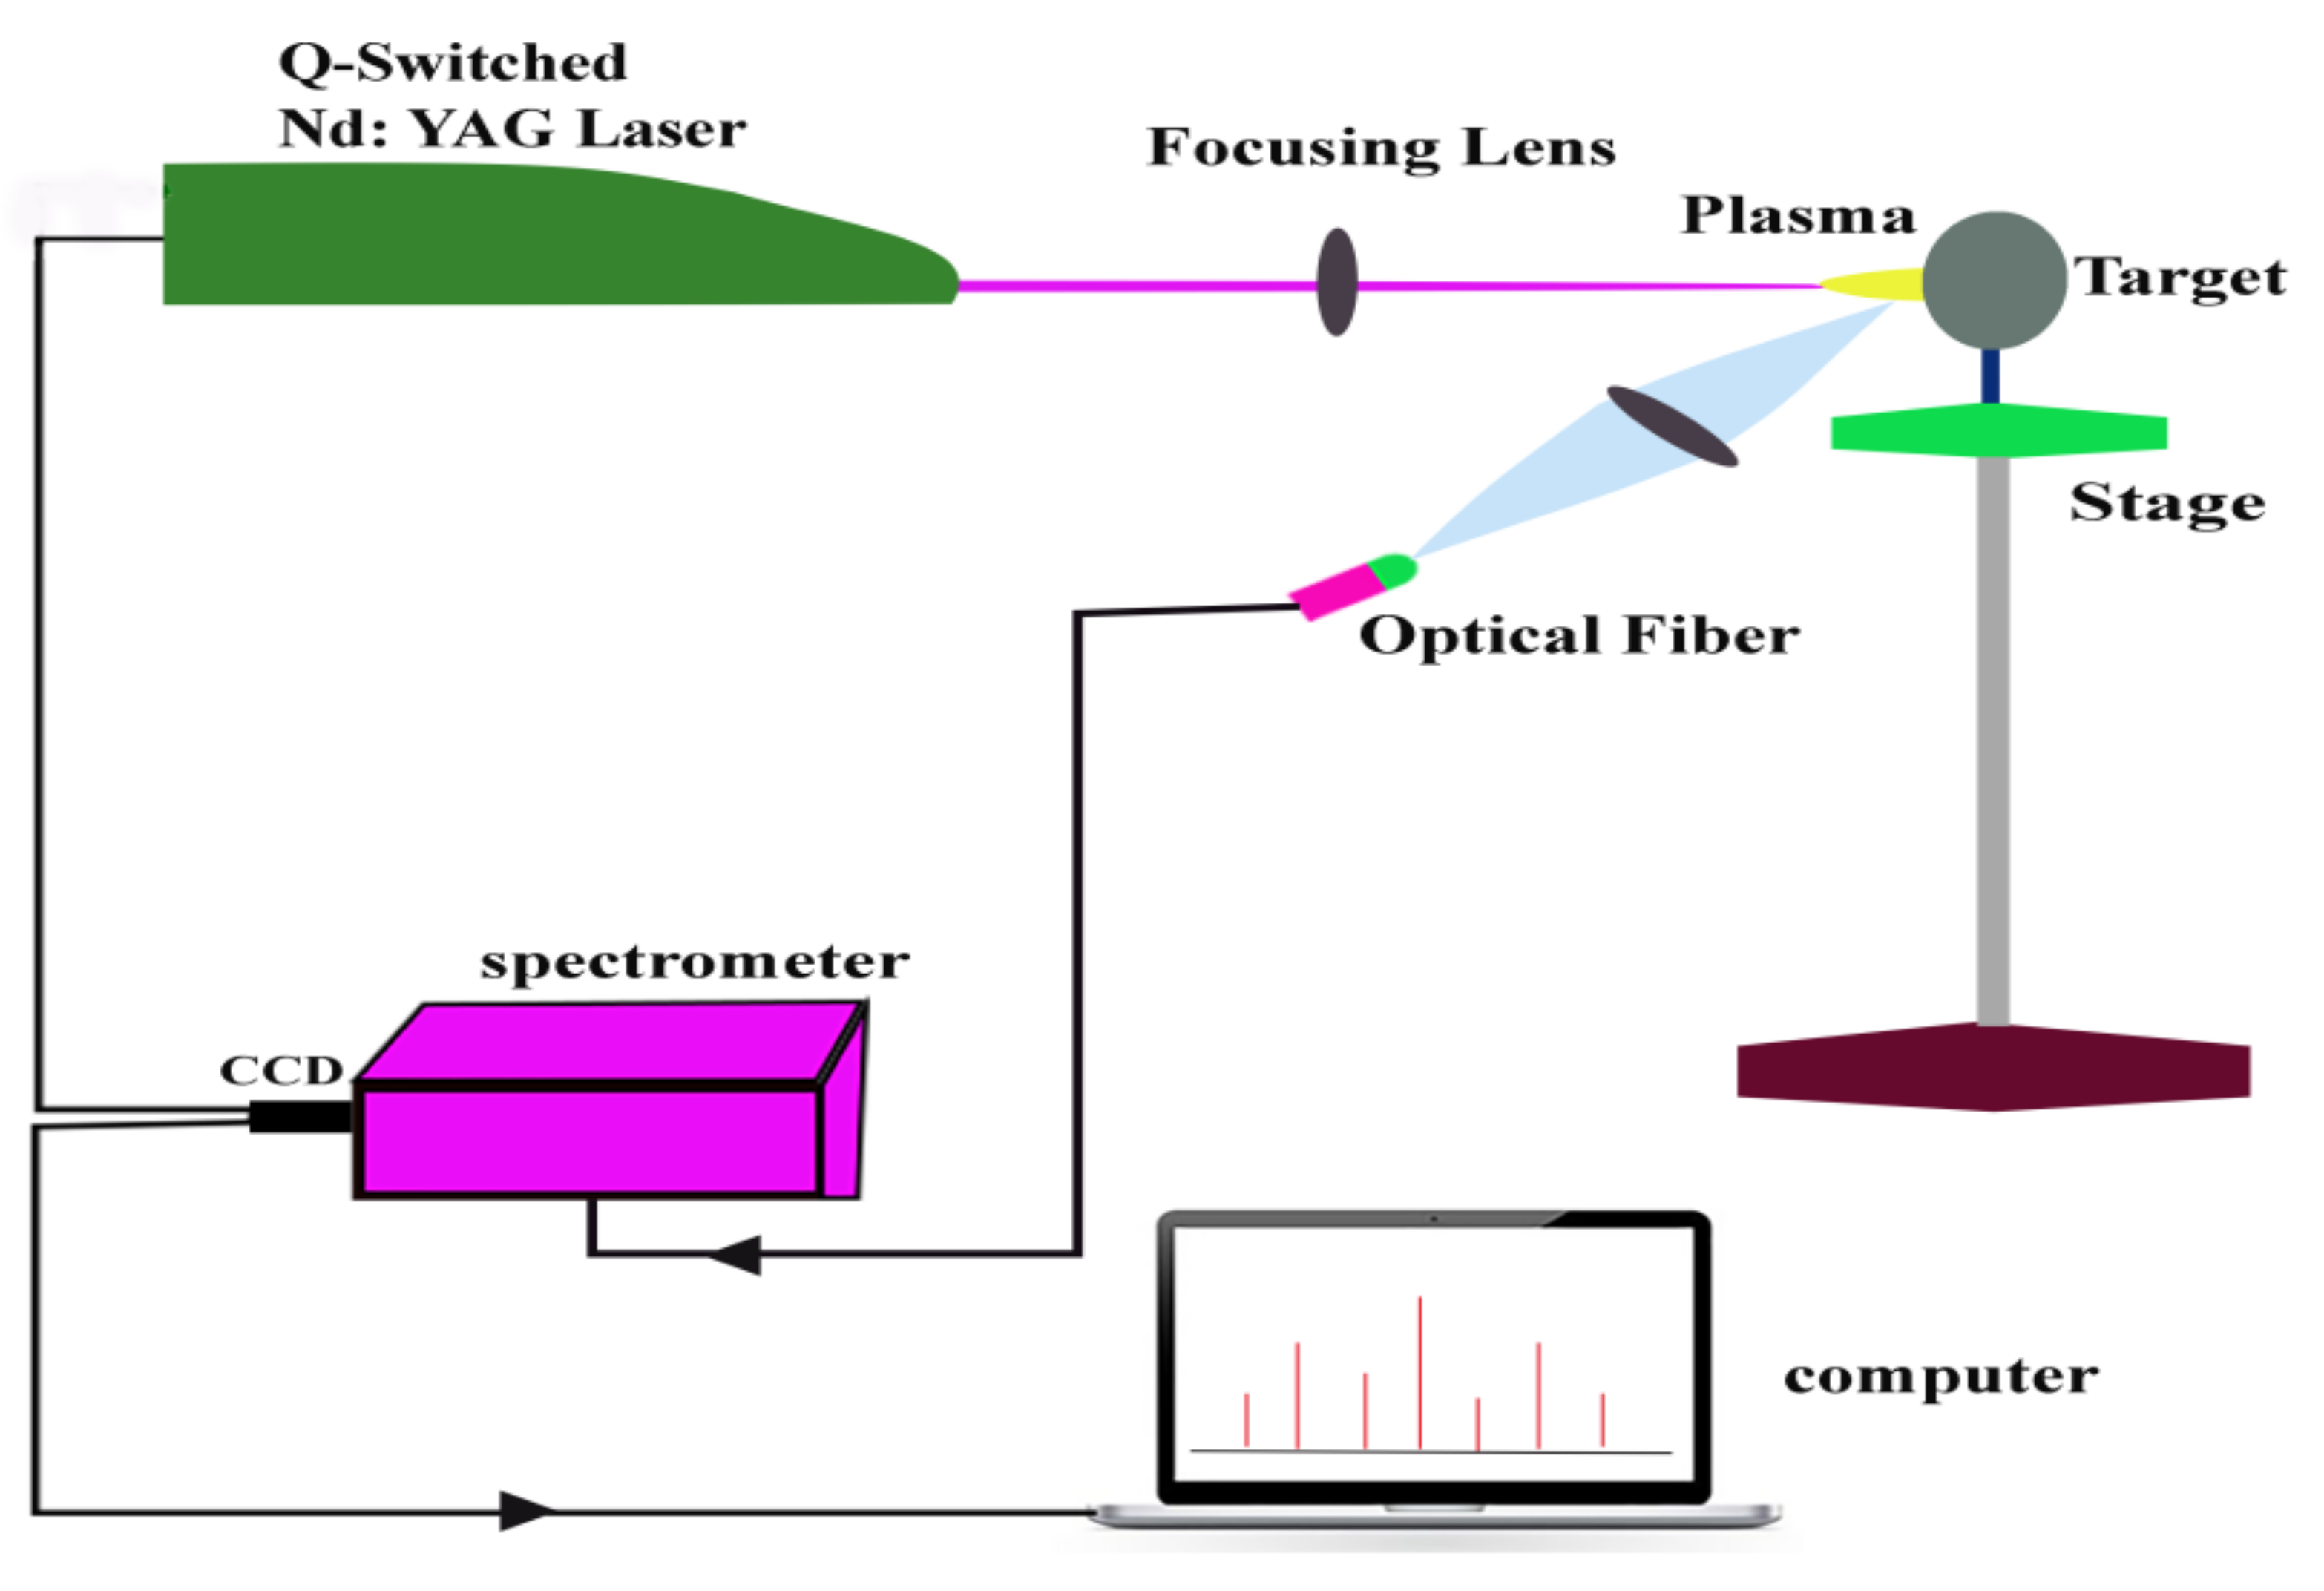
2.2. Experimental
3. Results and Discussion
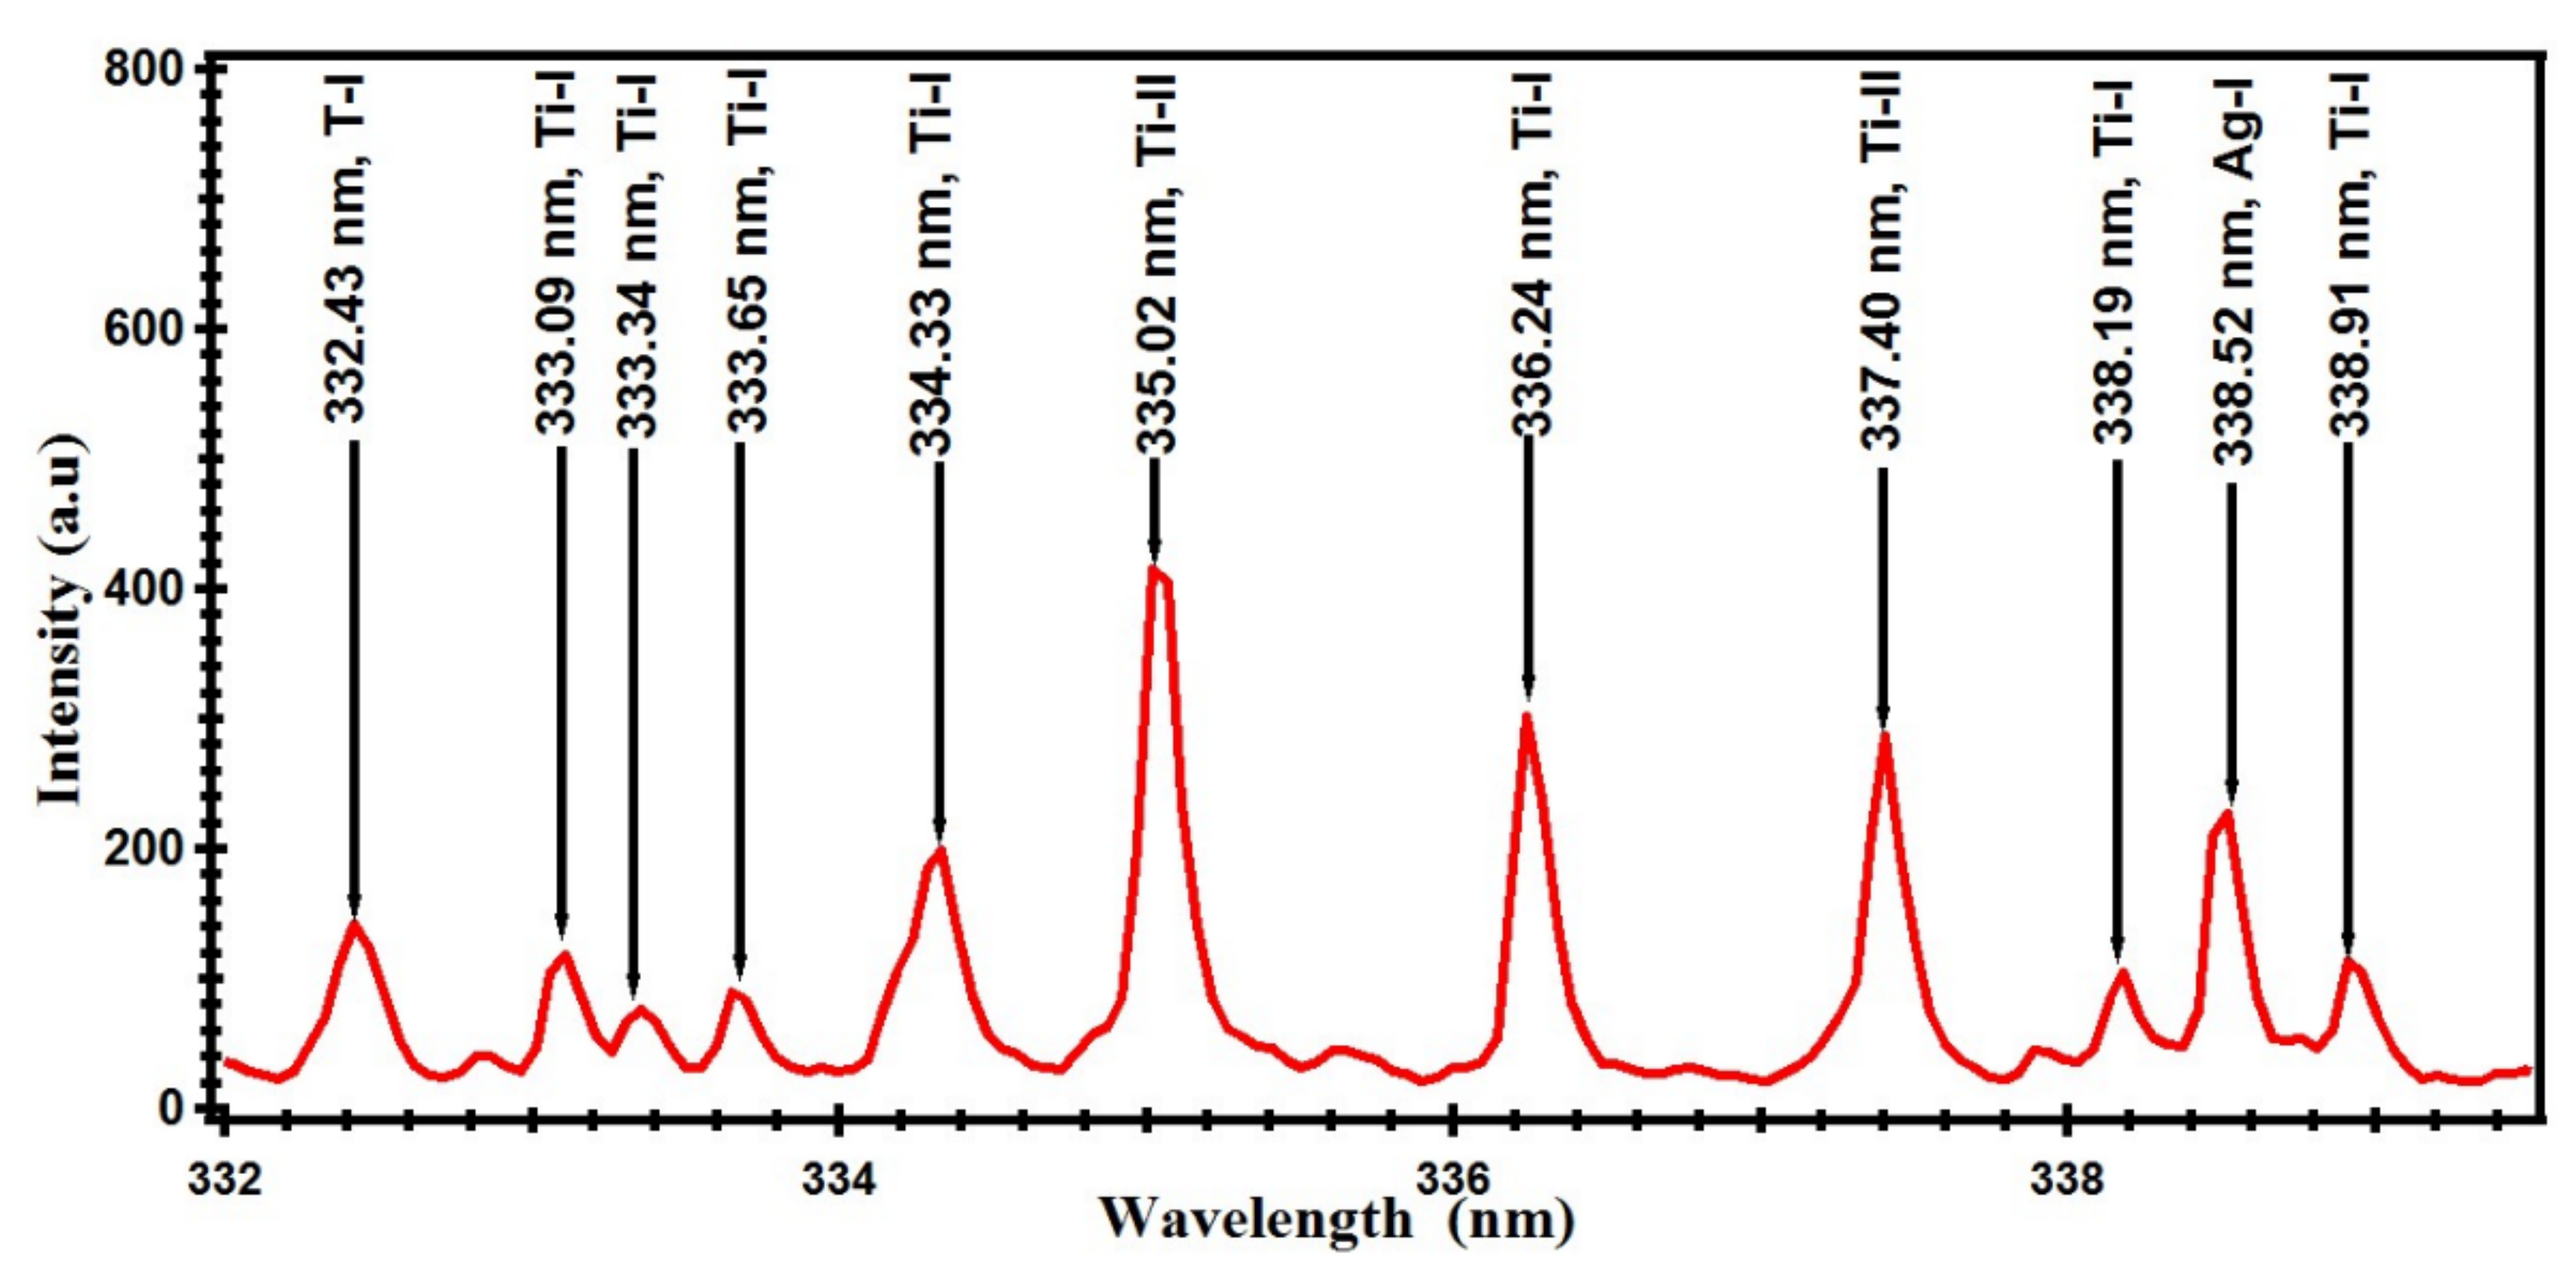
3.1. Qualitative Analysis
3.2. Quantitative Analysis
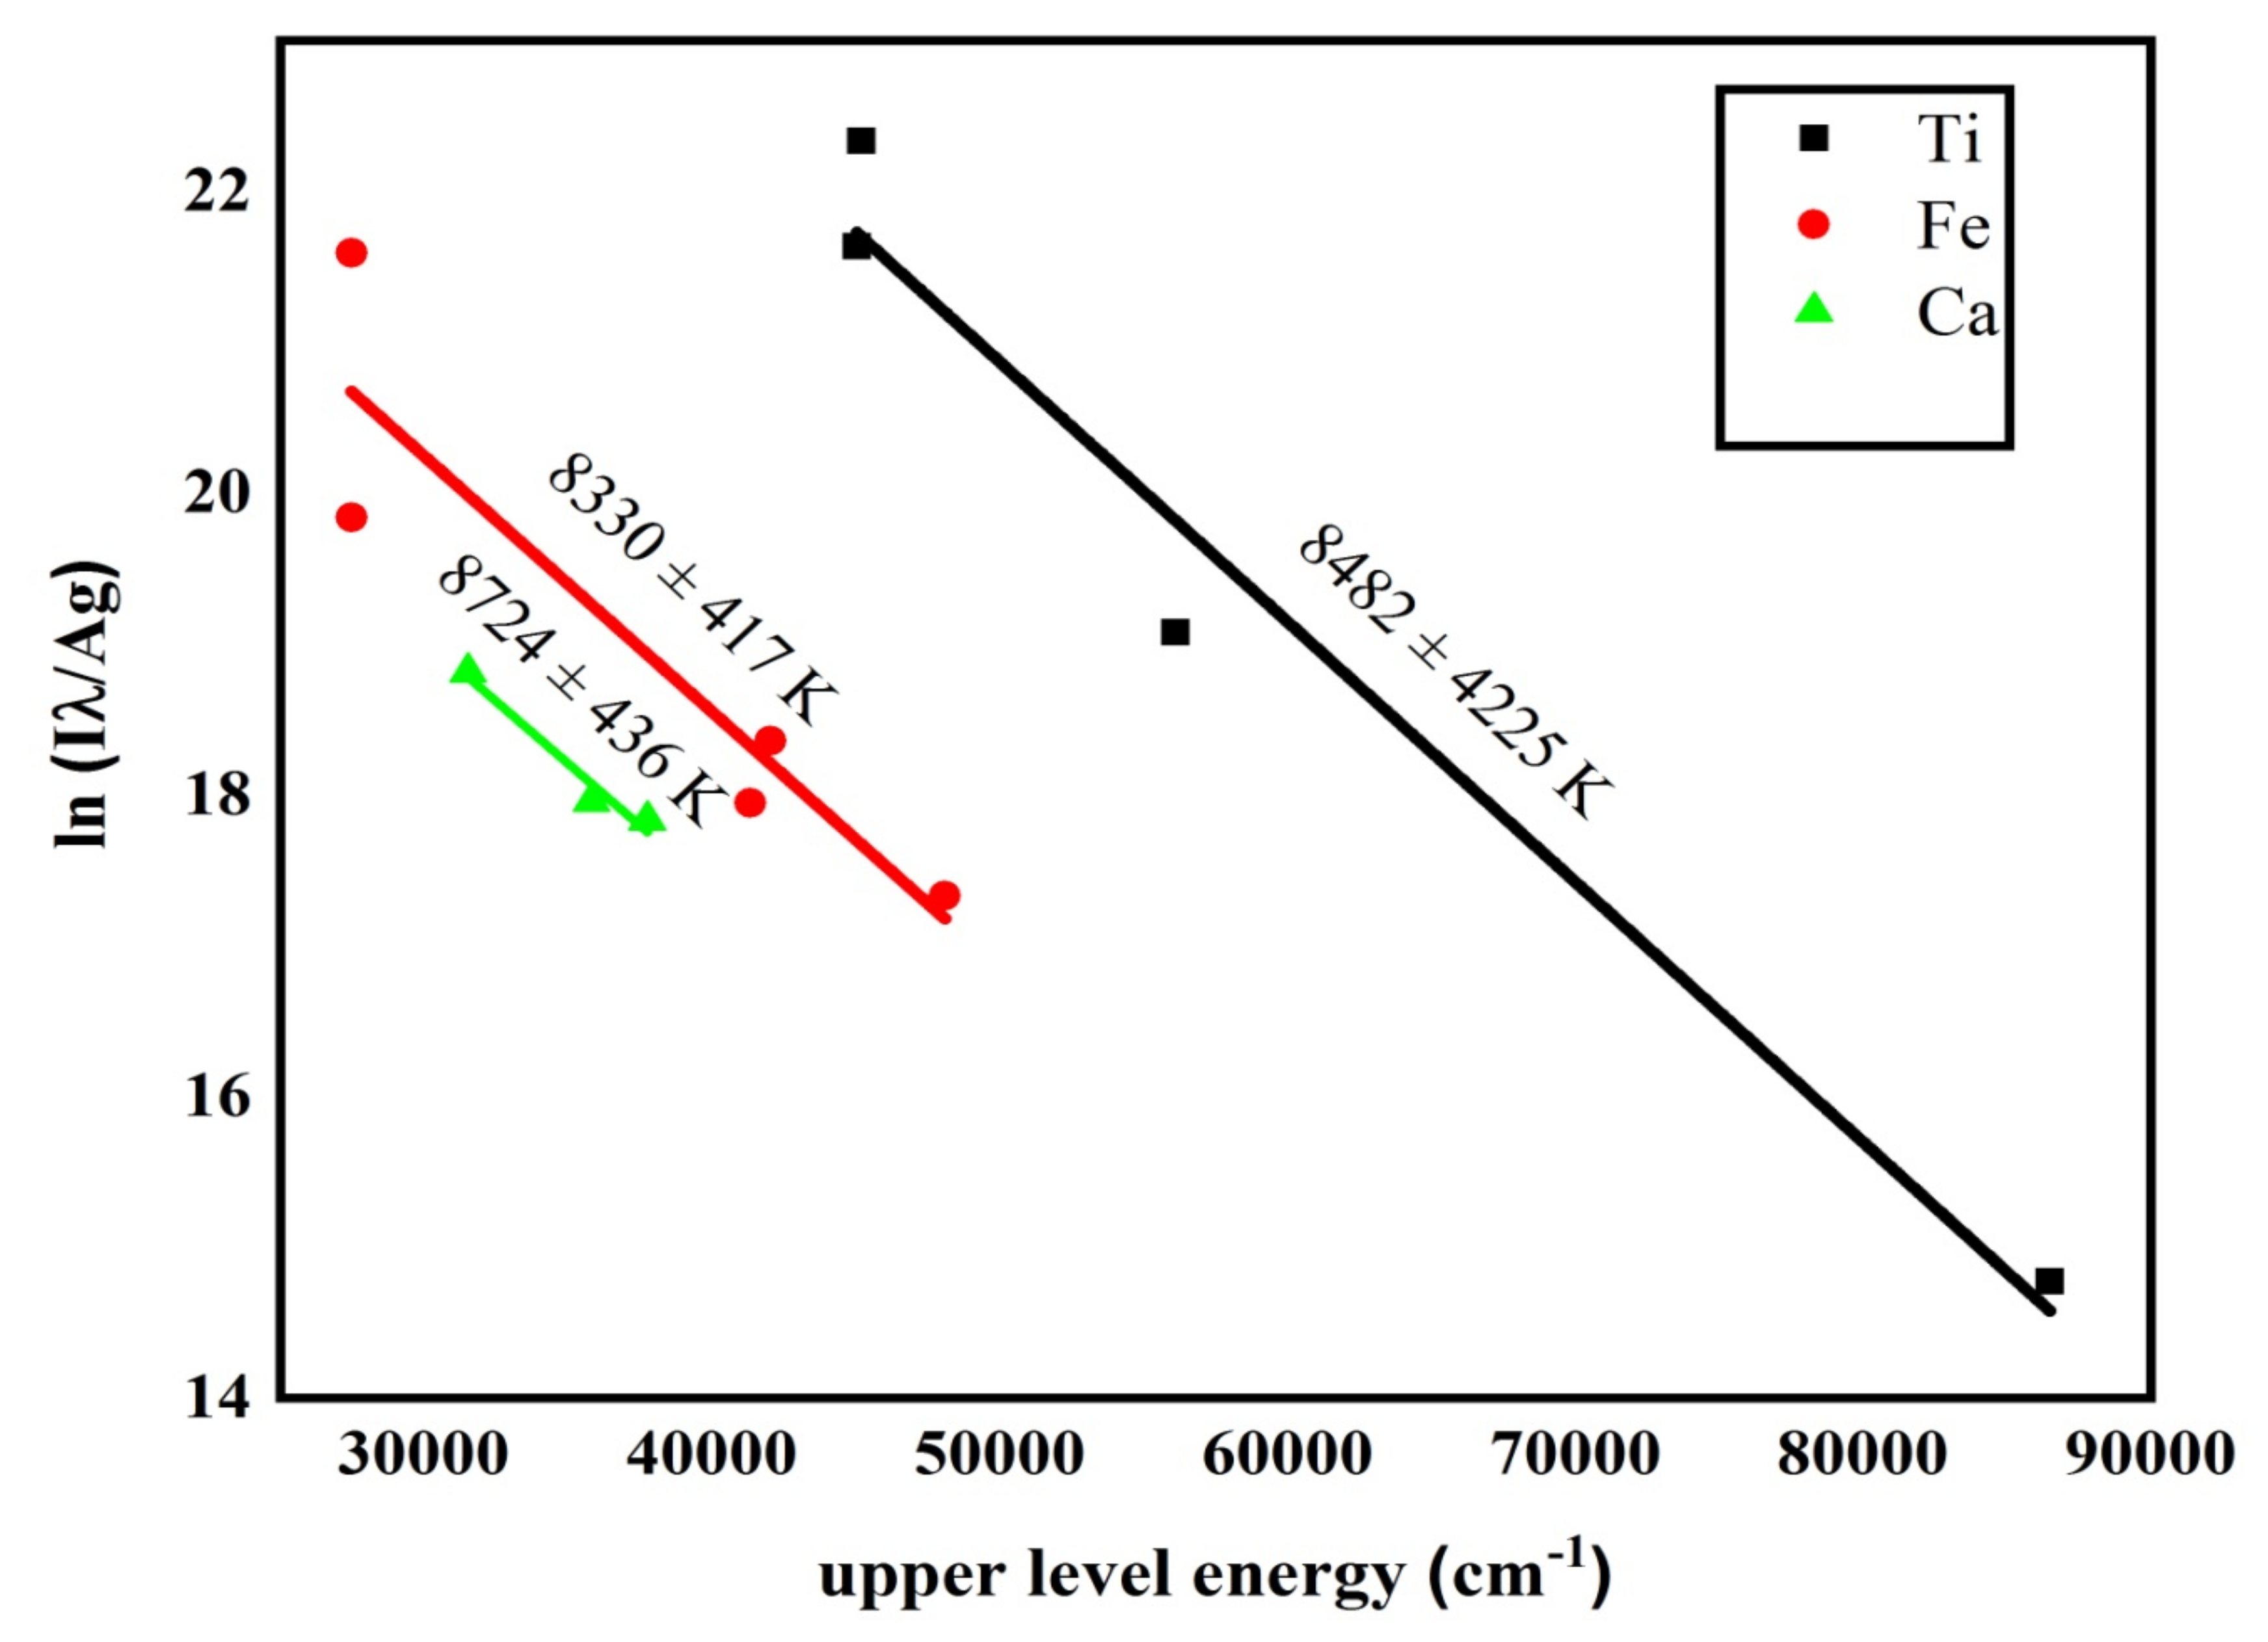
3.2.1. Electron Temperature
3.2.2. Determination of Electron Number Density
3.2.3. Validity of Local Thermodynamic Equilibrium
3.2.4. Optically Thin Plasma
3.2.5. Stoichiometric Ablation
3.2.6. Calibration-Free Analysis
4. Discussion
5. Conclusions
Author Contributions
Funding
Data Availability Statement
Acknowledgments
Conflicts of Interest
References
- Izatt, R.M.; Izatt, S.R.; Bruening, R.L.; Izatt, N.E.; Moyer, B.A. Challenges to achievement of metal sustainability in our high-tech society. Chem. Soc. Rev. 2014, 43, 2451–2475. [Google Scholar] [CrossRef]
- Sokolova, E.; Cámara, F.; Hawthorne, F.C.; Ciriotti, M.E. The astrophyllite supergroup: Nomenclature and classification. Mineral. Mag. 2017, 81, 143–153. [Google Scholar] [CrossRef]
- Sokolova, E. Further developments in the structure topology of the astrophyllite-group minerals. Mineral. Mag. 2012, 76, 863–882. [Google Scholar] [CrossRef]
- Birkett, T.C.; Trzcienski, W.E.; Stirling, J.A. Occurrence and compositions of some Ti-bearing minerals in the Strange Lake intrusive complex, Quebec-Labrador boundary. Can. Mineral. 1996, 34, 779–801. [Google Scholar]
- Piilonen, P.C.; Lalonde, A.E.; McDonald, A.M.; Gault, R.A.; Larsen, A.O. Insights into astrophyllite-group minerals. I. Nomenclature, composition and development of a standardized general formula. Can. Mineral. 2003, 41, 1–26. [Google Scholar] [CrossRef]
- Piilonen, P.C.; McDonald, A.M.; Lalonde, A.E. Insights into astrophyllite-group minerals. II. Crystal chemistry. Can. Mineral. 2003, 41, 27–54. [Google Scholar] [CrossRef]
- Csuros, M.; Csuros, C. Environmental Sampling and Analysis for Metals; CRC Press: Boca Raton, FL, USA, 2016. [Google Scholar]
- Bai, Y.; Li, S.J.; Prima, F.; Hao, Y.L.; Yang, R. Electrochemical corrosion behavior of Ti–24Nb–4Zr–8Sn alloy in a simulated physiological environment. Appl. Surf. Sci. 2012, 258, 4035–4040. [Google Scholar] [CrossRef]
- Walczak, M.; Gąska, D.; Sidor, J. Properties and application titanium and titanium alloys in aerospace systems. In Modern Techniques in Mechanical Engineering; Lublin, Poland, 1 October 2009; Świć, A., Lipski, J., Eds.; Lubelskie Towarzystwo Naukowe: Lublin, Poland, 2009; pp. 125–138. [Google Scholar]
- Patel, N.R.; Gohil, P.P. A review on biomaterials: Scope, applications & human anatomy significance. Int. J. Emerg. Technol. Adv. Eng. 2012, 2, 91–101. [Google Scholar]
- Nouri, A.; Hodgson, P.D.; Wen, C.E. Biomimetic porous titanium scaffolds for orthopaedic and dental applications. In Biomimetics Learning from Nature; Rijeka, Croatia, 1 March 2010; Mukherjee, A., Ed.; In Tech: Rijeka, Croatia, 2010; pp. 415–450. [Google Scholar]
- Noman, M.T.; Ashraf, M.A.; Ali, A. Synthesis and applications of nano-TiO 2: A review. Environ. Sci. Pollut. Res. 2019, 26, 3262–3291. [Google Scholar] [CrossRef]
- Miziolek, A.W.; Palleschi, V.; Schechter, I. Laser Induced Breakdown Spectroscopy; Cambridge University Press: Cambridge, UK, 2006. [Google Scholar]
- Hussain, T.; Gondal, M.A. Laser induced breakdown spectroscopy (LIBS) as a rapid tool for material analysis. In Journal of Physics: Conference Series; Islamabad, Pakistan, 9–13 October 2012; IOP Publishing: Bristol, UK, 2013; Volume 439, p. 012050. [Google Scholar]
- Harmon, R.S.; Remus, J.; McMillan, N.J.; McManus, C.; Collins, L.; Gottfried, J.L., Jr.; De Lucia, F.C.; Miziolek, A.W. LIBS analysis of geomaterials: Geochemical fingerprinting for the rapid analysis and discrimination of minerals. Appl. Geochem. 2009, 24, 1125–1141. [Google Scholar] [CrossRef]
- McMillan, N.J.; Harmon, R.S.; De Lucia, F.C.; Miziolek, A.M. Laser-induced breakdown spectroscopy analysis of minerals: Carbonates and silicates. Spectrochim. Acta Part B At. Spectrosc. 2007, 62, 1528–1536. [Google Scholar] [CrossRef]
- Defnet, P.A.; Wise, M.A.; Harmon, R.S.; Hark, R.R.; Hilferding, K. Analysis of Garnet by Laser-Induced Breakdown Spectroscopy—Two Practical Applications. Minerals 2021, 11, 705. [Google Scholar] [CrossRef]
- Gonzcález, A.; Ortiz, M.; Campos, J. Determination of sulfur content in steel by laser-produced plasma atomic emission spectroscopy. Appl. Spectrosc. 1995, 49, 1632–1635. [Google Scholar] [CrossRef]
- Mahmood, S.; Abbasi, S.A.; Jabeen, S.; Baig, M.A. Laser-induced breakdown spectroscopic studies of marbles. J. Quant. Spectrosc. Radiat. Transf. 2010, 111, 689–695. [Google Scholar] [CrossRef]
- Sabsabi, M.; Cielo, P. Quantitative analysis of aluminum alloys by laser-induced breakdown spectroscopy and plasma characterization. Appl. Spectrosc. 1995, 49, 499–507. [Google Scholar] [CrossRef]
- Pořízka, P.; Demidov, A.; Kaiser, J.; Keivanian, J.; Gornushkin, I.; Panne, U.; Riedel, J. Laser-induced breakdown spectroscopy for in situ qualitative and quantitative analysis of mineral ores. Spectrochim. Acta Part B At. Spectrosc. 2014, 101, 155–163. [Google Scholar] [CrossRef]
- Meng, D.; Zhao, N.; Ma, M.; Fang, L.; Gu, Y.; Jia, Y.; Liu, W. Application of a mobile laser-induced breakdown spectroscopy system to detect heavy metal elements in soil. Appl. Opt. 2017, 56, 5204–5210. [Google Scholar] [CrossRef]
- Ciucci, A.; Corsi, M.; Palleschi, V.; Rastelli, S.; Salvetti, A.; Tognoni, E. New procedure for quantitative elemental analysis by laser-induced plasma spectroscopy. Appl. Spectrosc. 1999, 53, 960–964. [Google Scholar] [CrossRef]
- De Giacomo, A.; Dell’Aglio, M.; De Pascale, O.; Gaudiuso, R.; Santagata, A.; Teghil, R. Laser Induced Breakdown Spectroscopy methodology for the analysis of copper-based-alloys used in ancient artworks. Spectrochim. Acta Part B At. Spectrosc. 2008, 63, 585–590. [Google Scholar] [CrossRef]
- Fahad, M.; Farooq, Z.; Abrar, M. Comparative study of calibration-free laser-induced breakdown spectroscopy methods for quantitative elemental analysis of quartz-bearing limestone. Appl. Opt. 2019, 58, 3501–3508. [Google Scholar] [CrossRef]
- Umar, Z.A.; Ahmed, N.; Ahmed, R.; Liaqat, U.; Baig, M.A. Elemental composition analysis of granite rocks using LIBS and LA-TOF-MS. Appl. Opt. 2018, 57, 4985–4991. [Google Scholar] [CrossRef] [PubMed]
- Abbasi, S.A.; Rafique, M.; Mir, A.A.; Kearfott, K.J.; Ud-Din Khan, S.; Ud-Din Khan, S.; Khan, T.M.; Iqbal, J. Quantification of elemental composition of Granite Gneiss collected from Neelum Valley using calibration free laser-induced breakdown and energy-dispersive X-ray spectroscopy. J. Radiat. Res. Appl. Sci. 2020, 13, 362–372. [Google Scholar] [CrossRef] [Green Version]
- Hafeez, M.; Abbasi, S.A.; Rafique, M.; Hayder, R.; Sajid, M.; Iqbal, J.; Ahmad, N.; Shahida, S. Calibration-free laser-induced breakdown spectroscopic analysis of copper-rich mineral collected from the Gilgit-Baltistan region of Pakistan. Appl. Optics. 2020, 59, 68–76. [Google Scholar] [CrossRef] [PubMed]
- Ahmad, A.; Hafeez, M.; Abbasi, S.A.; Khan, T.M.; Faruque, M.R.I.; Khandaker, M.U.; Ahmad, P.; Rafique, M.; Haleem, N. Compositional analysis of chalcopyrite using calibration-free laser-induced breakdown spectroscopy. Appl. Sci. 2020, 10, 6848. [Google Scholar] [CrossRef]
- Ahmed, N.; Ahmed, R.; Umar, Z.A.; Liaqat, U.; Manzoor, U.; Baig, M.A. Qualitative and quantitative analyses of copper ores collected from Baluchistan, Pakistan using LIBS and LA-TOF-MS. Appl. Phys. B 2018, 124, 160–170. [Google Scholar] [CrossRef]
- Harmon, R.S.; Lawley, C.J.; Watts, J.; Harraden, C.L.; Somers, A.M.; & Hark, R.R. Laser-induced breakdown spectroscopy—An emerging analytical tool for mineral exploration. Minerals 2019, 9, 718. [Google Scholar] [CrossRef] [Green Version]
- Dell’Aglio, M.; De Giacomo, A.; Gaudiuso, R.; De Pascale, O.; Senesi, G.S.; Longo, S. Laser Induced Breakdown Spectroscopy applications to meteorites: Chemical analysis and composition profiles. Geochim. Cosmochim. Acta 2010, 74, 7329–7339. [Google Scholar] [CrossRef]
- Khanal, S.; Robinson, D.M.; Kohn, M.J.; Mandal, S. Evidence for a far-traveled thrust sheet in the Greater Himalayan thrust system, and an alternative model to building the Himalaya. Tectonics 2015, 34, 31–52. [Google Scholar] [CrossRef]
- Wu, F.Y.; Yang, J.H.; Lo, C.H.; Wilde, S.A.; Sun, D.Y.; Jahn, B.M. The Heilongjiang Group: A Jurassic accretionary complex in the Jiamusi Massif at the western Pacific margin of northeastern China. Isl. Arc 2007, 16, 156–172. [Google Scholar] [CrossRef]
- Ahmed, N.; Farooq, K.; Shahida, S.; Haq, K.; Abbasi, S.A.; Umar, Z.A.; Ahmed, R.; Baig, M.A. Spectro-chemical analysis of Pakistani bakery breads using laser induced breakdown spectroscopy. Opt. Int. J. Light Electron Opt. 2021, 226, 165743–165748. [Google Scholar] [CrossRef]
- Abbasi, S.A.; Rafique, M.; Khan, T.M.; Khan, A.; Ahmad, N.; Faruque, M.R.I.; Khandaker, M.U.; Ahmad, P.; Saboor, A. Chemical Analysis of Thermoluminescent Colorless Topaz Crystal Using Laser-Induced Breakdown Spectroscopy. Minerals 2021, 11, 367–383. [Google Scholar] [CrossRef]
- Akhtar, M.; Jabbar, A.; Mehmood, S.; Ahmed, N.; Ahmed, R.; Baig, M.A. Magnetic field enhanced detection of heavy metals in soil using laser induced breakdown spectroscopy. Spectrochim. Acta Part B 2018, 148, 143–151. [Google Scholar] [CrossRef]
- National Institute of Standards and Technology. NIST Atomic Spectra Database Lines Form. Available online: https://physics.nist.gov/PhysRefData/ASD/lines_form.html (accessed on 10 July 2021).
- Hahn, D.W.; Omenetto, N. Laser-induced breakdown spectroscopy (LIBS), part II: Review of instrumental and methodological approaches to material analysis and applications to different fields. Appl. Spectrosc. 2012, 66, 347–419. [Google Scholar] [CrossRef]
- El-Faham, M.M.; Okil, M.; Mostafa, A.M. Limit of detection and hardness evaluation of some steel alloys utilizing optical emission spectroscopic techniques. Opt. Laser Technol. 2018, 108, 634–641. [Google Scholar] [CrossRef]
- Garcia, C.C.; Lindner, H.; von Bohlen, A.; Vadla, C.; Niemax, K. Elemental fractionation and stoichiometric sampling in femtosecond laser ablation. J. Anal. At. Spectrom. 2008, 23, 470–478. [Google Scholar] [CrossRef]
- Zeng, X.; Mao, S.S.; Liu, C.; Mao, X.; Greif, R.; Russo, R.E. Plasma diagnostics during laser ablation in a cavity. Spectrochim. Acta Part B At. Spectrosc. 2003, 58, 867–877. [Google Scholar] [CrossRef]
- Colon, C.; Hatem, G.; Verdugo, E.; Ruiz, P.; Campos, J. Measurement of the Stark broadening and shift parameters for several ultraviolet lines of singly ionized aluminum. J. Appl. Phys. 1993, 73, 4752–4758. [Google Scholar] [CrossRef]
- Griem, H.R. Stark Broadening Parameters for Neutral and Singly Charged Ions: Helium through Calcium and Cesium. Available online: https://griem.obspm.fr/ (accessed on 12 August 2021).
- Aguilera, J.A.; Aragón, C. A comparison of the temperatures and electron densities of laser-produced plasmas obtained in air, argon, and helium at atmospheric pressure. Appl. Phys. A 1999, 69, S475–S478. [Google Scholar] [CrossRef]
- Unnikrishnan, V.K.; Alti, K.; Kartha, V.B.; Santhosh, C.; Gupta, G.P.; Suri, B.M. Measurements of plasma temperature and electron density in laser-induced copper plasma by time-resolved spectroscopy of neutral atom and ion emissions. Pramana 2010, 74, 983–993. [Google Scholar] [CrossRef]
- Chan, W.T.; Russo, R.E. Study of laser-material interactions using inductively coupled plasma-atomic emission spectrometry. Spectrochim. Acta Part B At. Spectrosc. 1991, 46, 1471–1486. [Google Scholar] [CrossRef]
- Ahmed, N.; Ahmed, R.; Baig, M.A. Analytical Analysis of Different Karats of Gold Using Laser Induced Breakdown Spectroscopy (LIBS) and Laser Ablation Time of Flight Mass Spectrometer (LA-TOF-MS). Plasma Chem. Plasma Process. 2017, 38, 207–222. [Google Scholar] [CrossRef]
- Ahmed, N.; Ahmed, R.; Rafiqe, M.; Baig, M.A. A comparative study of Cu-Ni alloy using LIBS, LA-TOF, EDX, and XRF. Laser Part Beams 2017, 35, 1–9. [Google Scholar] [CrossRef]
- Yin, R.; Han, L.; Huang, X.L.; Li, J.; Li, W.X.; CHen, L.L. Textural and chemical variations of micas as indicators for tungsten mineralization: Evidence from highly evolved granites in the Dahutang tungsten deposit, South China. Am. Mineral. J. Earth Planet. Mater. 2019, 104, 949–965. [Google Scholar] [CrossRef]
- Mughal, M.S.; Zhang, C.; Du, D.; Zhang, L.; Mustafa, S.; Hameed, F.; Khan, M.R.; Zaheer, M.; Blaise, D. Petrography and provenance of the Early Miocene Murree Formation, Himalayan Foreland Basin, Muzaffarabad, Pakistan. J. Asian Earth Sci. 2018, 162, 25–40. [Google Scholar] [CrossRef]


| Element | Wavelength (nm) |
|---|---|
| Ag-I | 328.06 |
| Ag-II | 241.1,243.56, 274.39, 338.52 |
| Al-I | 305.97, 306.79, 396.67 |
| Al-II | 465.92 |
| Ba-I | 307.43, 350.1, 493.67, 553.54 |
| Ba-II | 455.2,455.63, 614.18, 649.81 |
| Ca_I | 393.59, 397.06, 442.92, 443.77, 445.33, 527.08, 558.86, 612.14, 616.22, 644.05, 646.33 |
| Cr-I | 425.34, 426.34, 427.48, 428.54, 476.42 |
| Cu-I | 324.93, 327.54, 515.34, 521.11 |
| Cu-II | 626.18,644.12 |
| Fe-I | 275.63, 309.10, 319, 372.17, 373.89, 374.33, 374.53, 375.11, 381.74, 382.19, 382.74, 383.6, 383.99, 384.25, 385.78, 386.13, 387.99, 388.43, 388.76,394.12,404.38,428.81, 438.46, 440.75,452.65, 456.65, 467.32, 490.77, 691.68 |
| Fe-II | 238.25, 240.55, 258.63, 259.97, 261.24, 274.03, 274.74, 275, 365.55, 327.37, 406.61, 431.77,439.77, 441.99, 444.64, 452.02, 500.22, 522.34, 506.78, 519.37 693.2 |
| Li-I | 610.35, 670.91 |
| Mg-I | 285.25, 516.84, 517.43, 518.44, 518.96 |
| Mg-II | 279.6, 280, 280.33 |
| Na-I | 588.98, 589.58 |
| Ni-I | 239.45, 344.43, 345.83, 346.35, 349.31, 351.2, 352.2, 352.82, 356.73, 357.17, 498.46, 499.37 |
| Ni-II | 239.45, |
| Si-I | 250.78, 251.65, 252.97, 263.15, 288.22 |
| Ti-I | 307.68, 317, 323.04, 326.29, 332.43, 333.09, 333.65, 334.33, 336.24, 338.19, 338.91, 362.69, 363.33, 363.74, 364.41, 366.19, 366.4, 376.28, 399.2, 414.5, 416.63, 417.4, 430.85, 431.05,445.74, 449.61 451.27, 452.27, 453.47,461.95, 464.51, 468.19, 484.08, 488.87, 500.22, 500.96, 501.02, 503.88 |
| Ti-II | 308.37, 308.94, 311.76, 316.52, 320.6, 323.59, 323.76,325, 325.4, 328.85, 335.02, 337.40, 344.61, 364.95, 368.64, 376.06,447.08, 448.83 450.12, 462.51, 476.36, 487.4, |
| W-I | 256.33, 272.82, 321.85, 322.42,375.56,382.81, 398.45, 400.14, 407.5, 429.33, 429.66, 432.84, 485.85, 446.01, 445.88, 449.17, 453.48, 551.41, 586.46 |
| W-II | 255.02,333.32, 408.12, 430.33 |
| Wavelength λ (nm) | Transitions | Statistical Weight | Transition Probability A (s−1) | Upper Level Energy Ek (cm−1) | |
|---|---|---|---|---|---|
| Ti (I) 323.59 | 3d2(3F)4s4p(3P°)→3d24s(4F)5d | 13 | 11 | 5.96 × 10⁷ | 48,106.65 |
| Ti (I) 338.19 | 3d3(4F)4s→3d3(2H)4p | 11 | 9 | 1.37 × 10⁷ | 41,341.54 |
| Ti (I) 363.74 | 3d24s2→3d2(1D)4s4p(3P°) | 7 | 5 | 9.3 × 10⁵ | 27,480.06 |
| Ti (I) 368.64 | 3d24s2→3d2(3F)4s4p(1P°) | 7 | 9 | 3.68 × 10⁵ | 27,498.98 |
| Ti (I) 400.14 | 3d2(3F)4s4p(3P°)→3d24s(4F)4d | 7 | 9 | 1.36 × 10⁷ | 42,052.77 |
| Ca (I) 445.33 | 3p64s4p→3p64s4d | 7 | 5 | 8.70 × 10⁷ | 37,757.44 |
| Ca (I) 612.14 | 3p64s4p→3p64s5s | 3 | 3 | 2.87 × 10⁷ | 31,539.49 |
| Ca (I) 646.33 | 3p63d4s→3p63d4p | 7 | 5 | 4.70 × 10⁷ | 35,818.71 |
| Fe (I) 240.55 | 3d6(1F)4s→3d6(1F)4p | 8 | 8 | 2.46 × 10⁸ | 86,482.56 |
| Fe (I) 373.86 | 3d64s2→3d6(3G)4s4p(3P°) | 7 | 5 | 3.44 × 10⁷ | 56,097.83 |
| Fe (I) 438.62 | 3d6(3P2)4s→3d6(5D)4p | 2 | 2 | 4.5 × 10⁵ | 45,206.47 |
| Fe (I) 441.77 | 3d6(3P2)4s→3d6(5D)4p | 4 | 2 | 2.1 × 10⁵ | 45,044.19 |
| Elements | Spectral Line Wavelength (nm) | |
|---|---|---|
| Ca-I | 616.22 646.33 | |
| Si-I | 251.65 288.18 |
| Element. | Transition Probability | Upper Level Statistical Weight (gk) | Lower Level Statistical Weight (gi) | Upper Level Energy Ek cm−1 | |
|---|---|---|---|---|---|
| Cr-I | 426.34 | 6.41 × 10⁷ | 17 | 15 | 54,498.25 |
| Cr-I | 428.87 | 2.80 × 10⁶ | 5 | 5 | 47,631.67 |
| Cr-I | 476.42 | 1.7 × 10⁷ | 9 | 7 | 49,620.56 |
| Cu-I | 515.34 | 6.00 × 10⁷ | 4 | 2 | 49,935.19 |
| Cu-I | 521.11 | 7.50 × 10⁷ | 4 | 6 | 63,584.65 |
| Fe-I | 319.00 | 3.07 × 10⁷ | 7 | 5 | 51,219.01 |
| Fe-I | 372.17 | 1.94 × 10⁷ | 5 | 5 | 51,370.14 |
| Fe-I | 373.89 | 3.44 × 10⁷ | 7 | 5 | 56,097.83 |
| Fe-I | 374.53 | 1.15 × 10⁷ | 5 | 7 | 52,916.29 |
| Fe-I | 381.74 | 4.16 × 10⁶ | 7 | 5 | 43,922.66 |
| Fe-I | 382.19 | 1.56 × 10⁶ | 11 | 11 | 47,834.55 |
| Fe-I | 383.6 | 3.29 × 10⁷ | 5 | 5 | 52,682.92 |
| Fe-I | 383.99 | 4.70 × 10⁷ | 4 | 5 | 34,017.10 |
| Fe-I | 385.78 | 7.25 × 10⁶ | 11 | 13 | 43,294.84 |
| Fe-I | 387.99 | 5.34 × 10⁷ | 3 | 3 | 52,180.82 |
| Fe-I | 394.12 | 9.10 × 10⁶ | 5 | 5 | 51,705.01 |
| Fe-I | 456.05 | 4.48 × 10⁵ | 3 | 5 | 48,516.13 |
| Ti-I | 338.91 | 7.71 × 10⁶ | 5 | 7 | 48,915.03 |
| Ti-I | 366.19 | 2.4 × 10⁷ | 7 | 7 | 45,893.19 |
| Ti-I | 366.4 | 2.45 × 10⁷ | 8 | 6 | 74,910.87 |
| Ti-I | 399.2 | 3.55 × 10⁶ | 1 | 3 | 41,871.36 |
| Ti-I | 488.87 | 1.34 × 10⁷ | 5 | 5 | 46,943.91 |
| Ti-I | 500.22 | 3.65 × 10⁷ | 3 | 5 | 45,093.22 |
| W-I | 256.33 | 1.14 × 10⁷ | 6 | 6 | 50,292.35 |
| W-I | 272.82 | 1.77 × 10⁷ | 5 | 7 | 55,619.66 |
| W-I | 321.85 | 3.0 × 10⁶ | 5 | 3 | 44,367.50 |
| W-I | 375.56 | 2.7 × 10⁶ | 9 | 7 | 54,911.61 |
| W-I | 398.45 | 1.39 × 10⁷ | 3 | 5 | 43,217.33 |
| W-I | 407.47 | 1.0 × 10⁷ | 7 | 7 | 27,488.11 |
| W-I | 446.01 | 2.93 × 10⁶ | 3 | 5 | 36,190.49 |
| Ca-I | 397.06 | 1.75 × 10⁷ | 3 | 5 | 40,474.24 |
| Ca-I | 445.33 | 8.7 × 10⁷ | 7 | 5 | 37,757.50 |
| Ca-I | 527.08 | 5.0 × 10⁷ | 5 | 7 | 39,340.08 |
| Ca-I | 558.86 | 4.9 × 10⁷ | 7 | 7 | 38,259.12 |
| Ca-I | 612.14 | 2.87 × 10⁷ | 3 | 3 | 31,539.50 |
| Ca-I | 616.22 | 4.77 × 10⁷ | 3 | 5 | 31,539.50 |
| Ca-I | 646.33 | 4.7 × 10⁷ | 7 | 5 | 35,818.71 |
| Mg-I | 516.84 | 1.13 × 10⁷ | 3 | 1 | 41,197.40 |
| Mg-I | 517.43 | 3.7 × 10⁷ | 3 | 3 | 41,197.40 |
| Mg-I | 518.96 | 5.61 × 10⁷ | 3 | 5 | 41,197.40 |
| Si-I | 263.15 | 1.06 × 10⁸ | 3 | 1 | 53,387.33 |
| Si-I | 288.22 | 2.17 × 10⁸ | 3 | 5 | 40,991.88 |
| Al-I | 309.28 | 1.16 × 10⁷ | 4 | 4 | 32,435.45 |
| Al-I | 396.15 | 9.85 × 10⁷ | 4 | 2 | 25,347.756 |
| Element. | LIBS (wt.% Age) | XRF (wt.% Age) | Percentage Error (%) |
|---|---|---|---|
| Ti | 55.39 | 51.34 | 7.89 |
| W | 18.79 | 22.20 | 15.36 |
| Fe | 18.30 | 15.51 | 17.98 |
| Cr | 4.05 | 3.48 | 16.38 |
| Cu | 2.66 | 3.82 | 30.37 |
| Ca | 0.43 | 1.22 | 64.75 |
| Mg | 0.18 | 1.12 | 83.93 |
| Ni | 0.11 | 0.78 | 84.61 |
| Si | 0.06 | 0.36 | 83.33 |
| Al | 0.02 | 0.17 | 88.23 |
Publisher’s Note: MDPI stays neutral with regard to jurisdictional claims in published maps and institutional affiliations. |
© 2021 by the authors. Licensee MDPI, Basel, Switzerland. This article is an open access article distributed under the terms and conditions of the Creative Commons Attribution (CC BY) license (https://creativecommons.org/licenses/by/4.0/).
Share and Cite
Ahmad, A.; Abbasi, S.A.; Hafeez, M.; Khan, T.M.; Rafique, M.; Ahmed, N.; Ahmad, P.; Faruque, M.R.I.; Khandaker, M.U.; Javed, M. Detection and Quantification of Precious Elements in Astrophyllite Mineral by Optical Spectroscopy. Materials 2021, 14, 6277. https://doi.org/10.3390/ma14216277
Ahmad A, Abbasi SA, Hafeez M, Khan TM, Rafique M, Ahmed N, Ahmad P, Faruque MRI, Khandaker MU, Javed M. Detection and Quantification of Precious Elements in Astrophyllite Mineral by Optical Spectroscopy. Materials. 2021; 14(21):6277. https://doi.org/10.3390/ma14216277
Chicago/Turabian StyleAhmad, Altaf, Shahab Ahmed Abbasi, Muhammad Hafeez, Taj Muhammad Khan, Muhammad Rafique, Nasar Ahmed, Pervaiz Ahmad, Mohammad Rashed Iqbal Faruque, Mayeen Uddin Khandaker, and Muhammad Javed. 2021. "Detection and Quantification of Precious Elements in Astrophyllite Mineral by Optical Spectroscopy" Materials 14, no. 21: 6277. https://doi.org/10.3390/ma14216277
APA StyleAhmad, A., Abbasi, S. A., Hafeez, M., Khan, T. M., Rafique, M., Ahmed, N., Ahmad, P., Faruque, M. R. I., Khandaker, M. U., & Javed, M. (2021). Detection and Quantification of Precious Elements in Astrophyllite Mineral by Optical Spectroscopy. Materials, 14(21), 6277. https://doi.org/10.3390/ma14216277