Author Contributions
Conceptualization, P.Č. and T.P.; methodology, N.P.; software, N.P.; validation, D.S., J.K. and P.S.; formal analysis, K.Č.; investigation, P.Č. and T.P.; resources, K.Č. and P.Š.; data curation, N.P. and D.S.; writing—original draft preparation, P.Č., T.P., N.P. and R.M.; writing—review and editing, T.P.; visualization, N.P. and P.Č; supervision, D.S.; project administration, Ş.Ţ.; funding acquisition, Ş.Ţ. All authors have read and agreed to the published version of the manuscript.
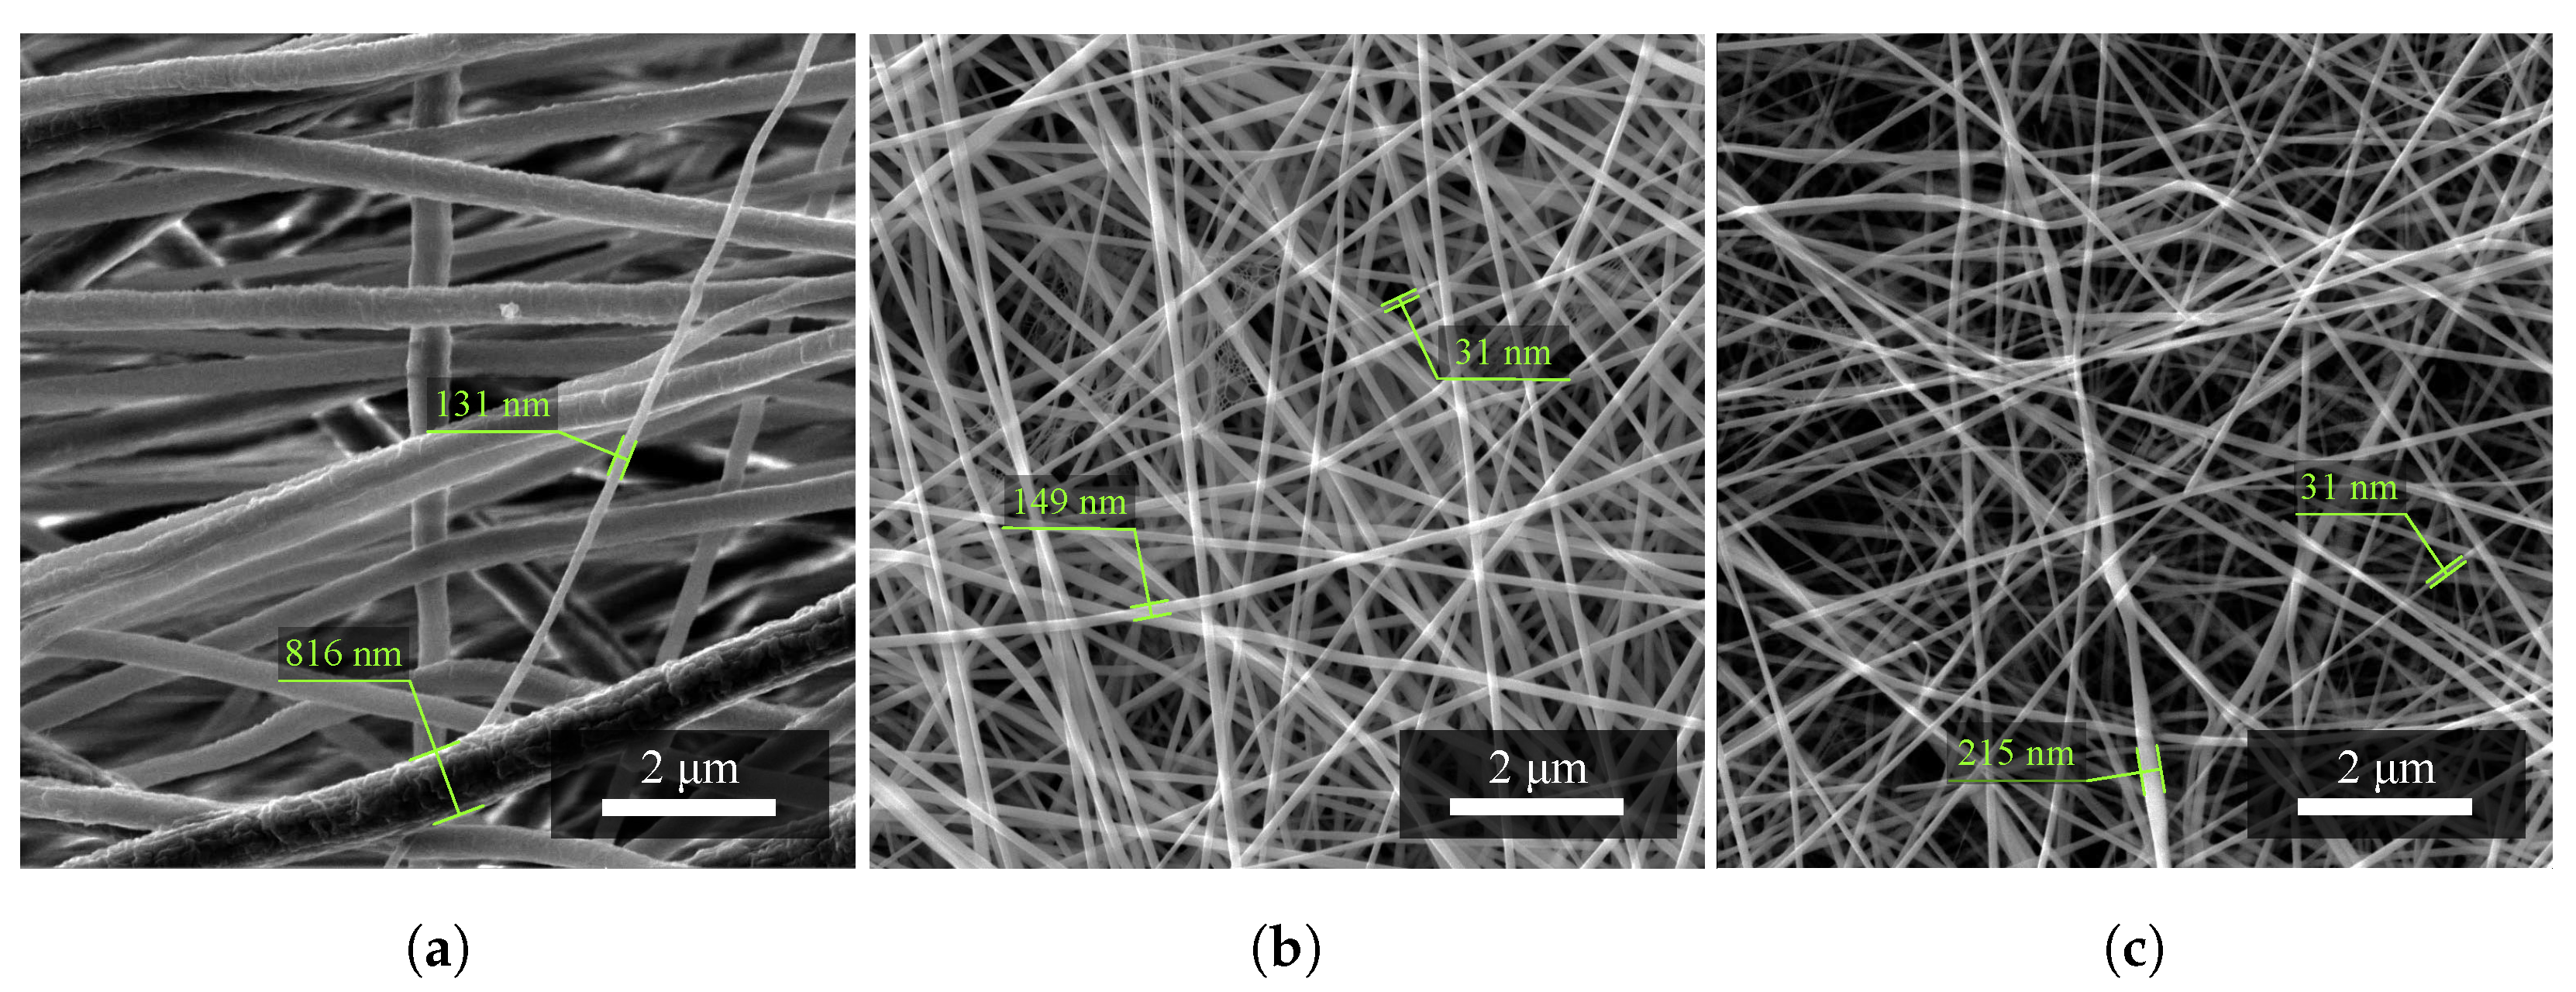
Figure 1.
Investigation of the diameter of nanofibers of (a) PVDF material, (b) the combination of PVDF/PA6, and (c) PA6. Fibers of different sizes were randomly selected. Measurement parameters: acceleration voltage 5 kV, magnification 27.7 k×.
Figure 1.
Investigation of the diameter of nanofibers of (a) PVDF material, (b) the combination of PVDF/PA6, and (c) PA6. Fibers of different sizes were randomly selected. Measurement parameters: acceleration voltage 5 kV, magnification 27.7 k×.
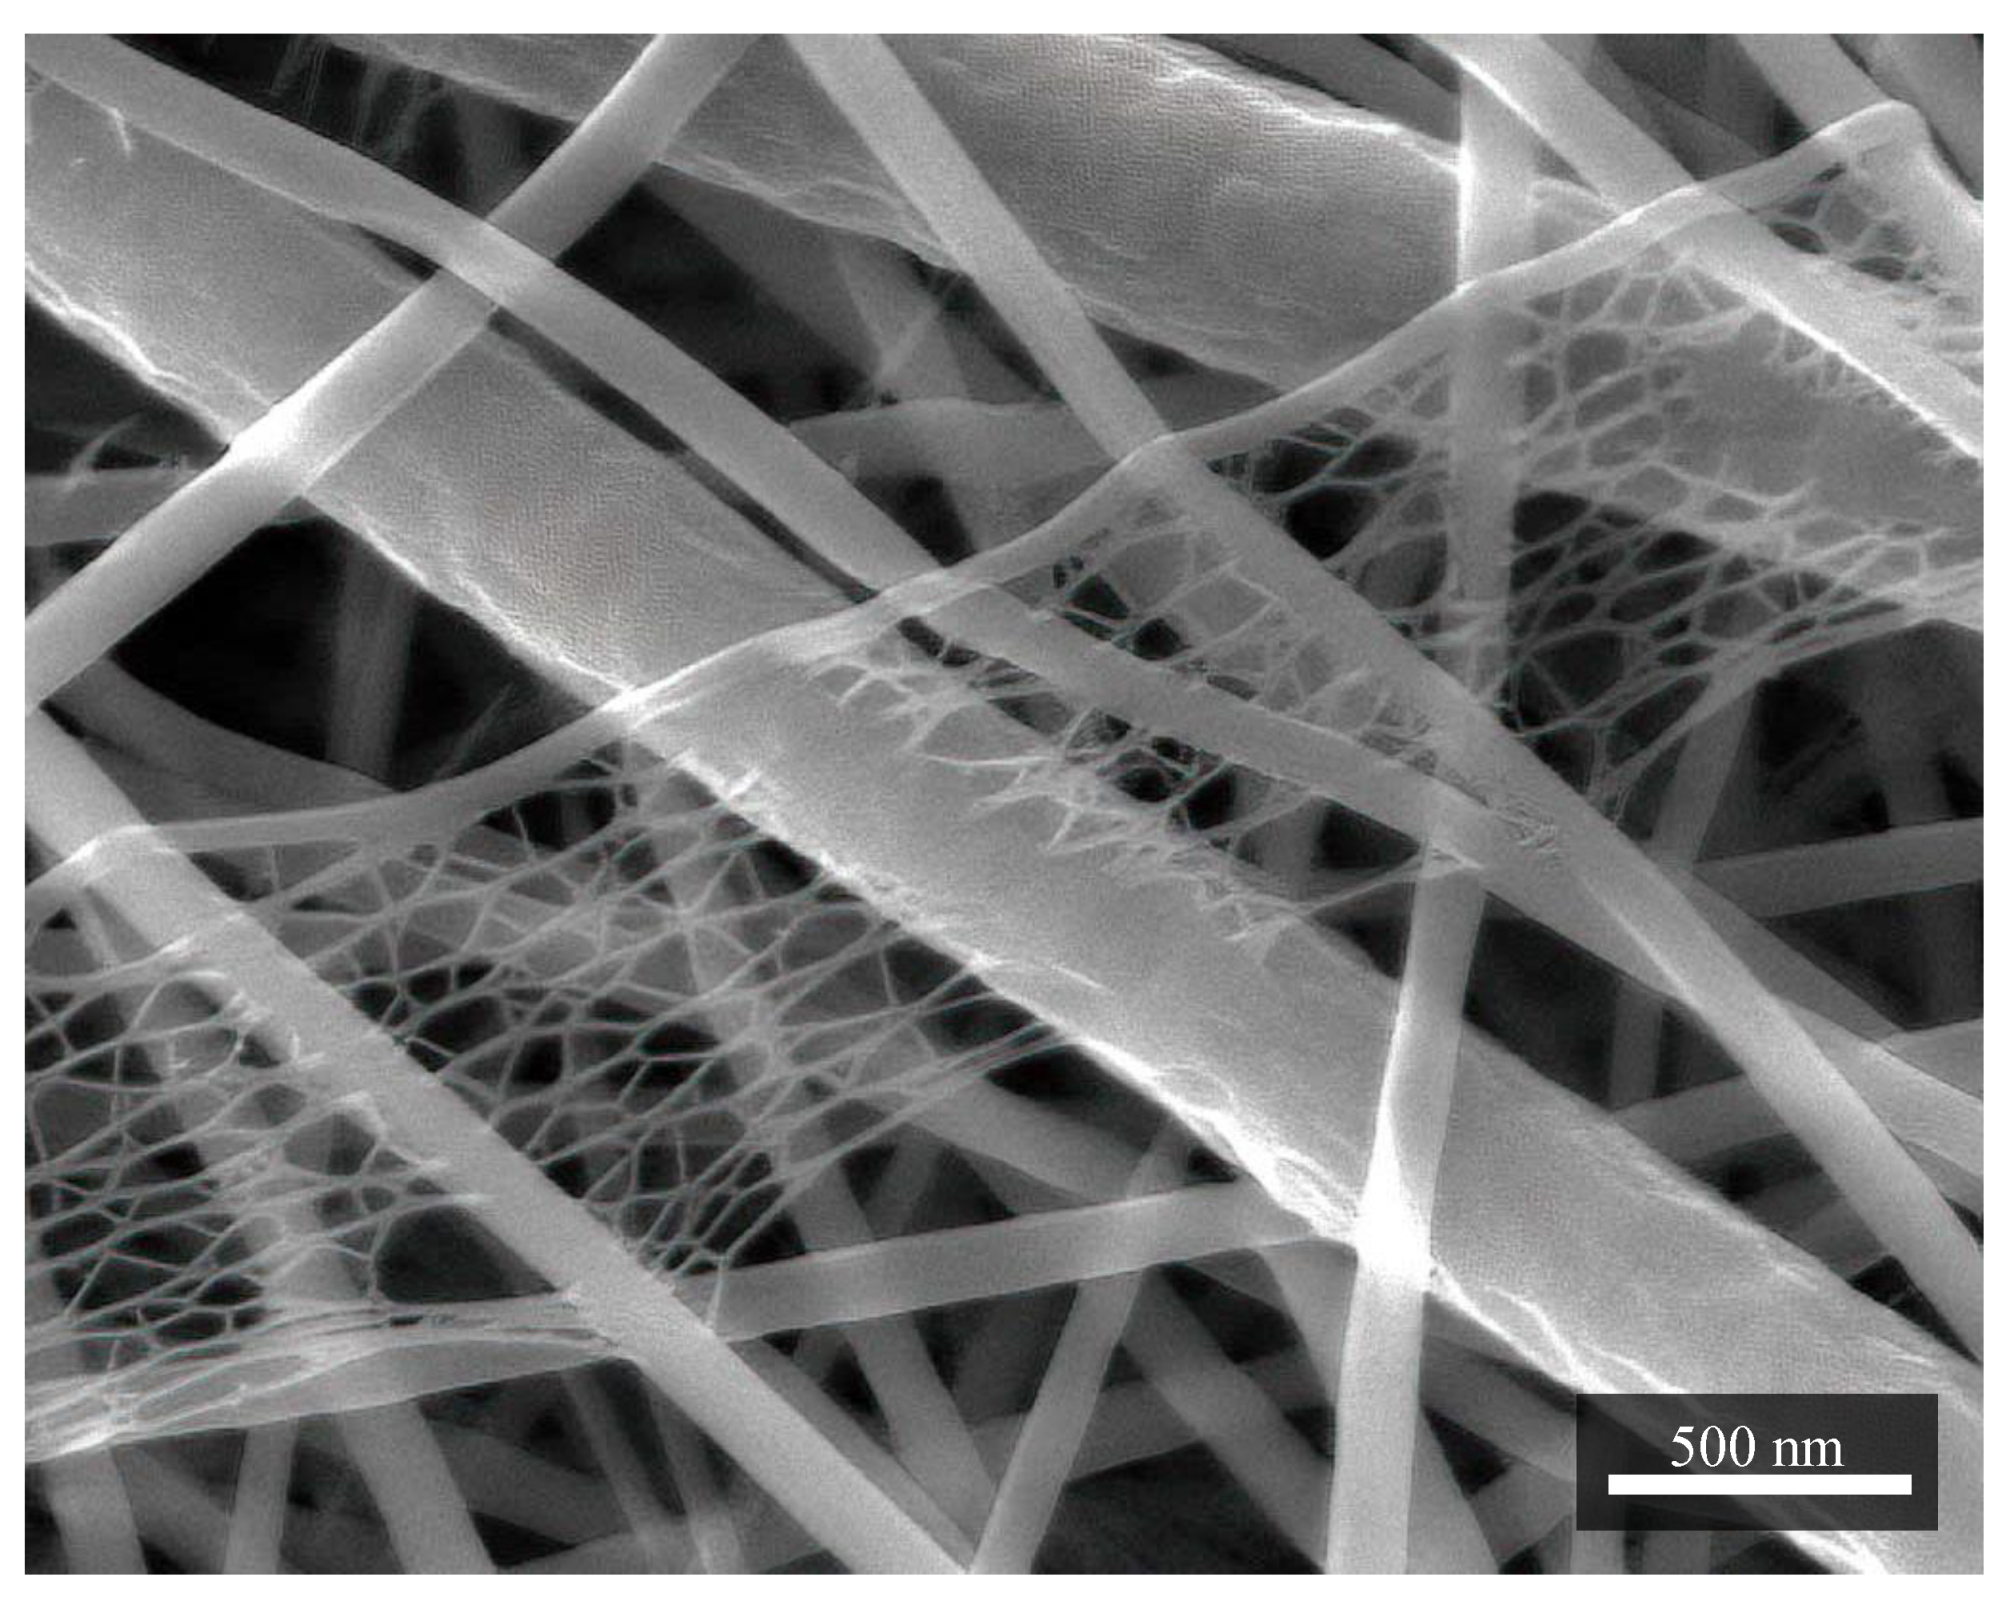
Figure 2.
A structure of porous character resembling a cobweb. It is formed mainly with nylon. In this case, it is a sample in combination PVDF/PA6. Measurement parameters: acceleration voltage 5 kV, magnification 80 k×.
Figure 2.
A structure of porous character resembling a cobweb. It is formed mainly with nylon. In this case, it is a sample in combination PVDF/PA6. Measurement parameters: acceleration voltage 5 kV, magnification 80 k×.
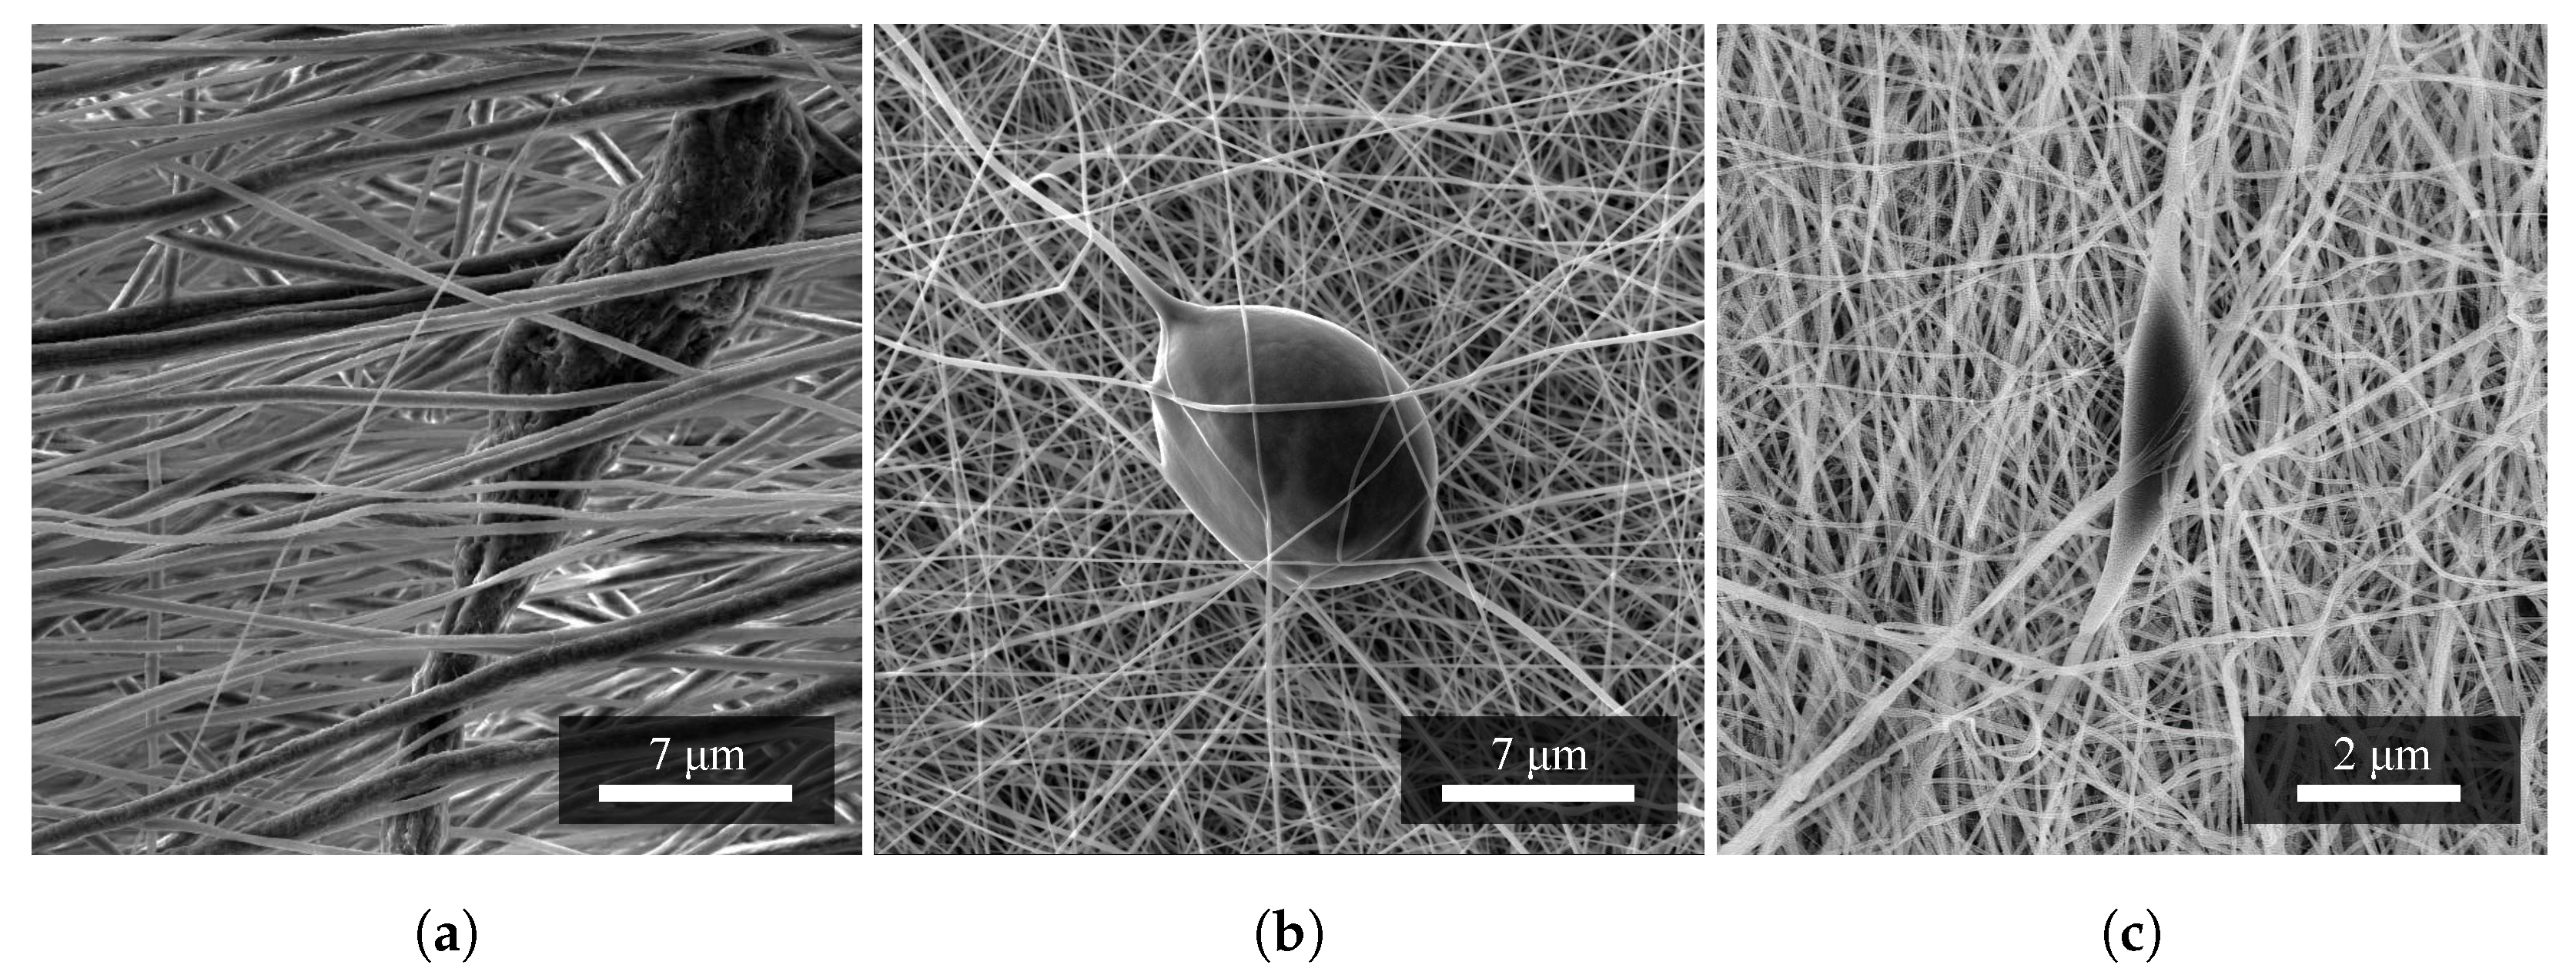
Figure 3.
A set of images of nanofibrous materials based on (a) PVDF, (b) PVDF/PA6, and (c) PA6; and their typical occurring defects. It can be seen that the most common defect in the fibers is a tearshaped droplet in all materials. Measurement parameters: acceleration voltage 5 kV, magnification 9.4 k×.
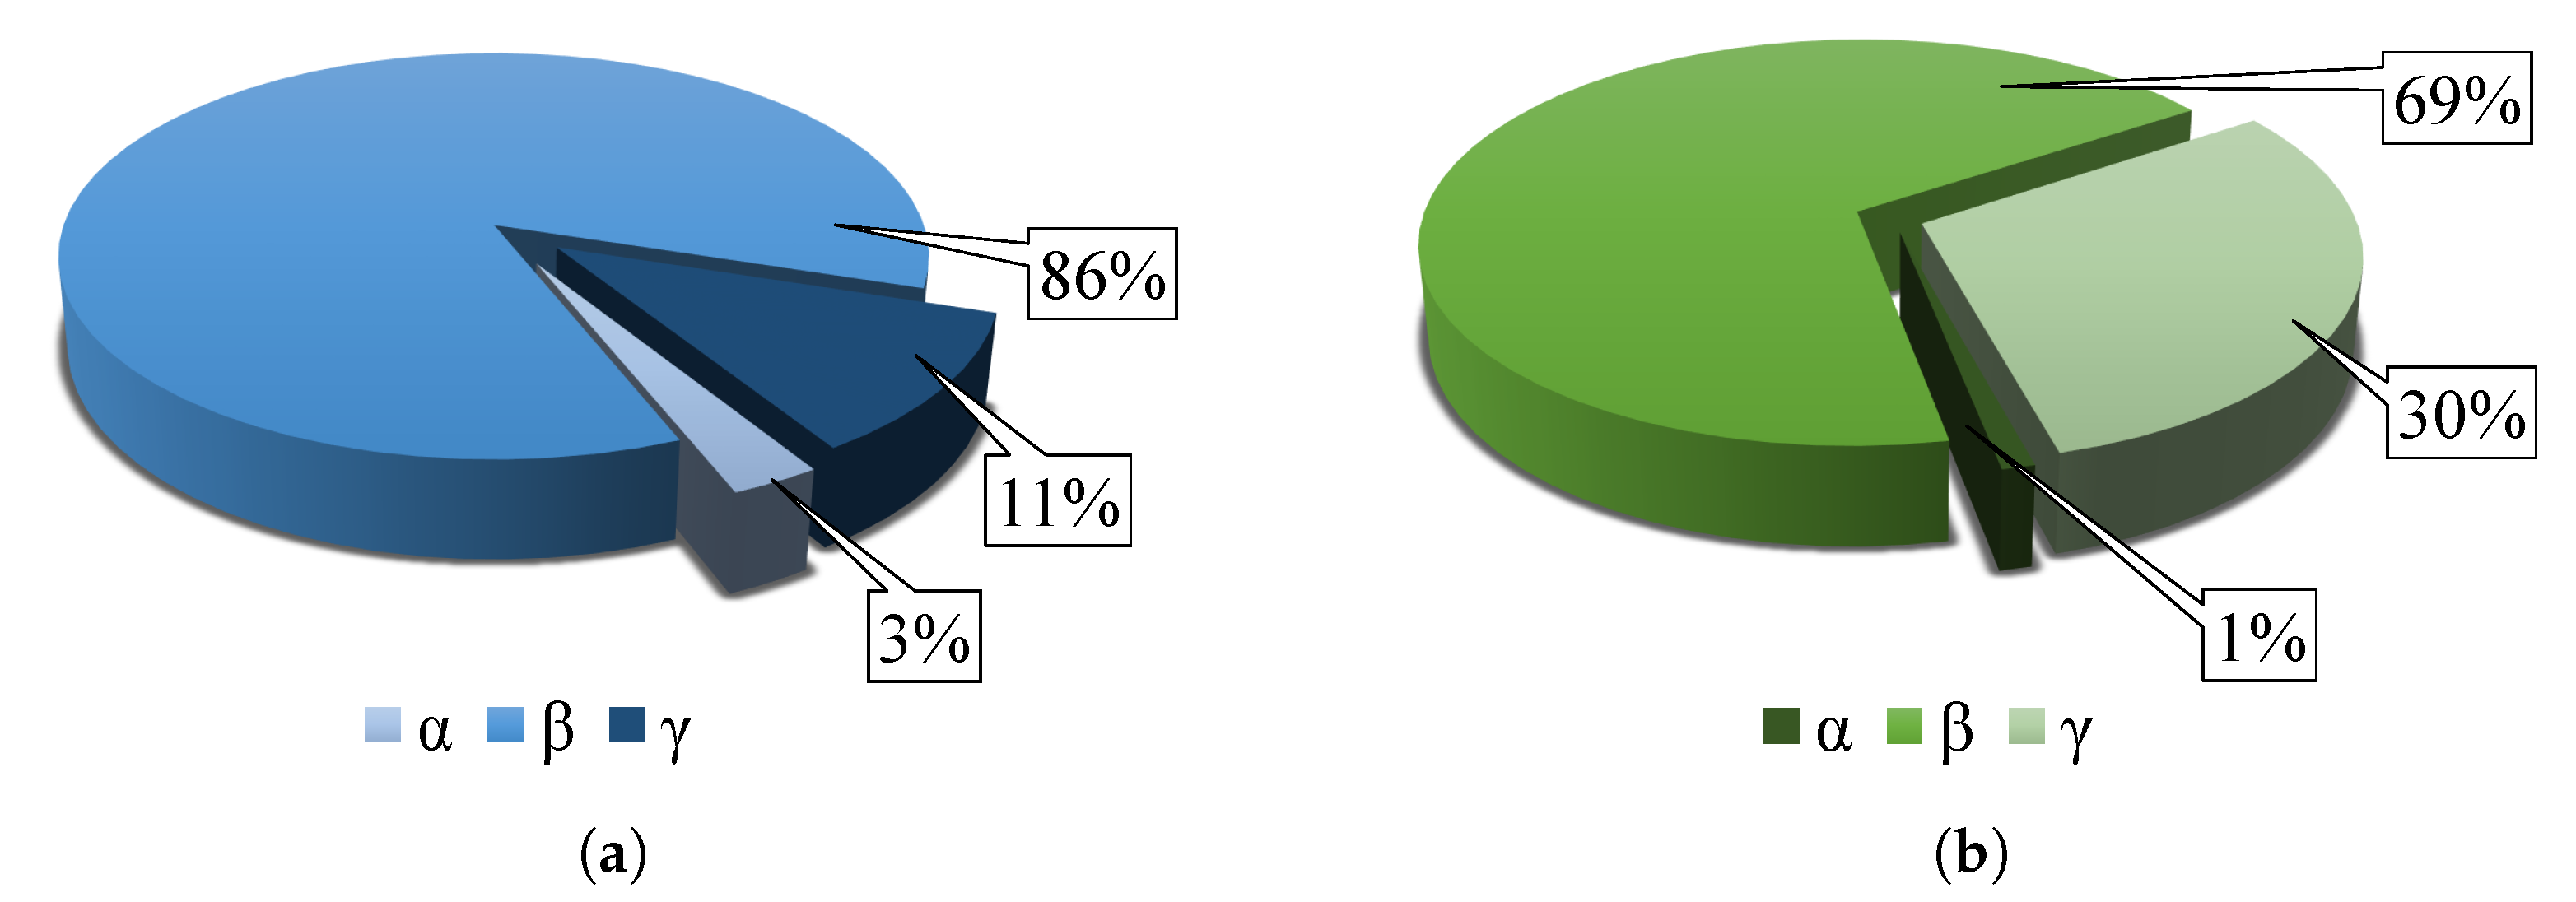
Figure 4.
Comparison of density and alignment of nanofibers of (a) PVDF, (b) PVDF/PA6, and (c) PA6. All nanofibers were produced with the same technology at almost identical production parameters. Nevertheless, their difference can be seen at first glance, especially for PVDF. Measurement parameters: acceleration voltage 5 kV, magnification 5.5 k×.
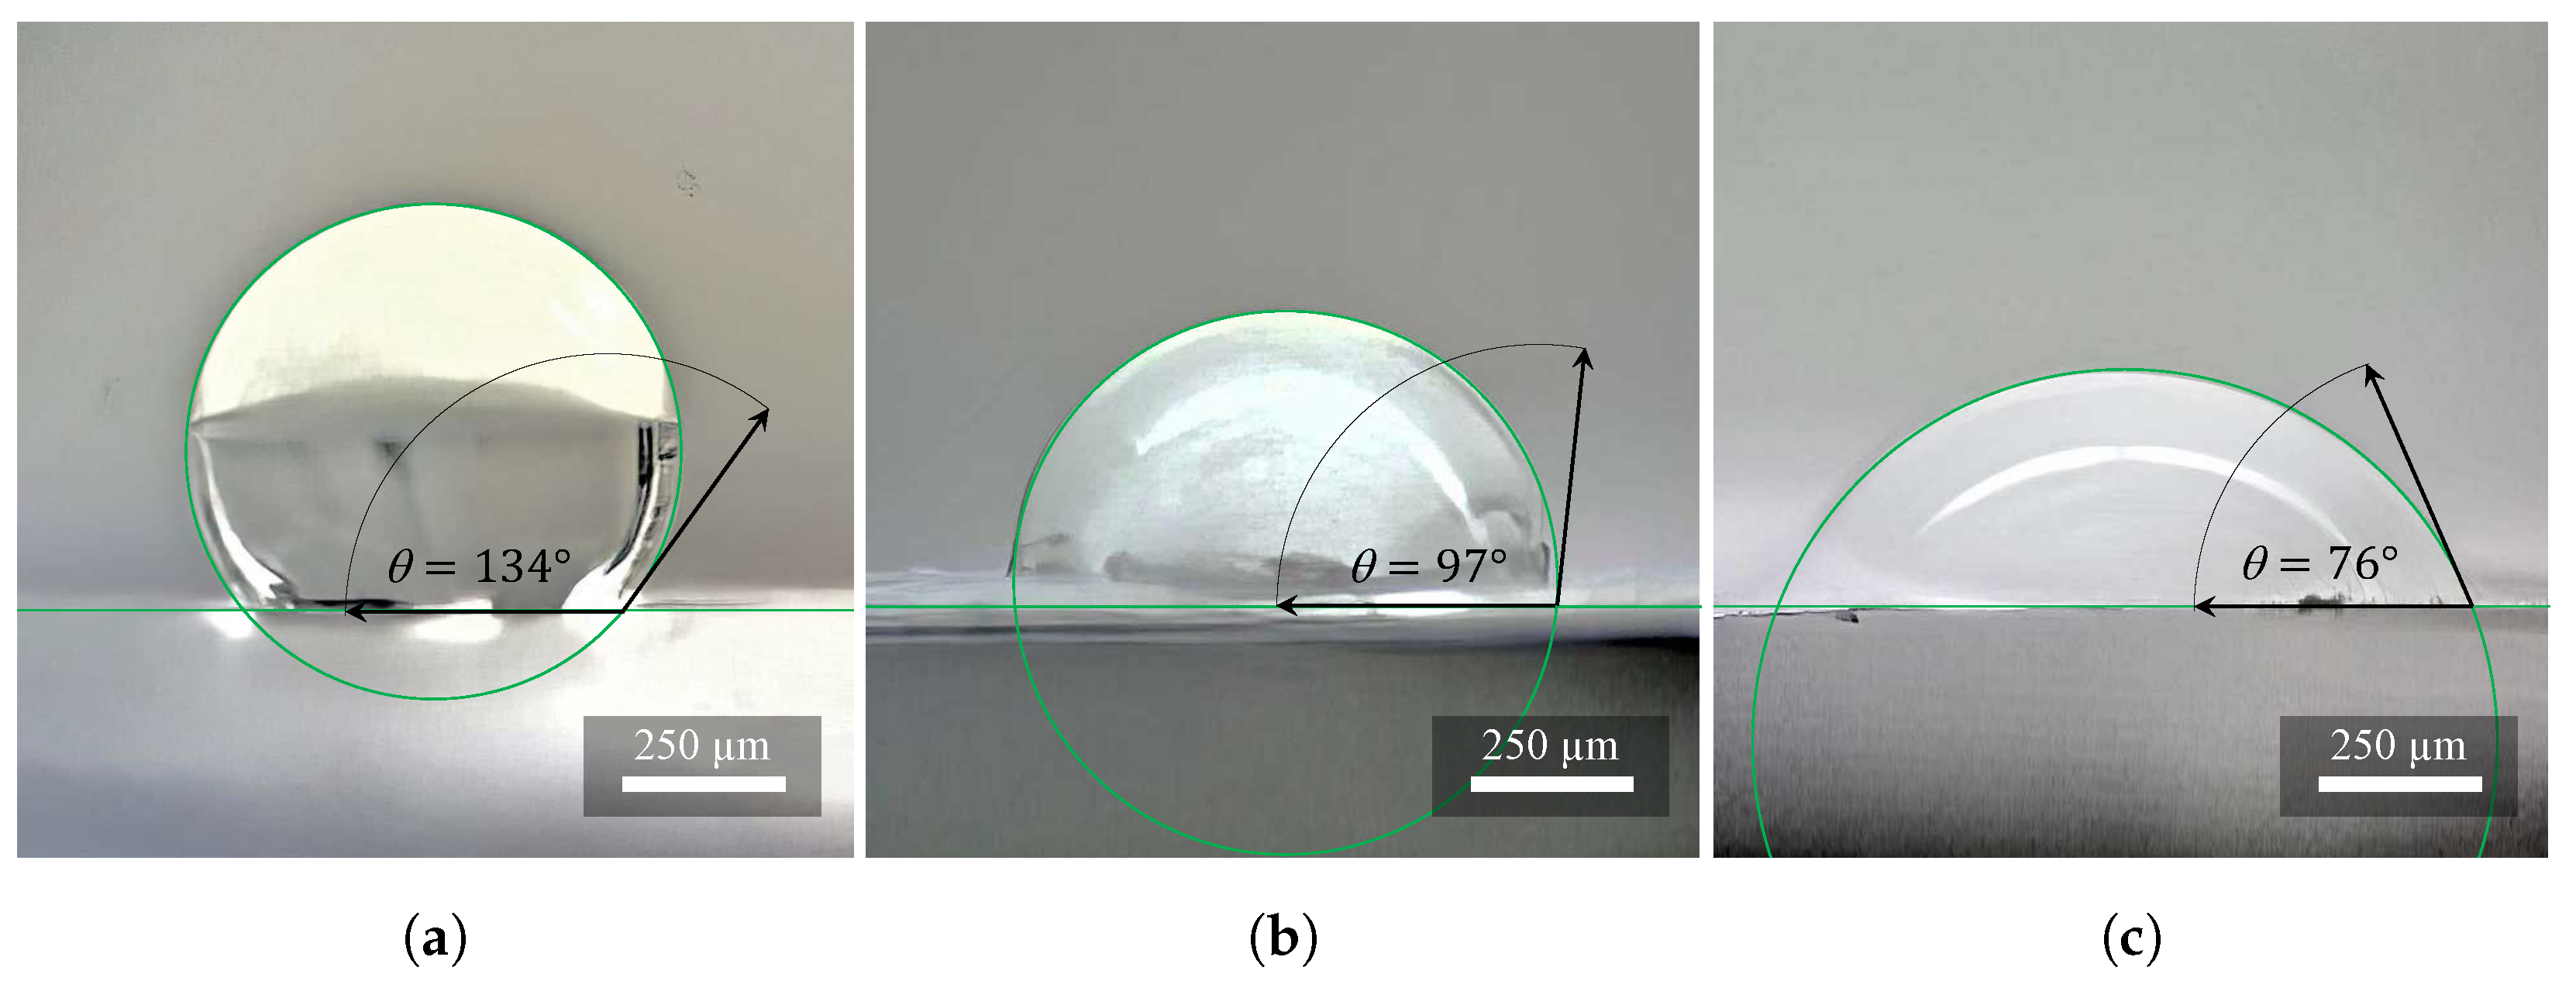
Figure 5.
Investigation of hydrophobicity and hydrophilicity on (a) PVDF, (b) PVDF/PA6, and (c) PA6. The wettability of the samples increases with higher nylon concentration. These are average values from ten measurements.
Figure 5.
Investigation of hydrophobicity and hydrophilicity on (a) PVDF, (b) PVDF/PA6, and (c) PA6. The wettability of the samples increases with higher nylon concentration. These are average values from ten measurements.
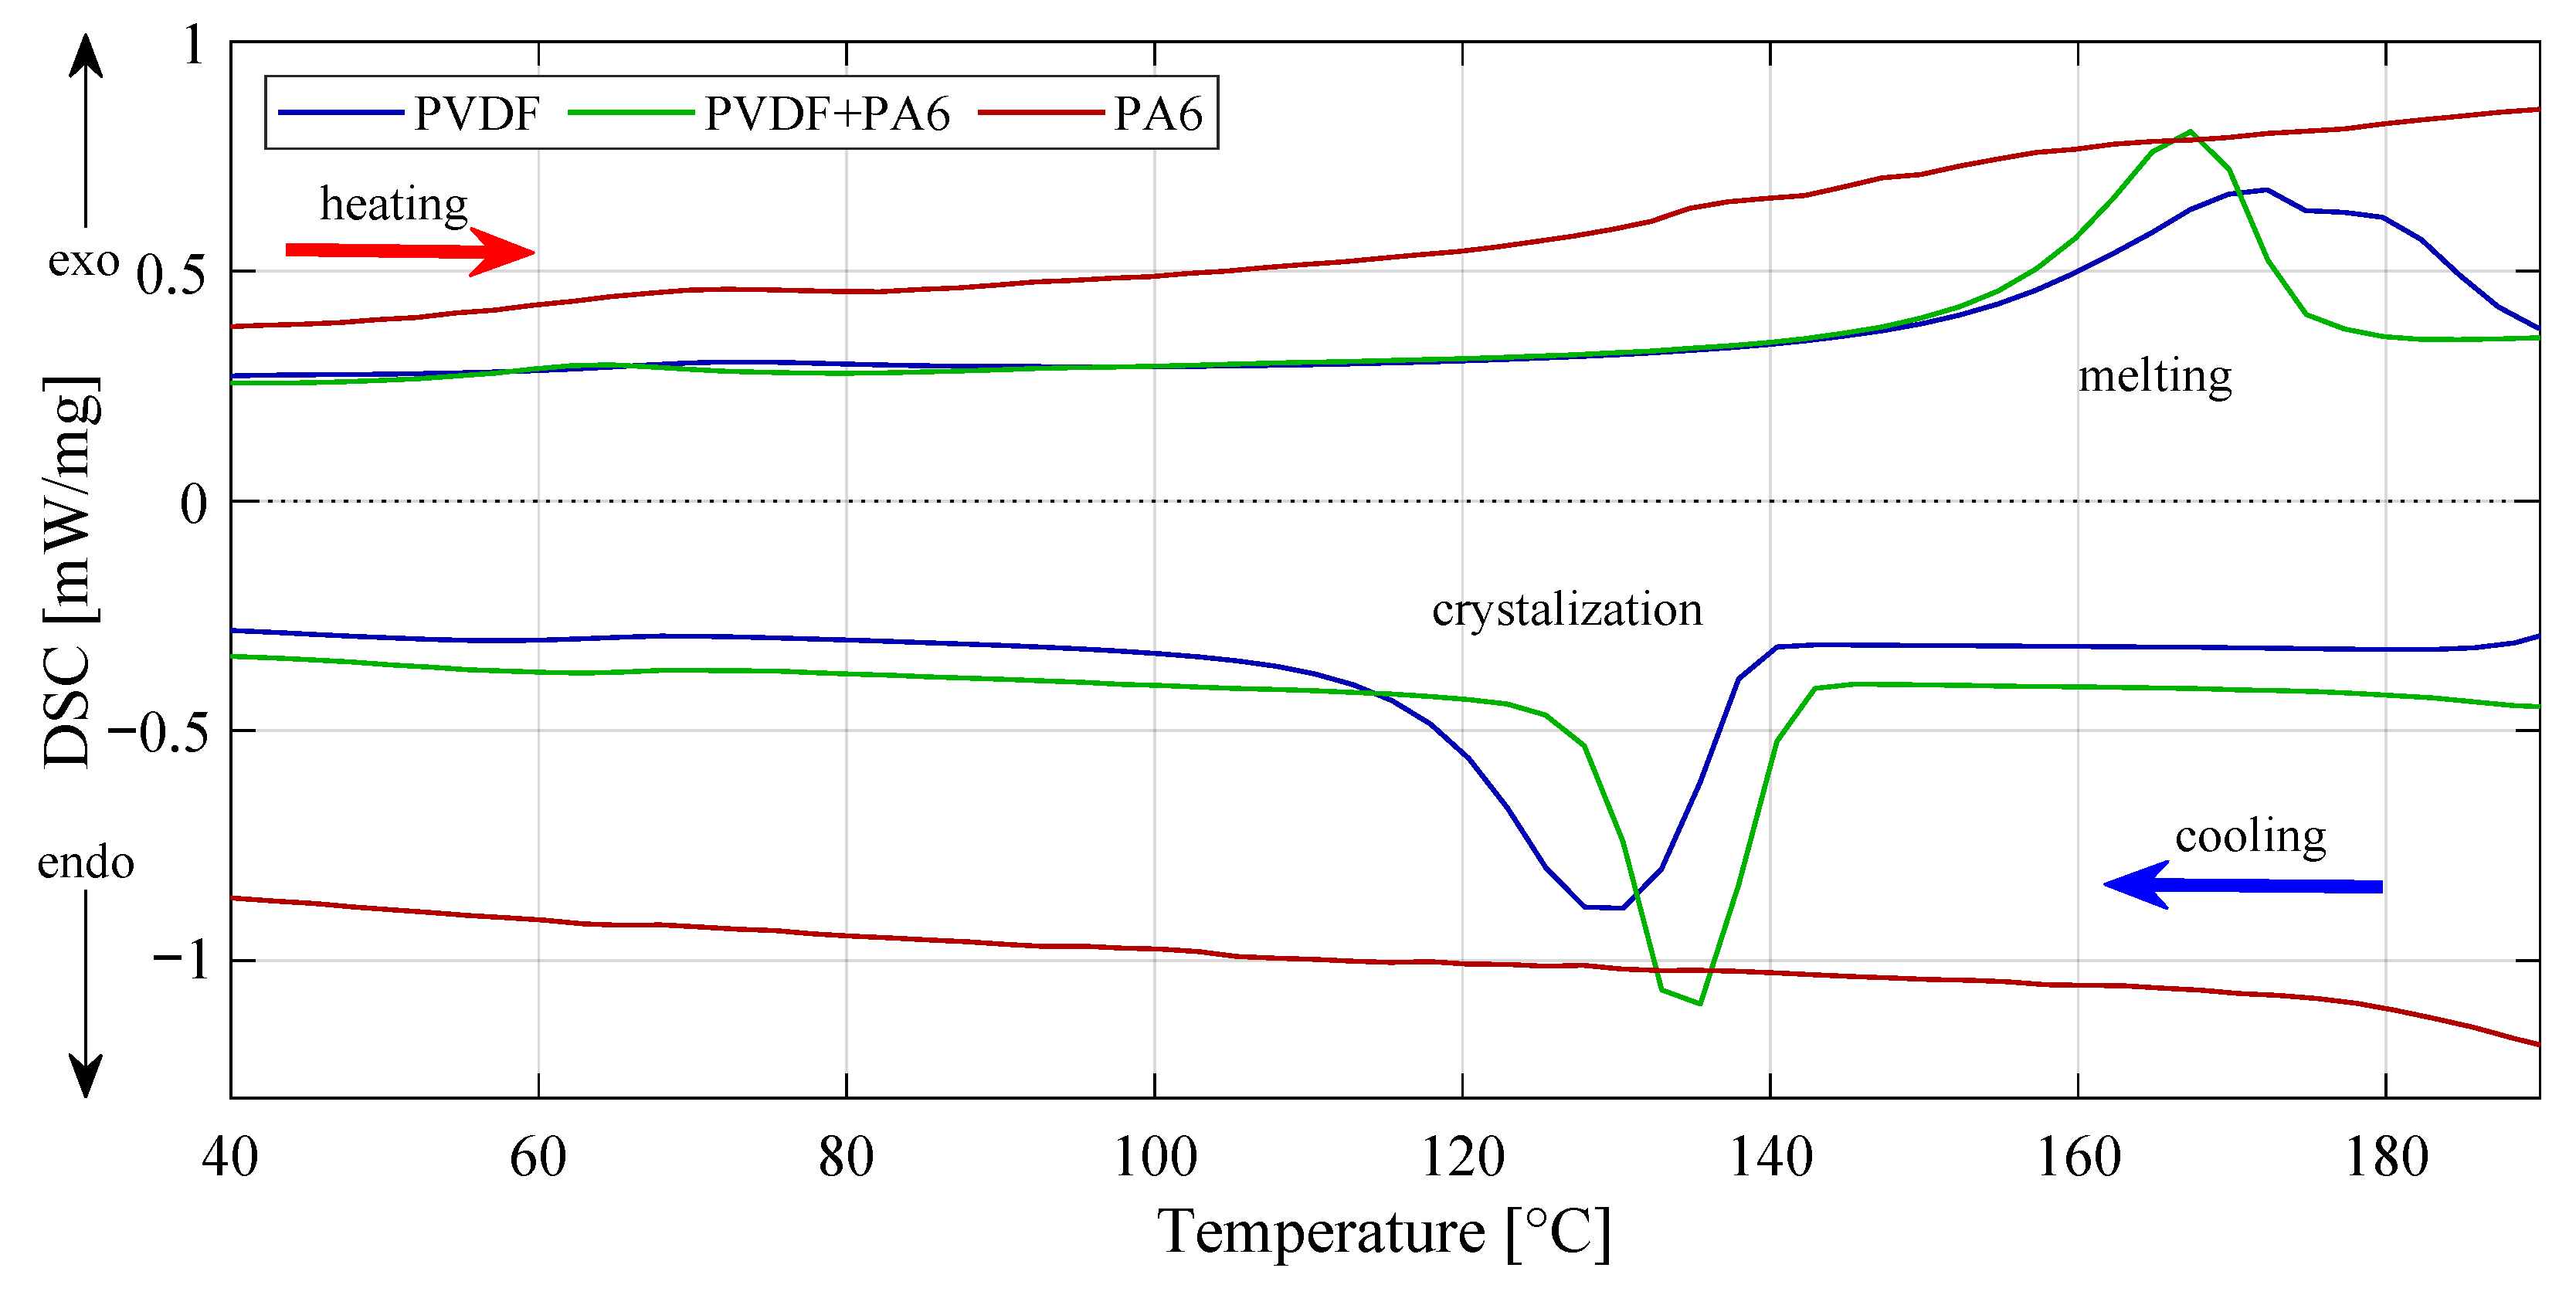
Figure 6.
Exothermic and endothermic reactions can be observed from DSC curves. All three materials are presented here. Results are mainly used to calculate enthalpies of transitions by integrating the peak corresponding to a given transition. In this case, PVDF and PVDF/PA6 mixture only can be calculated.
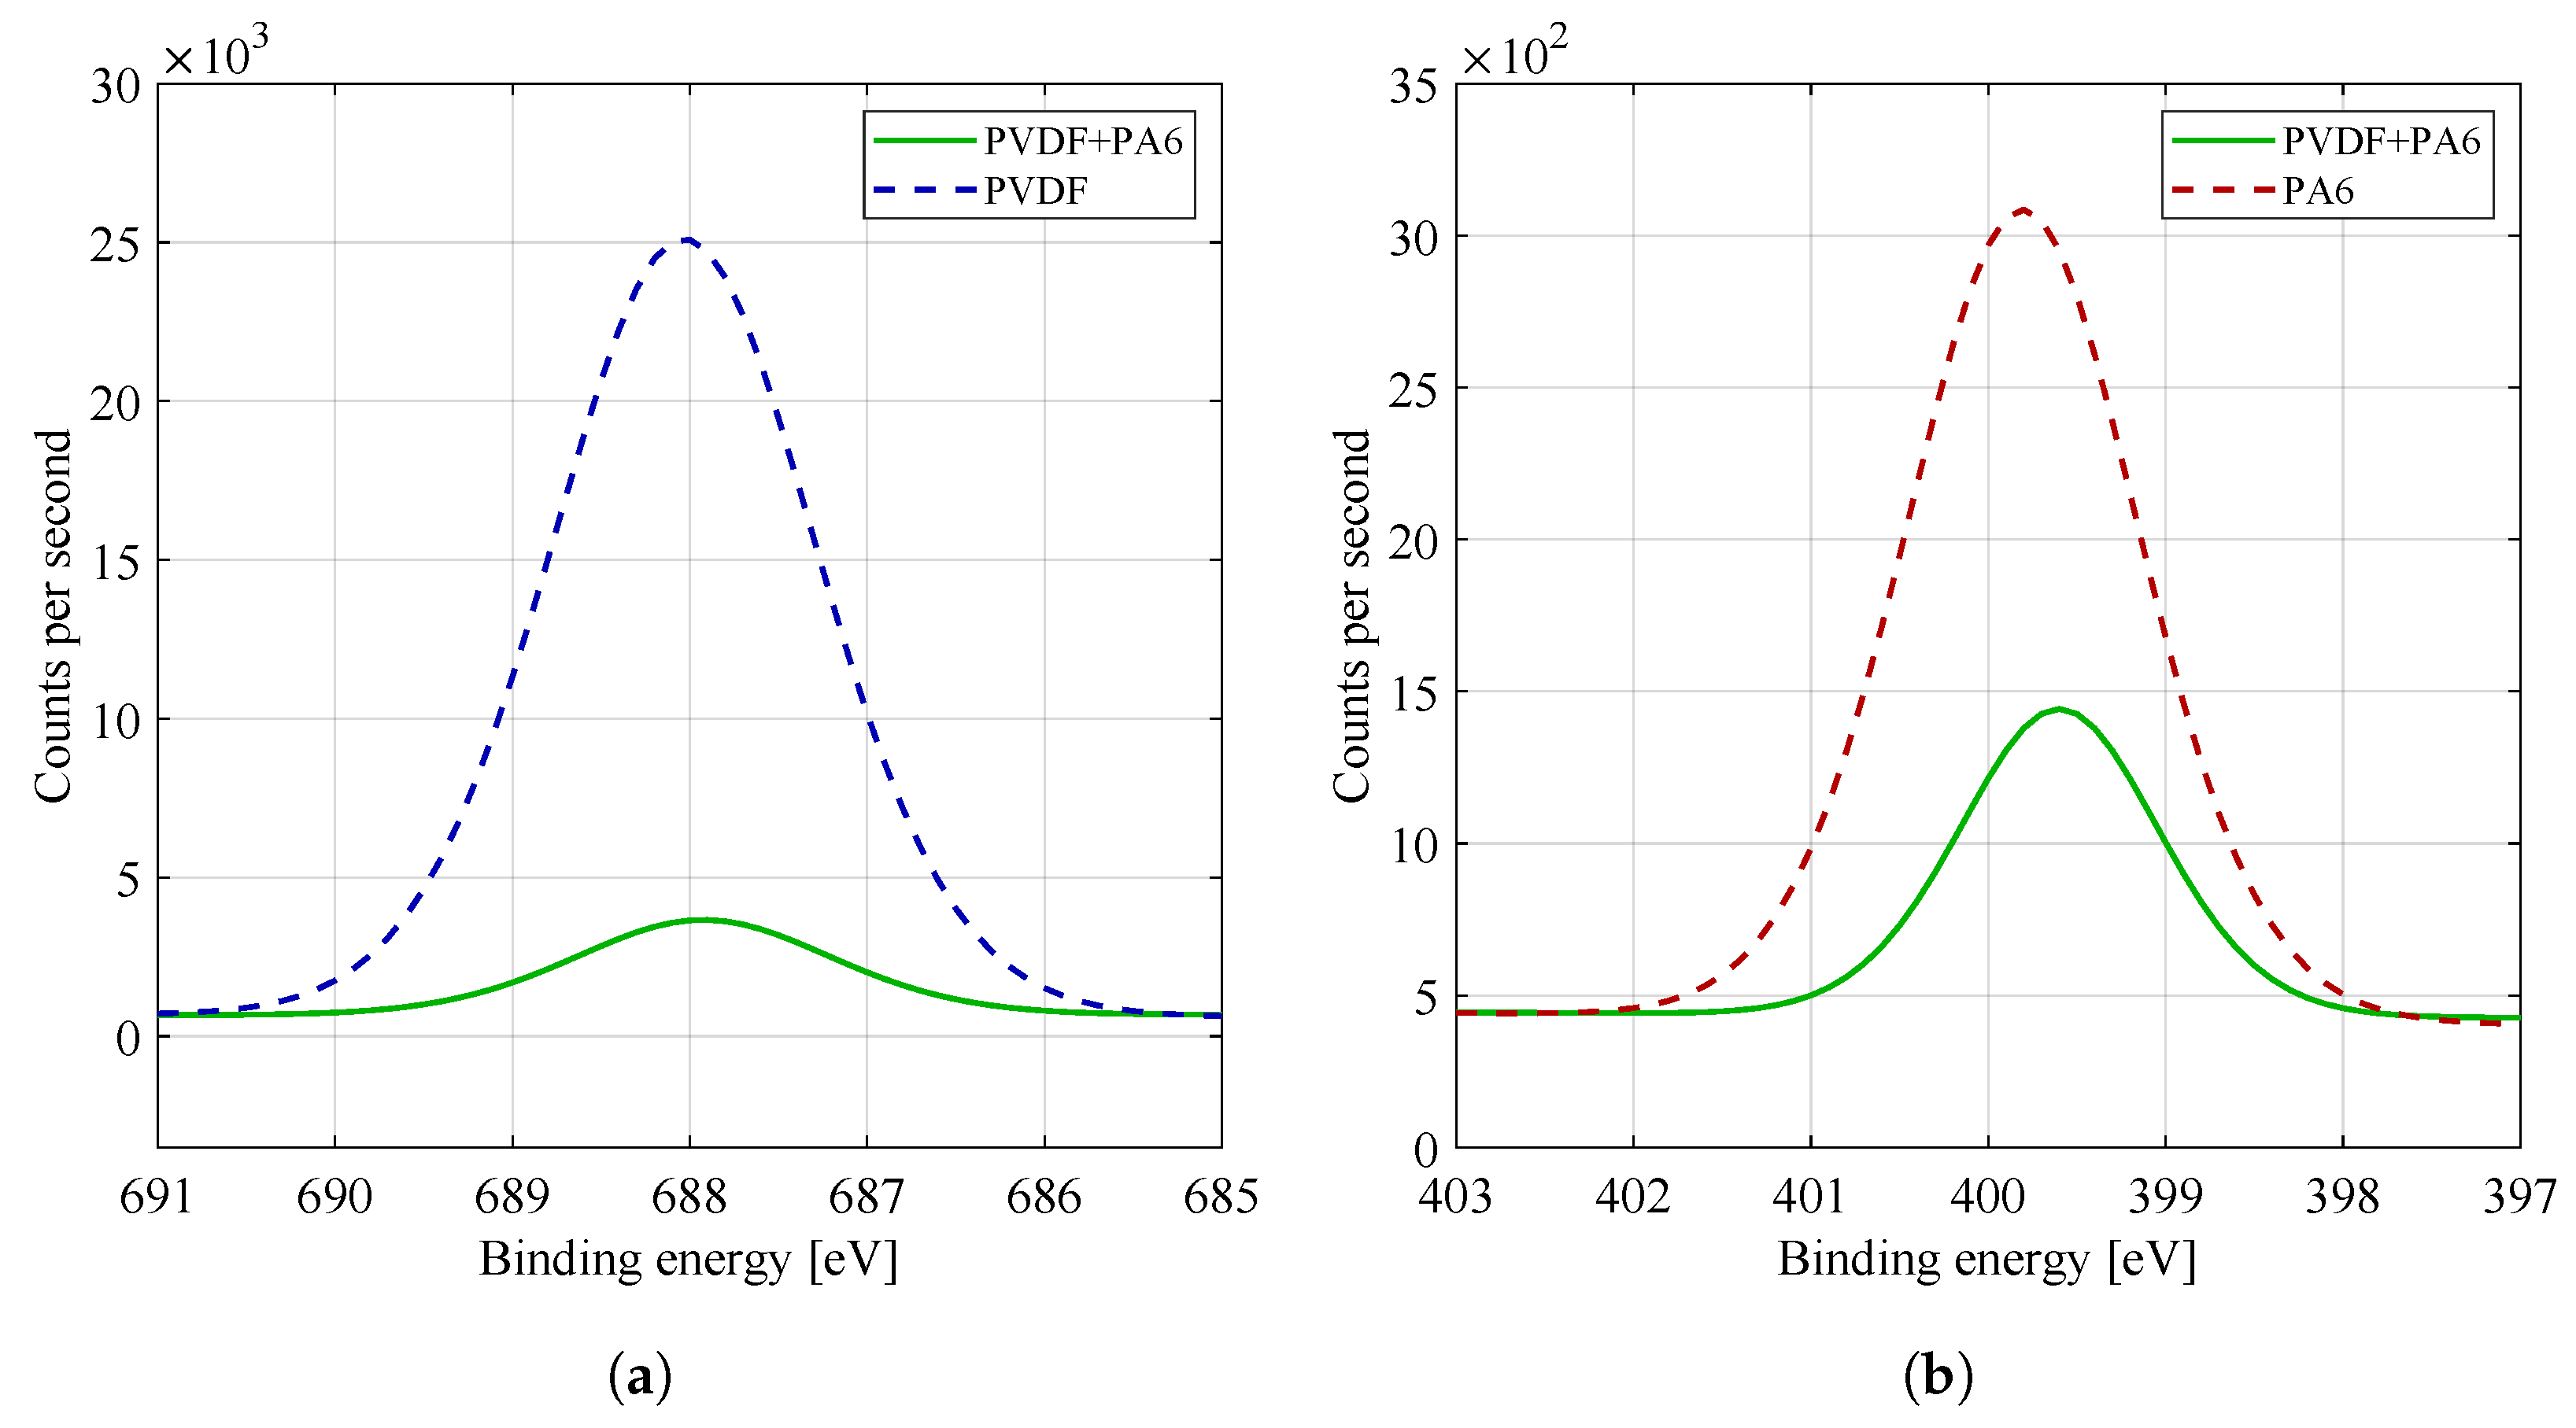
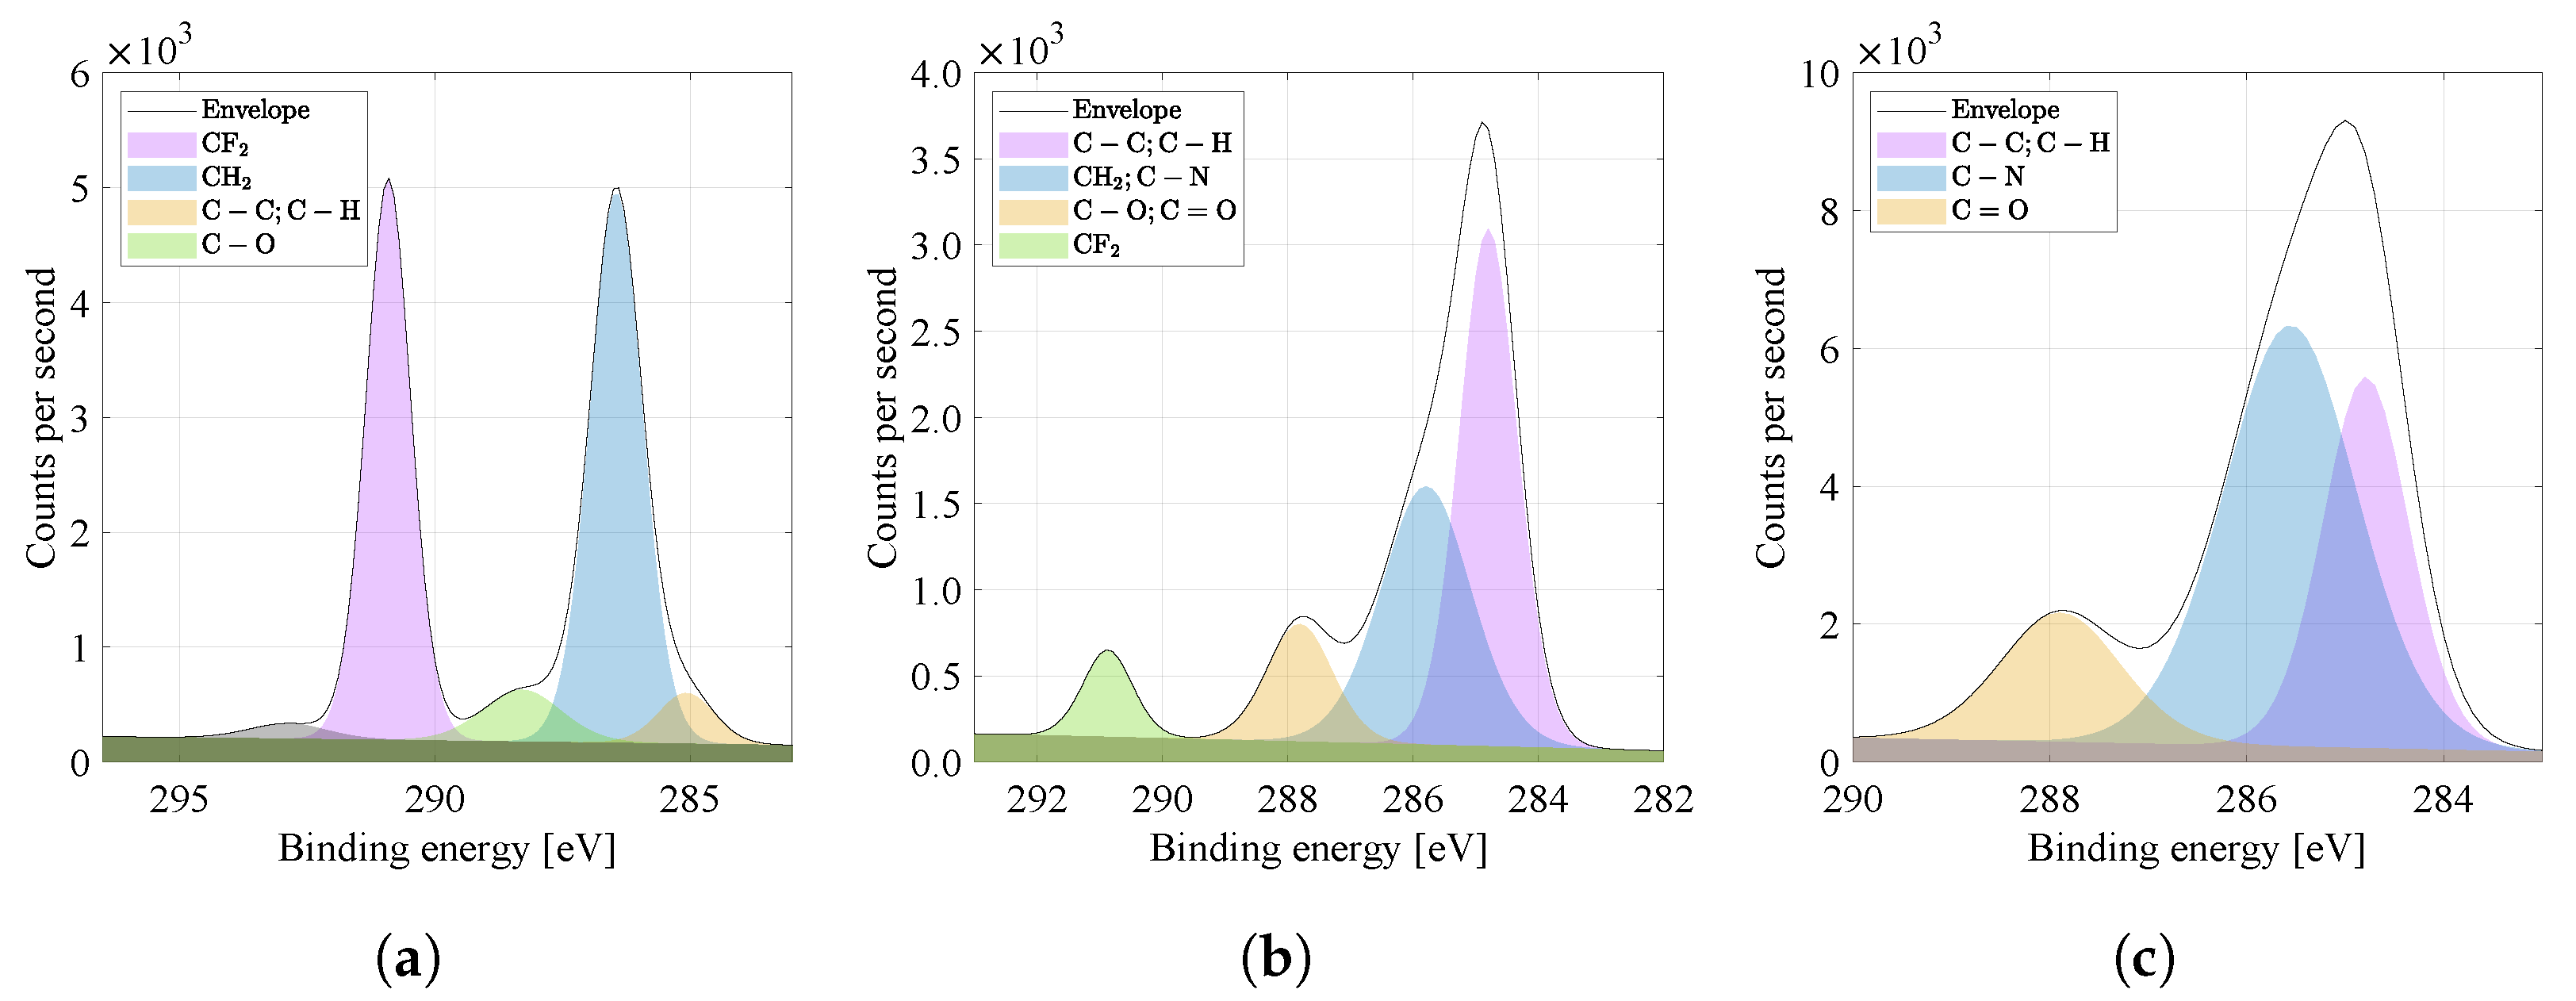
Figure 7.
High energy resolution XPS spectra of C1s region. Nanofibers from the (a) PVDF, (b) PVDF/PA, (c) PA6 and their specific binding energies are compared.
Figure 7.
High energy resolution XPS spectra of C1s region. Nanofibers from the (a) PVDF, (b) PVDF/PA, (c) PA6 and their specific binding energies are compared.
Figure 8.
High energy resolution XPS spectra of (a) F1s and (b) N1s region. For practicality and a better overview, the curves of the given materials were plotted in one graph.
Figure 8.
High energy resolution XPS spectra of (a) F1s and (b) N1s region. For practicality and a better overview, the curves of the given materials were plotted in one graph.
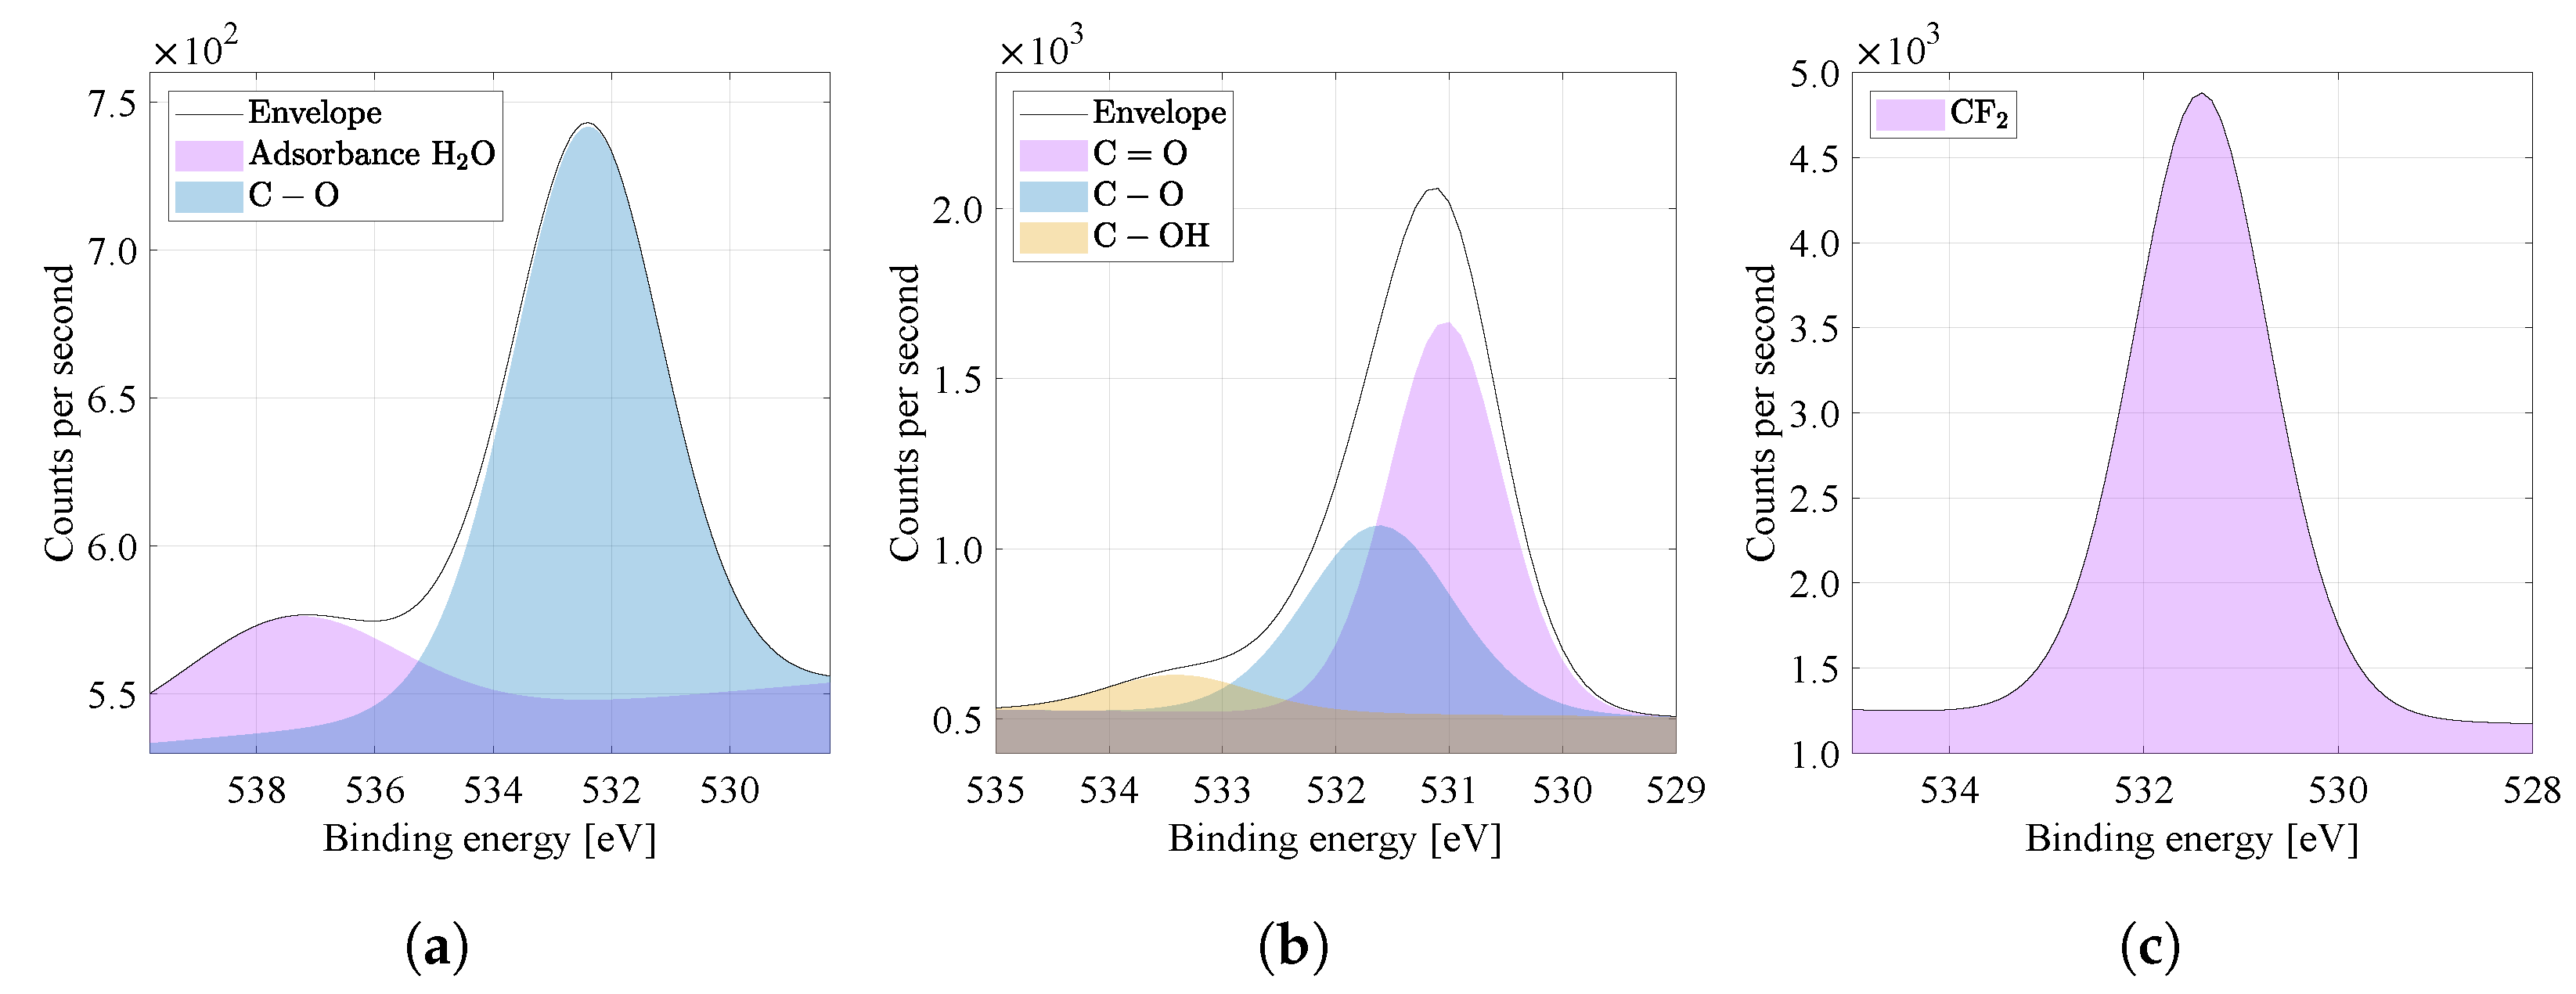
Figure 9.
High energy resolution XPS spectra of O1s region. Nanofibers from the (a) PVDF, (b) PVDF/PA, (c) PA6 and their specific binding energies are compared.
Figure 9.
High energy resolution XPS spectra of O1s region. Nanofibers from the (a) PVDF, (b) PVDF/PA, (c) PA6 and their specific binding energies are compared.
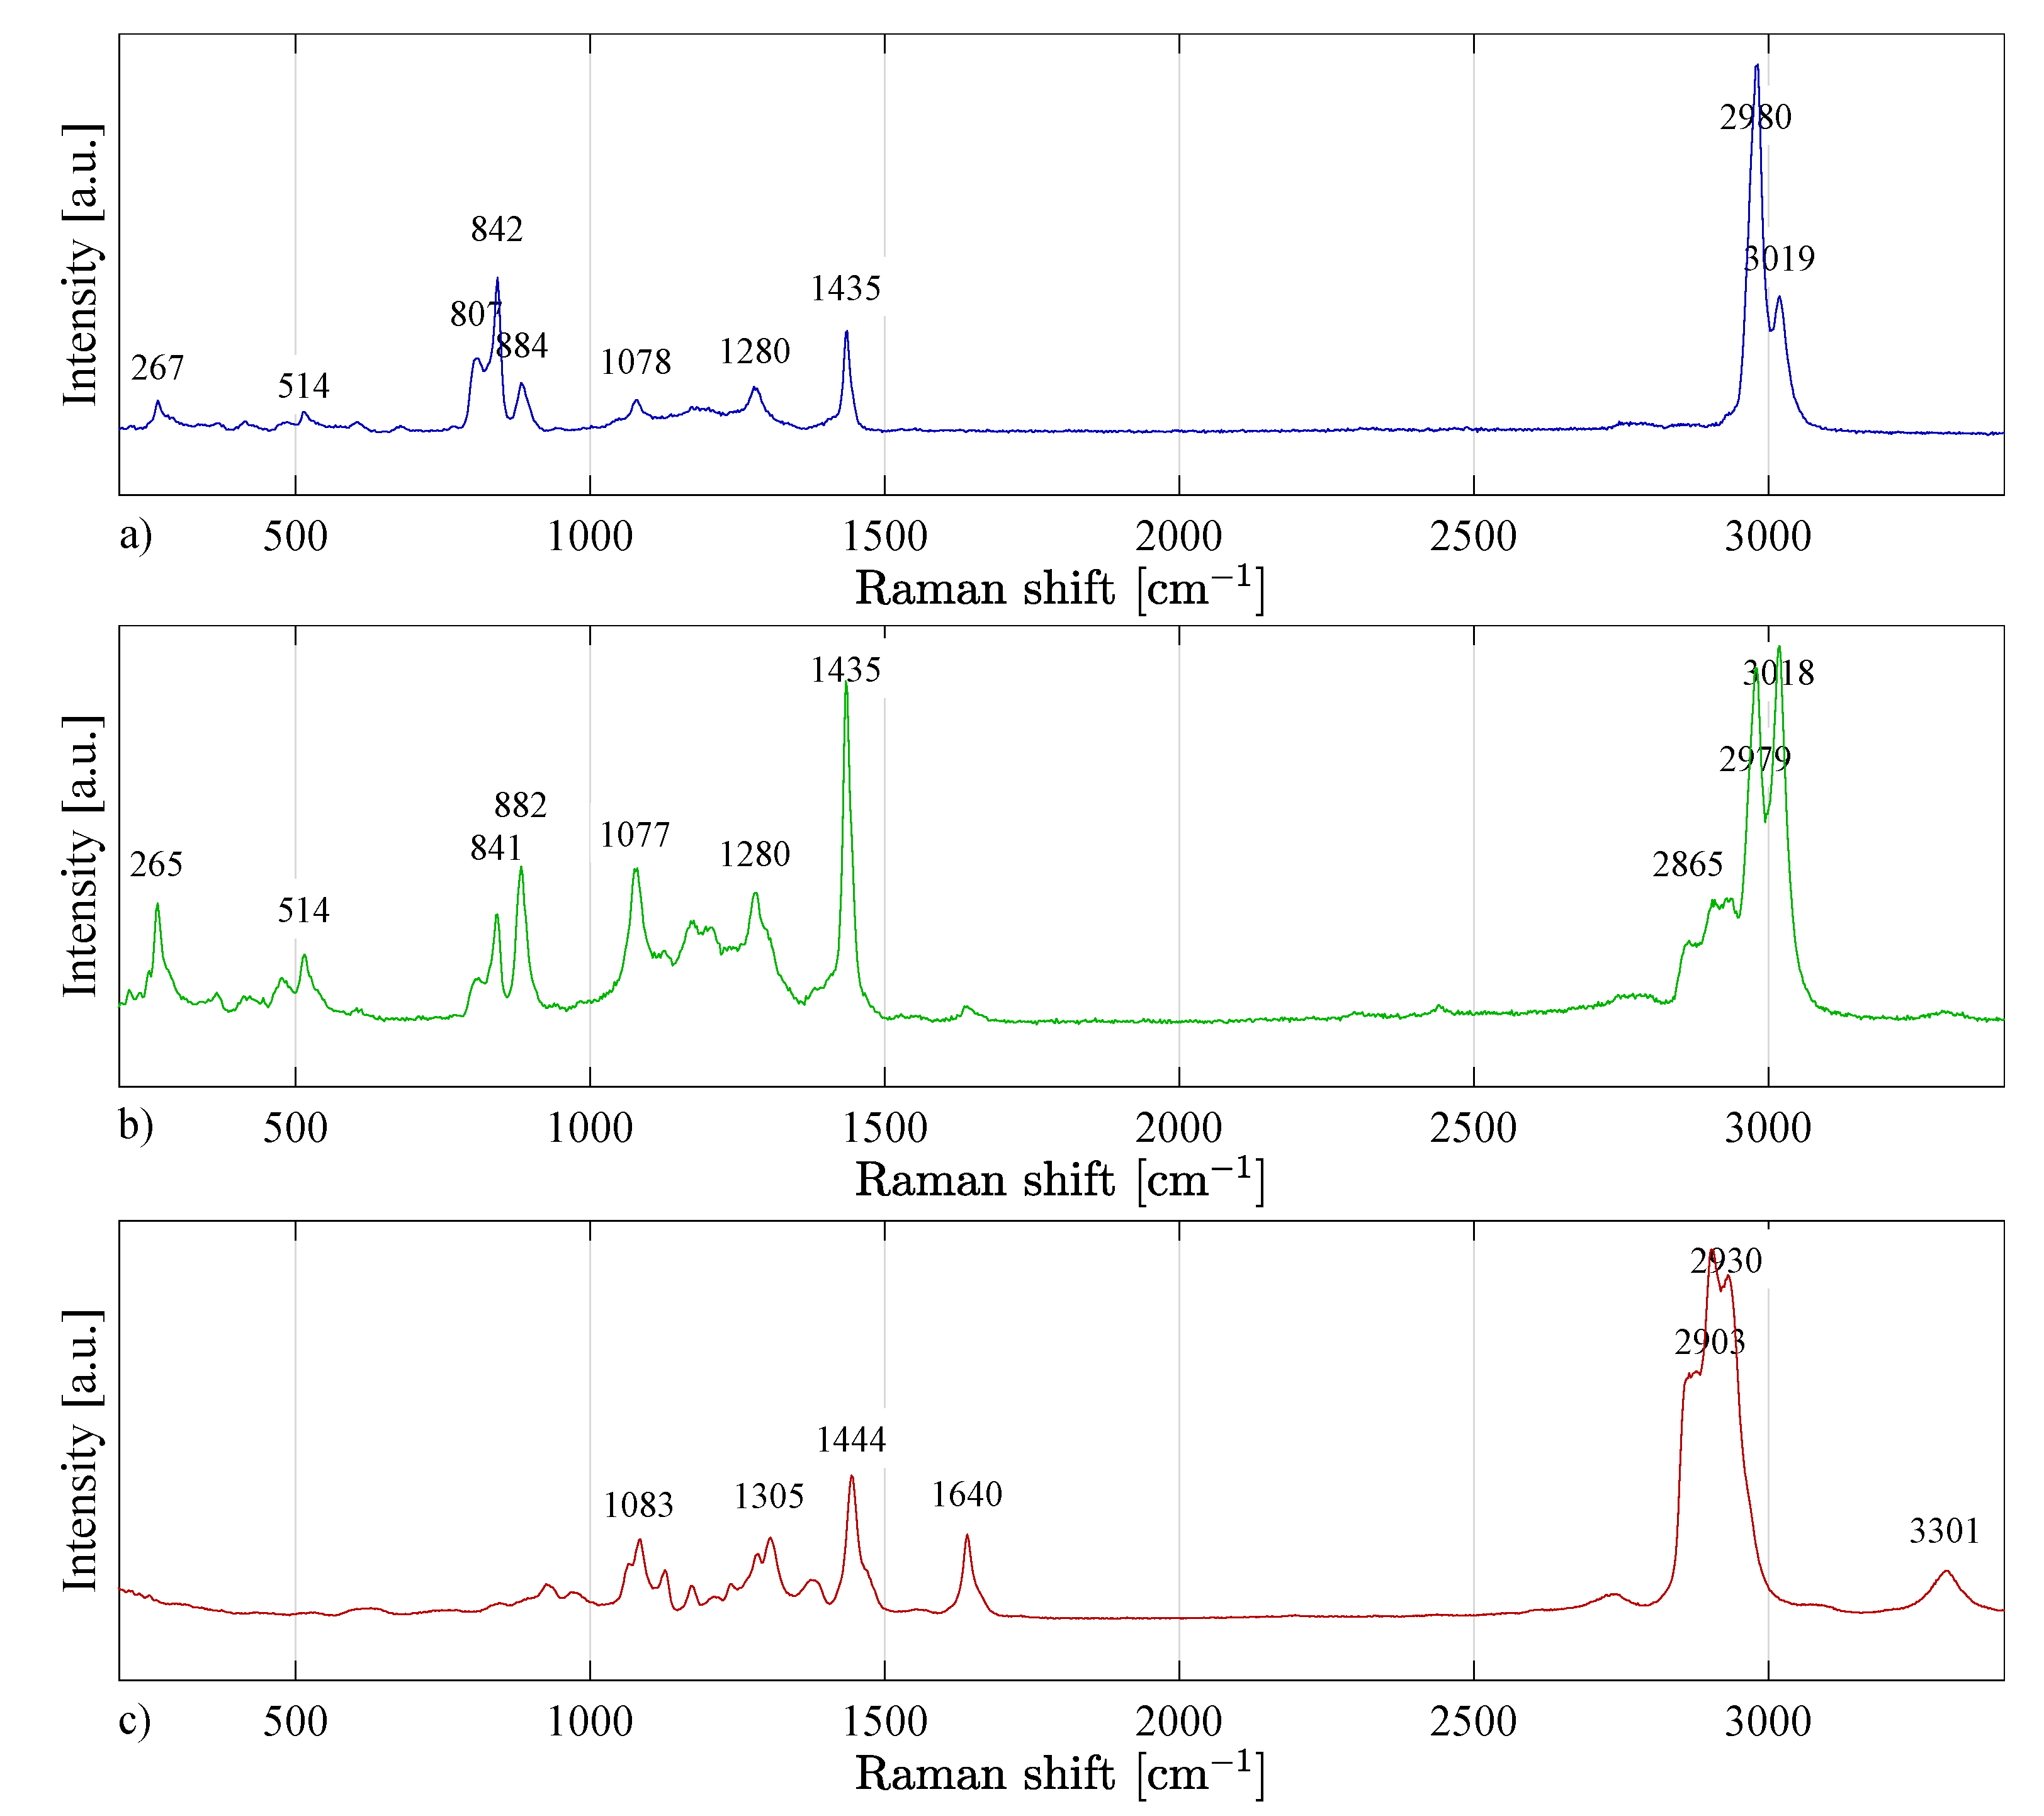
Figure 10.
Raman spectra of (a) PVDF, (b) PVDF/PA6, and (c) PA6. In Figure (b) it is possible to successfully observe both PVDF and PA6 characteristic peaks.
Figure 10.
Raman spectra of (a) PVDF, (b) PVDF/PA6, and (c) PA6. In Figure (b) it is possible to successfully observe both PVDF and PA6 characteristic peaks.
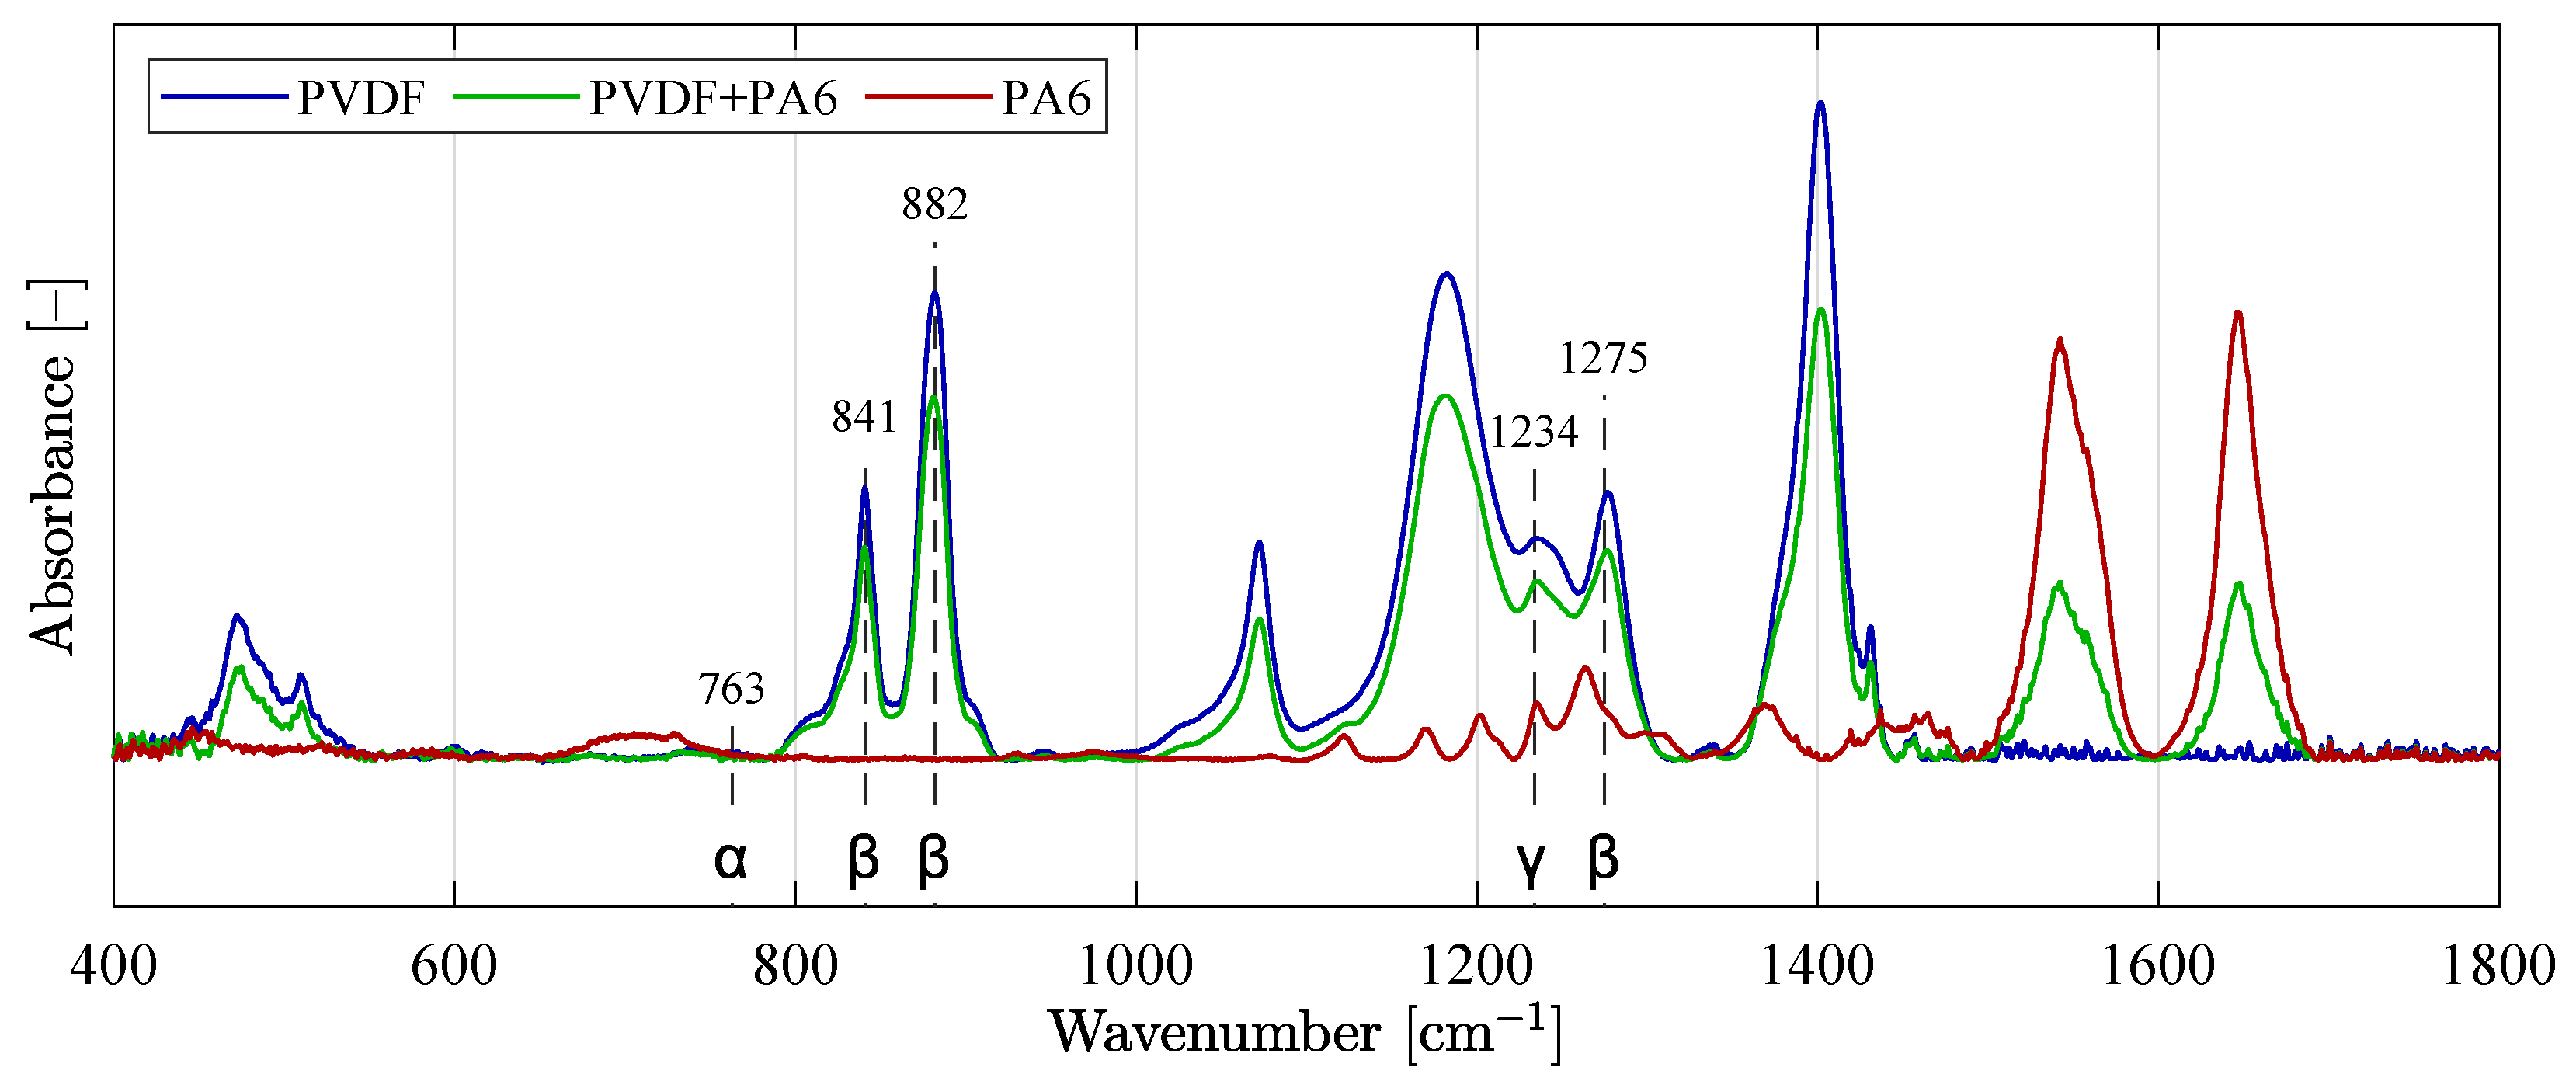
Figure 11.
Absorption FT-IR spectra of three overlaid curves with typical and known phases.
Figure 11.
Absorption FT-IR spectra of three overlaid curves with typical and known phases.
Figure 12.
Comparison of calculated crystalline phase contents of (a) PVDF and (b) PVDF/PA6materials.
Figure 12.
Comparison of calculated crystalline phase contents of (a) PVDF and (b) PVDF/PA6materials.
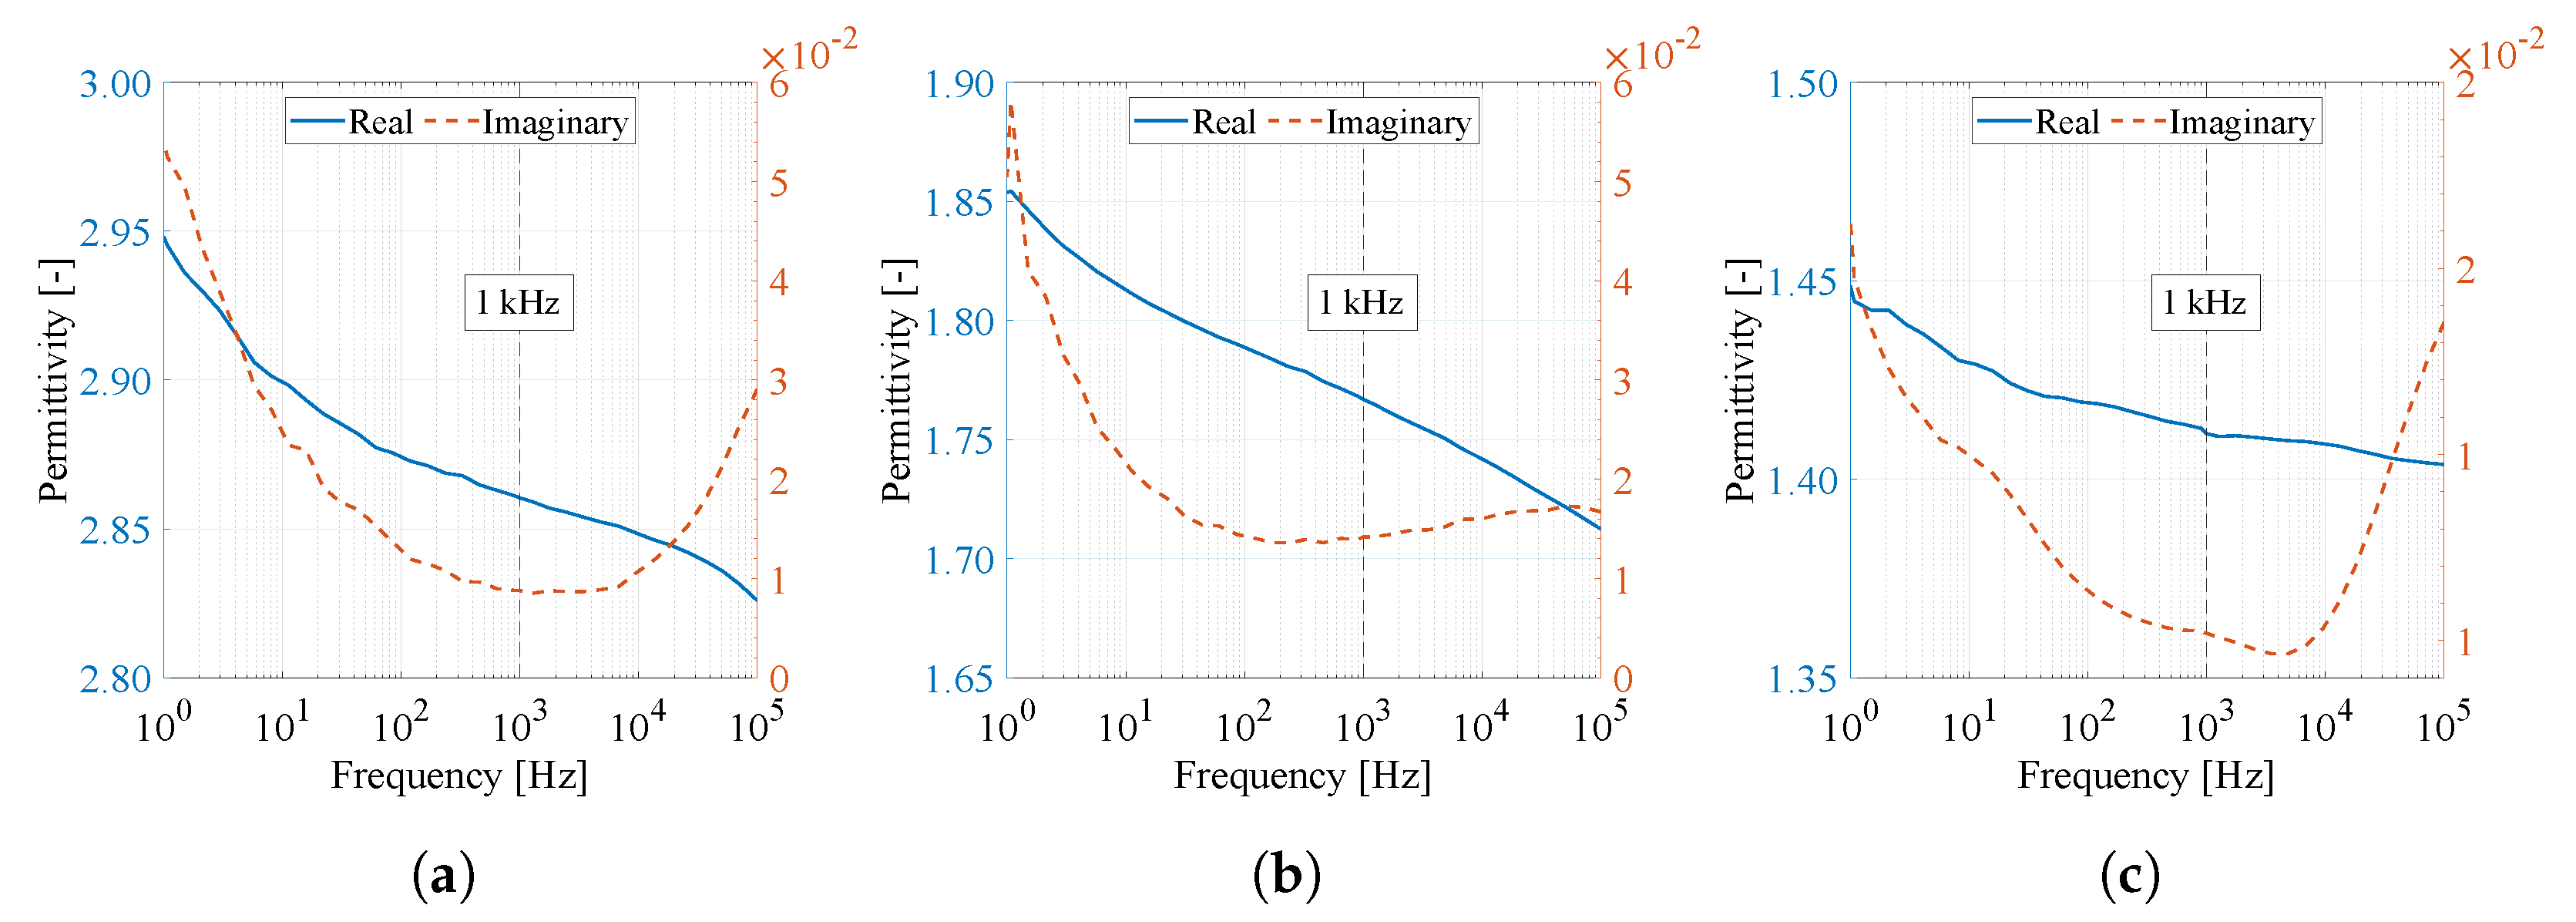
Figure 13.
Real and imaginary permittivity curves of (a) PVDF, (b) PVDF/PA6, and (c) PA6 material as a function of frequency from 1 Hz to 100 kHz.
Figure 13.
Real and imaginary permittivity curves of (a) PVDF, (b) PVDF/PA6, and (c) PA6 material as a function of frequency from 1 Hz to 100 kHz.
Table 1.
Evaluation of measured data sets of nanoFiber diameters.
Table 1.
Evaluation of measured data sets of nanoFiber diameters.
| Material | Minimum [nm] | Maximum [nm] | Mean [nm] |
|---|
| PVDF | 131 | 816 | 350 |
| PVDF/PA6 | 40 | 485 | 176 |
| PA6 | 19 | 123 | 62 |
Table 2.
Reference values of carbon binding energies [
20].
Table 2.
Reference values of carbon binding energies [
20].
| Element | Chemical Bond | Binding Energy [eV] |
|---|
| Carbon [C] | | 284.8 |
| |
| |
| |
| |
| Nitrogen [N] | | |
| Oxygen [O] | | 531.5–532 |
| |
| Fluorine [F] | Organic fluorine | 688–689 |
Table 3.
Identification of bonds of crystalline phases of PVDF.
Table 3.
Identification of bonds of crystalline phases of PVDF.
| Molecular Structure | Raman Shift [] |
|---|
| -phase | 807, 884, 1435 |
| -phase | 842, 884, 1078, 1280, 1435 |
| -phase | 842, 884, 1435 |
Table 4.
Identified and presumed chemical bonds in PA6 material.
Table 4.
Identified and presumed chemical bonds in PA6 material.
| Raman Shift [] | Bond Formations |
|---|
| 926 | stretching |
| 1062 | stretching |
| 1083 | stretching |
| 1127 | stretching |
| 1285 | stretching, bending (Amid III) |
| 1305 | rotation |
| 1444 | bending |
| 1467 | stretching, bending (Amid II) |
| 1640 | stretching |
Table 5.
Characteristic peaks of , , -phases for PVDF.
Table 5.
Characteristic peaks of , , -phases for PVDF.
| Phase | Wavenumber [] |
|---|
| 410, 489, 532, 614, 763, 795, 854, 975, 1149, 1209, 1383, 1423 |
| 445, 473, 510, 841, 1275, 1432 |
| 431, 482, 811, 1234, 1429 |
Table 6.
Dielectric properties of materials at 1 and 100 kHz.
Table 6.
Dielectric properties of materials at 1 and 100 kHz.
| Material | f [kHz] | C [pF] | [–] | [–] | [–] |
|---|
| PVDF | 100 | 12.7 | 0.00949 | 2.8259 | 0.020572 |
| 1 | 12.9 | 0.00281 | 2.8604 | 0.008770 |
| PVDF/PA6 | 100 | 7.74 | 0.01125 | 1.7125 | 0.016724 |
| 1 | 8.01 | 0.00922 | 1.7669 | 0.014196 |
| PA6 | 100 | 1.21 | 0.01184 | 1.4037 | 0.013556 |
| 1 | 1.22 | 0.00367 | 1.4114 | 0.005190 |
Table 7.
Set parameters for spinning production of PVDF, PVDF/PA6, and PA6 on the 4SPIn device.
Table 7.
Set parameters for spinning production of PVDF, PVDF/PA6, and PA6 on the 4SPIn device.
| Parameter | Value | Unit |
|---|
| Emitter type | one needle (two needles for PVDF/PA6) | – |
| Needle size | 1.4 (G17) | mm |
| Syringe volume | 10 | mL |
| Precursor dosing | 15 | μL/ |
| Collector type | rotating drum | – |
| Collector speed | 2000 | |
| Distance (emitter-collector) | 15 | cm |
| High voltage | 50 | kV |
| Humidity (in the chamber) | 20–26 | % |
| Temperature (in the chamber) | 22–25 | |
| Air flow rate | – | L/ |
| Heater | – | |
| Process time | 90 | |


 ,
, 


